nontargeting_28_1

Gene symbol: nontargeting_28_1
Gene: -1
Uniprot Function:
Mitotic Index 0.0244
Interphase Cluster: #219 (7 genes)
Mitotic Cluster: #55 (29 genes)
sgRNA 1: AAGGCAATTTACTGGATCCT (interphase cells: 7147, mitotic cells: 179)
sgRNA 2: (interphase cells: , mitotic cells: )
sgRNA 3: (interphase cells: , mitotic cells: )
sgRNA 4: (interphase cells: , mitotic cells: )

Interphase Cluster

Mitotic Cluster

Overview

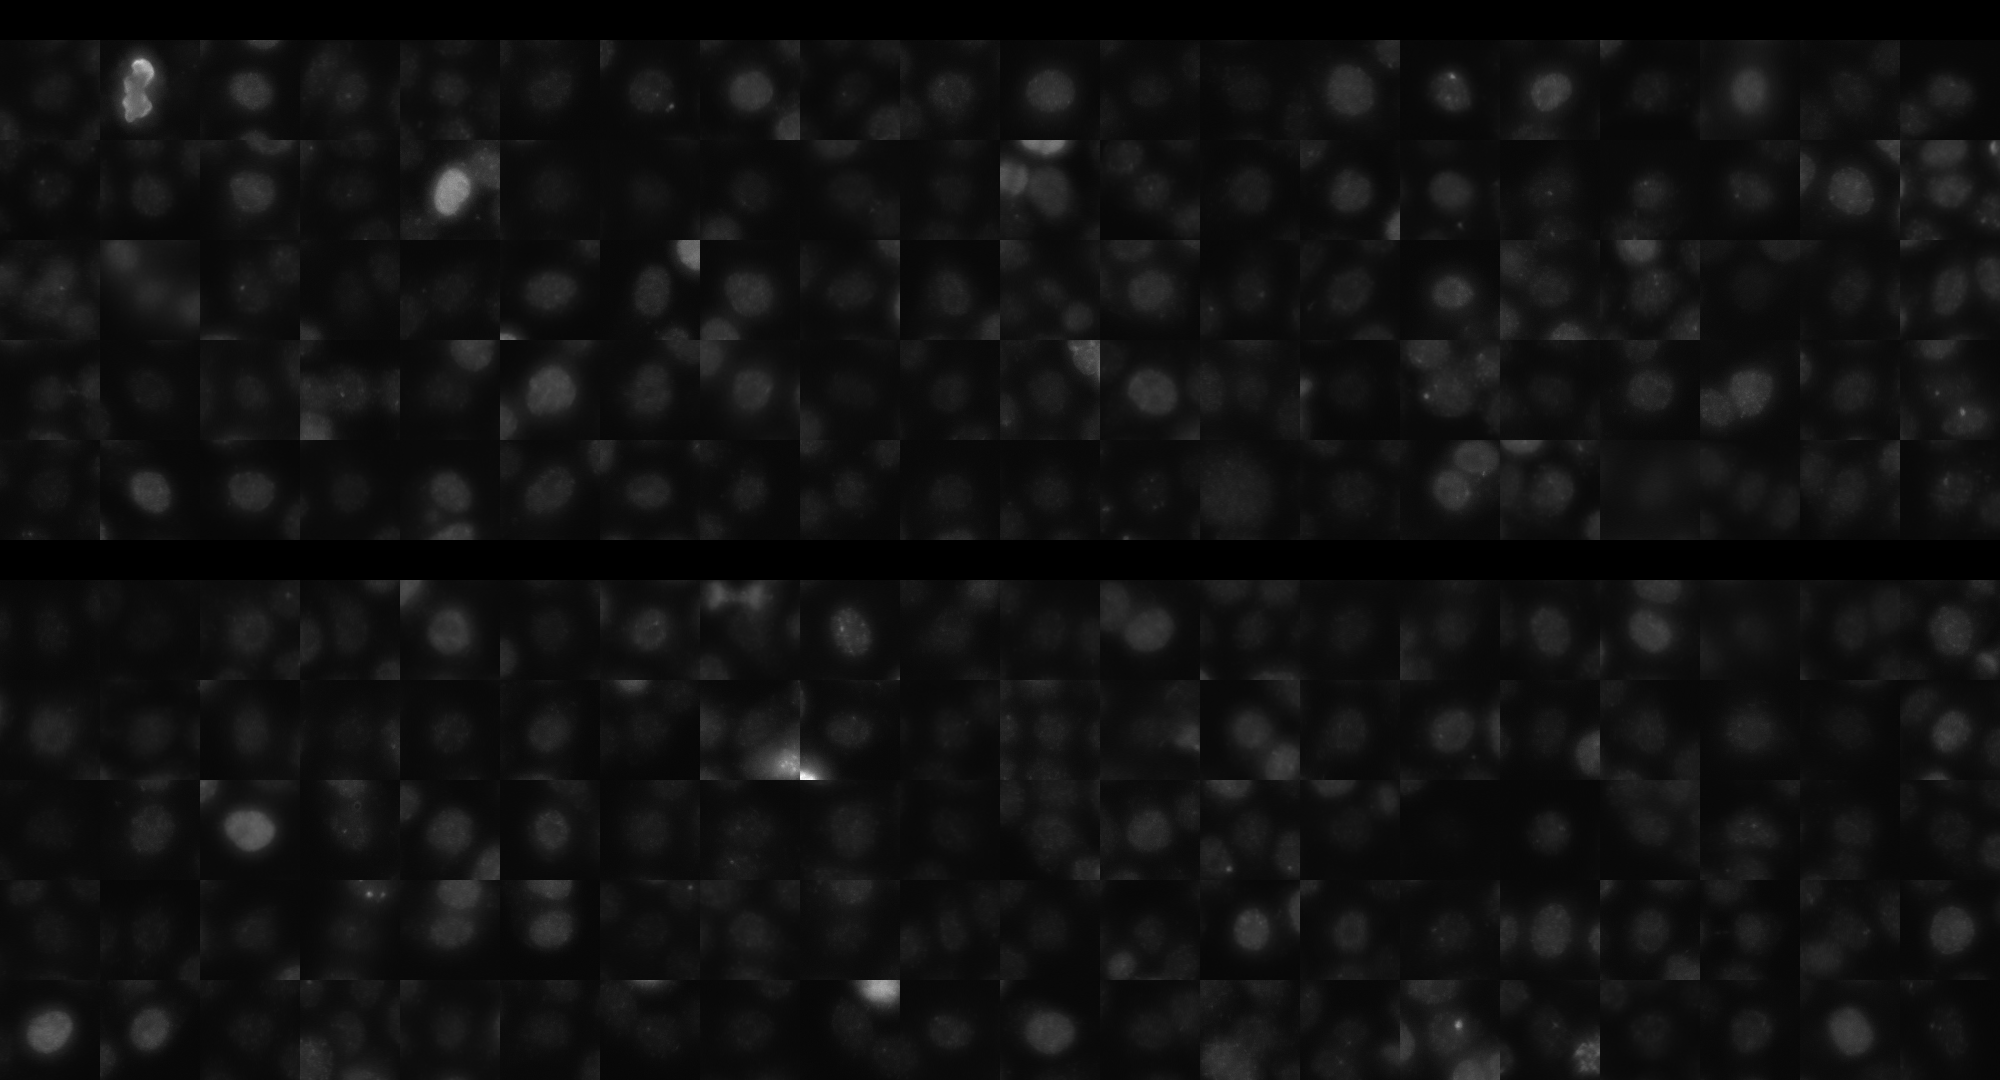
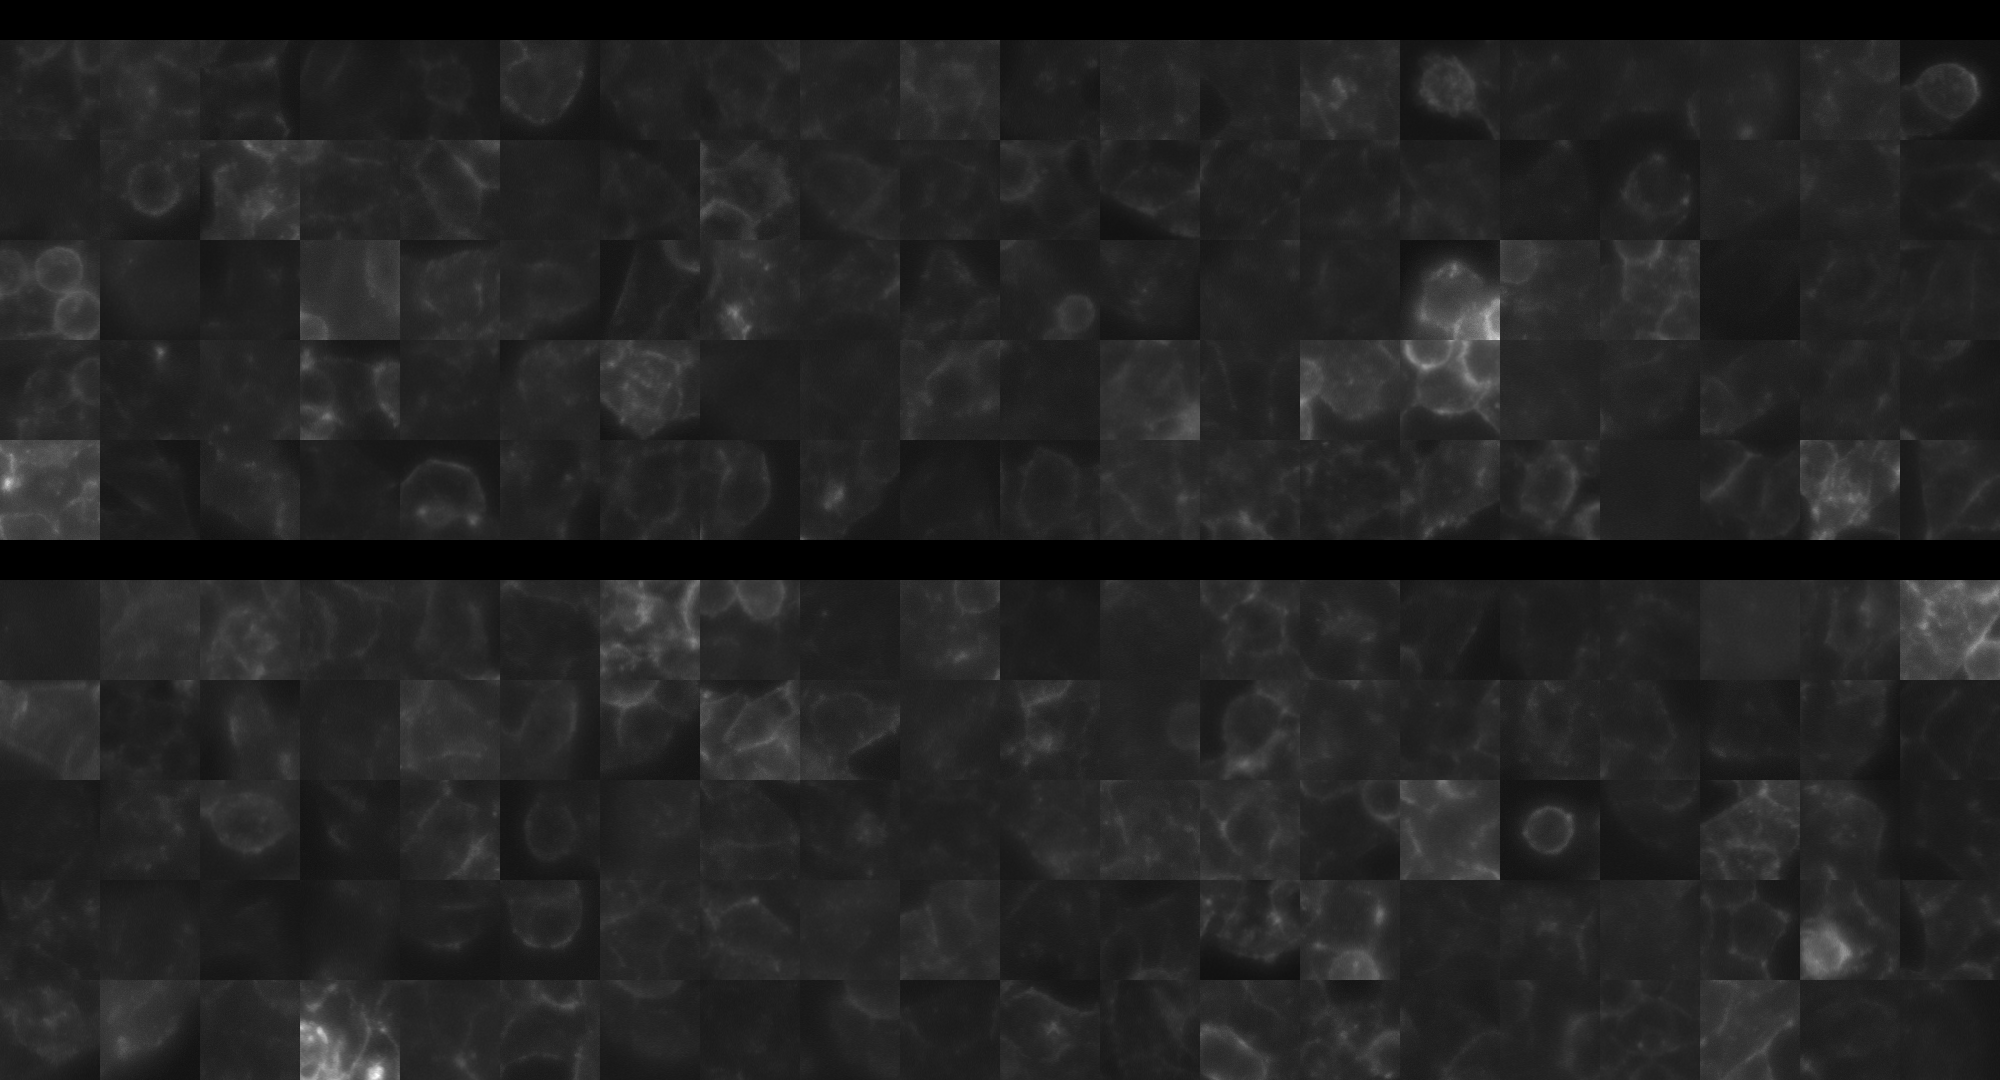
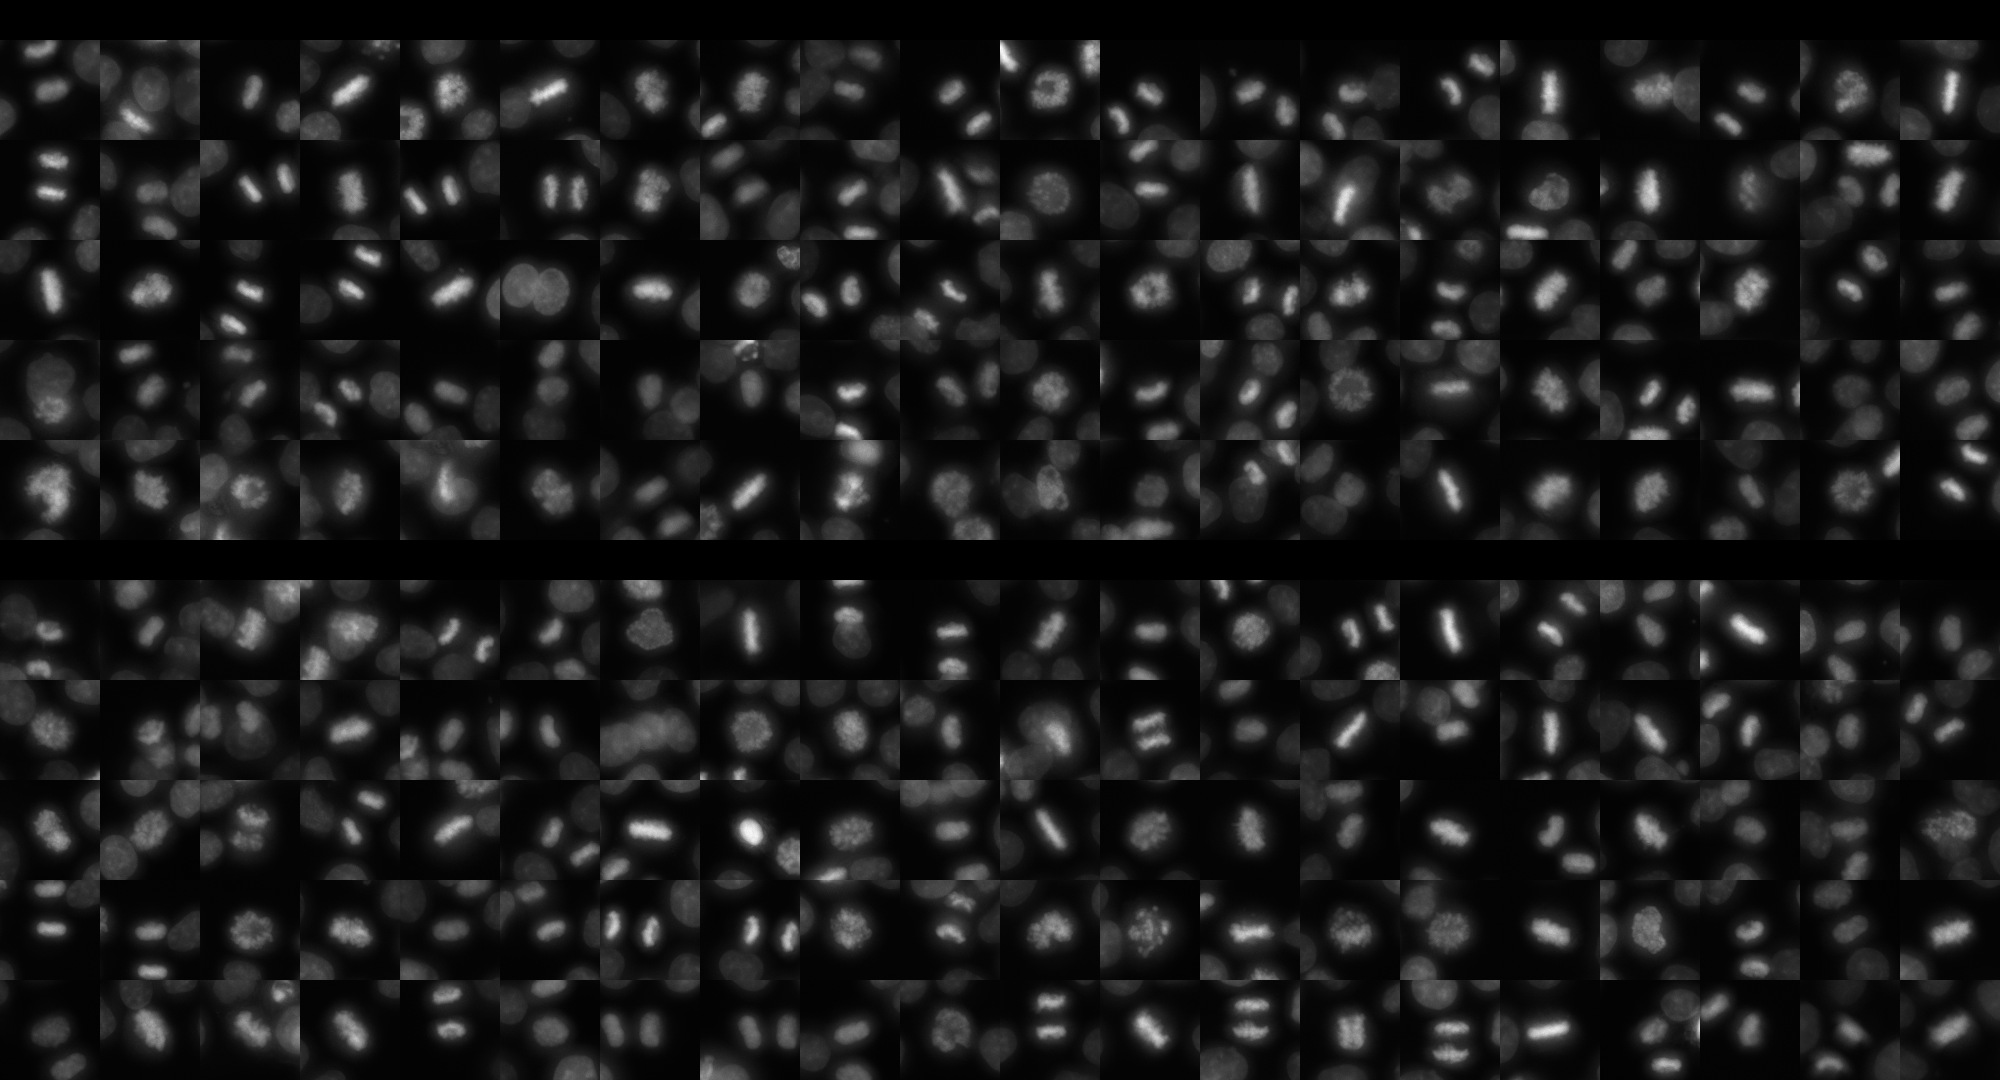
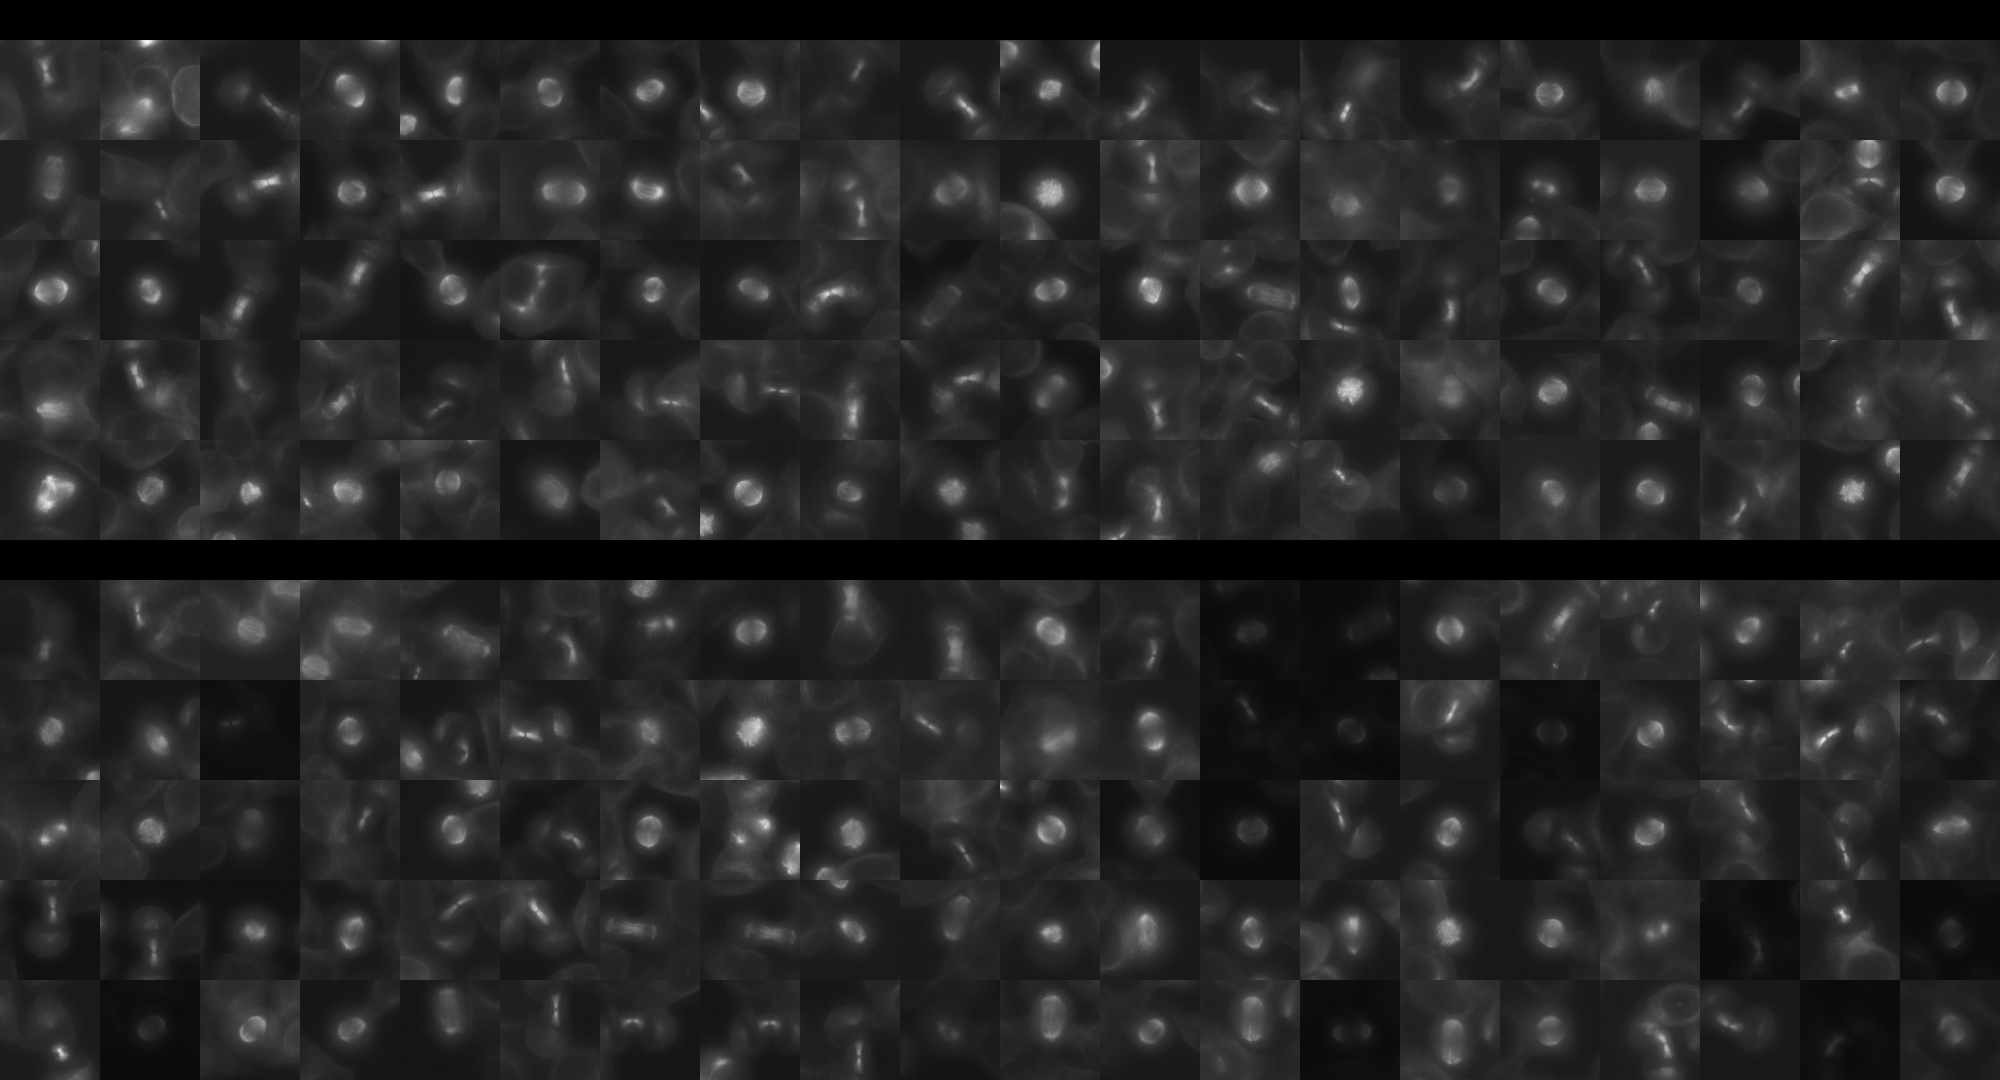
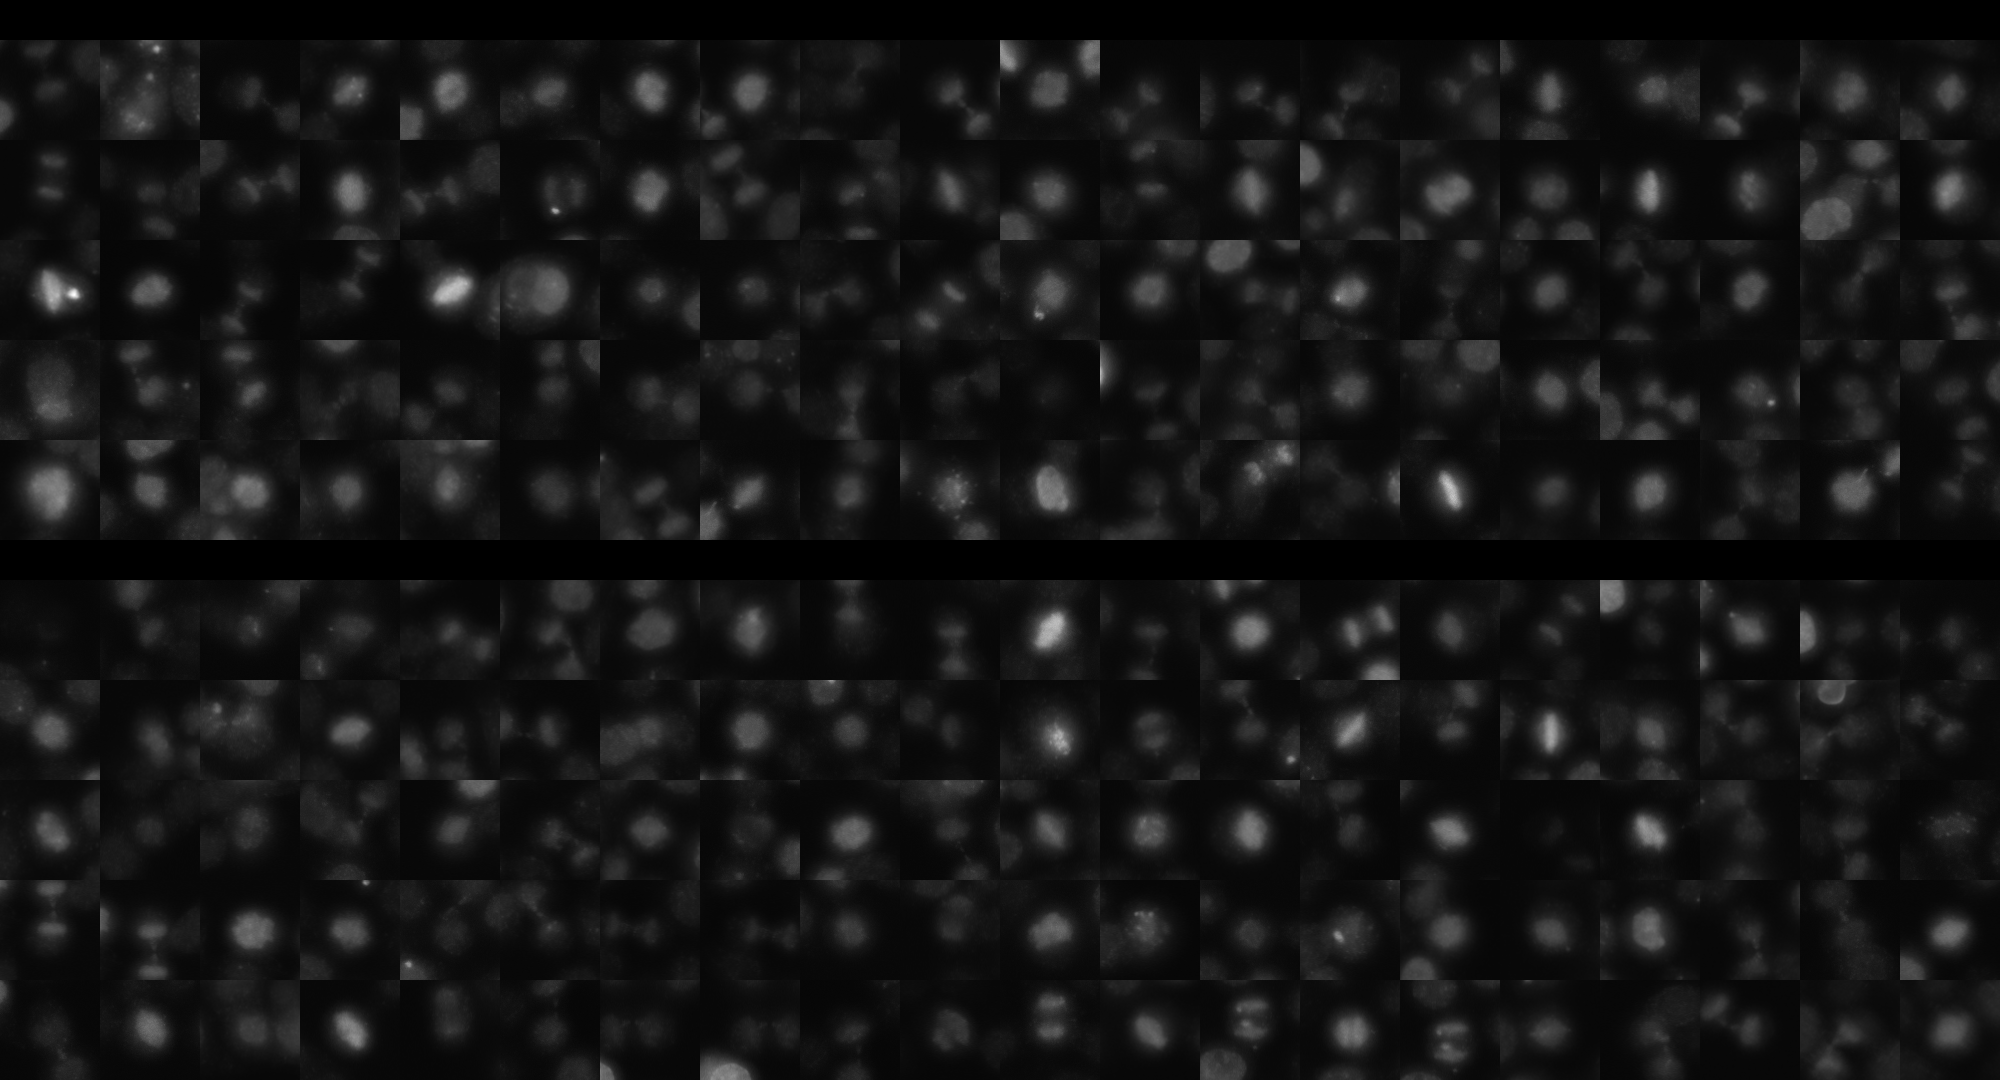
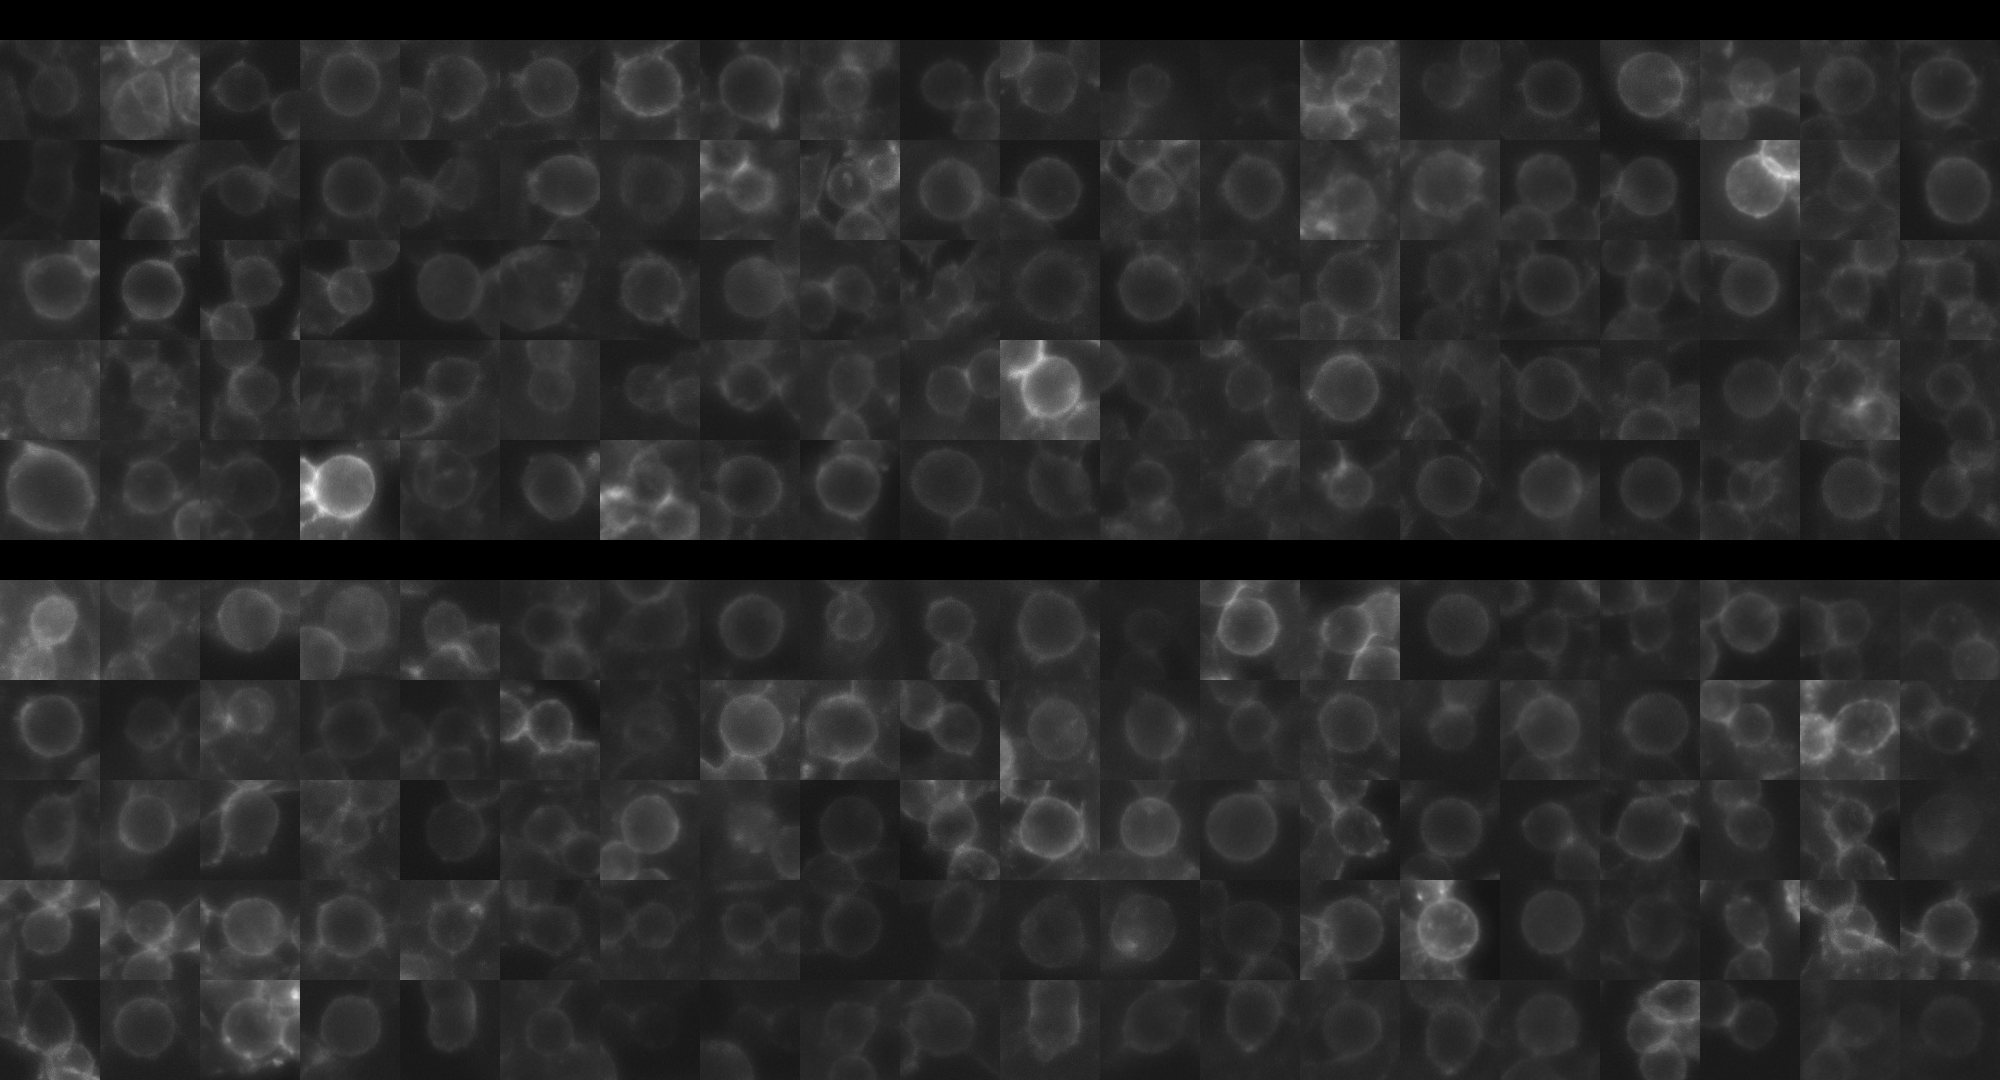
Each montage below shows randomly selected individual cell images for the same target gene separated by sgRNA, along with an example montage of cells expressing a non-targeting negative control sgRNA at the bottom. sgRNA labels in the montages correspond to the numbered sgRNA sequences in the gene info table above. The DNA (blue) and tubulin (green) channels are displayed by default, with gH2AX (grayscale) and actin (yellow) available using the check boxes. Channel brightness, contrast, and opacity are adjustable by clicking the arrow next to the channel name. When only one channel is selected, the display defaults to grayscale. Click the “Zoom” checkbox above the channel controls to enable image zooming (via scrolling) and panning (via click-and-drag).

The cell boxes displayed for this gene are square, 30.36 μm per side for the interphase montage and 30.36 μm per side for the mitotic montage.
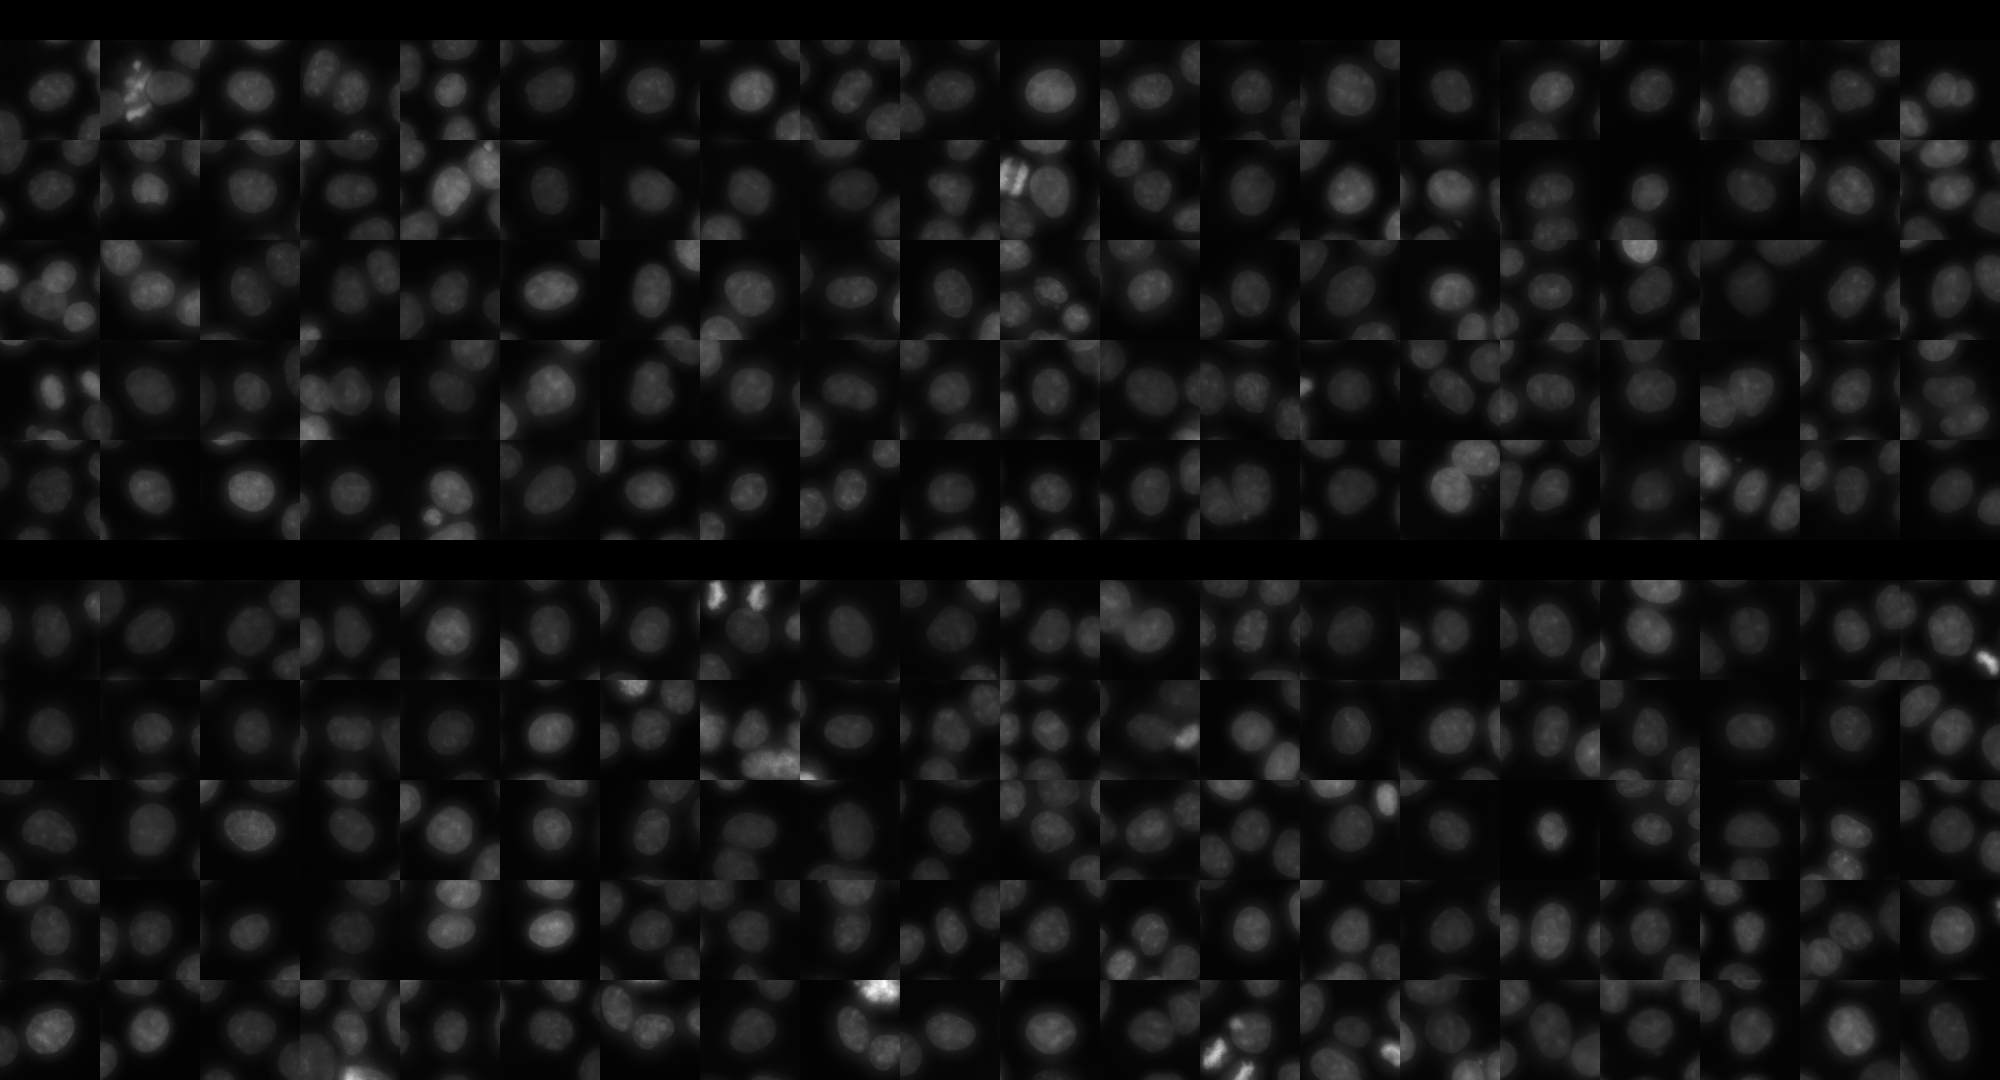
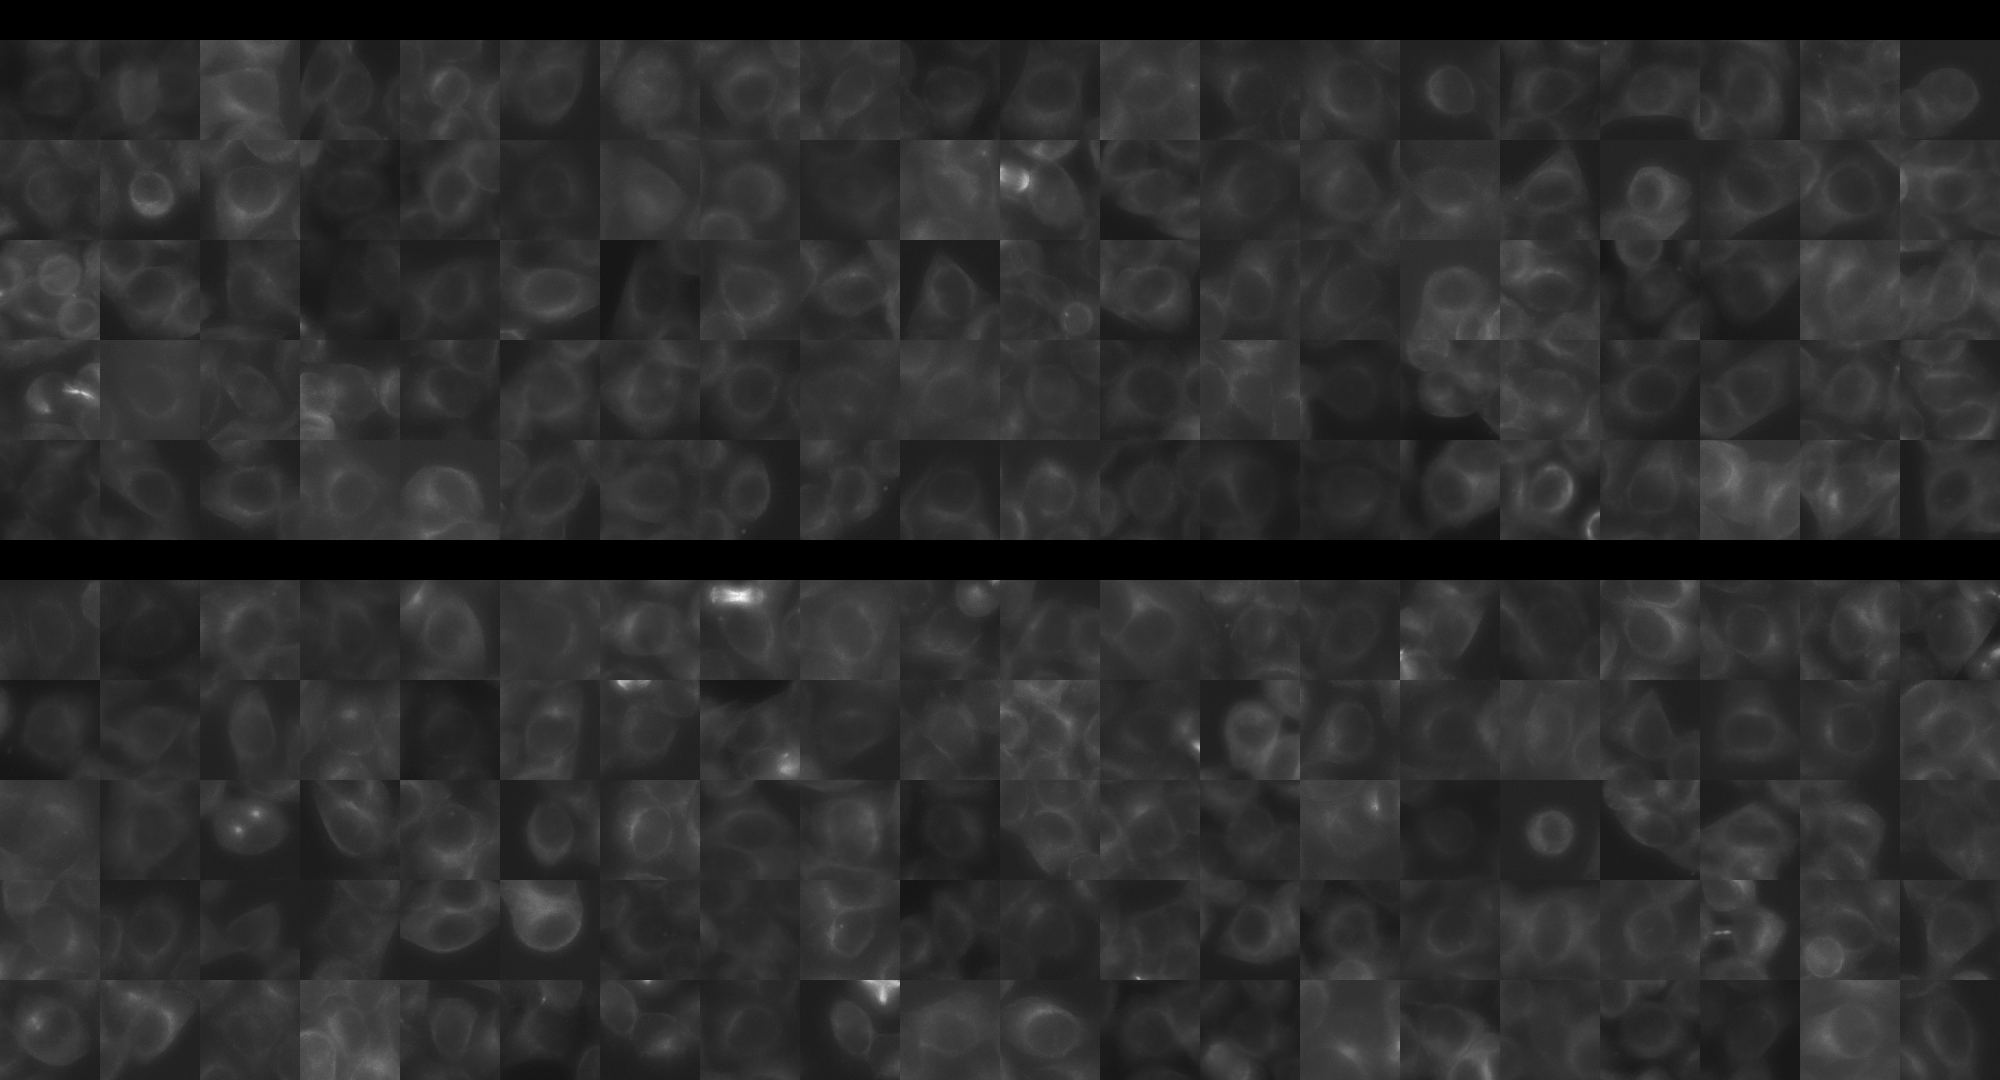
Features

Interphase Score Rank FDR q-value
Nucleus DNA Integrated 0.029 1748 of 5322 0.819
Nucleus DNA Mean -2.431e-02 2790 of 5322 0.765
Nucleus gH2AX Mean 0.088 2277 of 5322 0.170
Nucleus DNA - gH2AX Correlation -5.908e-02 2749 of 5322 0.162
Nucleus Shape Area 0.037 2049 of 5322 0.755
Nucleus Shape Eccentricity 0.018 2307 of 5322 0.779
Nucleus Shape Form Factor 0.003 571 of 5322 0.908
Nucleus Shape Solidity 1.067e-04 632 of 5322 0.998
Cell DNA Mass Displacement -2.140e-02 5085 of 5322 0.767
Cell Tubulin Mean 0.031 1605 of 5322 0.649
Cell Tubulin Mass Displacement 0.015 2111 of 5322 0.885
Cell Actin Mean 0.015 2524 of 5322 0.871
Cell Tubulin - Actin Correlation -2.939e-02 4731 of 5322 0.667
Cell DNA - Tubulin Correlation -4.723e-02 4931 of 5322 0.402
Cell Shape Area -6.295e-03 3427 of 5322 0.904
Cell Shape Eccentricity 0.012 2772 of 5322 0.936
Mitotic Score Rank FDR q-value
Nucleus DNA Integrated -1.291e-01 4951 of 5322 0.965
Nucleus DNA Mean -7.696e-02 4032 of 5322 1.000
Nucleus DNA Mass Displacement 0.111 1739 of 5322 0.999
Nucleus DNA Mean Frac 3 -5.377e-02 3897 of 5322 1.000
Nucleus gH2AX Mean 0.025 2591 of 5322 1.000
Nucleus gH2AX Mean Frac 0 0.033 1785 of 5322 1.000
Nucleus Tubulin Mean Frac 0 -5.485e-02 4223 of 5322 0.999
Nucleus Tubulin Mean Edge 0.008 3066 of 5322 0.999
Nucleus Tubulin Std Edge -1.298e-02 2745 of 5322 0.999
Nucleus Shape Area -2.208e-01 5200 of 5322 0.929
Nucleus Shape Eccentricity -2.409e-04 2121 of 5322 1.000
Nucleus Shape Form Factor 0.040 908 of 5322 0.998
Cell Tubulin Mean -8.377e-02 4442 of 5322 0.997
Cell Tubulin Mean Frac 3 0.141 475 of 5322 0.999
Cell Actin Mean -1.726e-01 4927 of 5322 0.997
Cell Shape Area -9.948e-02 4787 of 5322 0.998
( Reset Zoom )
Brightness
Contrast
Opacity
Brightness
Contrast
Opacity
Brightness
Contrast
Opacity
Brightness
Contrast
Opacity
Brightness
Contrast
Opacity

( Reset Zoom )
Brightness
Contrast
Opacity
Brightness
Contrast
Opacity
Brightness
Contrast
Opacity
Brightness
Contrast
Opacity
Brightness
Contrast
Opacity

MIT Central Accessability