WASHC3

Gene symbol: WASHC3
Gene: 51019
Uniprot Function: Acts as a component of the WASH core complex that functions as a nucleation-promoting factor (NPF) at the surface of endosomes, where it recruits and activates the Arp2/3 complex to induce actin polymerization, playing a key role in the fission of tubules that serve as transport intermediates during endosome sorting.
Mitotic Index 0.0279
Interphase Cluster: #219 (7 genes)
Mitotic Cluster: #102 (23 genes)
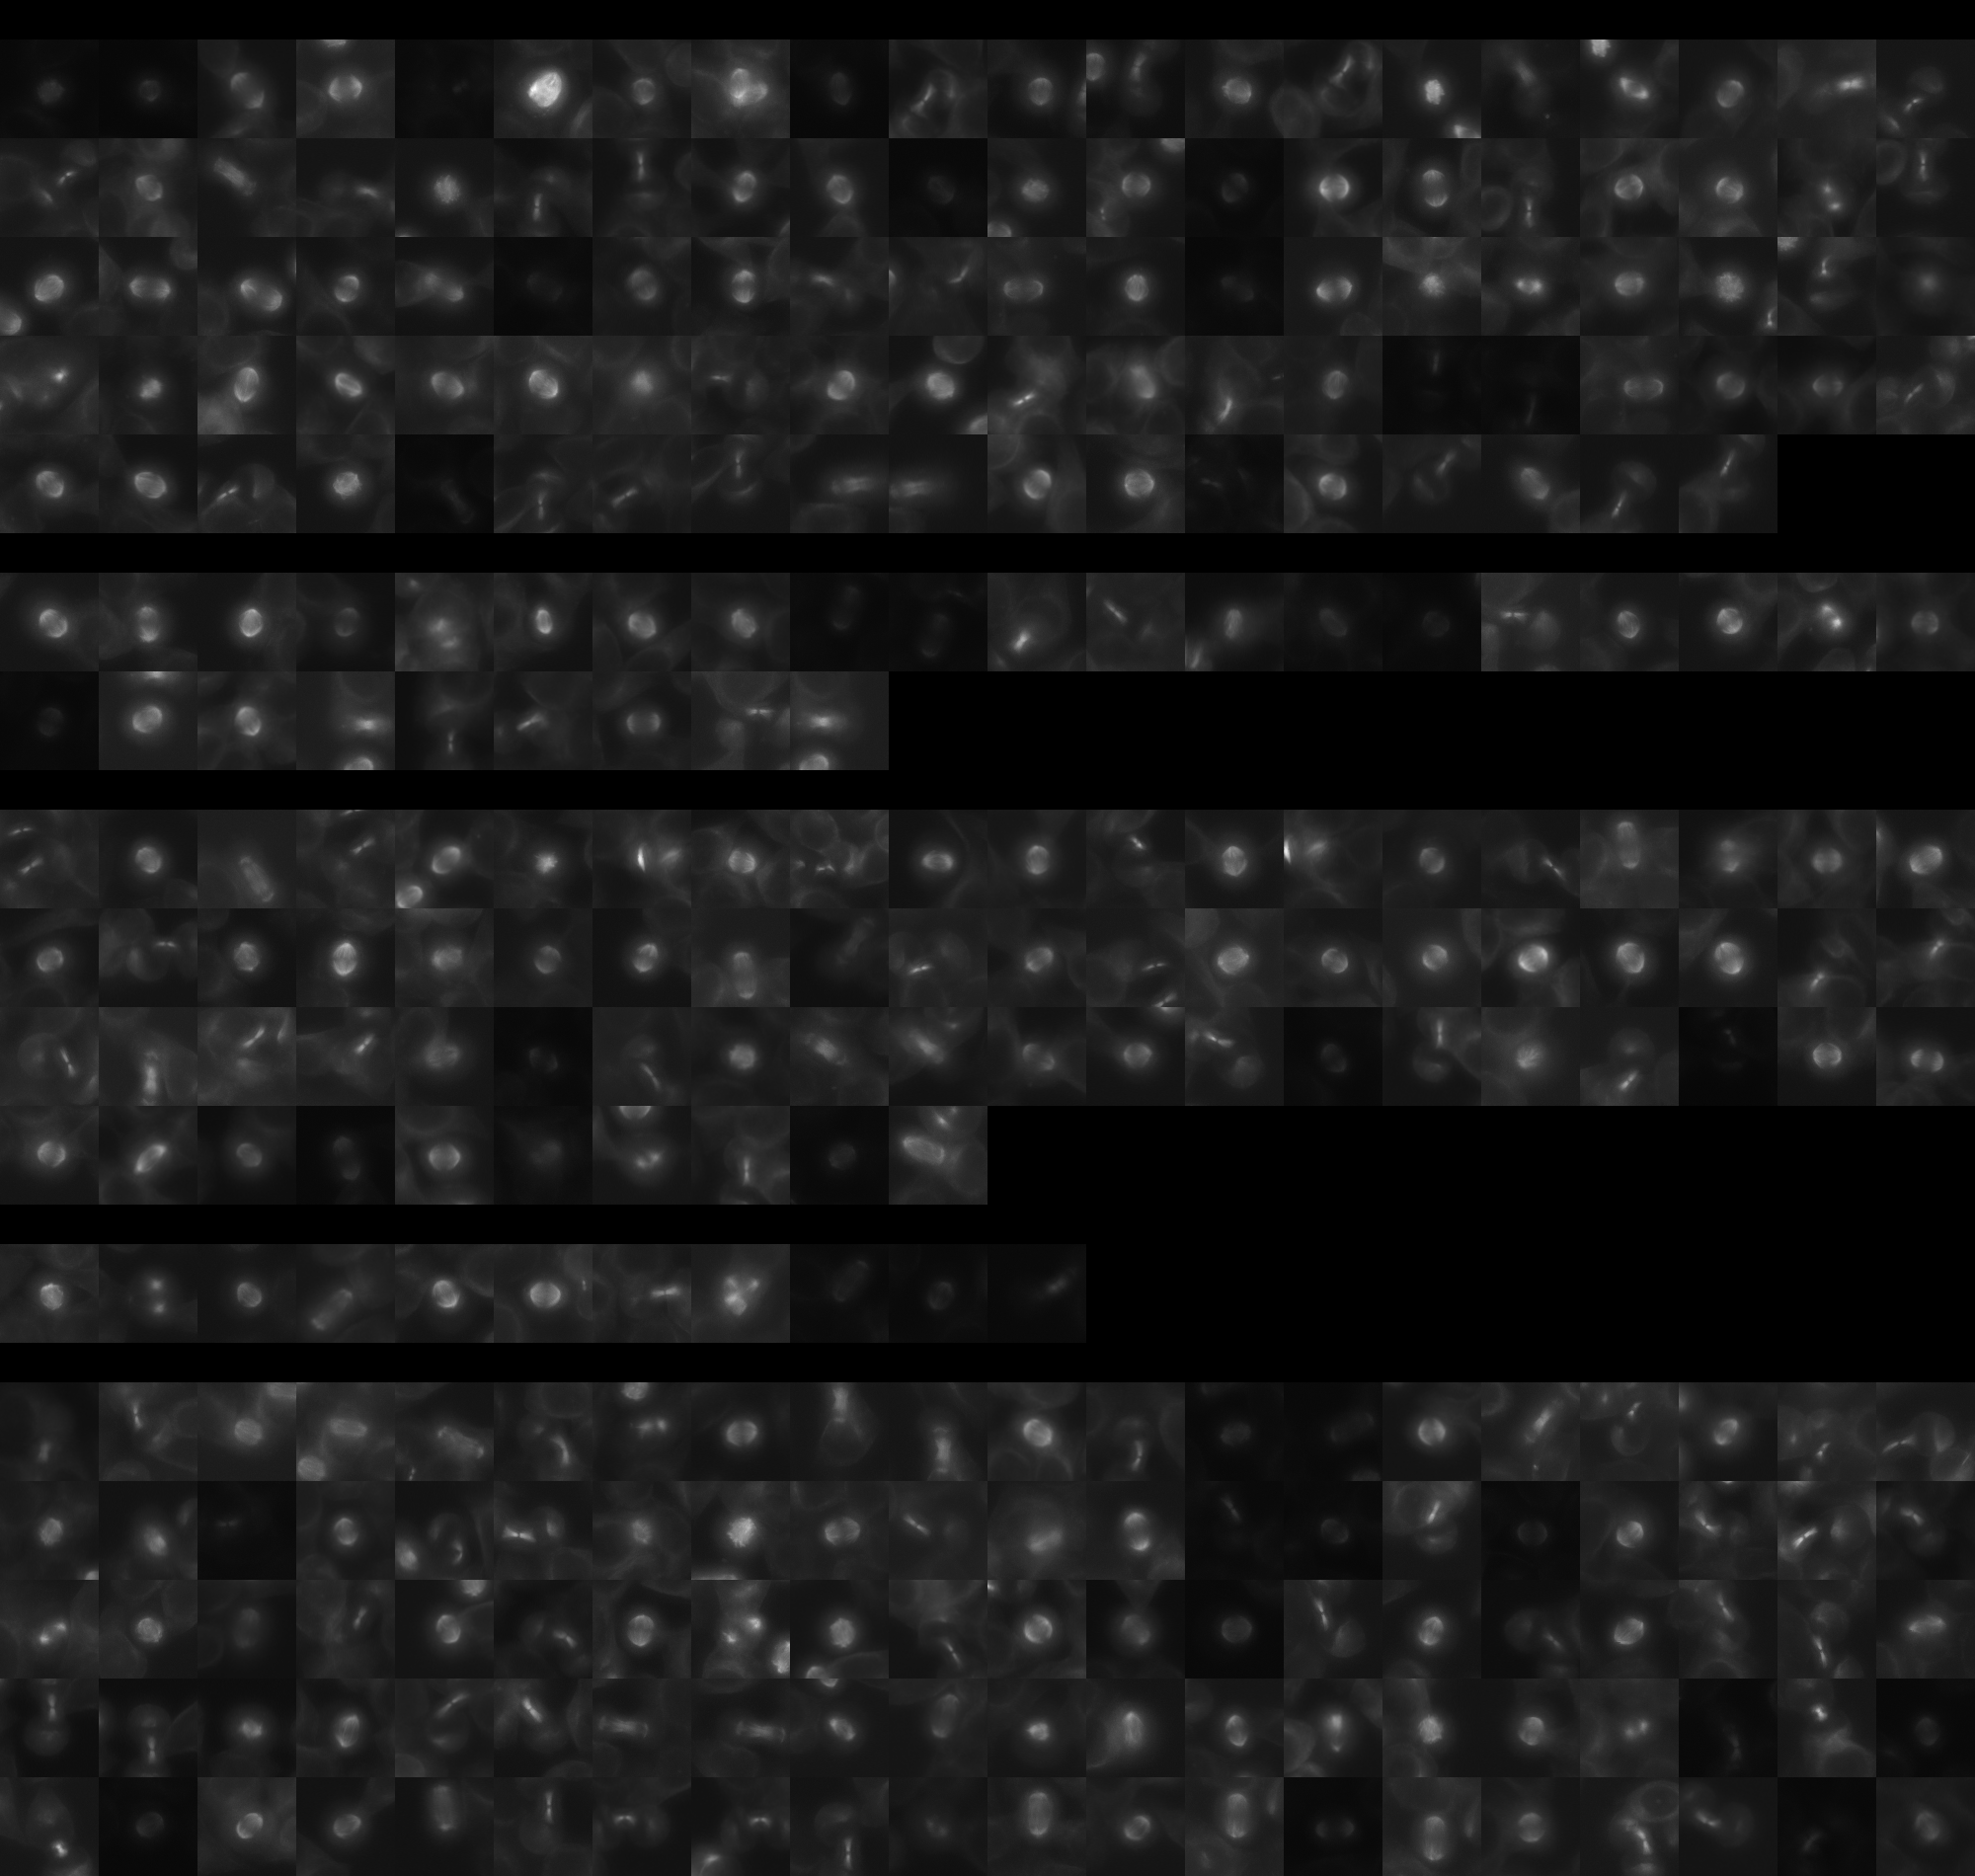
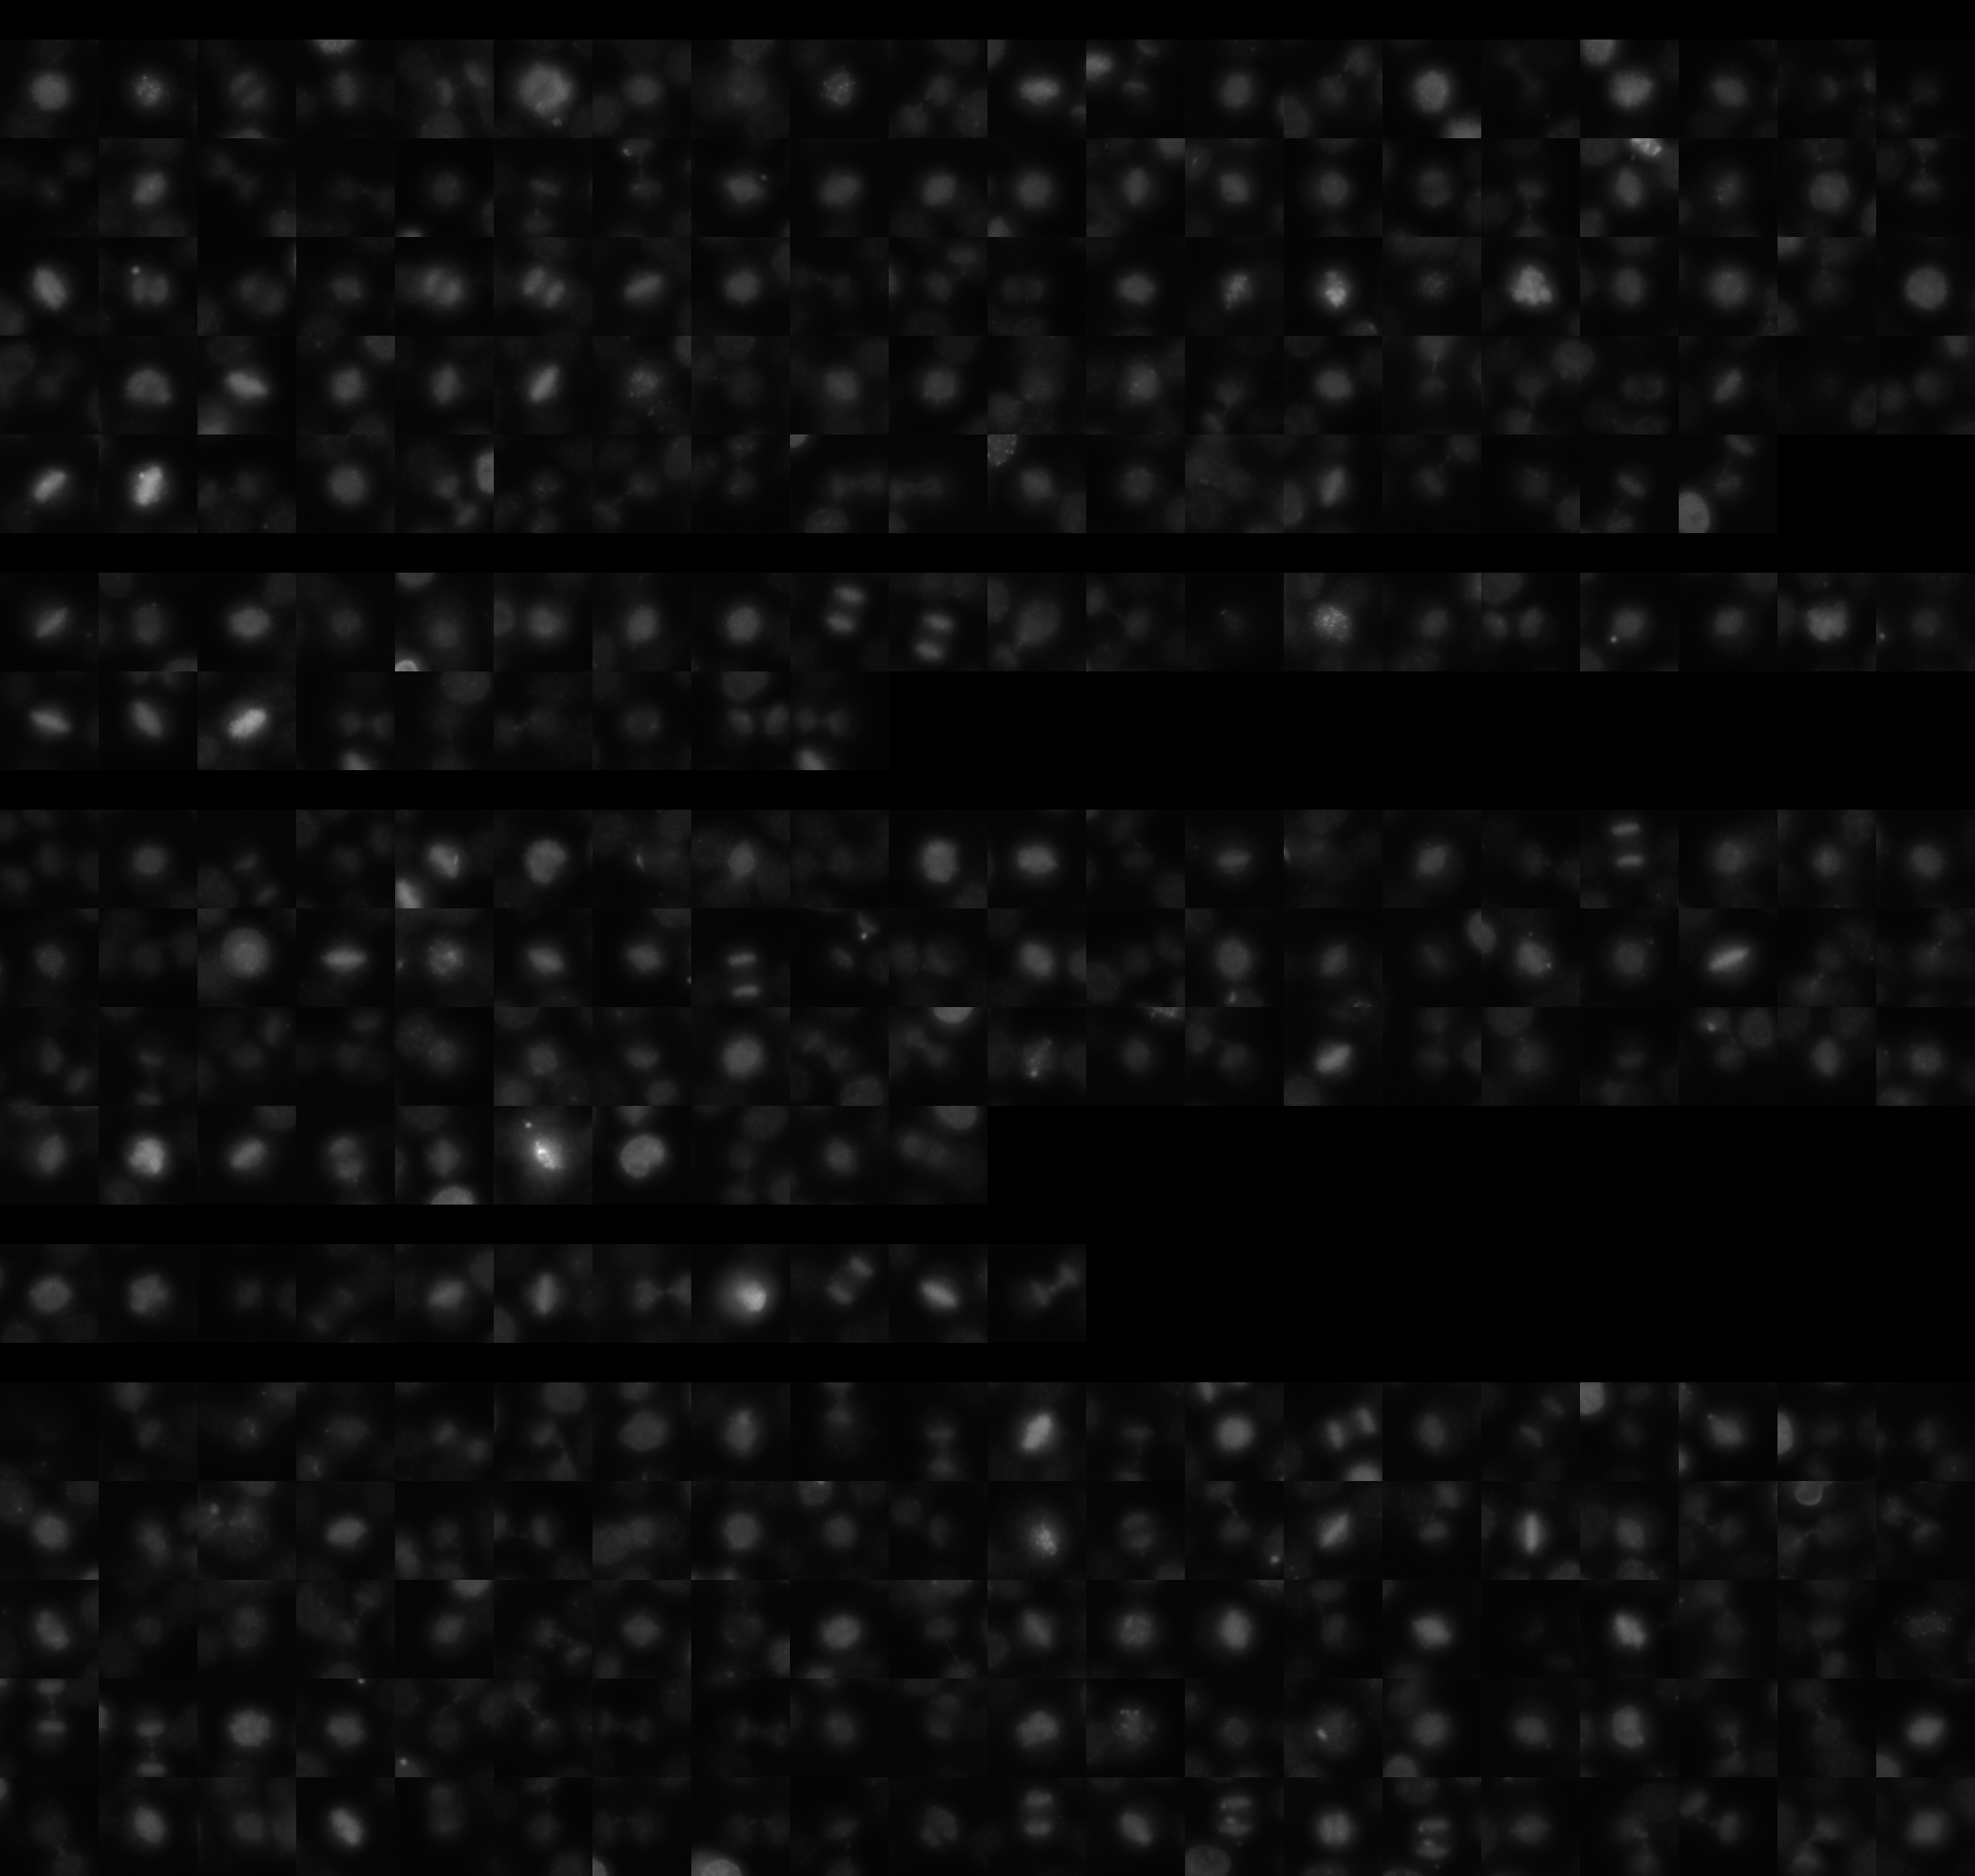
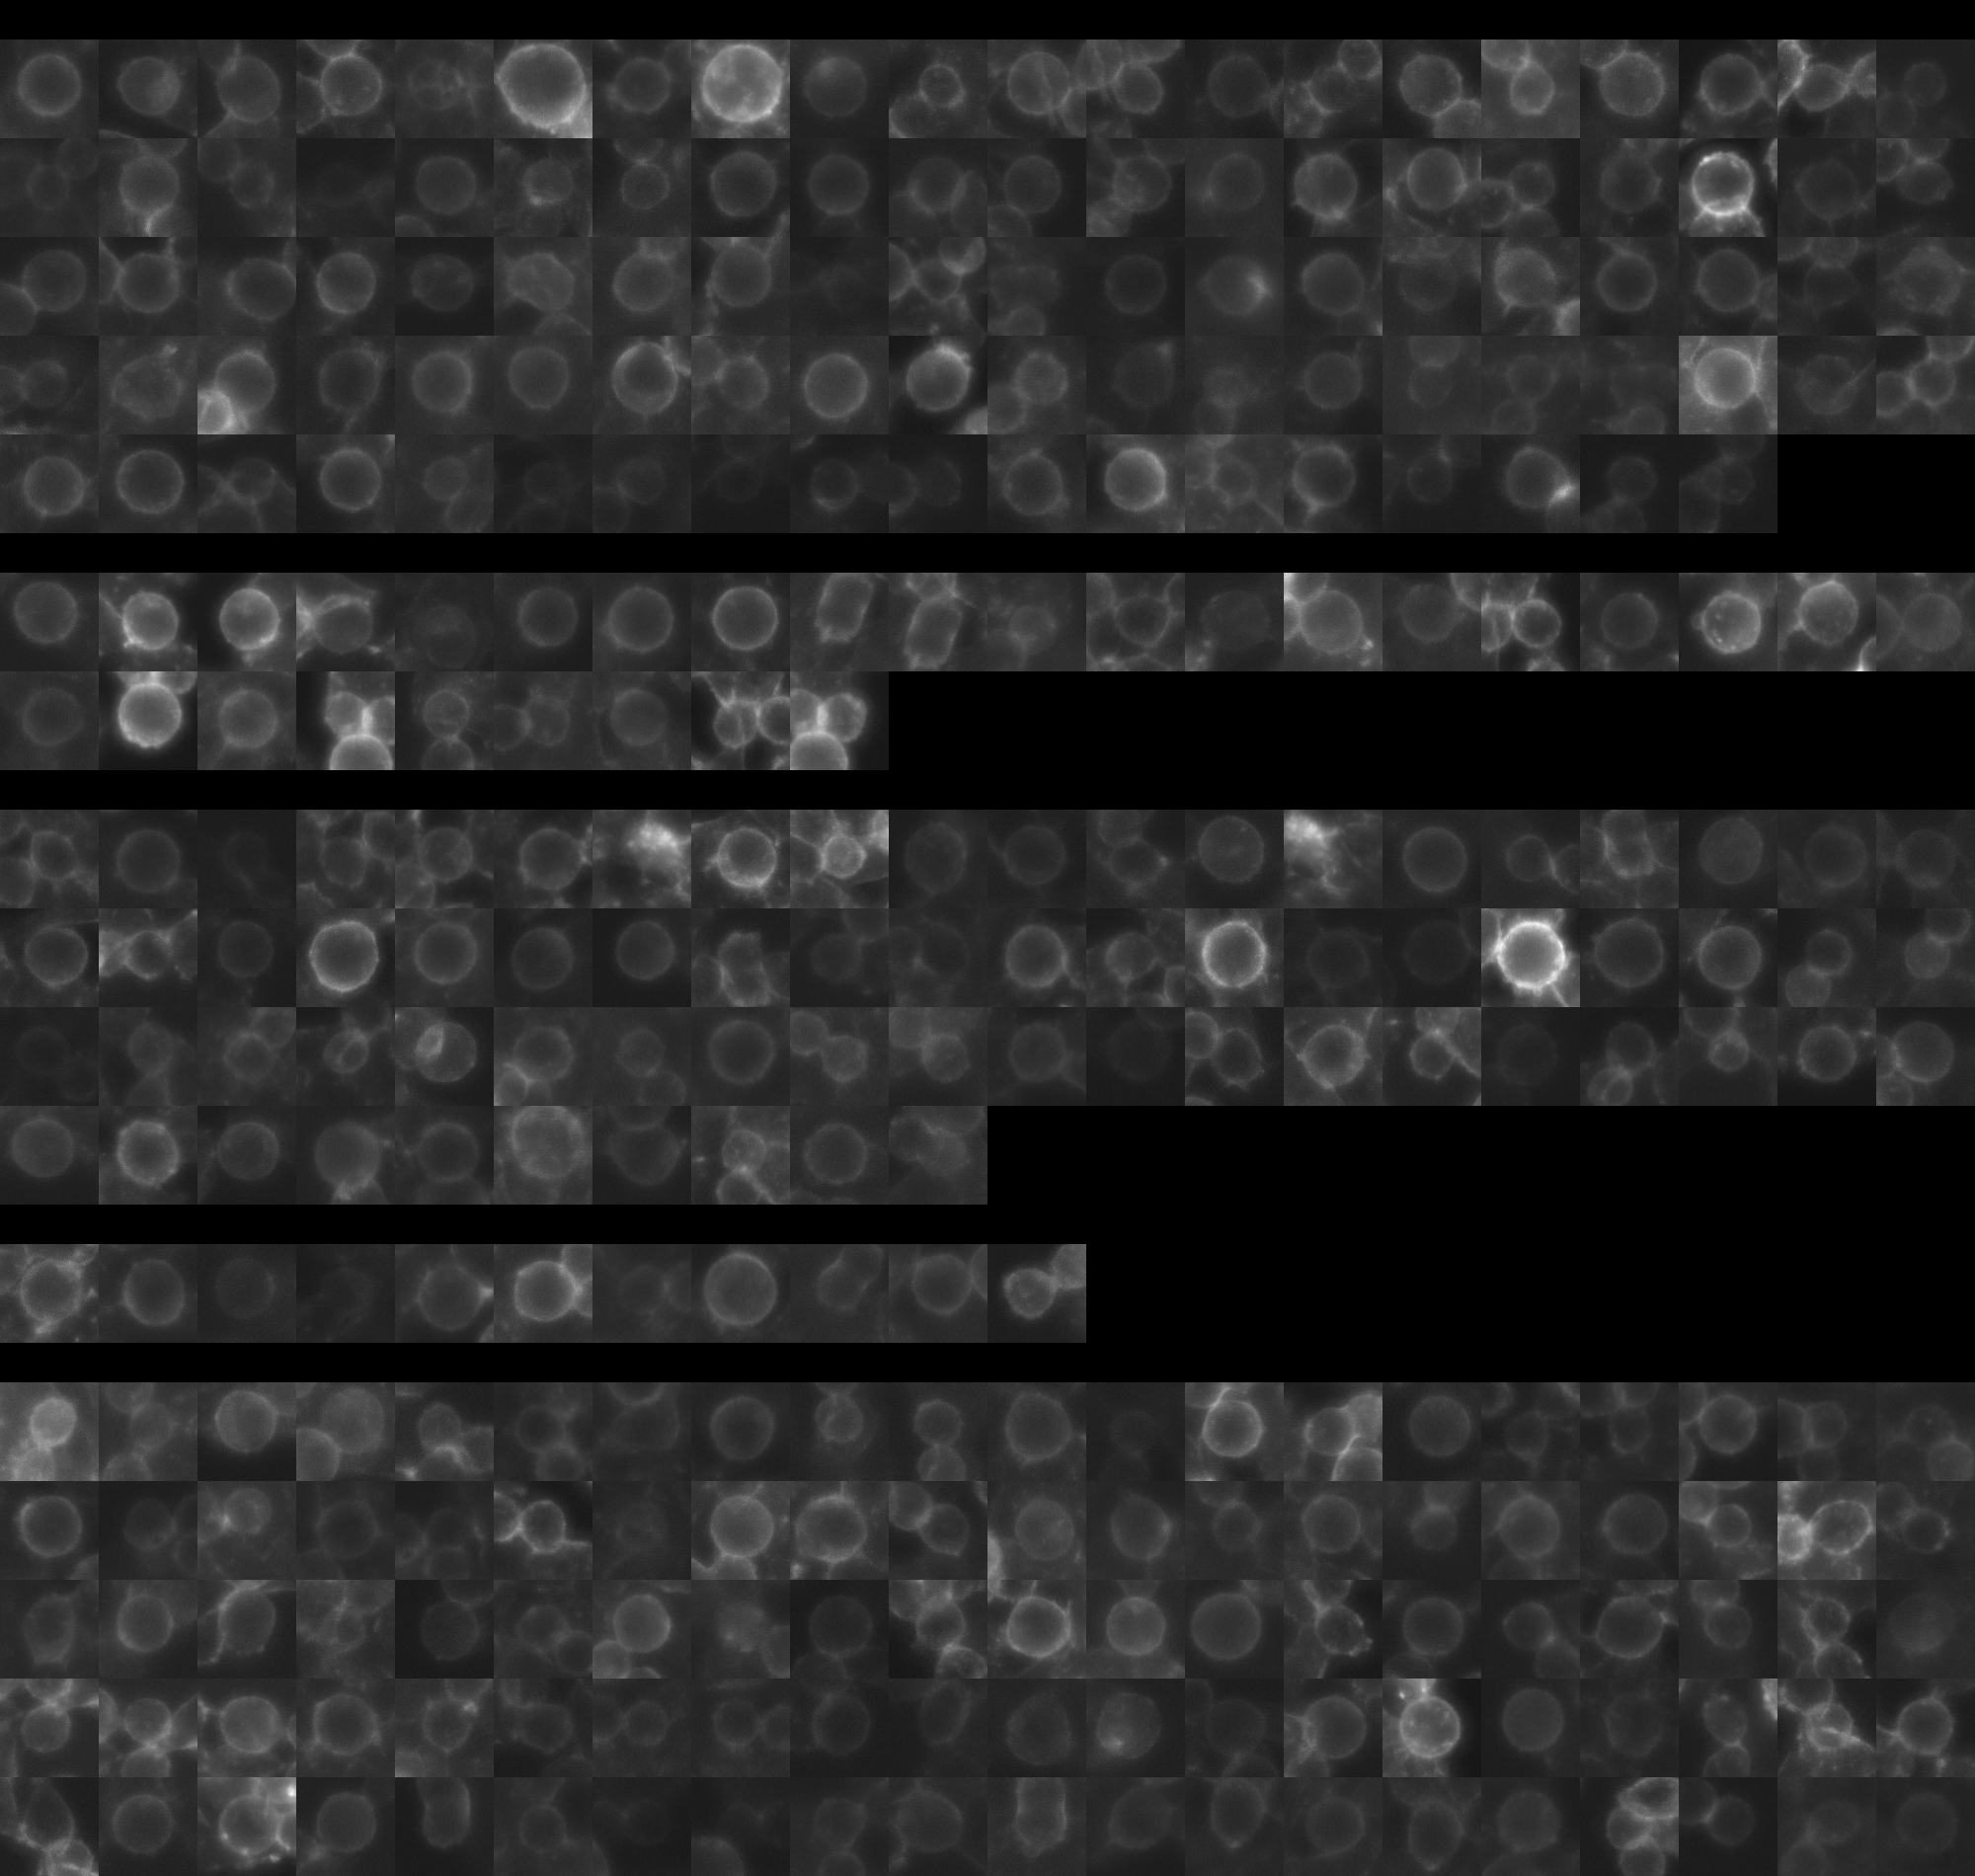
sgRNA 1: CCTCACAAACTGTAGAAAAG (interphase cells: 2859, mitotic cells: 98)
sgRNA 2: GTCAGGCATAGACCTGACCA (interphase cells: 655, mitotic cells: 29)
sgRNA 3: TCTTAGAACTCACTTACCTG (interphase cells: 3251, mitotic cells: 70)
sgRNA 4: TTTGTTGGATACGAAGTGAA (interphase cells: 470, mitotic cells: 11)

Interphase Cluster

Mitotic Cluster

Overview

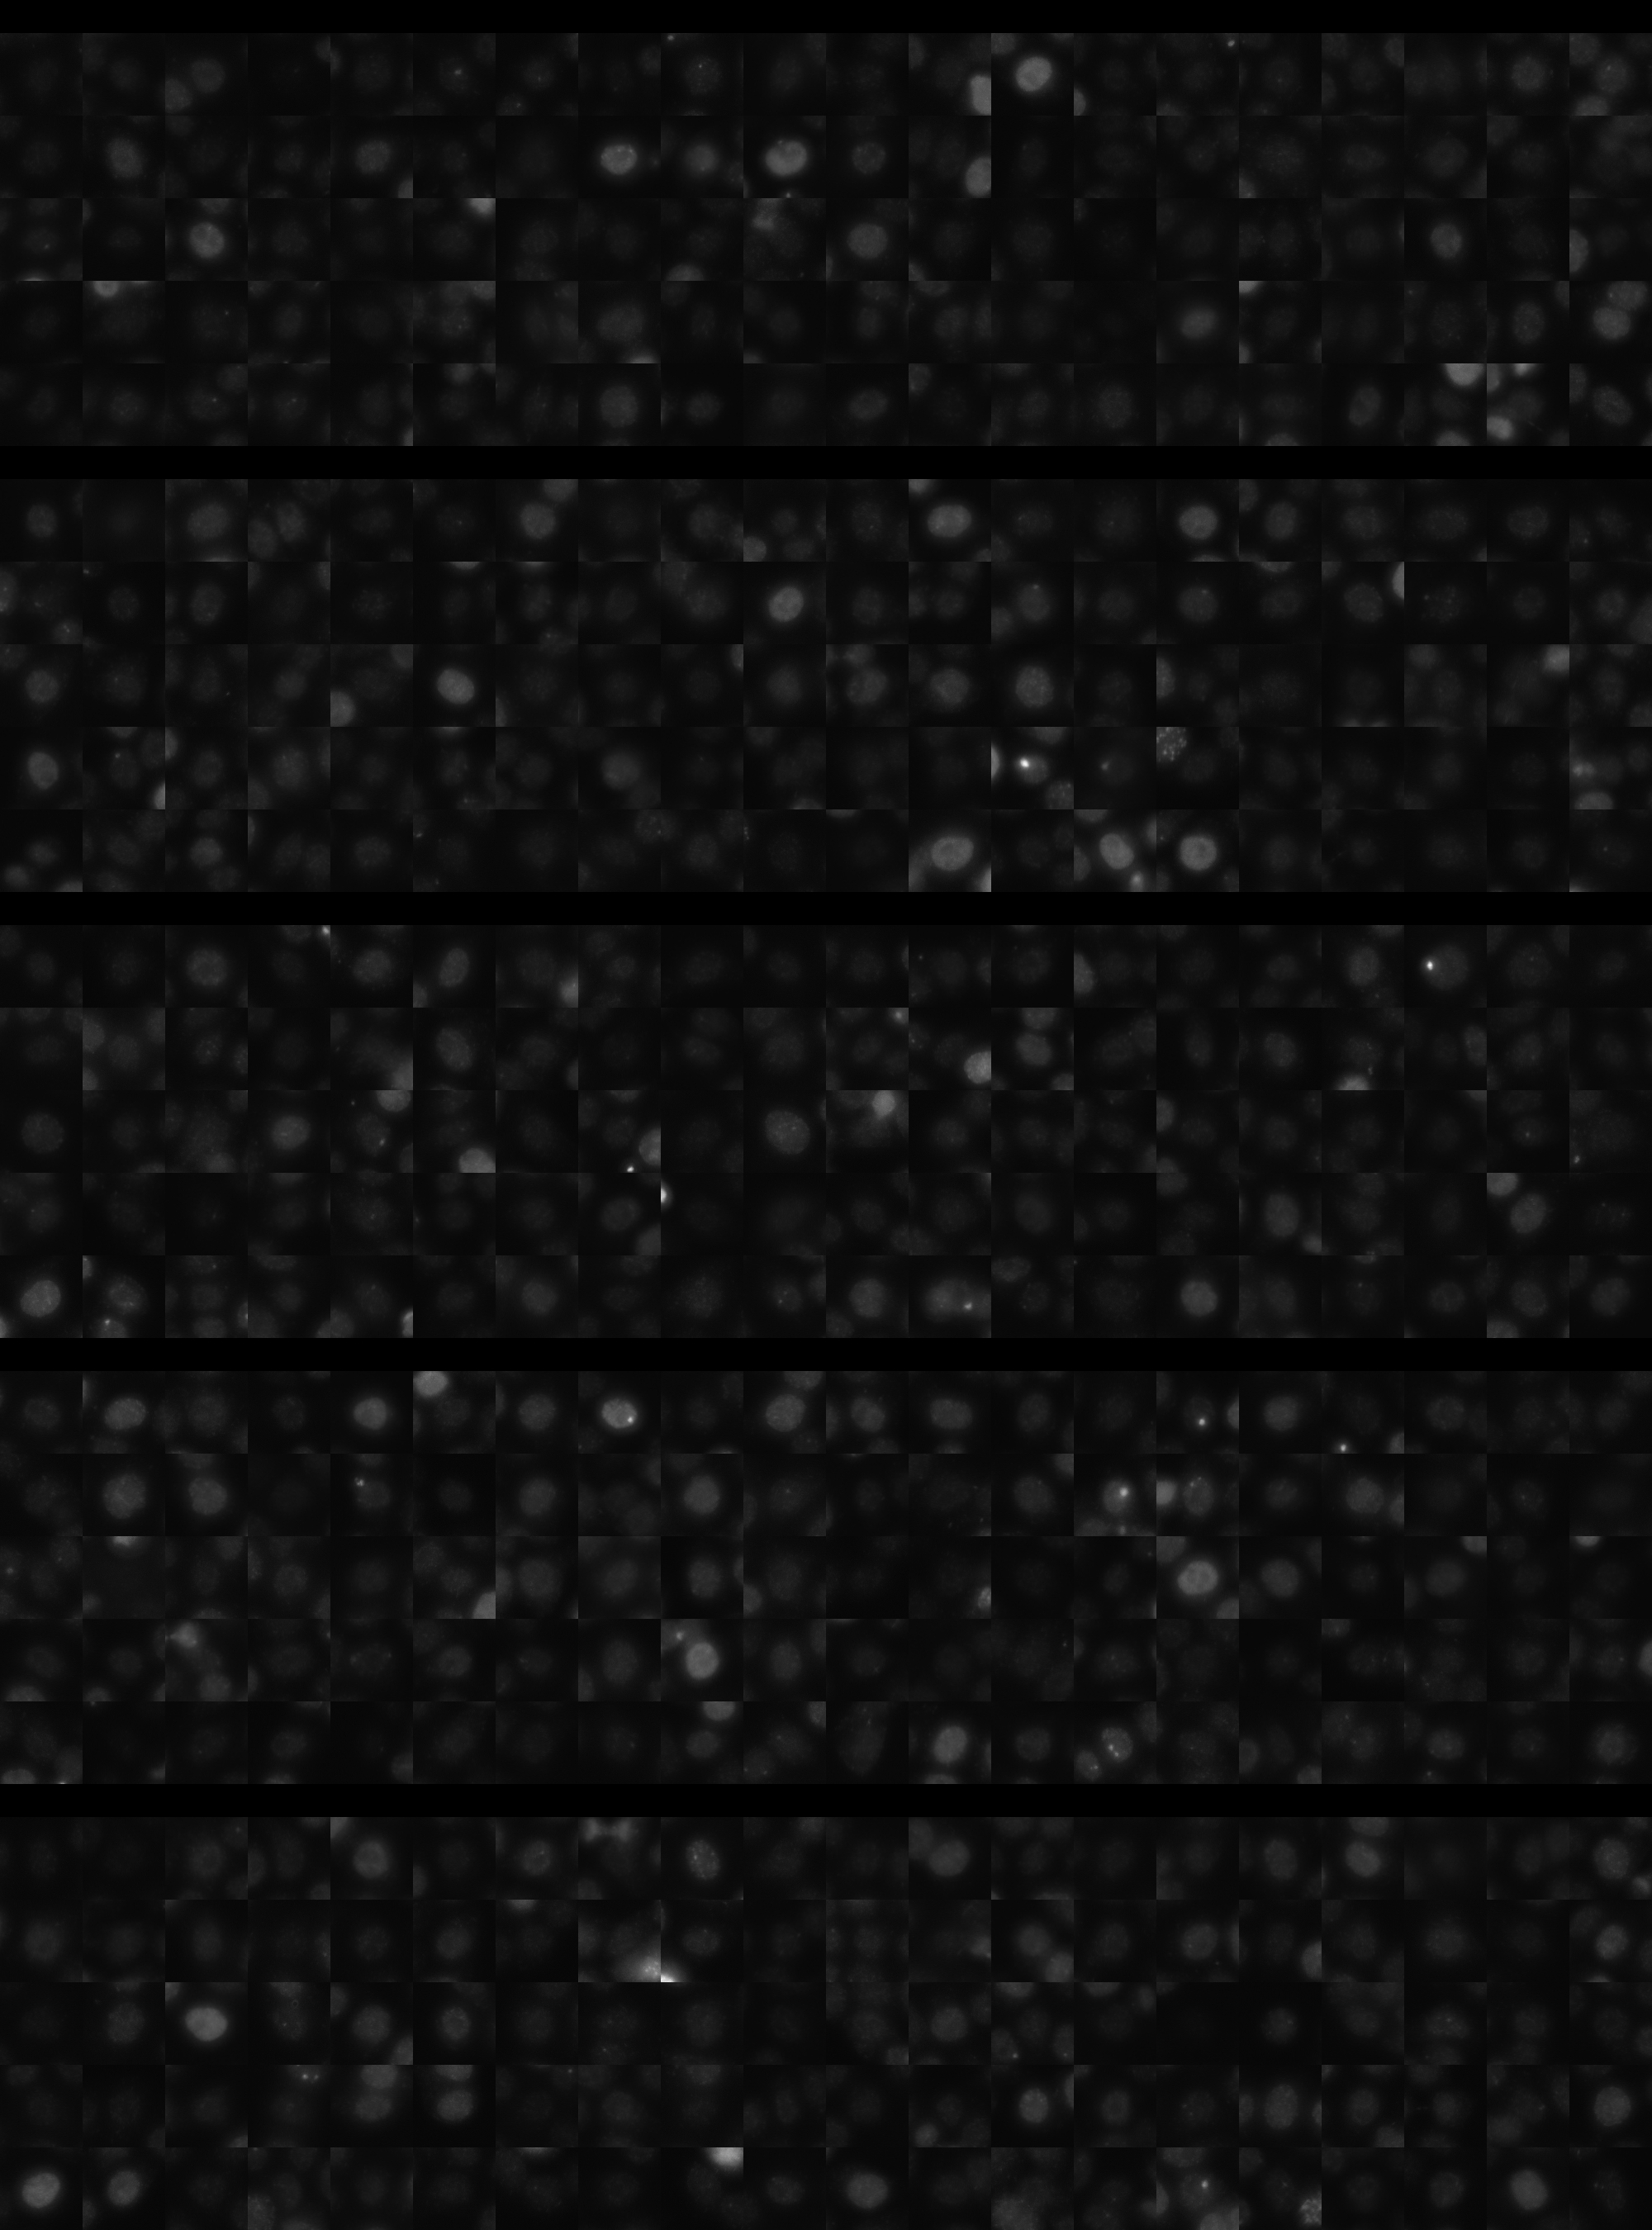
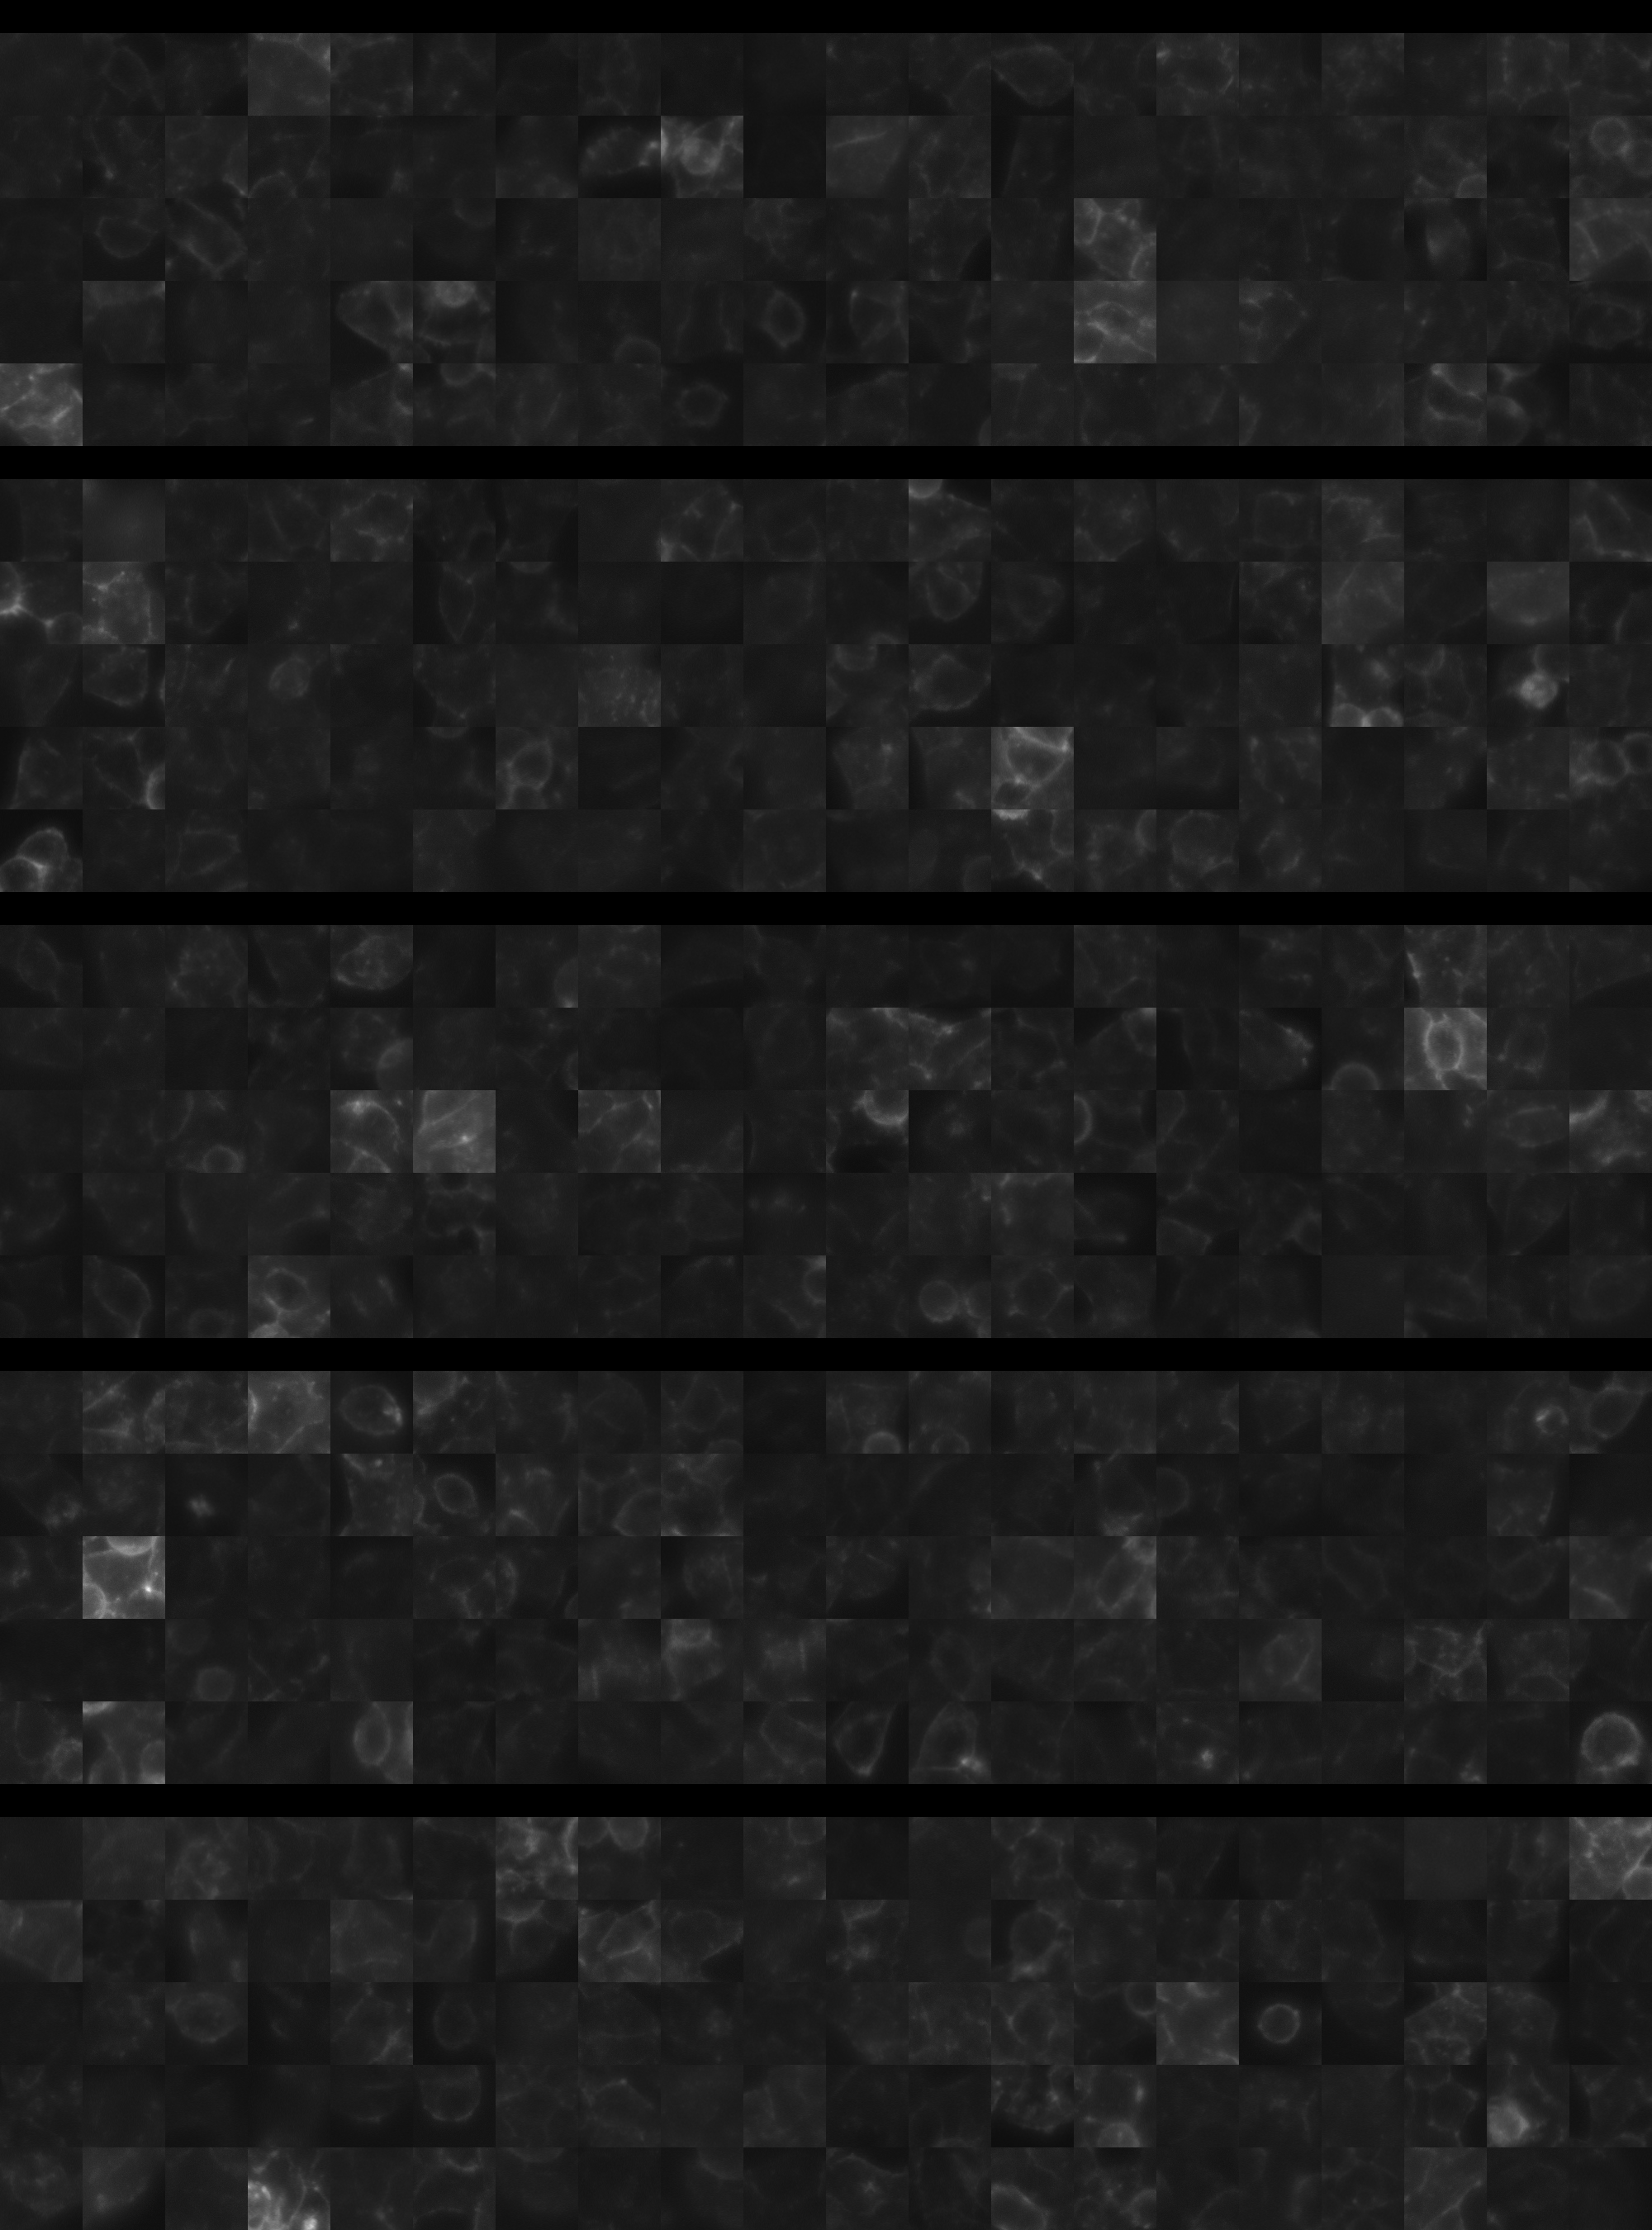
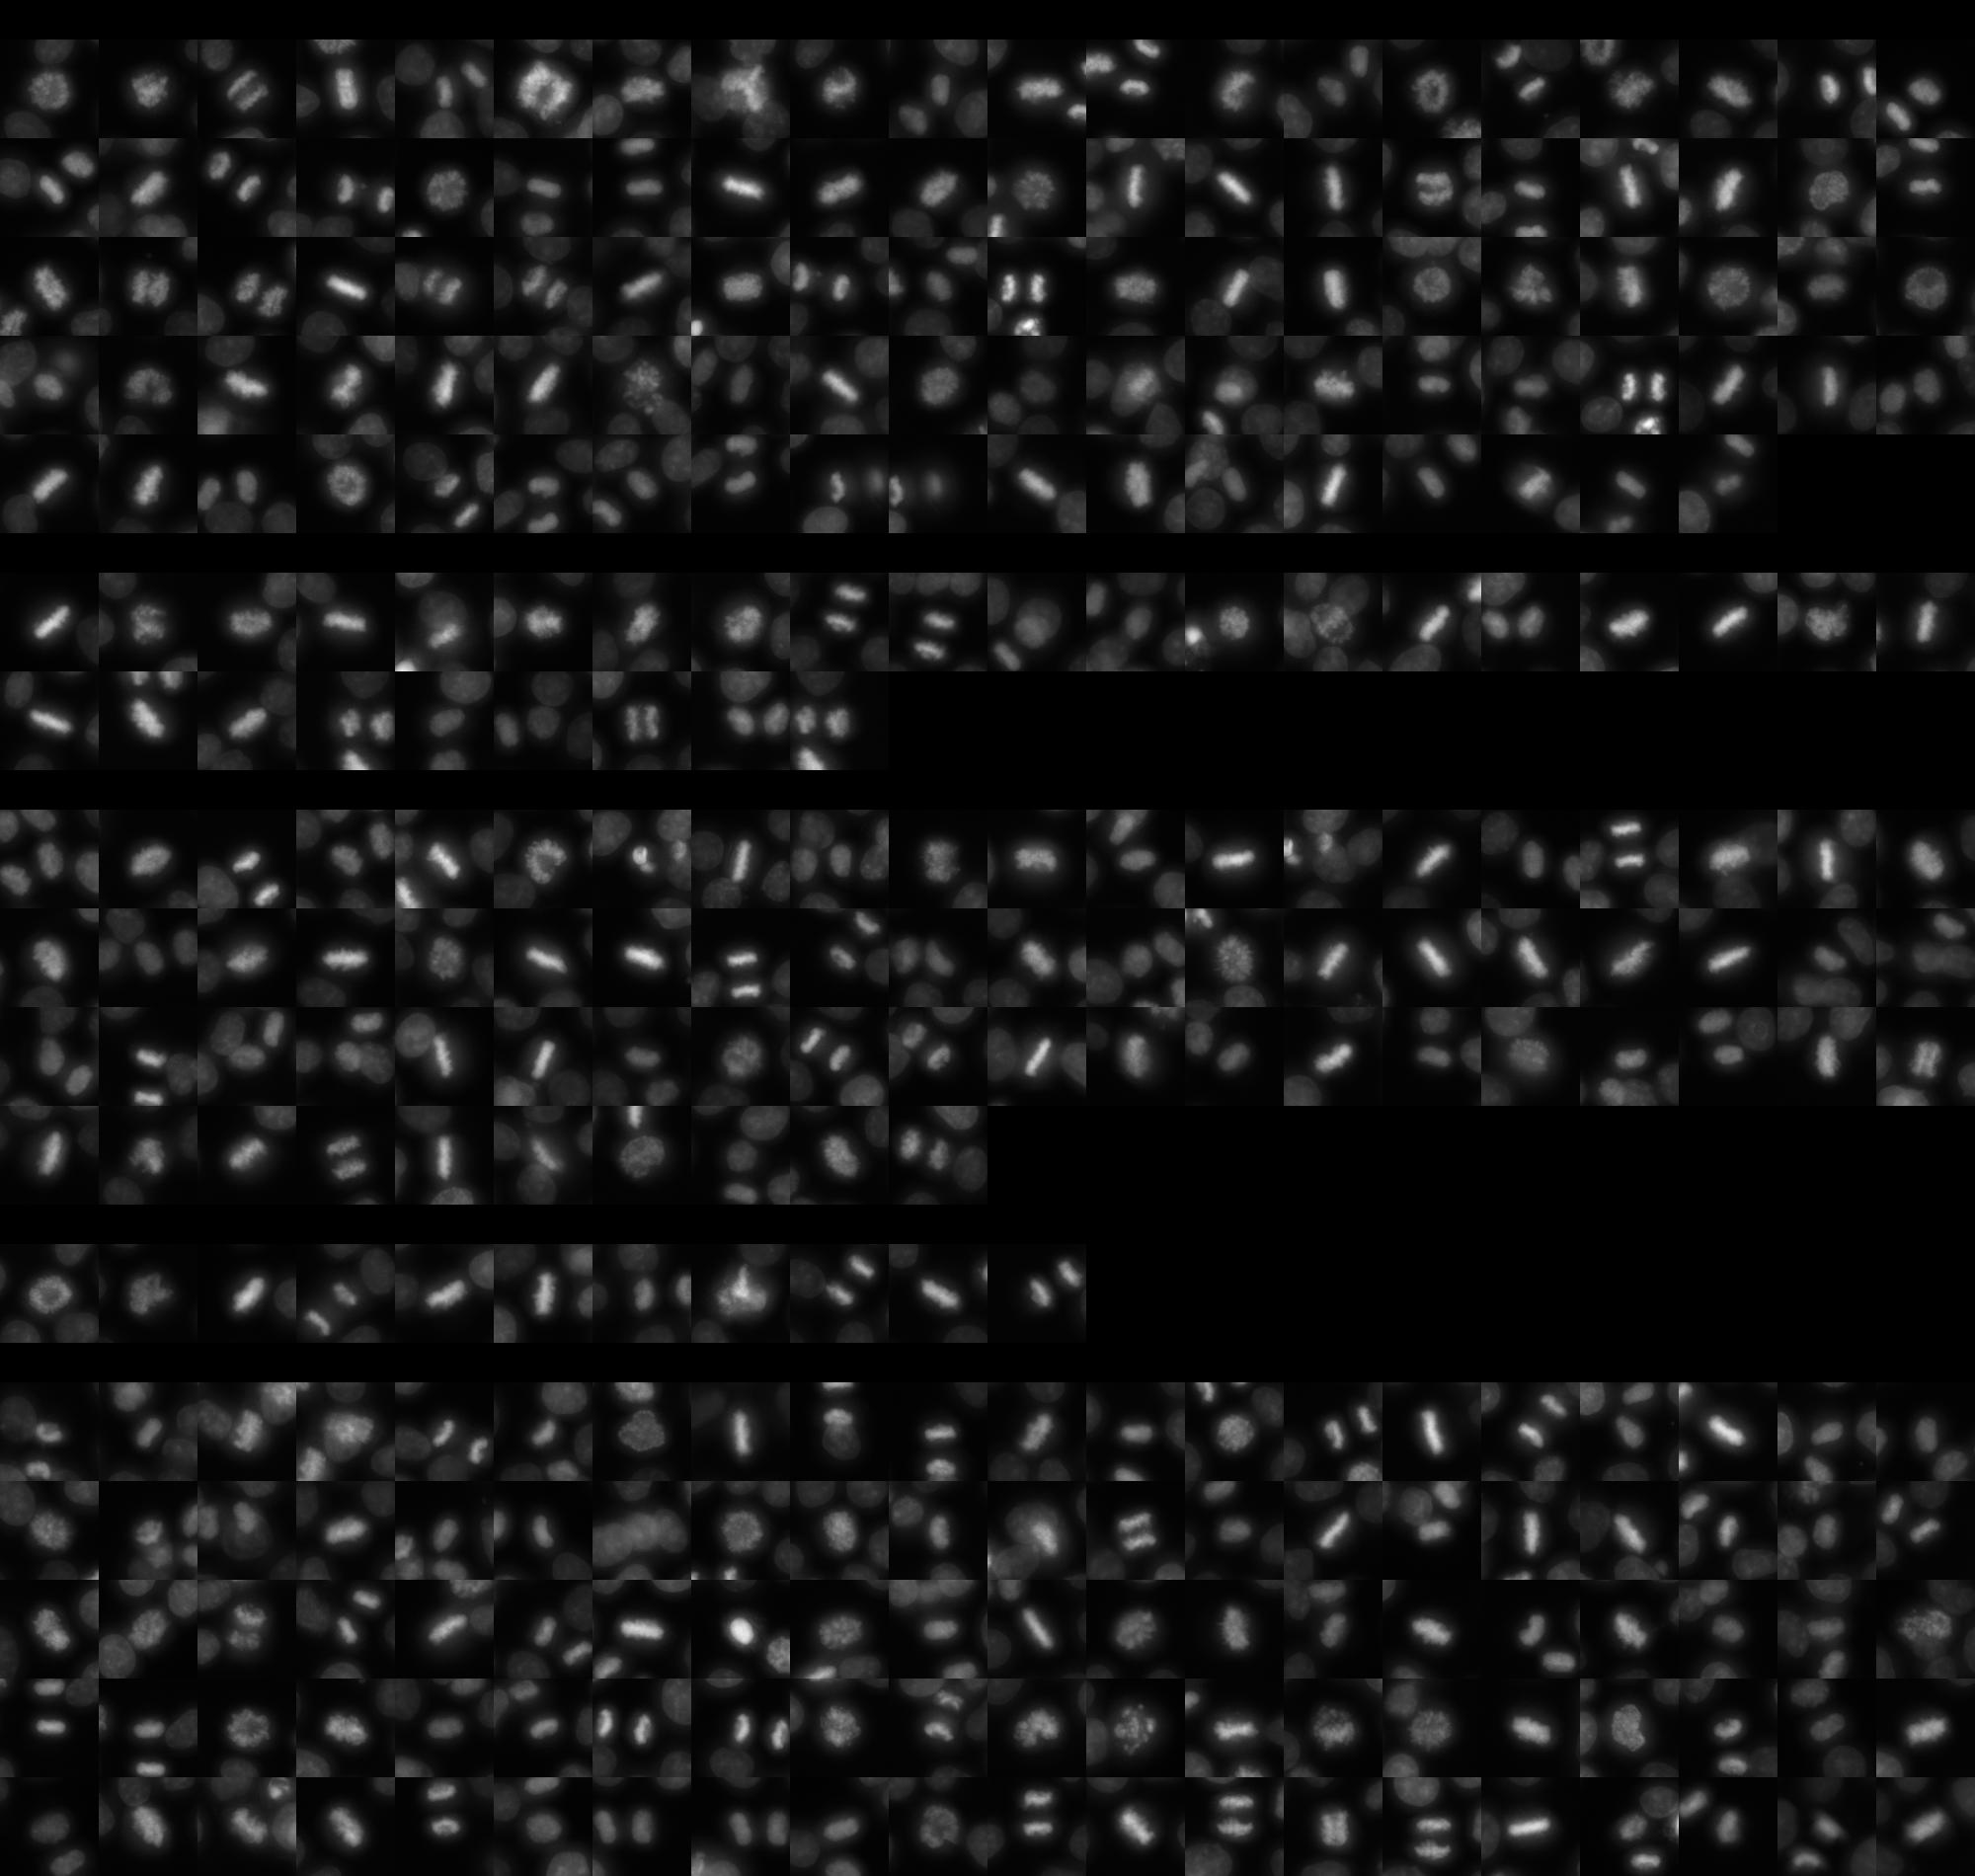
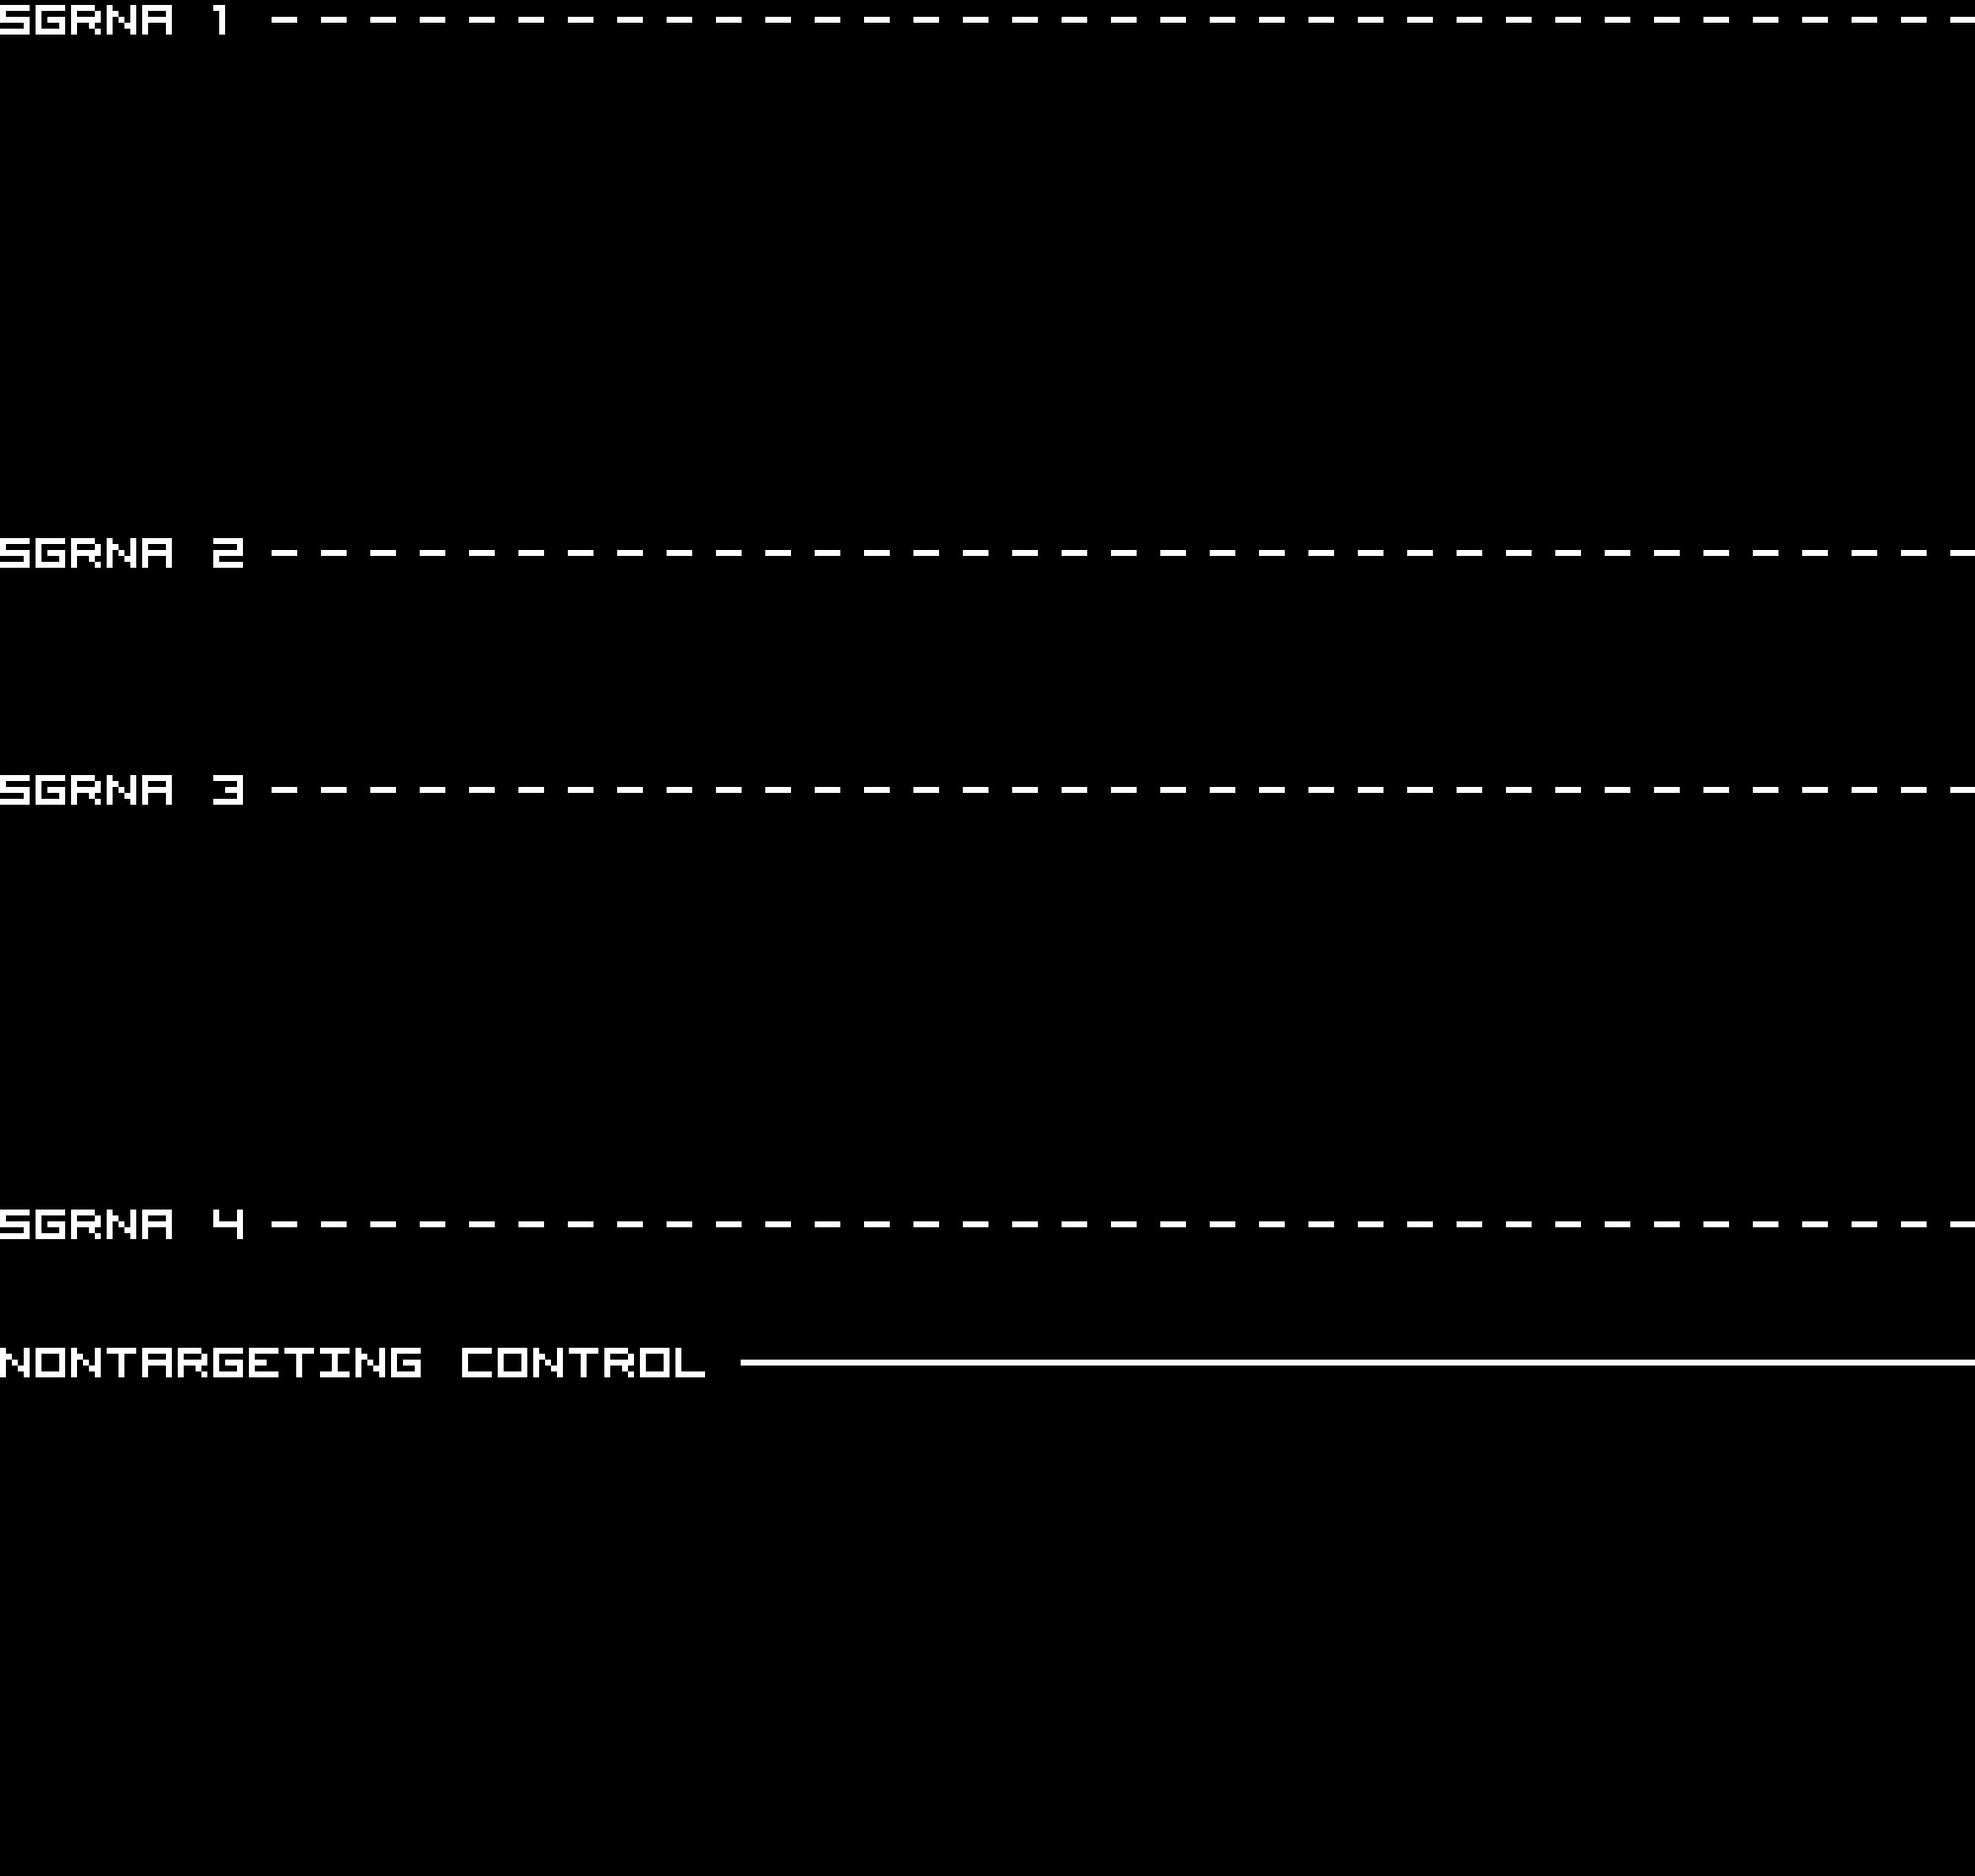
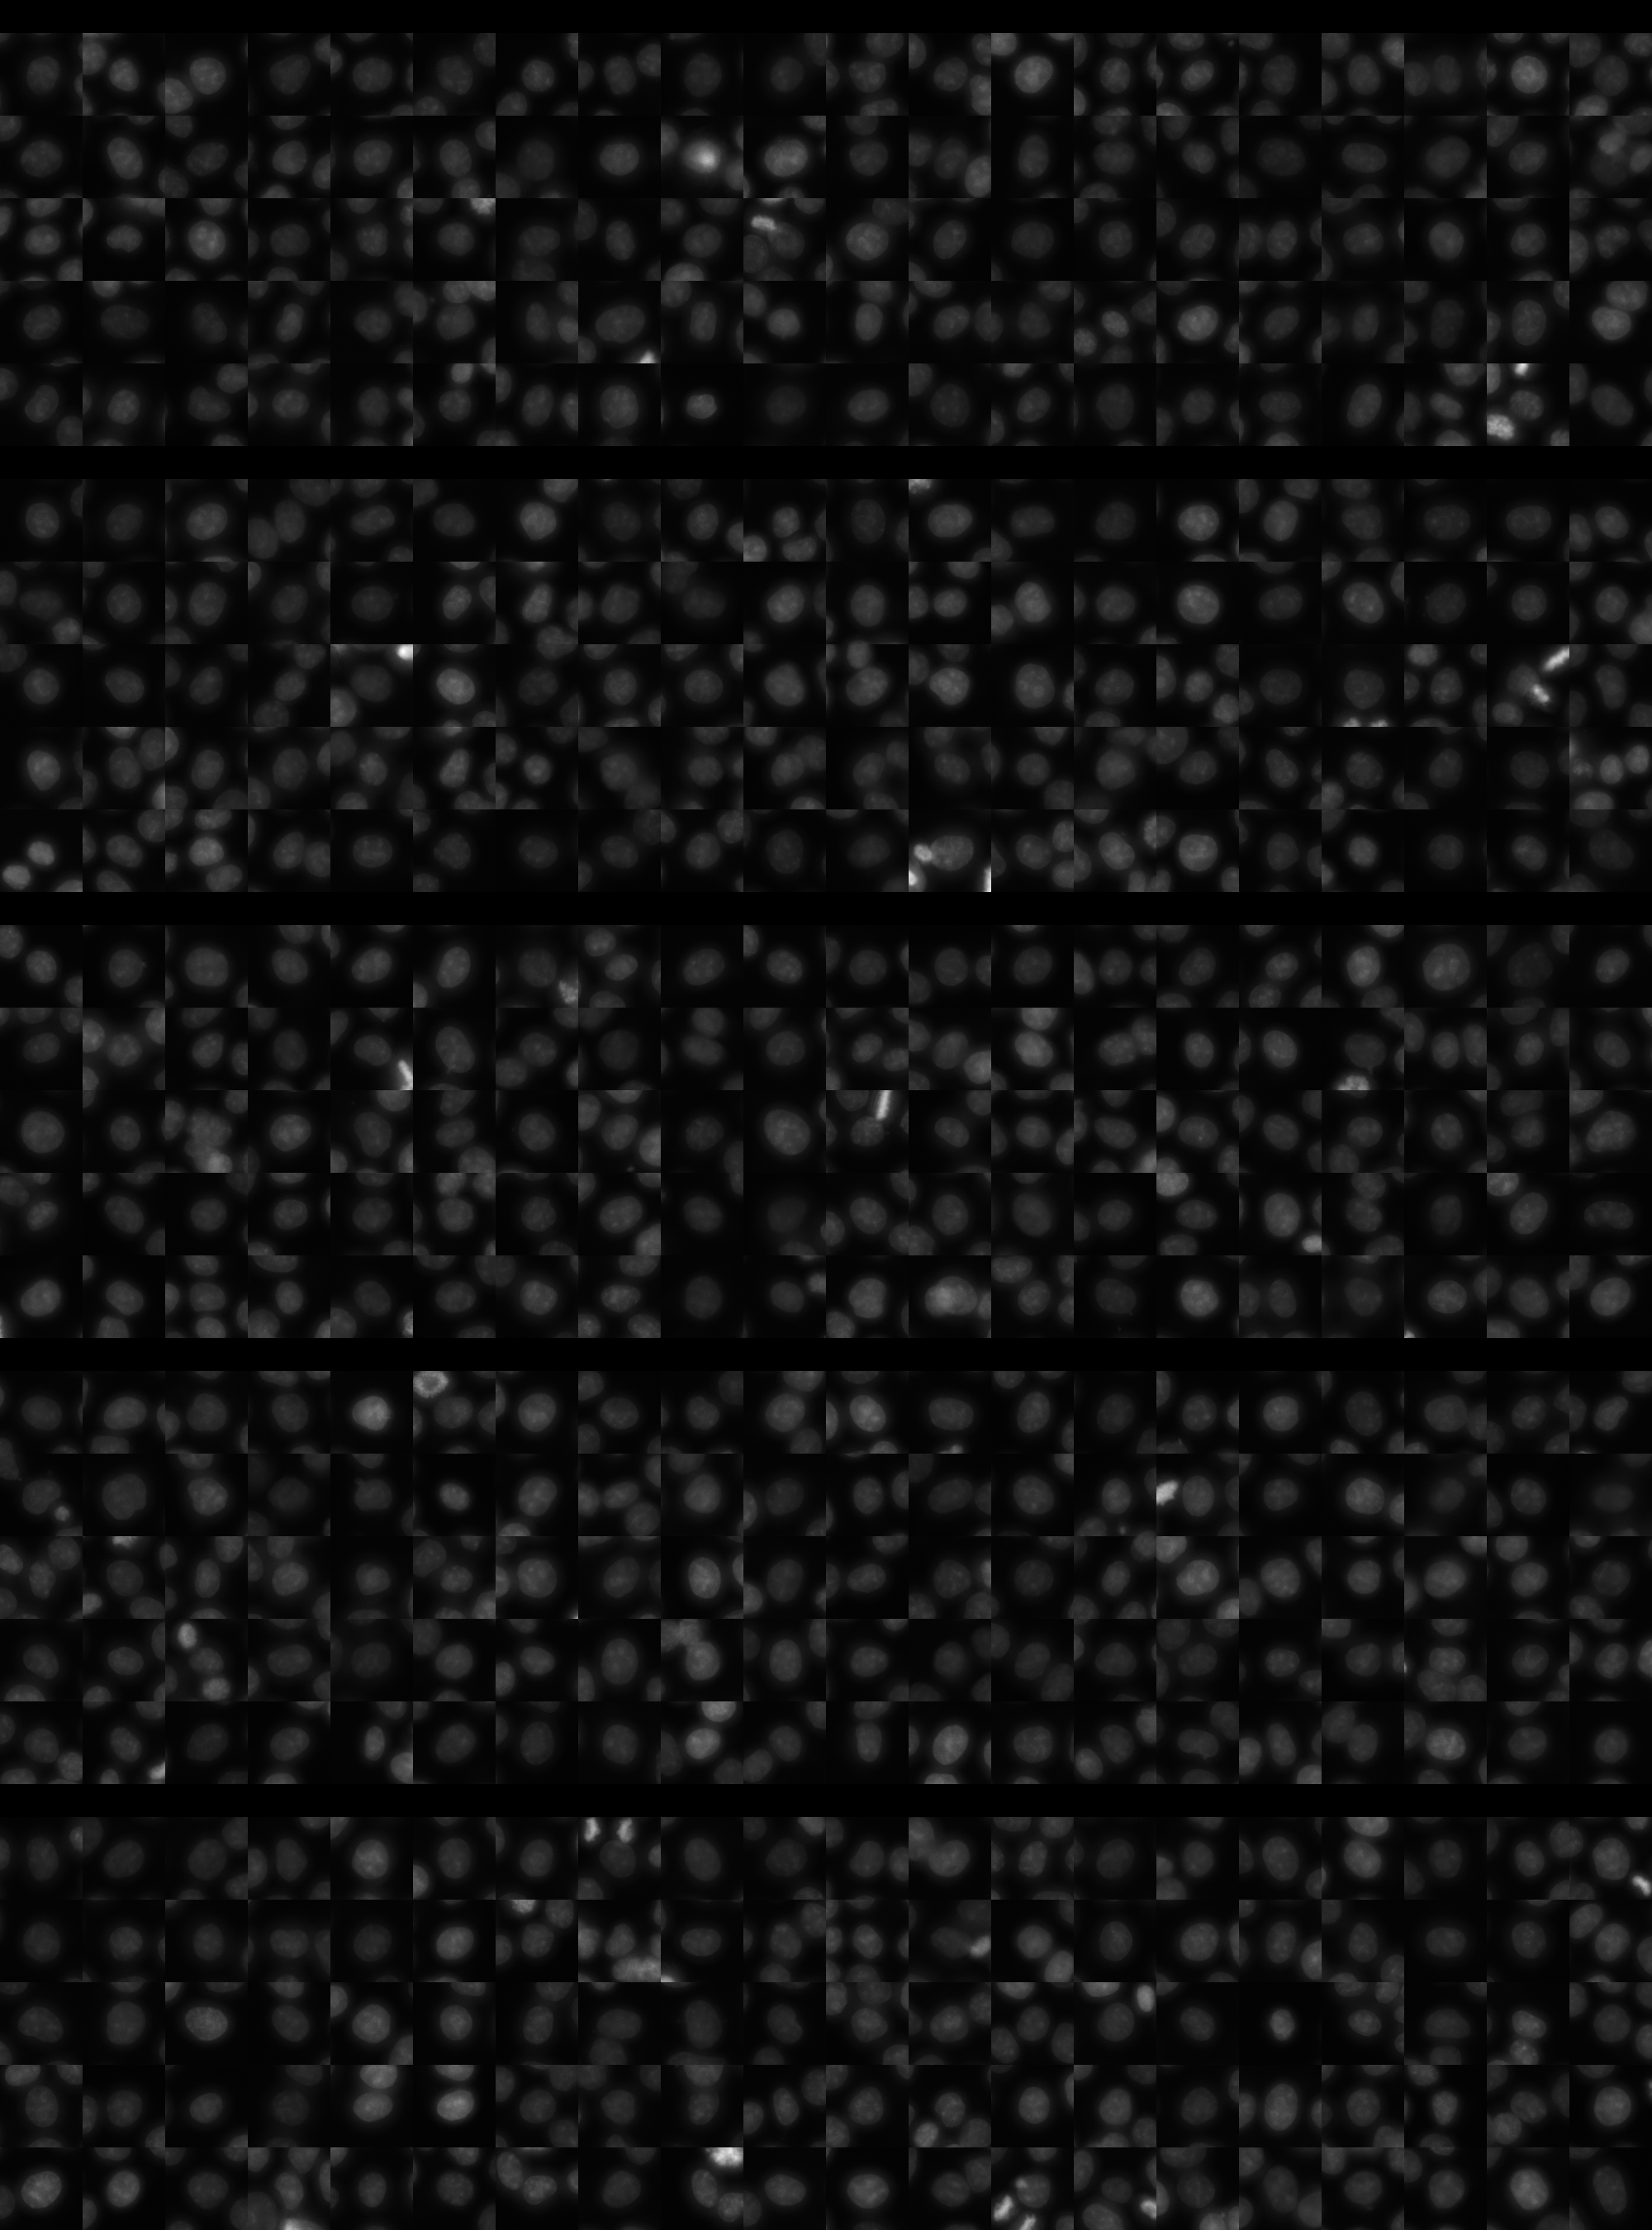
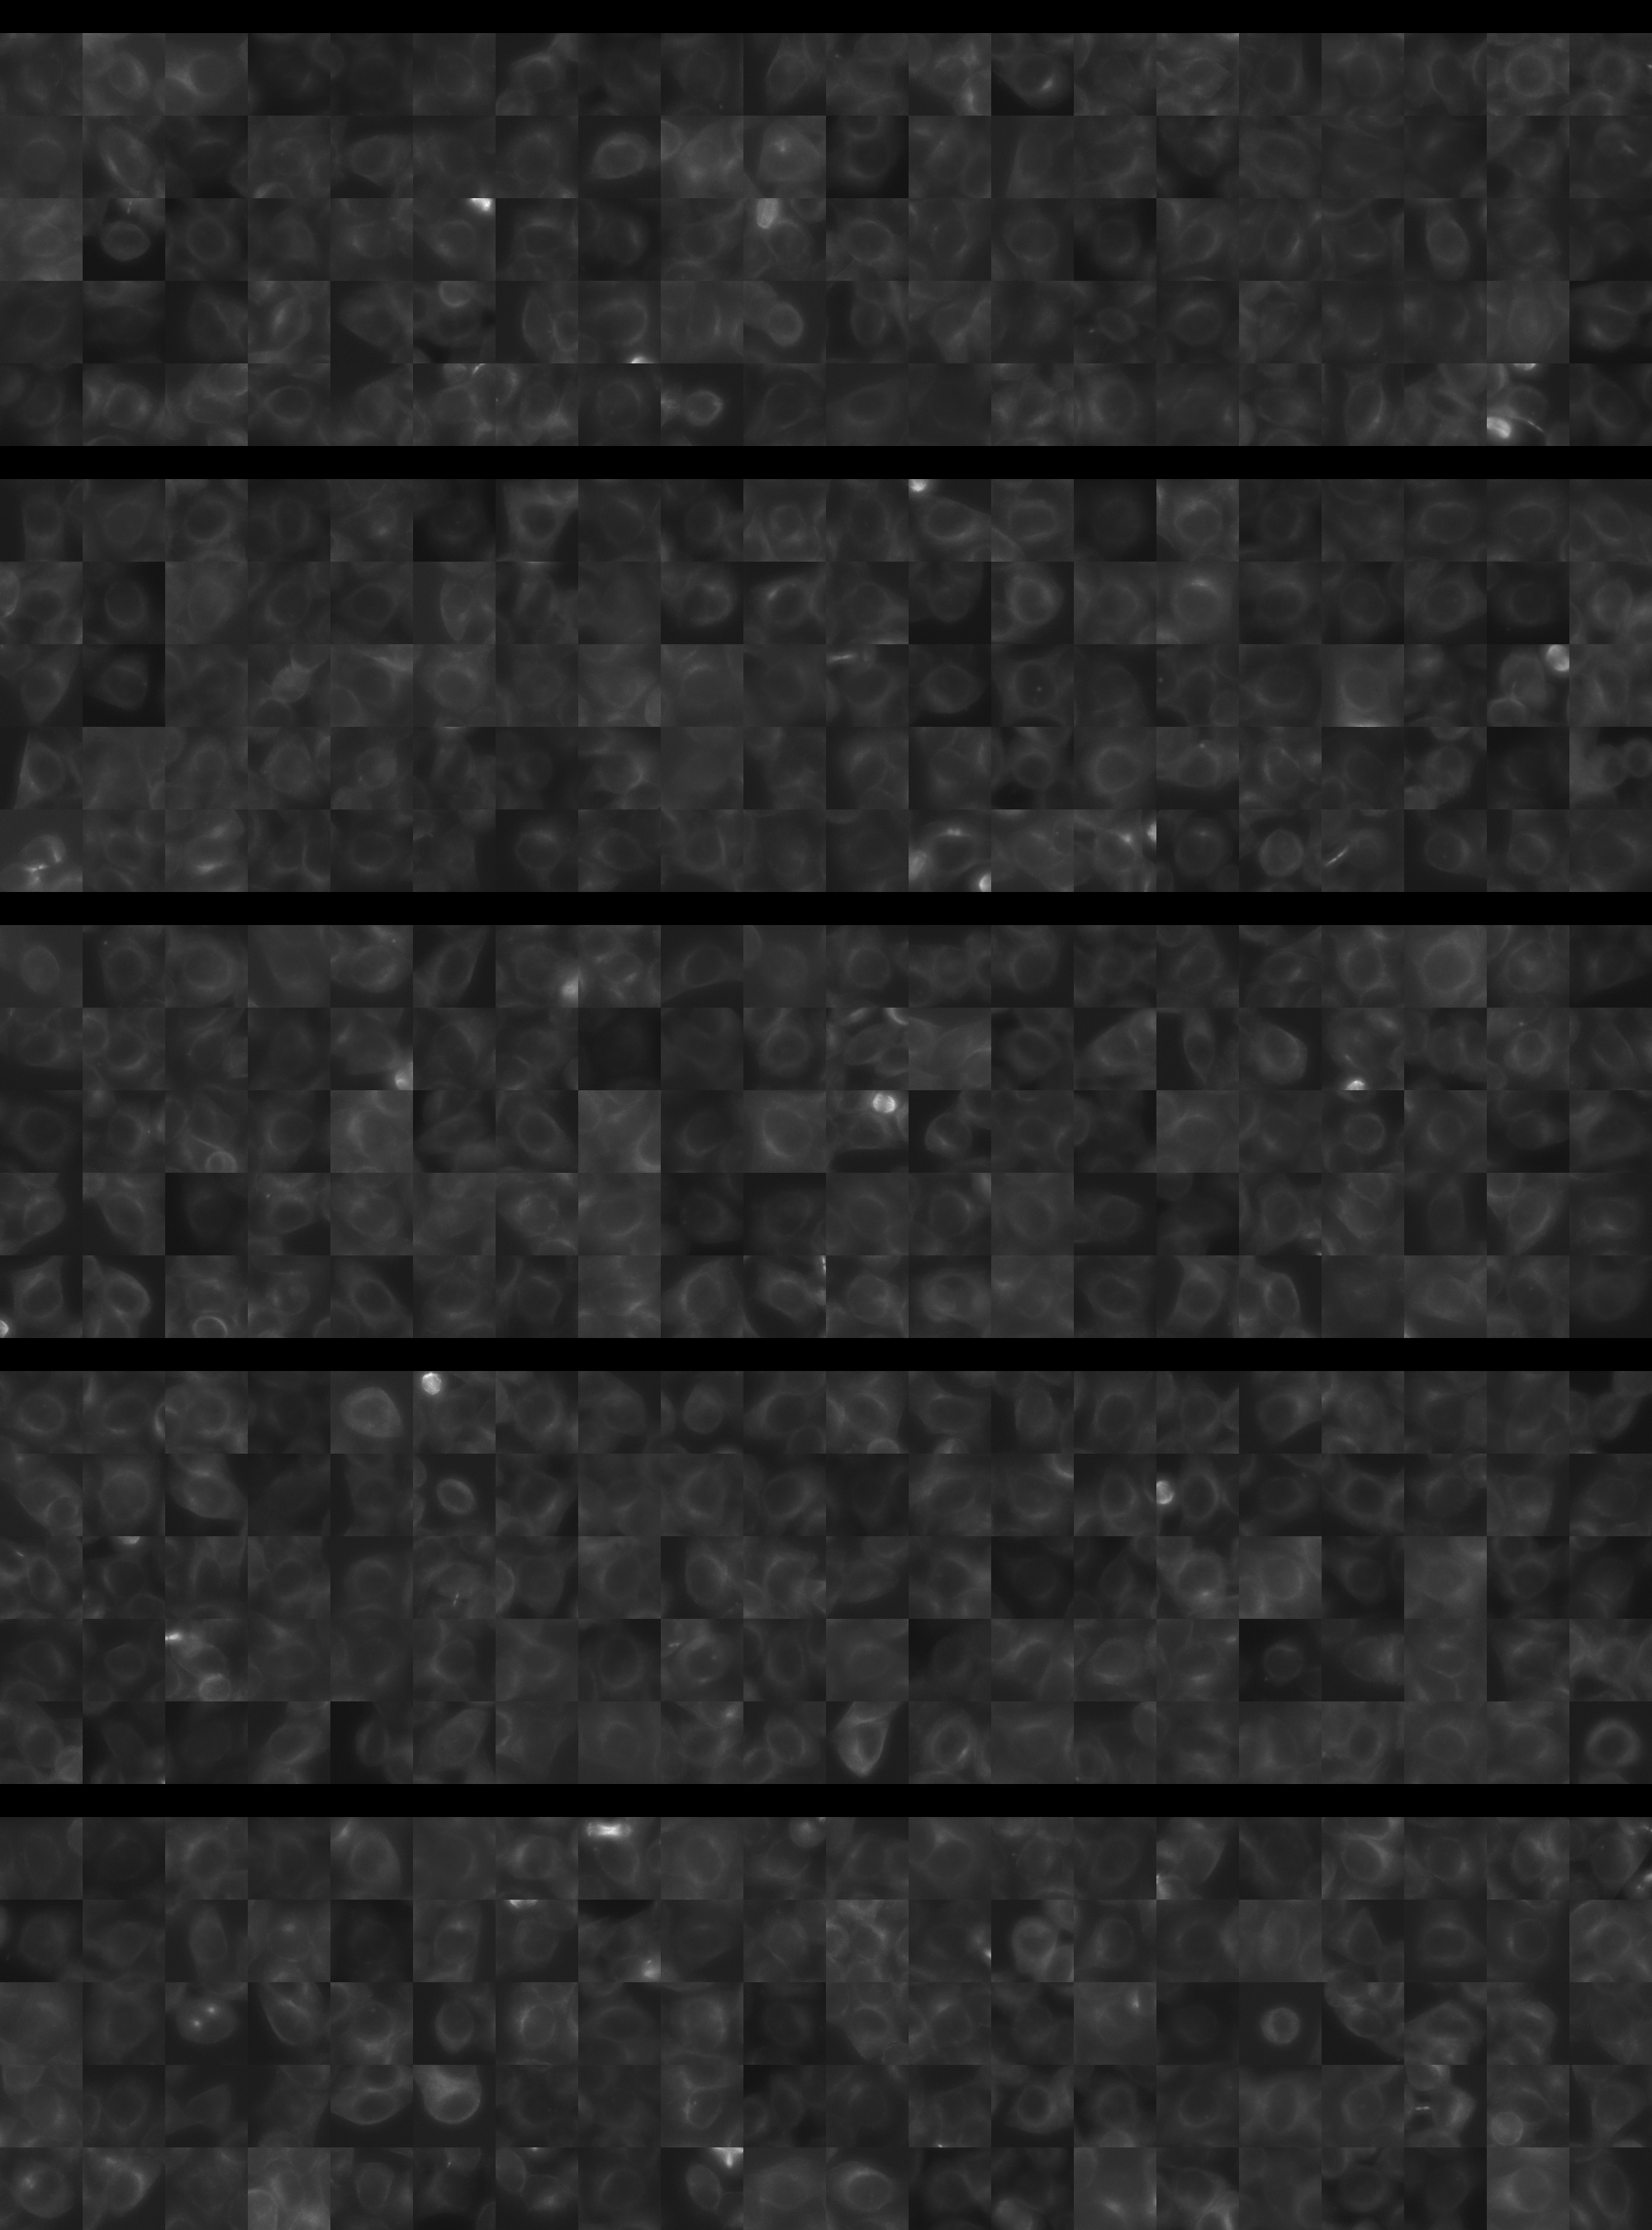
Each montage below shows randomly selected individual cell images for the same target gene separated by sgRNA, along with an example montage of cells expressing a non-targeting negative control sgRNA at the bottom. sgRNA labels in the montages correspond to the numbered sgRNA sequences in the gene info table above. The DNA (blue) and tubulin (green) channels are displayed by default, with gH2AX (grayscale) and actin (yellow) available using the check boxes. Channel brightness, contrast, and opacity are adjustable by clicking the arrow next to the channel name. When only one channel is selected, the display defaults to grayscale. Click the “Zoom” checkbox above the channel controls to enable image zooming (via scrolling) and panning (via click-and-drag).

The cell boxes displayed for this gene are square, 30.36 μm per side for the interphase montage and 30.36 μm per side for the mitotic montage.
Features

Interphase Score Rank FDR q-value
Nucleus DNA Integrated 0.050 1022 of 5322 0.473
Nucleus DNA Mean 0.007 1768 of 5322 0.866
Nucleus gH2AX Mean 0.063 3117 of 5322 0.125
Nucleus DNA - gH2AX Correlation -3.402e-02 1839 of 5322 0.263
Nucleus Shape Area 0.062 1357 of 5322 0.308
Nucleus Shape Eccentricity 0.010 2773 of 5322 0.831
Nucleus Shape Form Factor 0.029 201 of 5322 0.357
Nucleus Shape Solidity 0.022 240 of 5322 0.522
Cell DNA Mass Displacement 0.014 3514 of 5322 0.878
Cell Tubulin Mean 0.080 669 of 5322 0.063
Cell Tubulin Mass Displacement 0.007 2593 of 5322 0.934
Cell Actin Mean 0.013 2580 of 5322 0.835
Cell Tubulin - Actin Correlation -8.140e-02 5207 of 5322 0.043
Cell DNA - Tubulin Correlation -2.479e-02 4590 of 5322 0.579
Cell Shape Area -1.239e-02 3583 of 5322 0.758
Cell Shape Eccentricity 0.029 1482 of 5322 0.706
Mitotic Score Rank FDR q-value
Nucleus DNA Integrated 0.078 2797 of 5322 0.970
Nucleus DNA Mean 0.053 2132 of 5322 1.000
Nucleus DNA Mass Displacement -1.307e-02 3711 of 5322 0.999
Nucleus DNA Mean Frac 3 -4.946e-04 3142 of 5322 1.000
Nucleus gH2AX Mean 0.168 980 of 5322 1.000
Nucleus gH2AX Mean Frac 0 0.003 2235 of 5322 1.000
Nucleus Tubulin Mean Frac 0 0.057 2621 of 5322 0.999
Nucleus Tubulin Mean Edge 0.303 300 of 5322 0.849
Nucleus Tubulin Std Edge -5.790e-02 3370 of 5322 0.999
Nucleus Shape Area -7.334e-02 4644 of 5322 0.989
Nucleus Shape Eccentricity 0.185 275 of 5322 1.000
Nucleus Shape Form Factor -7.615e-03 1493 of 5322 0.998
Cell Tubulin Mean 0.217 832 of 5322 0.975
Cell Tubulin Mean Frac 3 -1.462e-01 3507 of 5322 0.999
Cell Actin Mean 0.027 2834 of 5322 0.997
Cell Shape Area 0.052 3261 of 5322 0.998
( Reset Zoom )
Brightness
Contrast
Opacity
Brightness
Contrast
Opacity
Brightness
Contrast
Opacity
Brightness
Contrast
Opacity
Brightness
Contrast
Opacity

( Reset Zoom )
Brightness
Contrast
Opacity
Brightness
Contrast
Opacity
Brightness
Contrast
Opacity
Brightness
Contrast
Opacity
Brightness
Contrast
Opacity

MIT Central Accessability