VPS29

Gene symbol: VPS29
Gene: 51699
Uniprot Function: Acts as component of the retromer cargo-selective complex (CSC). The CSC is believed to be the core functional component of retromer or respective retromer complex variants acting to prevent missorting of selected transmembrane cargo proteins into the lysosomal degradation pathway. The recruitment of the CSC to the endosomal membrane involves RAB7A and SNX3. The SNX-BAR retromer mediates retrograde transport of cargo proteins from endosomes to the trans-Golgi network (TGN) and is involved in endosome-to-plasma membrane transport for cargo protein recycling. The SNX3-retromer mediates the retrograde endosome-to-TGN transport of WLS distinct from the SNX-BAR retromer pathway. The SNX27-retromer is believed to be involved in endosome-to-plasma membrane trafficking and recycling of a broad spectrum of cargo proteins. The CSC seems to act as recruitment hub for other proteins, such as the WASH complex and TBC1D5. Required to regulate transcytosis of the polymeric immunoglobulin receptor (pIgR-pIgA) (PubMed:15247922, PubMed:21725319, PubMed:23563491). Acts also as component of the retriever complex. The retriever complex is a heterotrimeric complex related to retromer cargo-selective complex (CSC) and essential for retromer-independent retrieval and recycling of numerous cargos such as integrin alpha-5/beta-1 (ITGA5:ITGB1) (PubMed:28892079). In the endosomes, retriever complex drives the retrieval and recycling of NxxY-motif-containing cargo proteins by coupling to SNX17, a cargo essential for the homeostatic maintenance of numerous cell surface proteins associated with processes that include cell migration, cell adhesion, nutrient supply and cell signaling (PubMed:28892079). The recruitment of the retriever complex to the endosomal membrane involves CCC and WASH complexes (PubMed:28892079). Involved in GLUT1 endosome-to-plasma membrane trafficking; the function is dependent of association with ANKRD27 (PubMed:24856514).
Mitotic Index 0.0235
Interphase Cluster: #75 (29 genes)
Mitotic Cluster: #116 (23 genes)
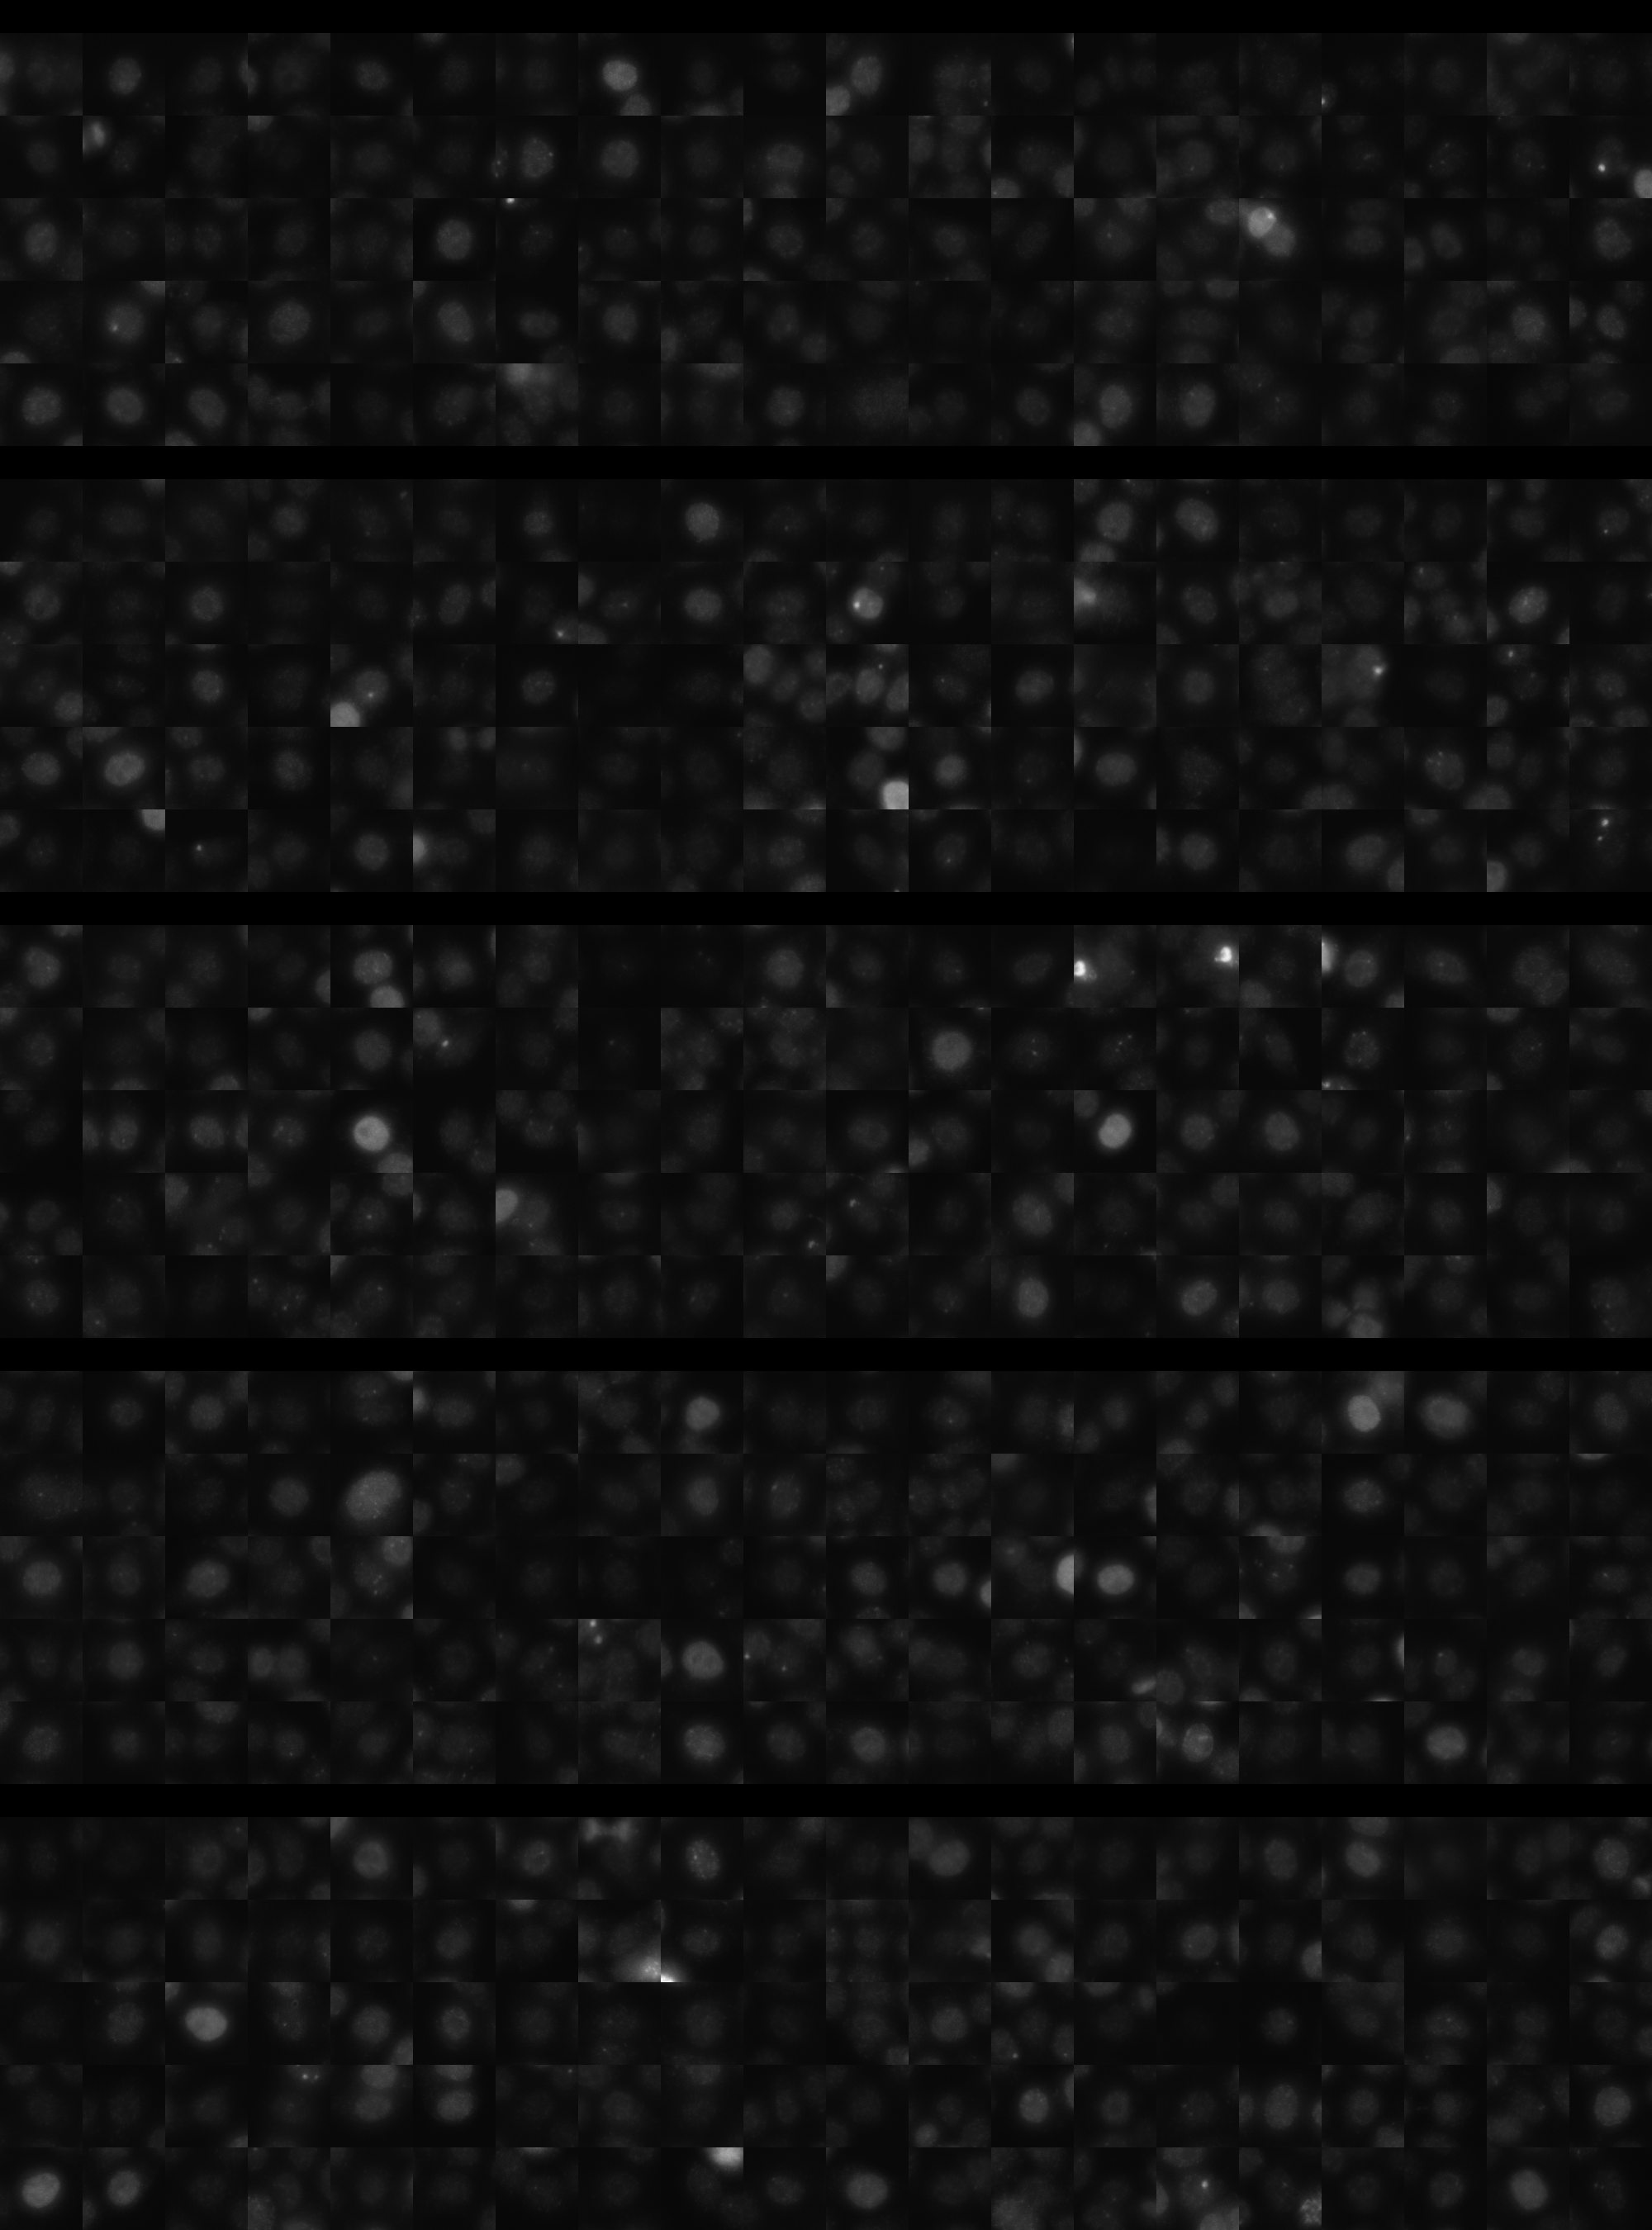
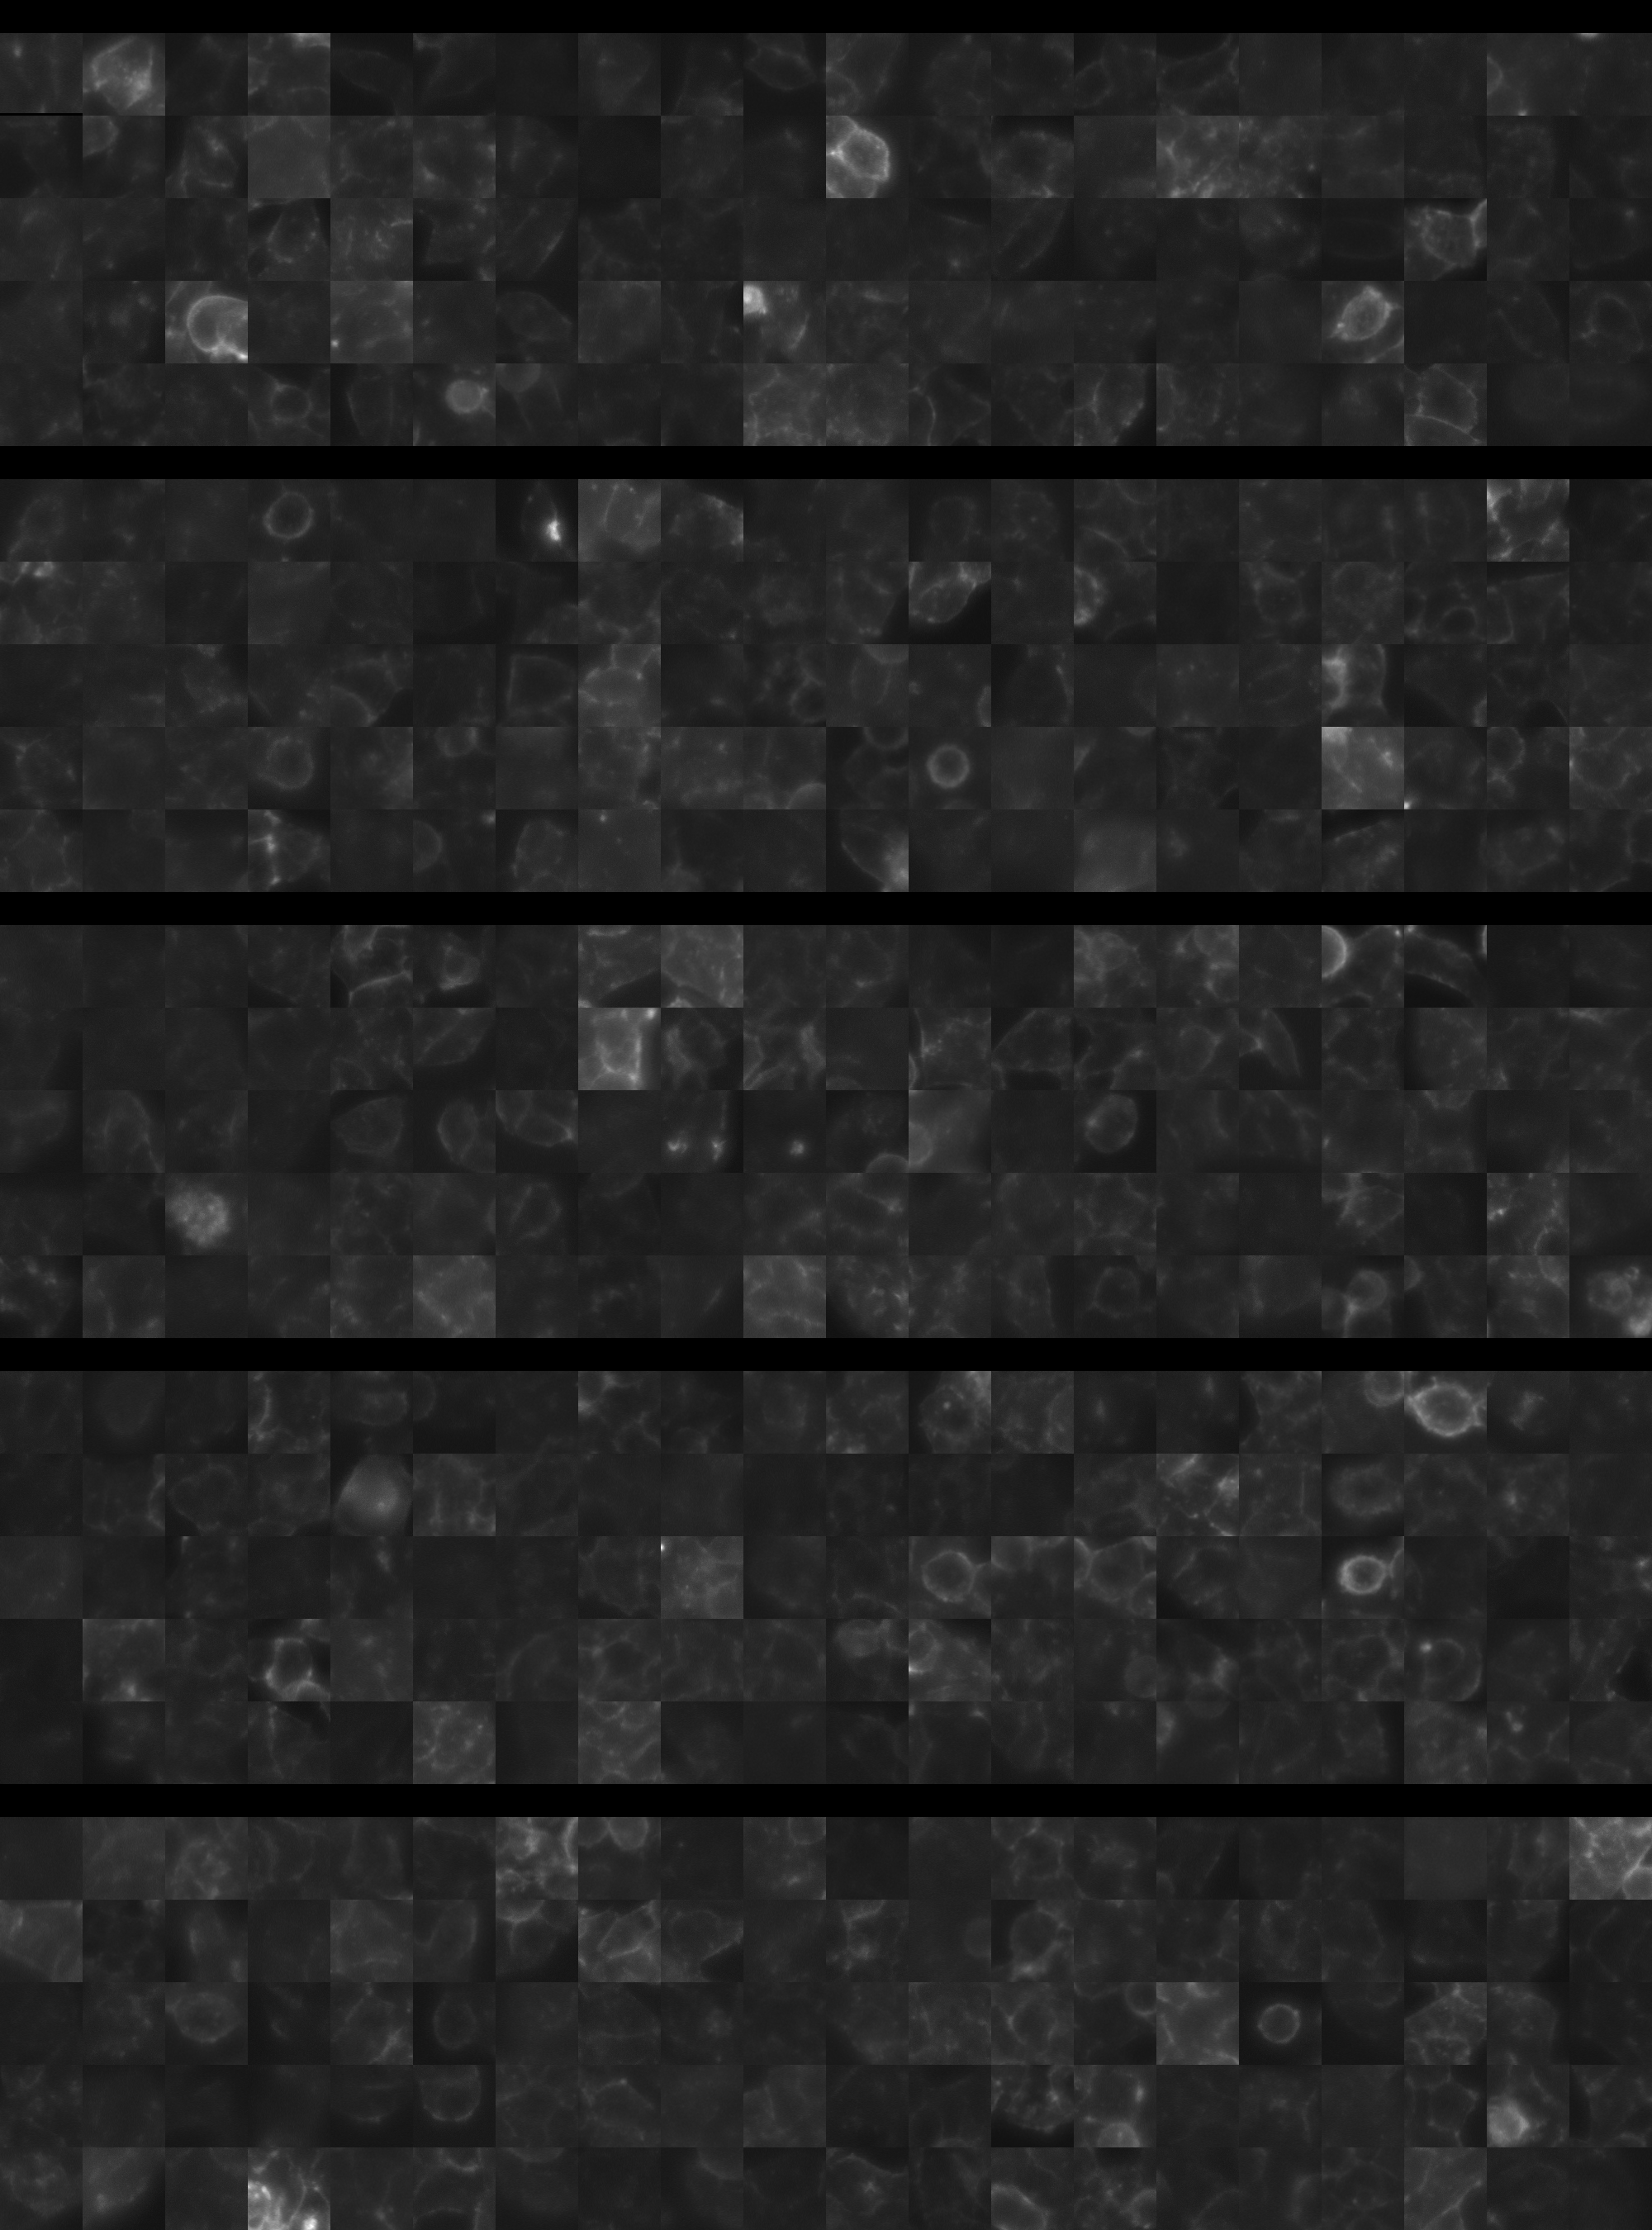
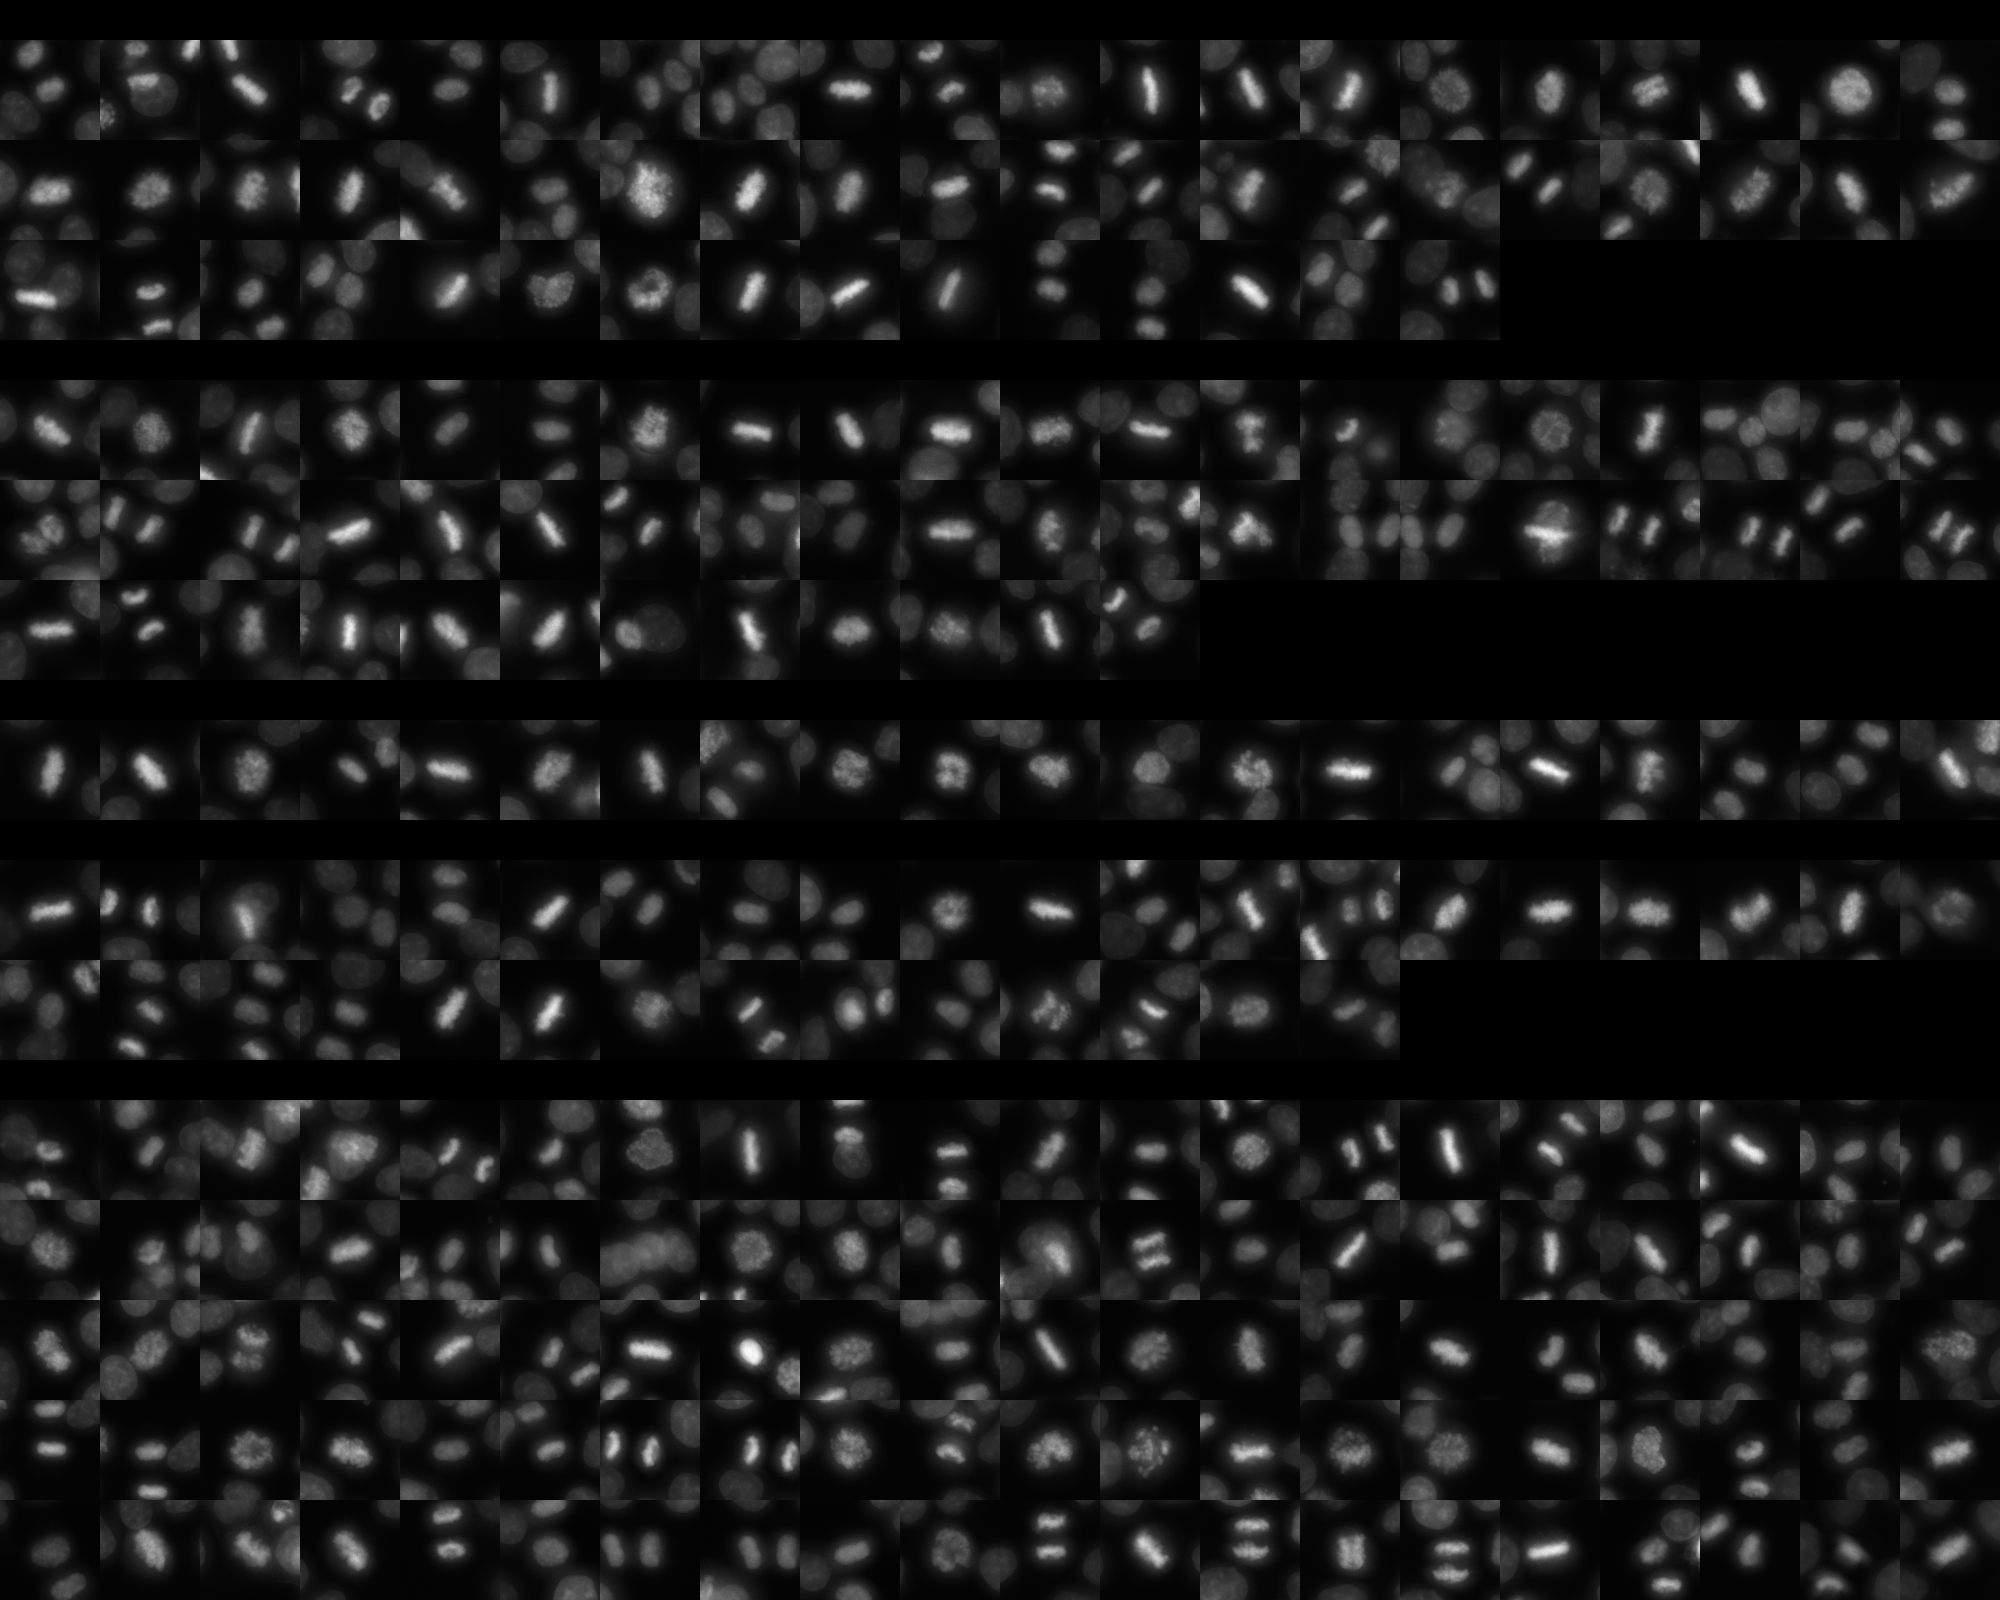
sgRNA 1: ATCAAATTGCCTCTGCAACA (interphase cells: 2749, mitotic cells: 55)
sgRNA 2: GGACATCAAGTTATTCCATG (interphase cells: 2060, mitotic cells: 52)
sgRNA 3: GGCAAACTGTTGCACCGGTG (interphase cells: 592, mitotic cells: 20)
sgRNA 4: TTATGACTATCTCAAGACTC (interphase cells: 1300, mitotic cells: 34)

Interphase Cluster

Mitotic Cluster

Overview

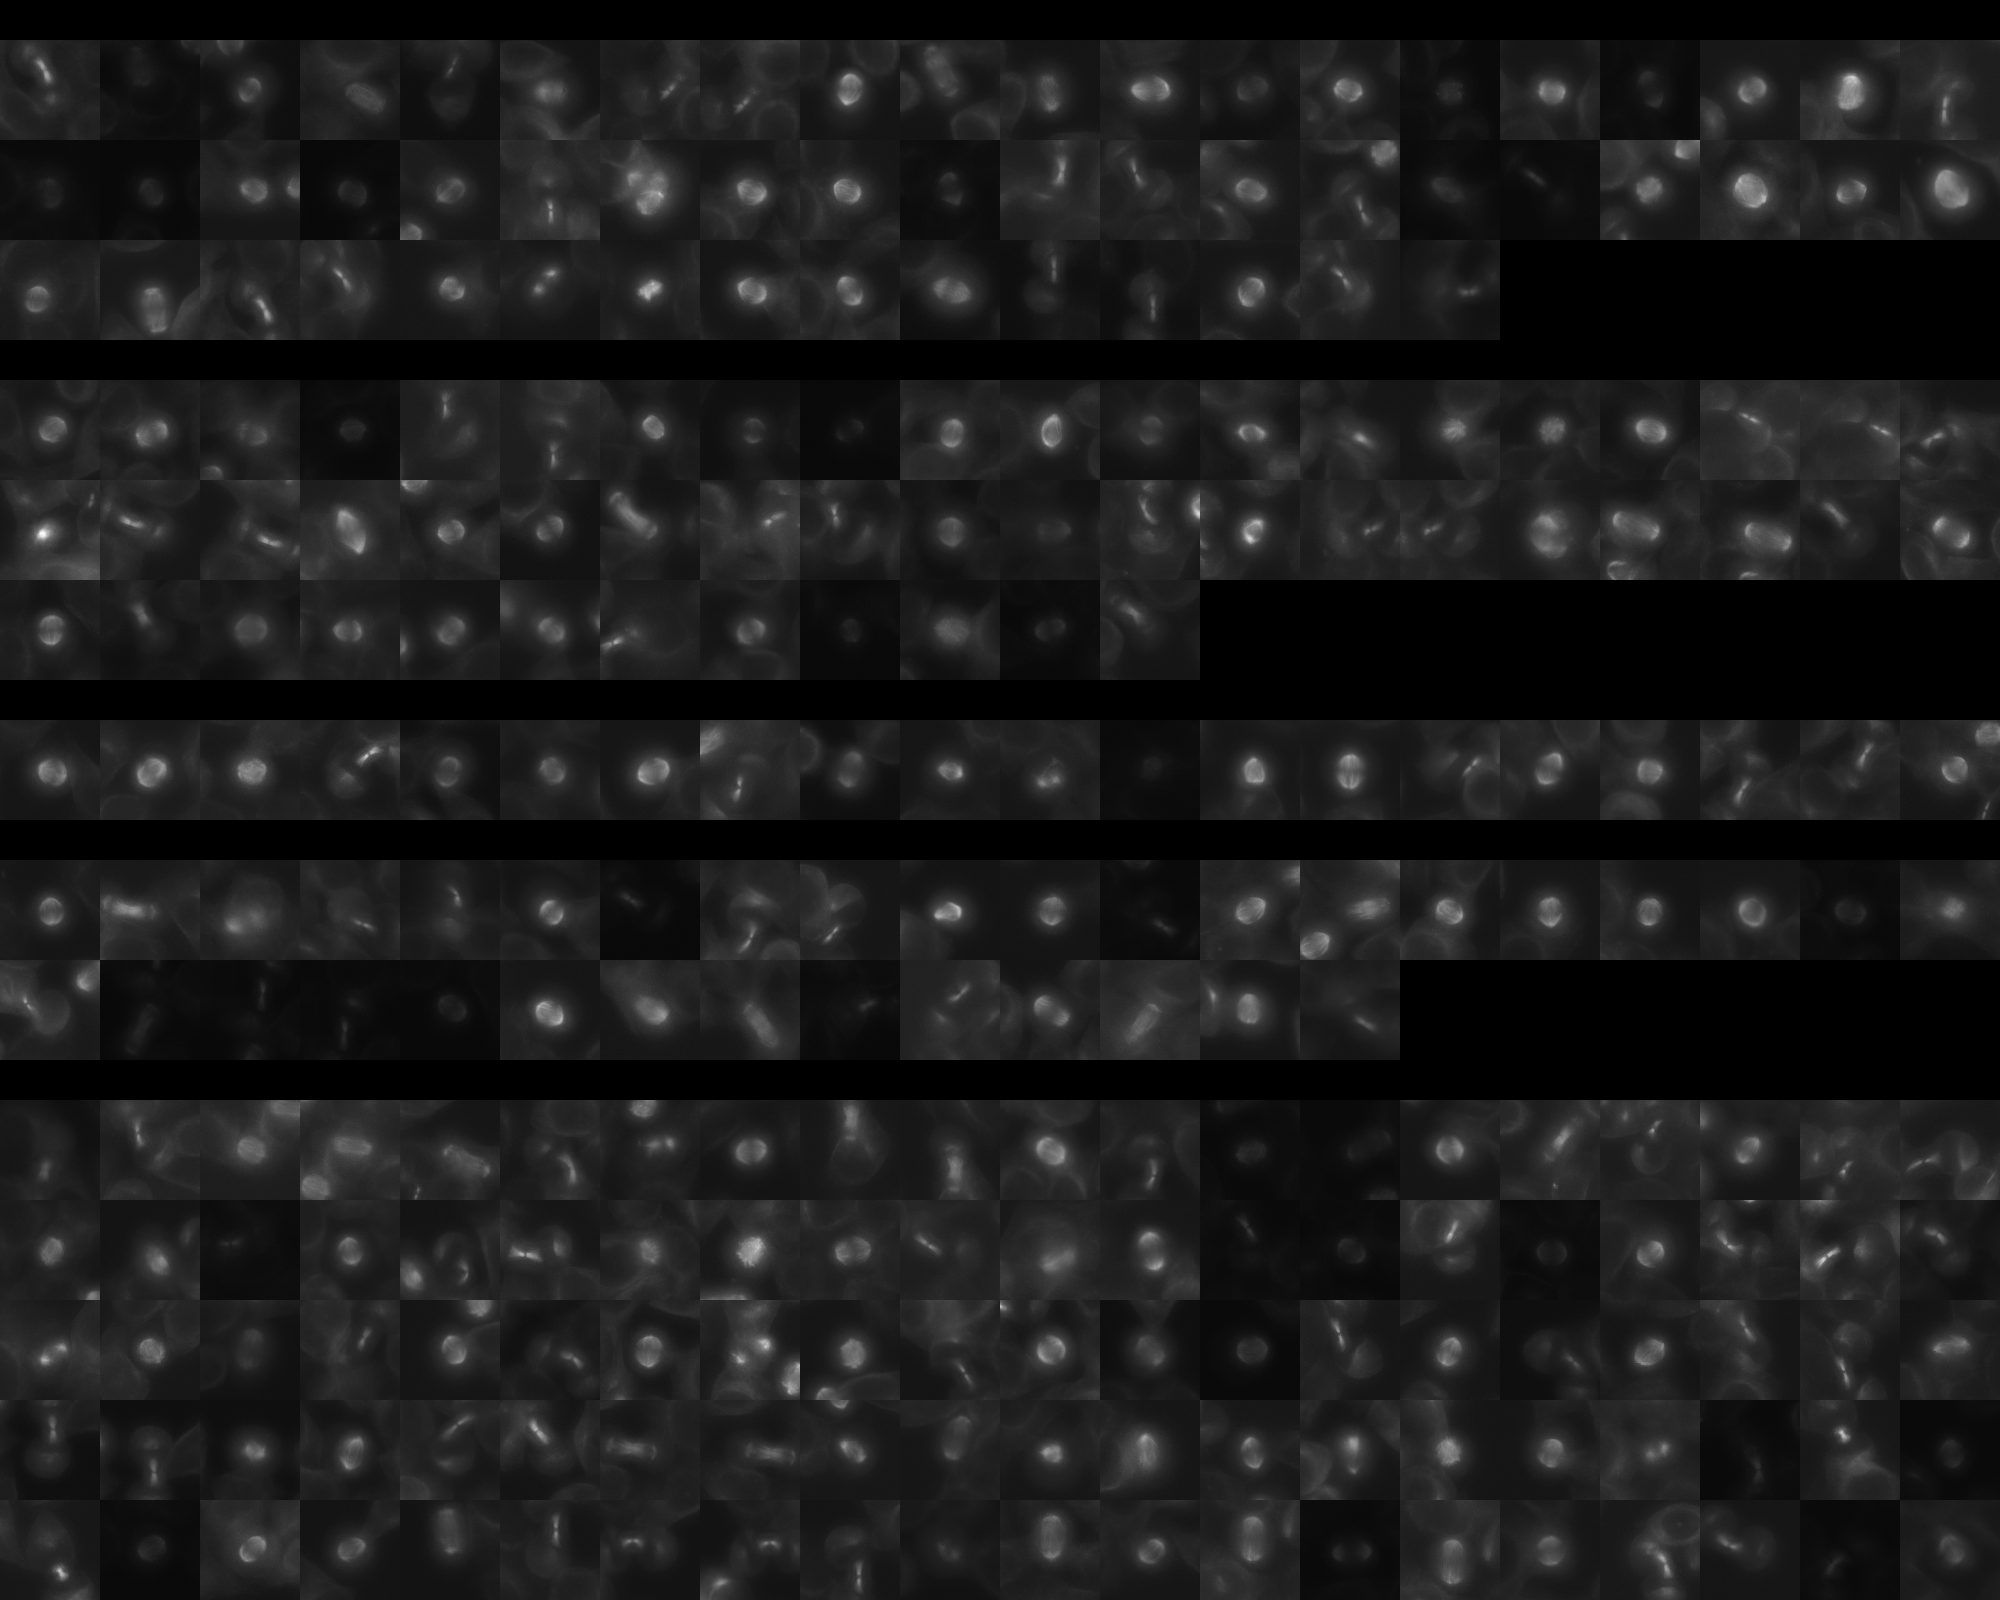
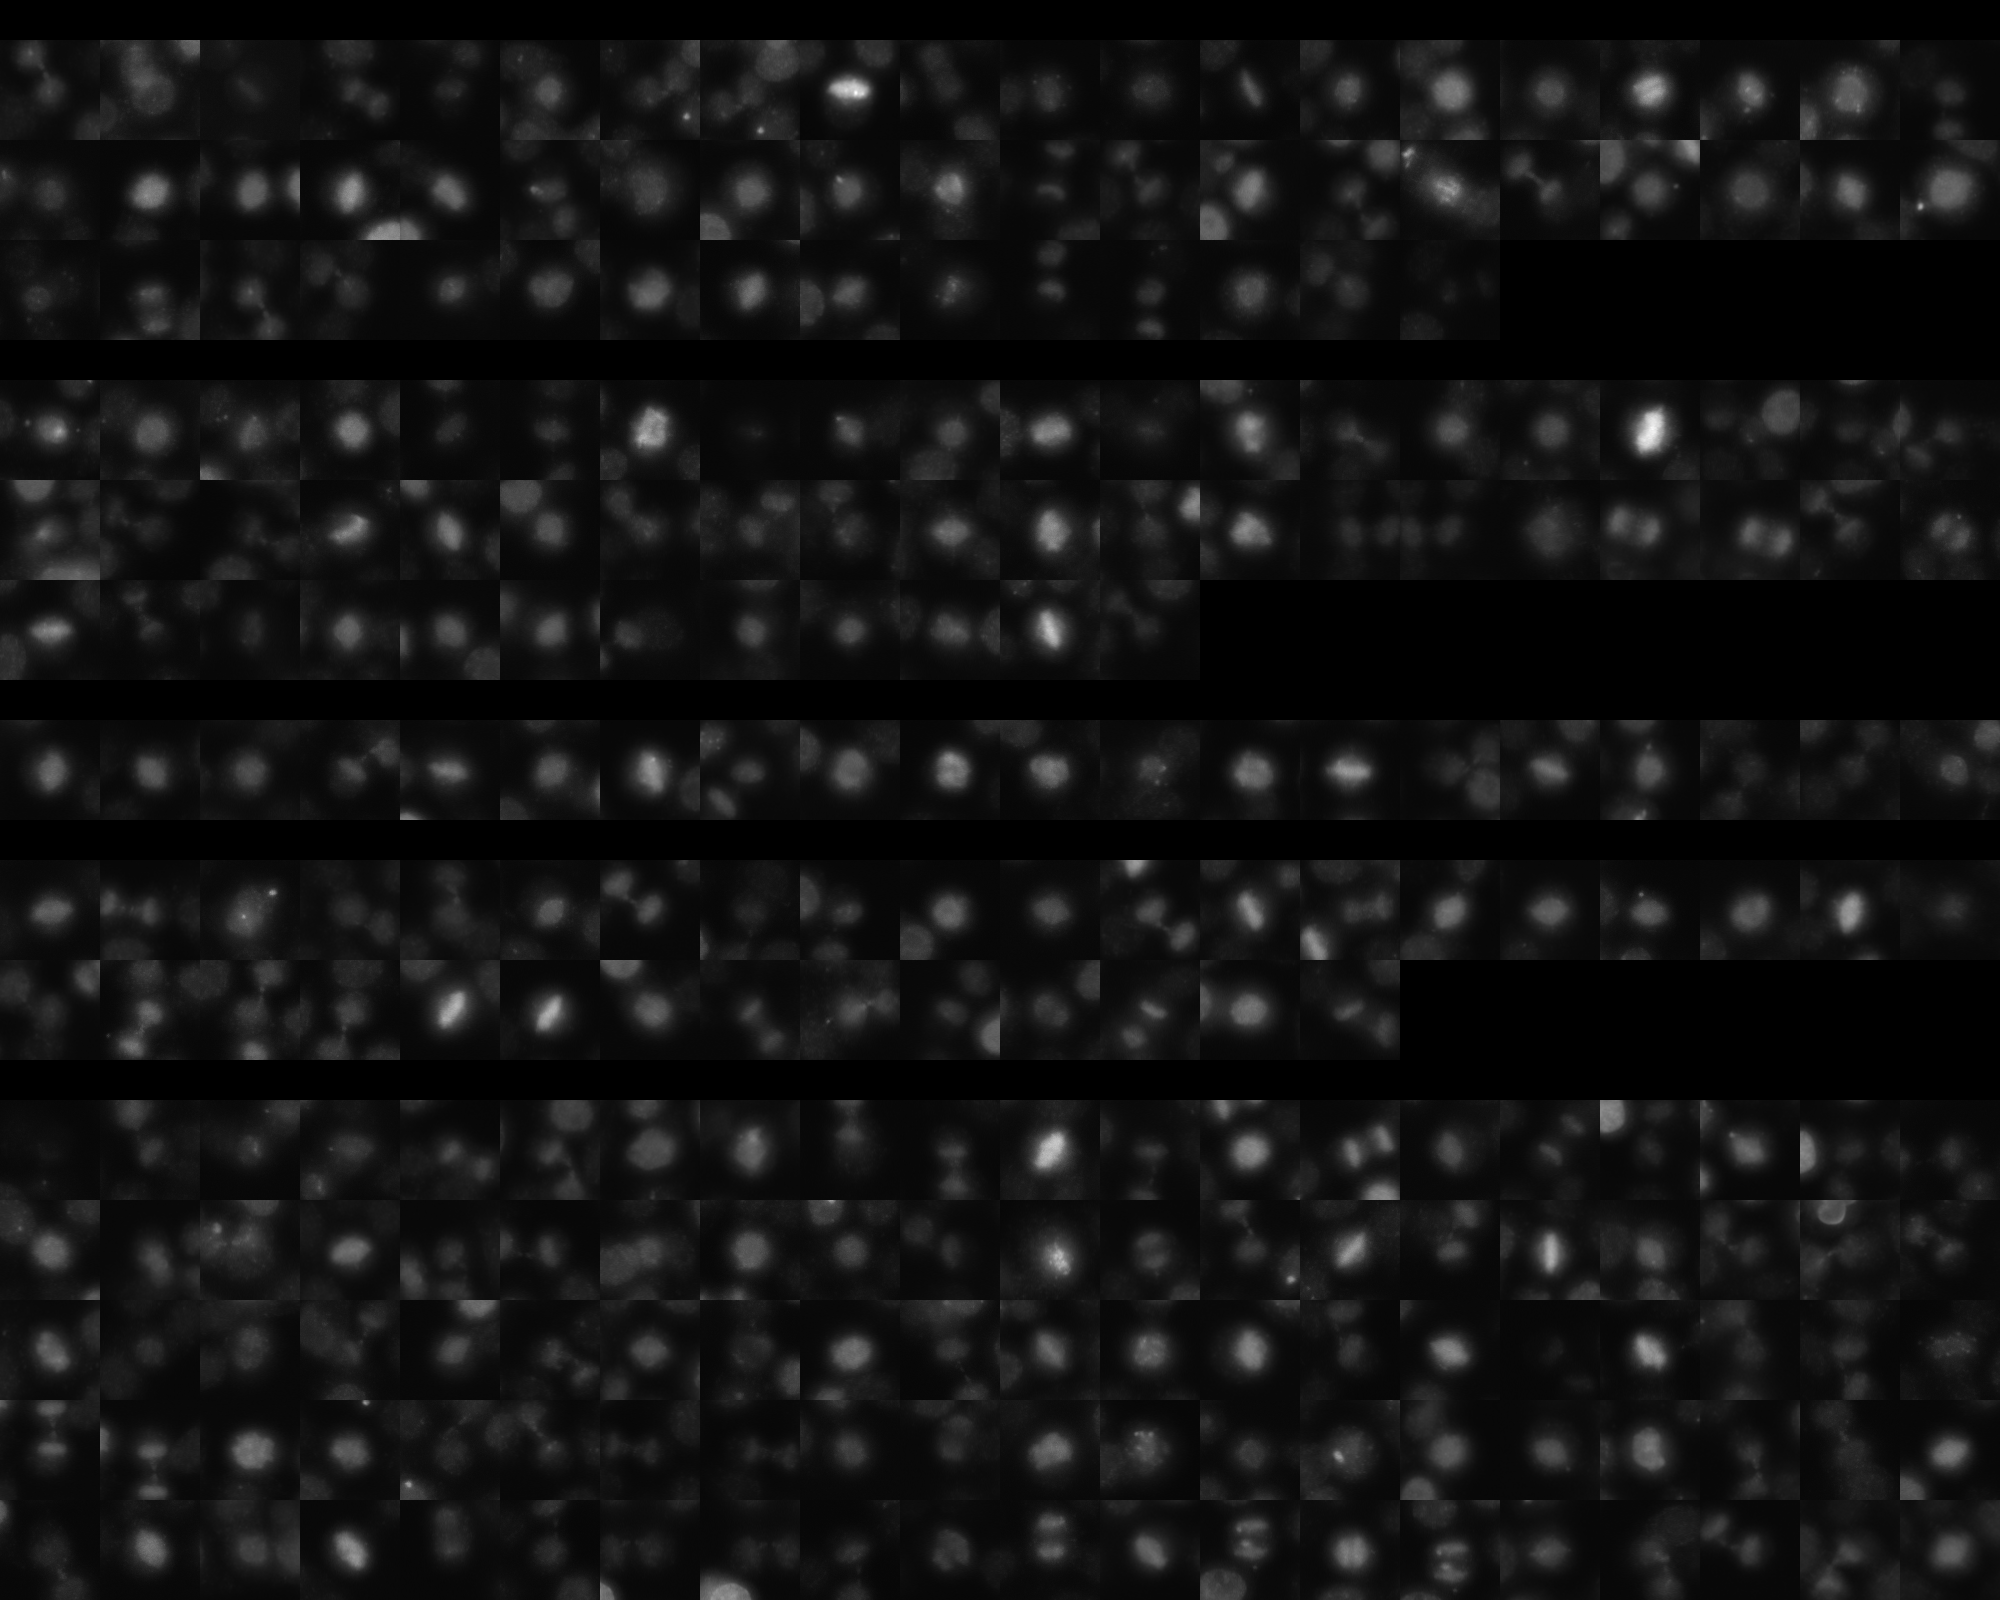
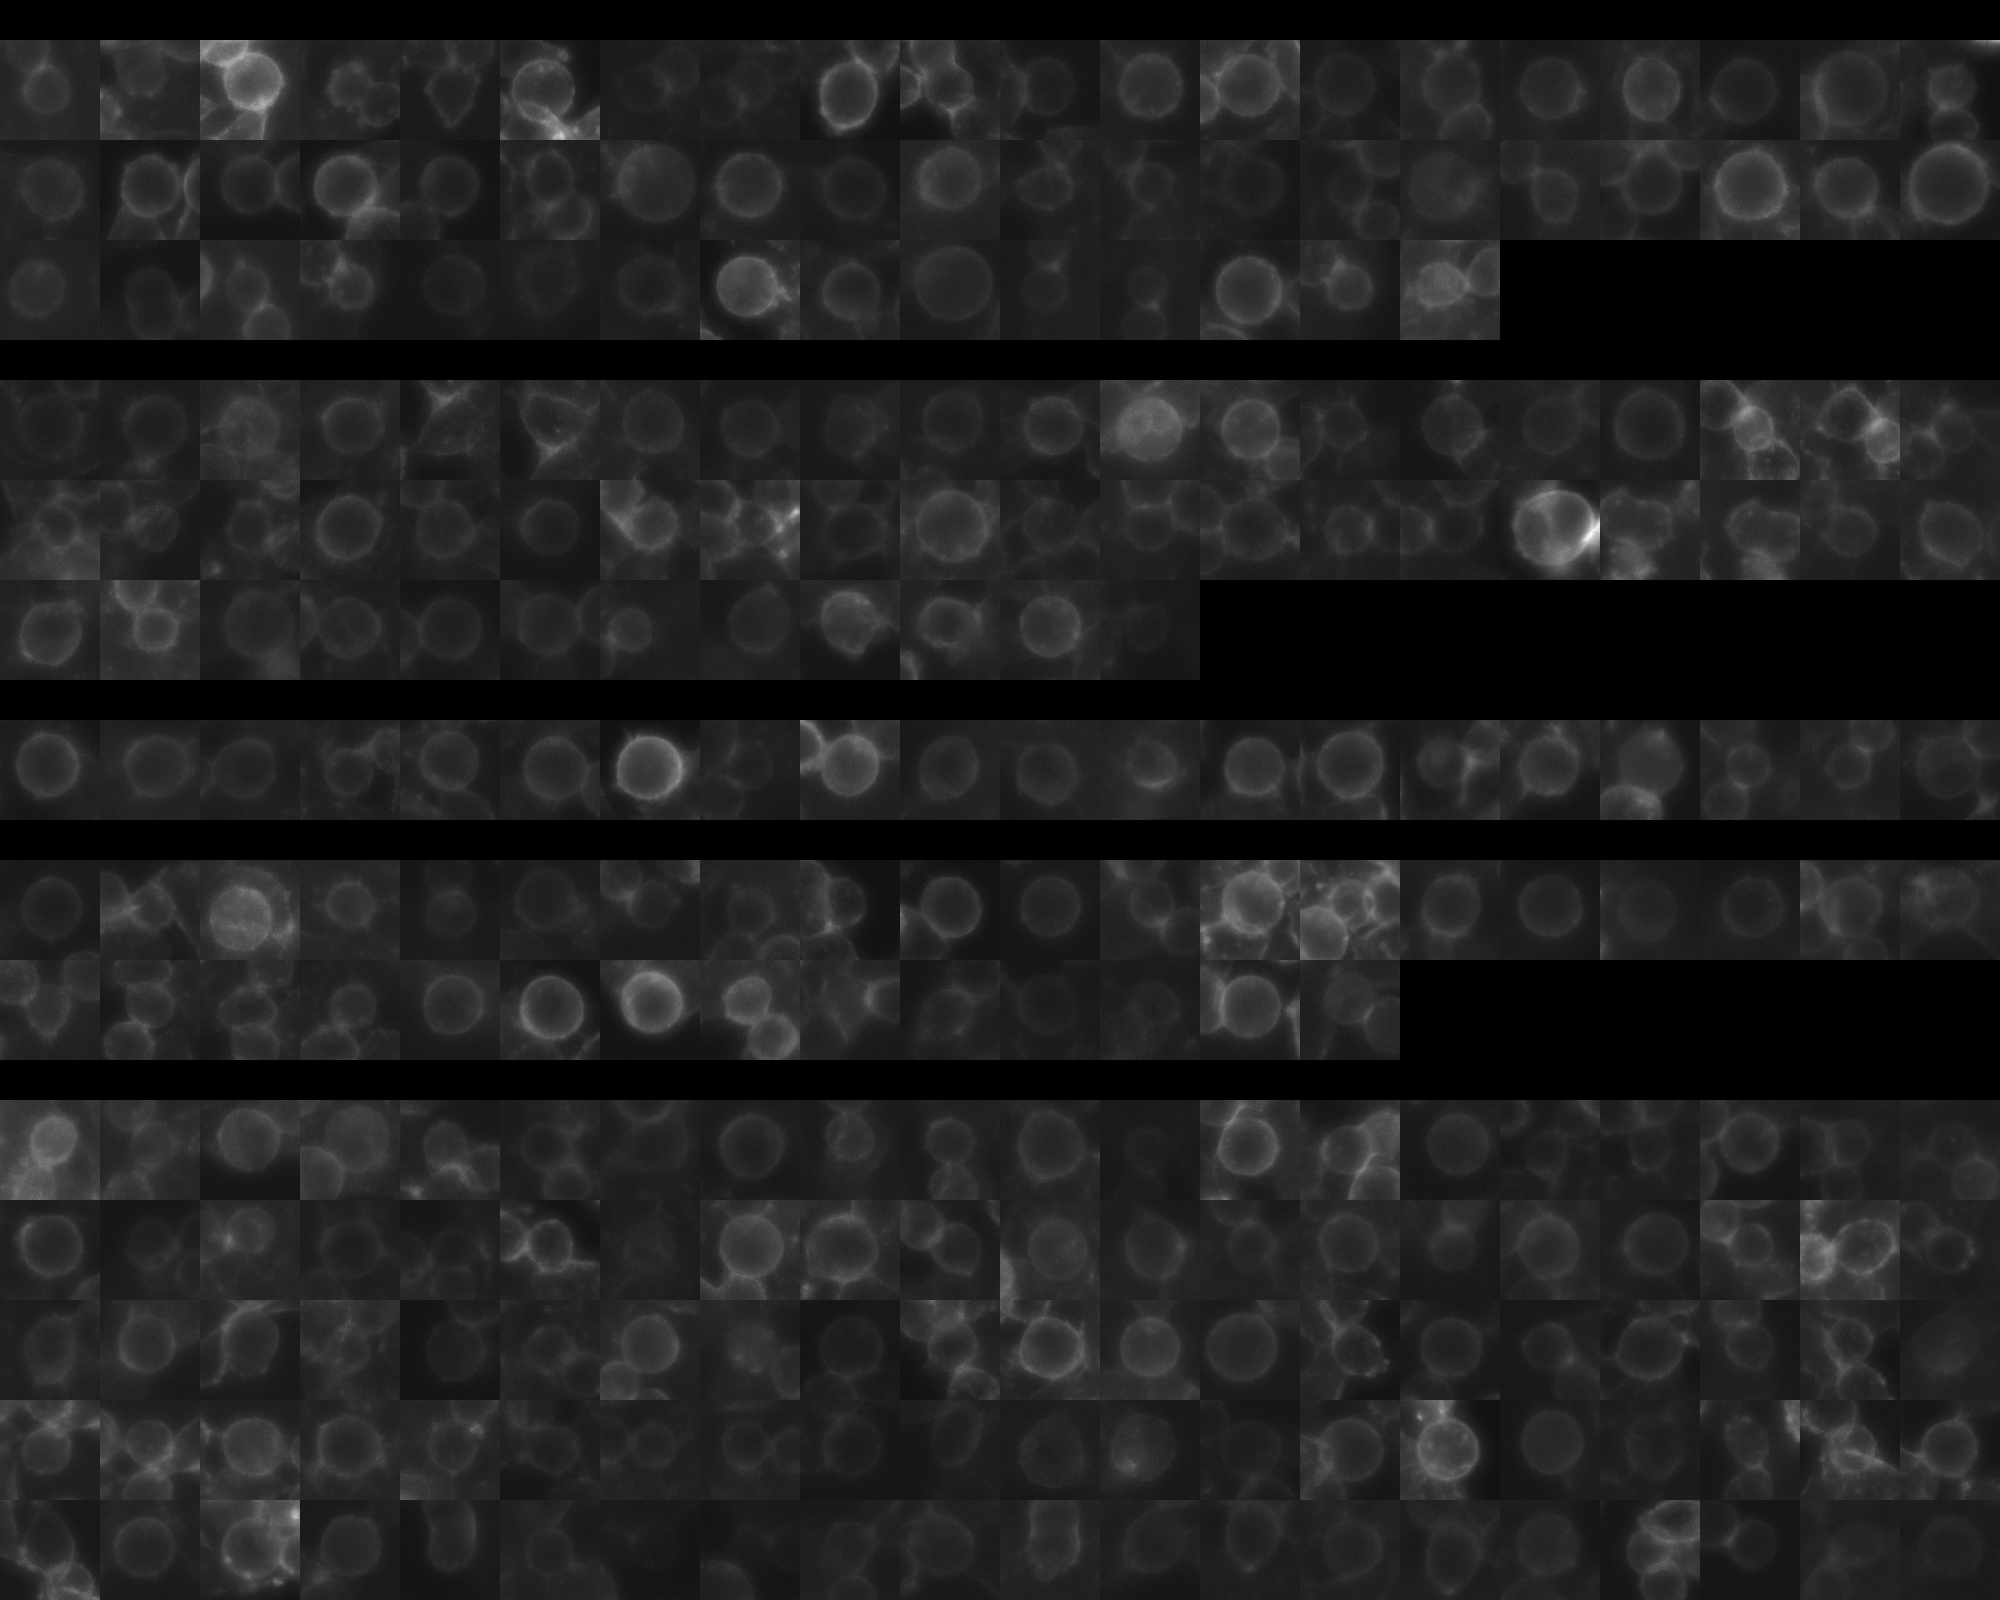
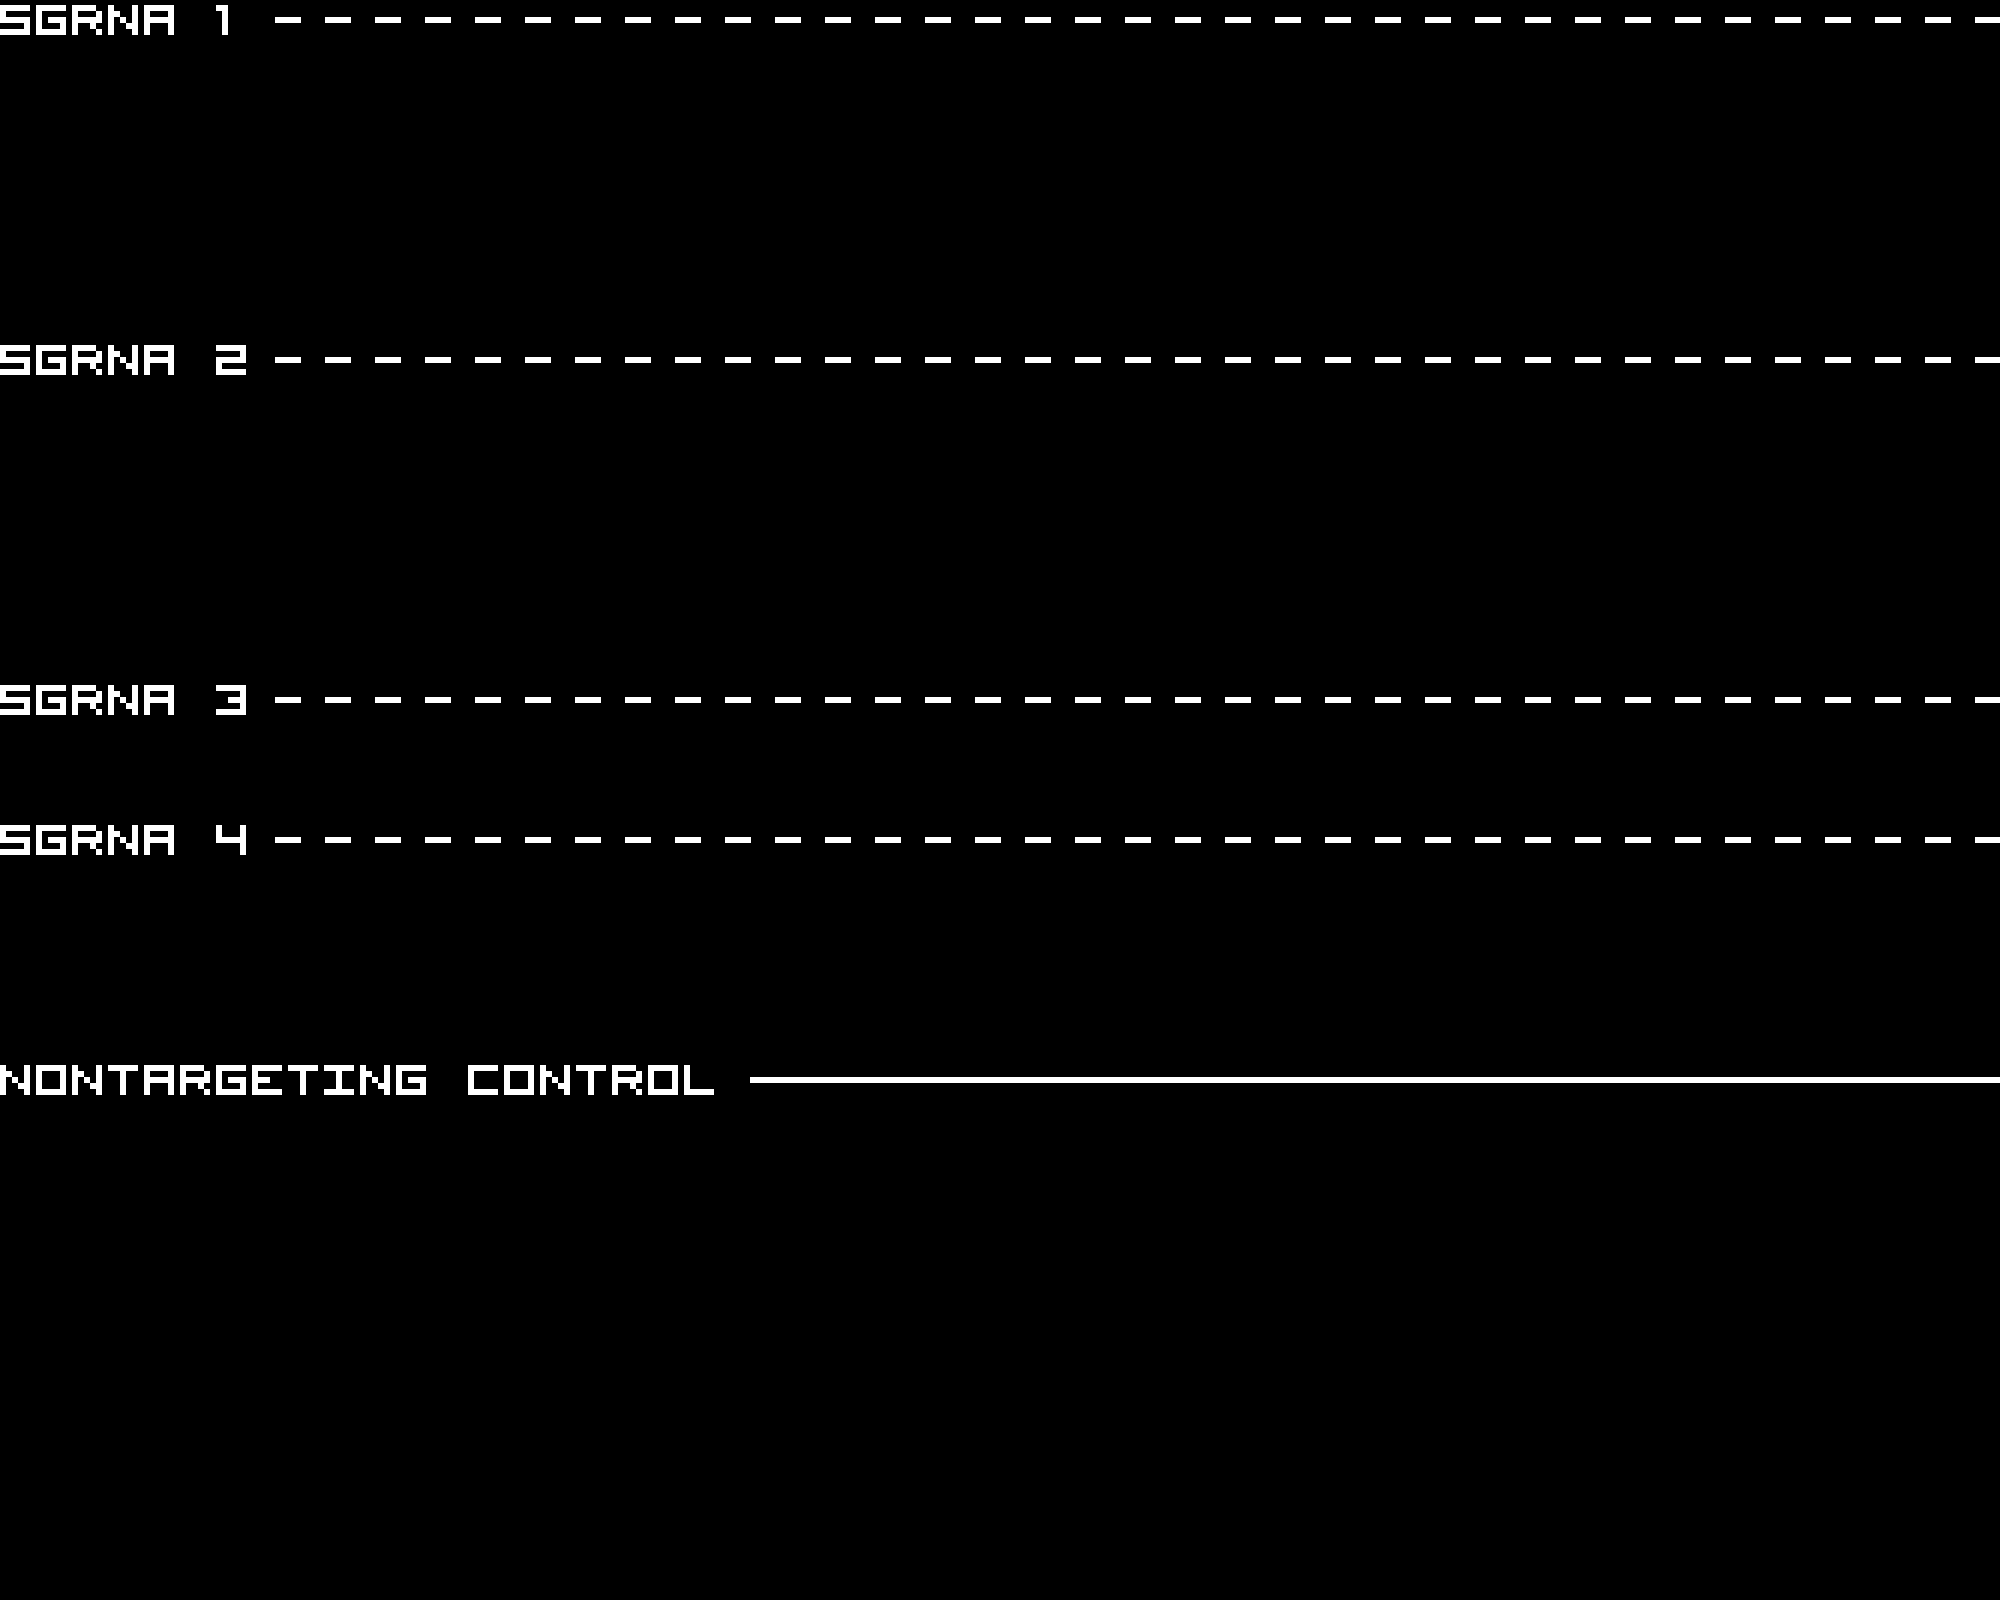
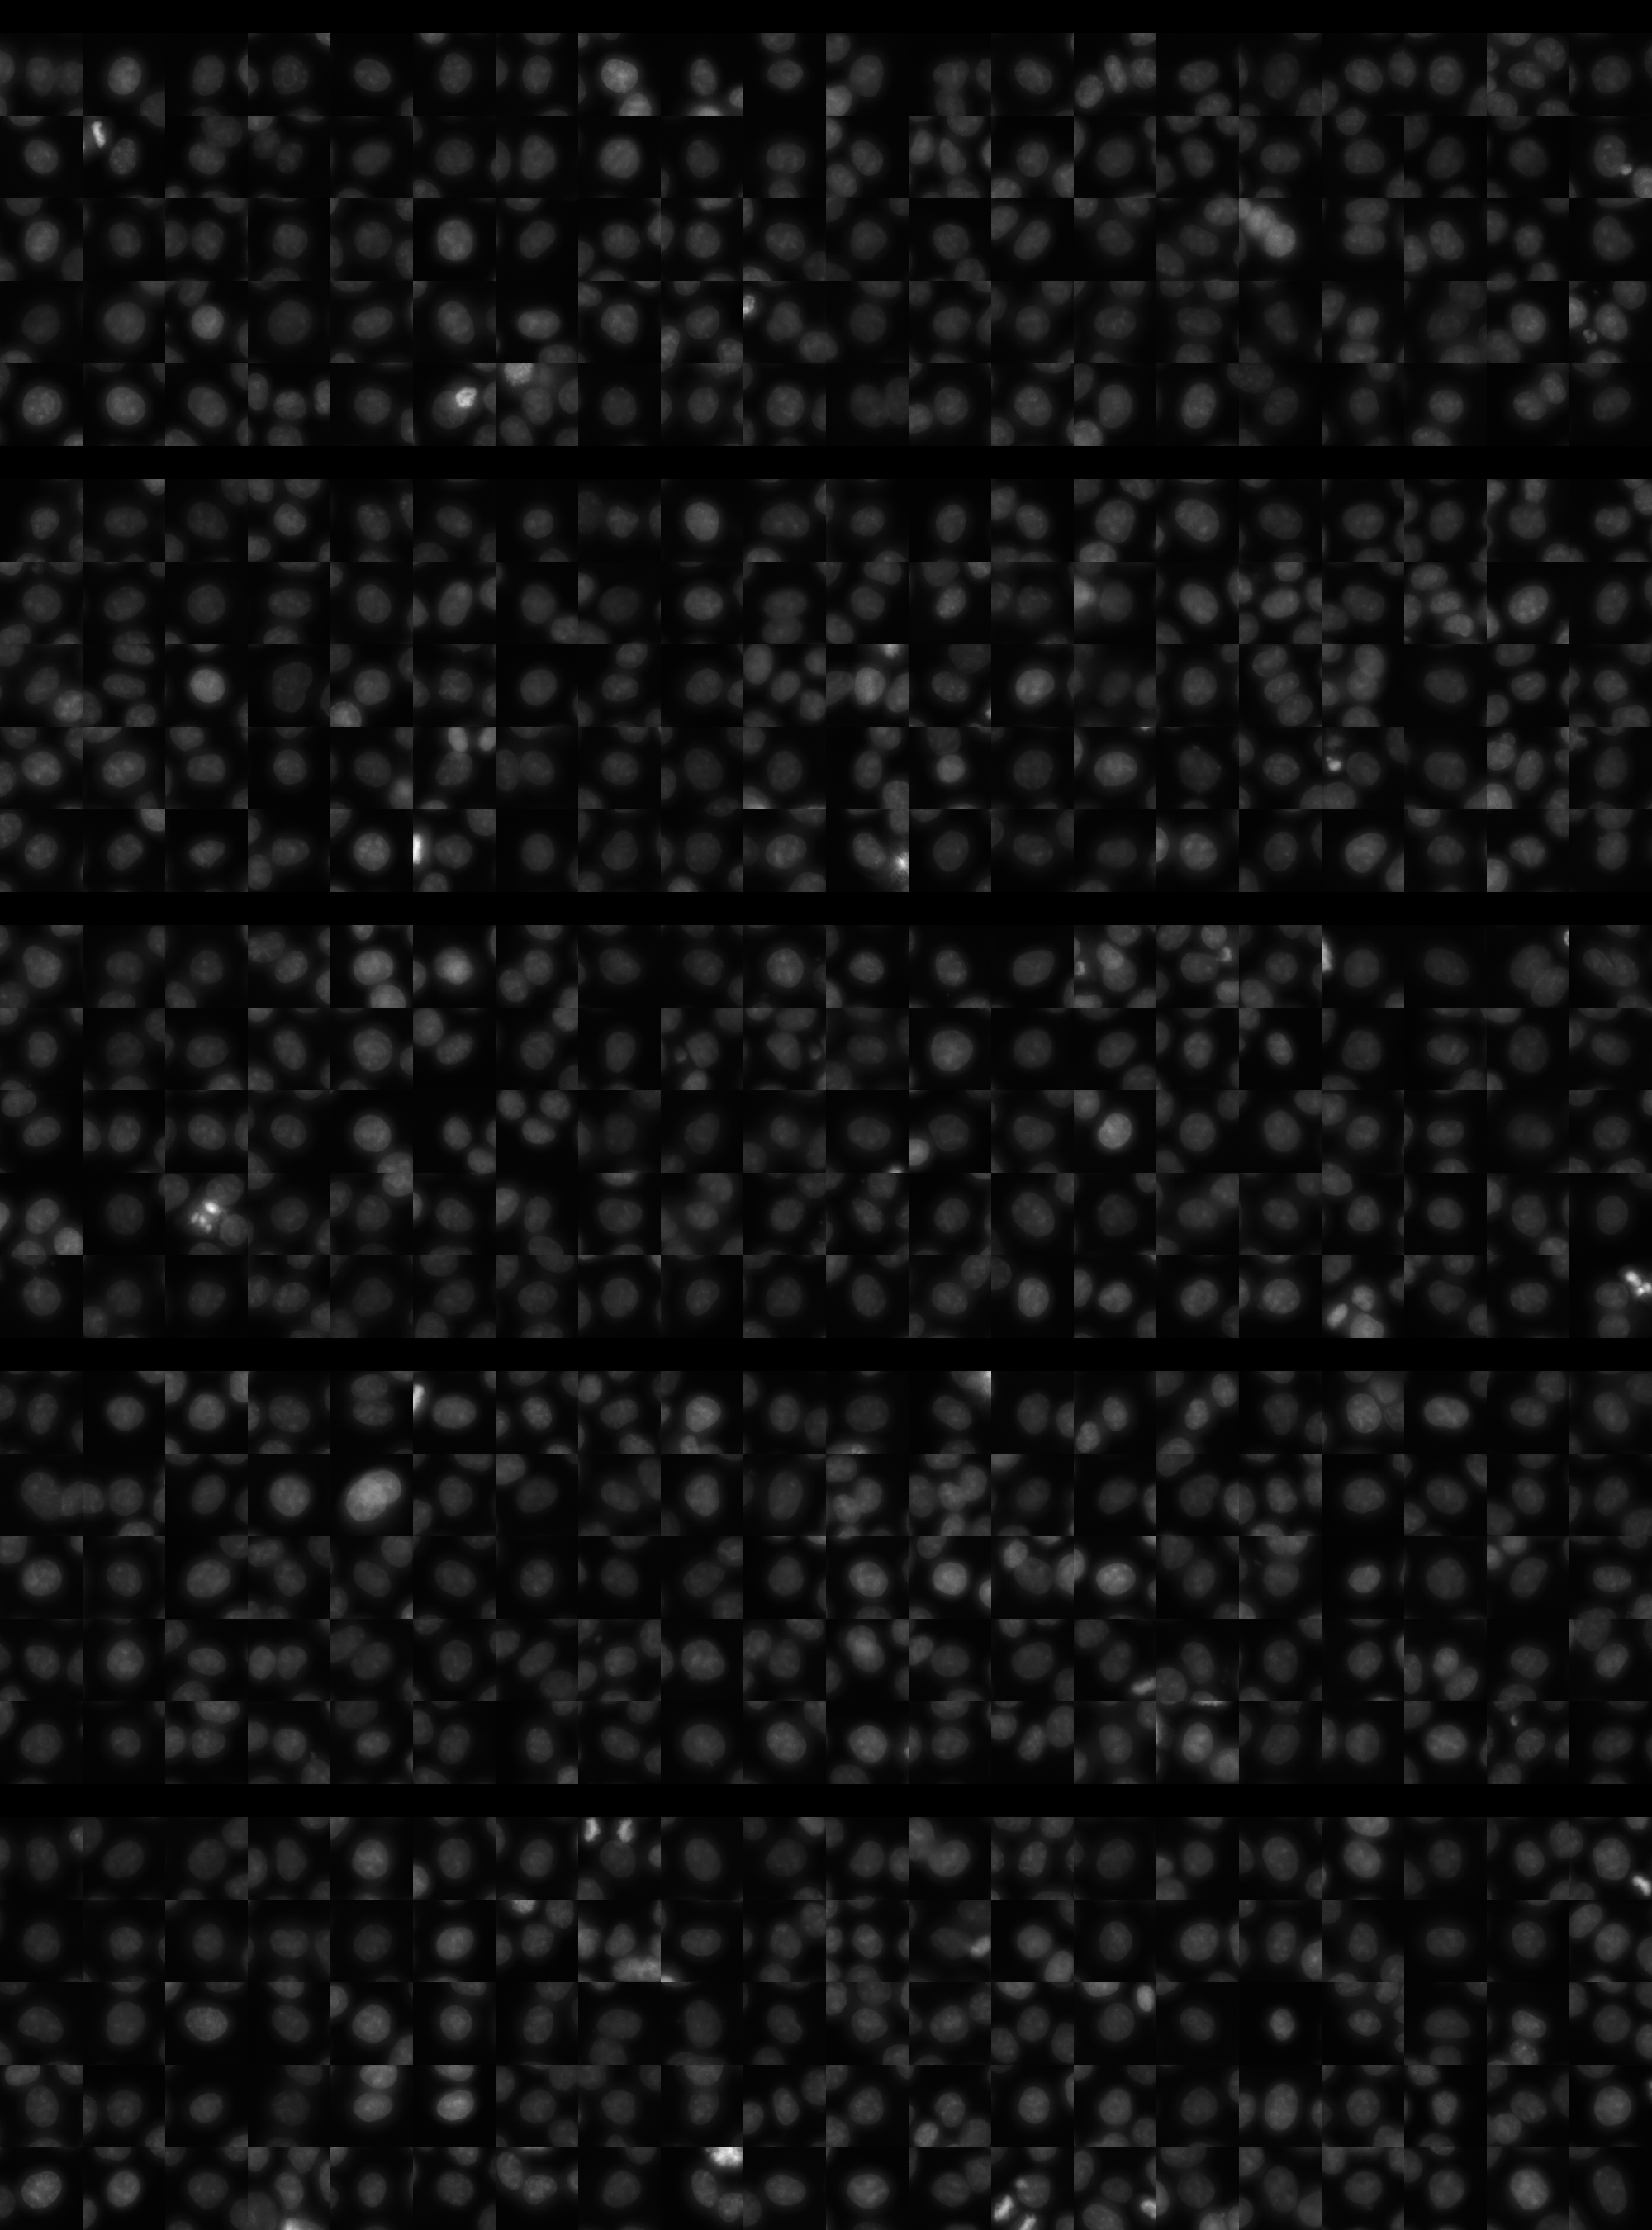
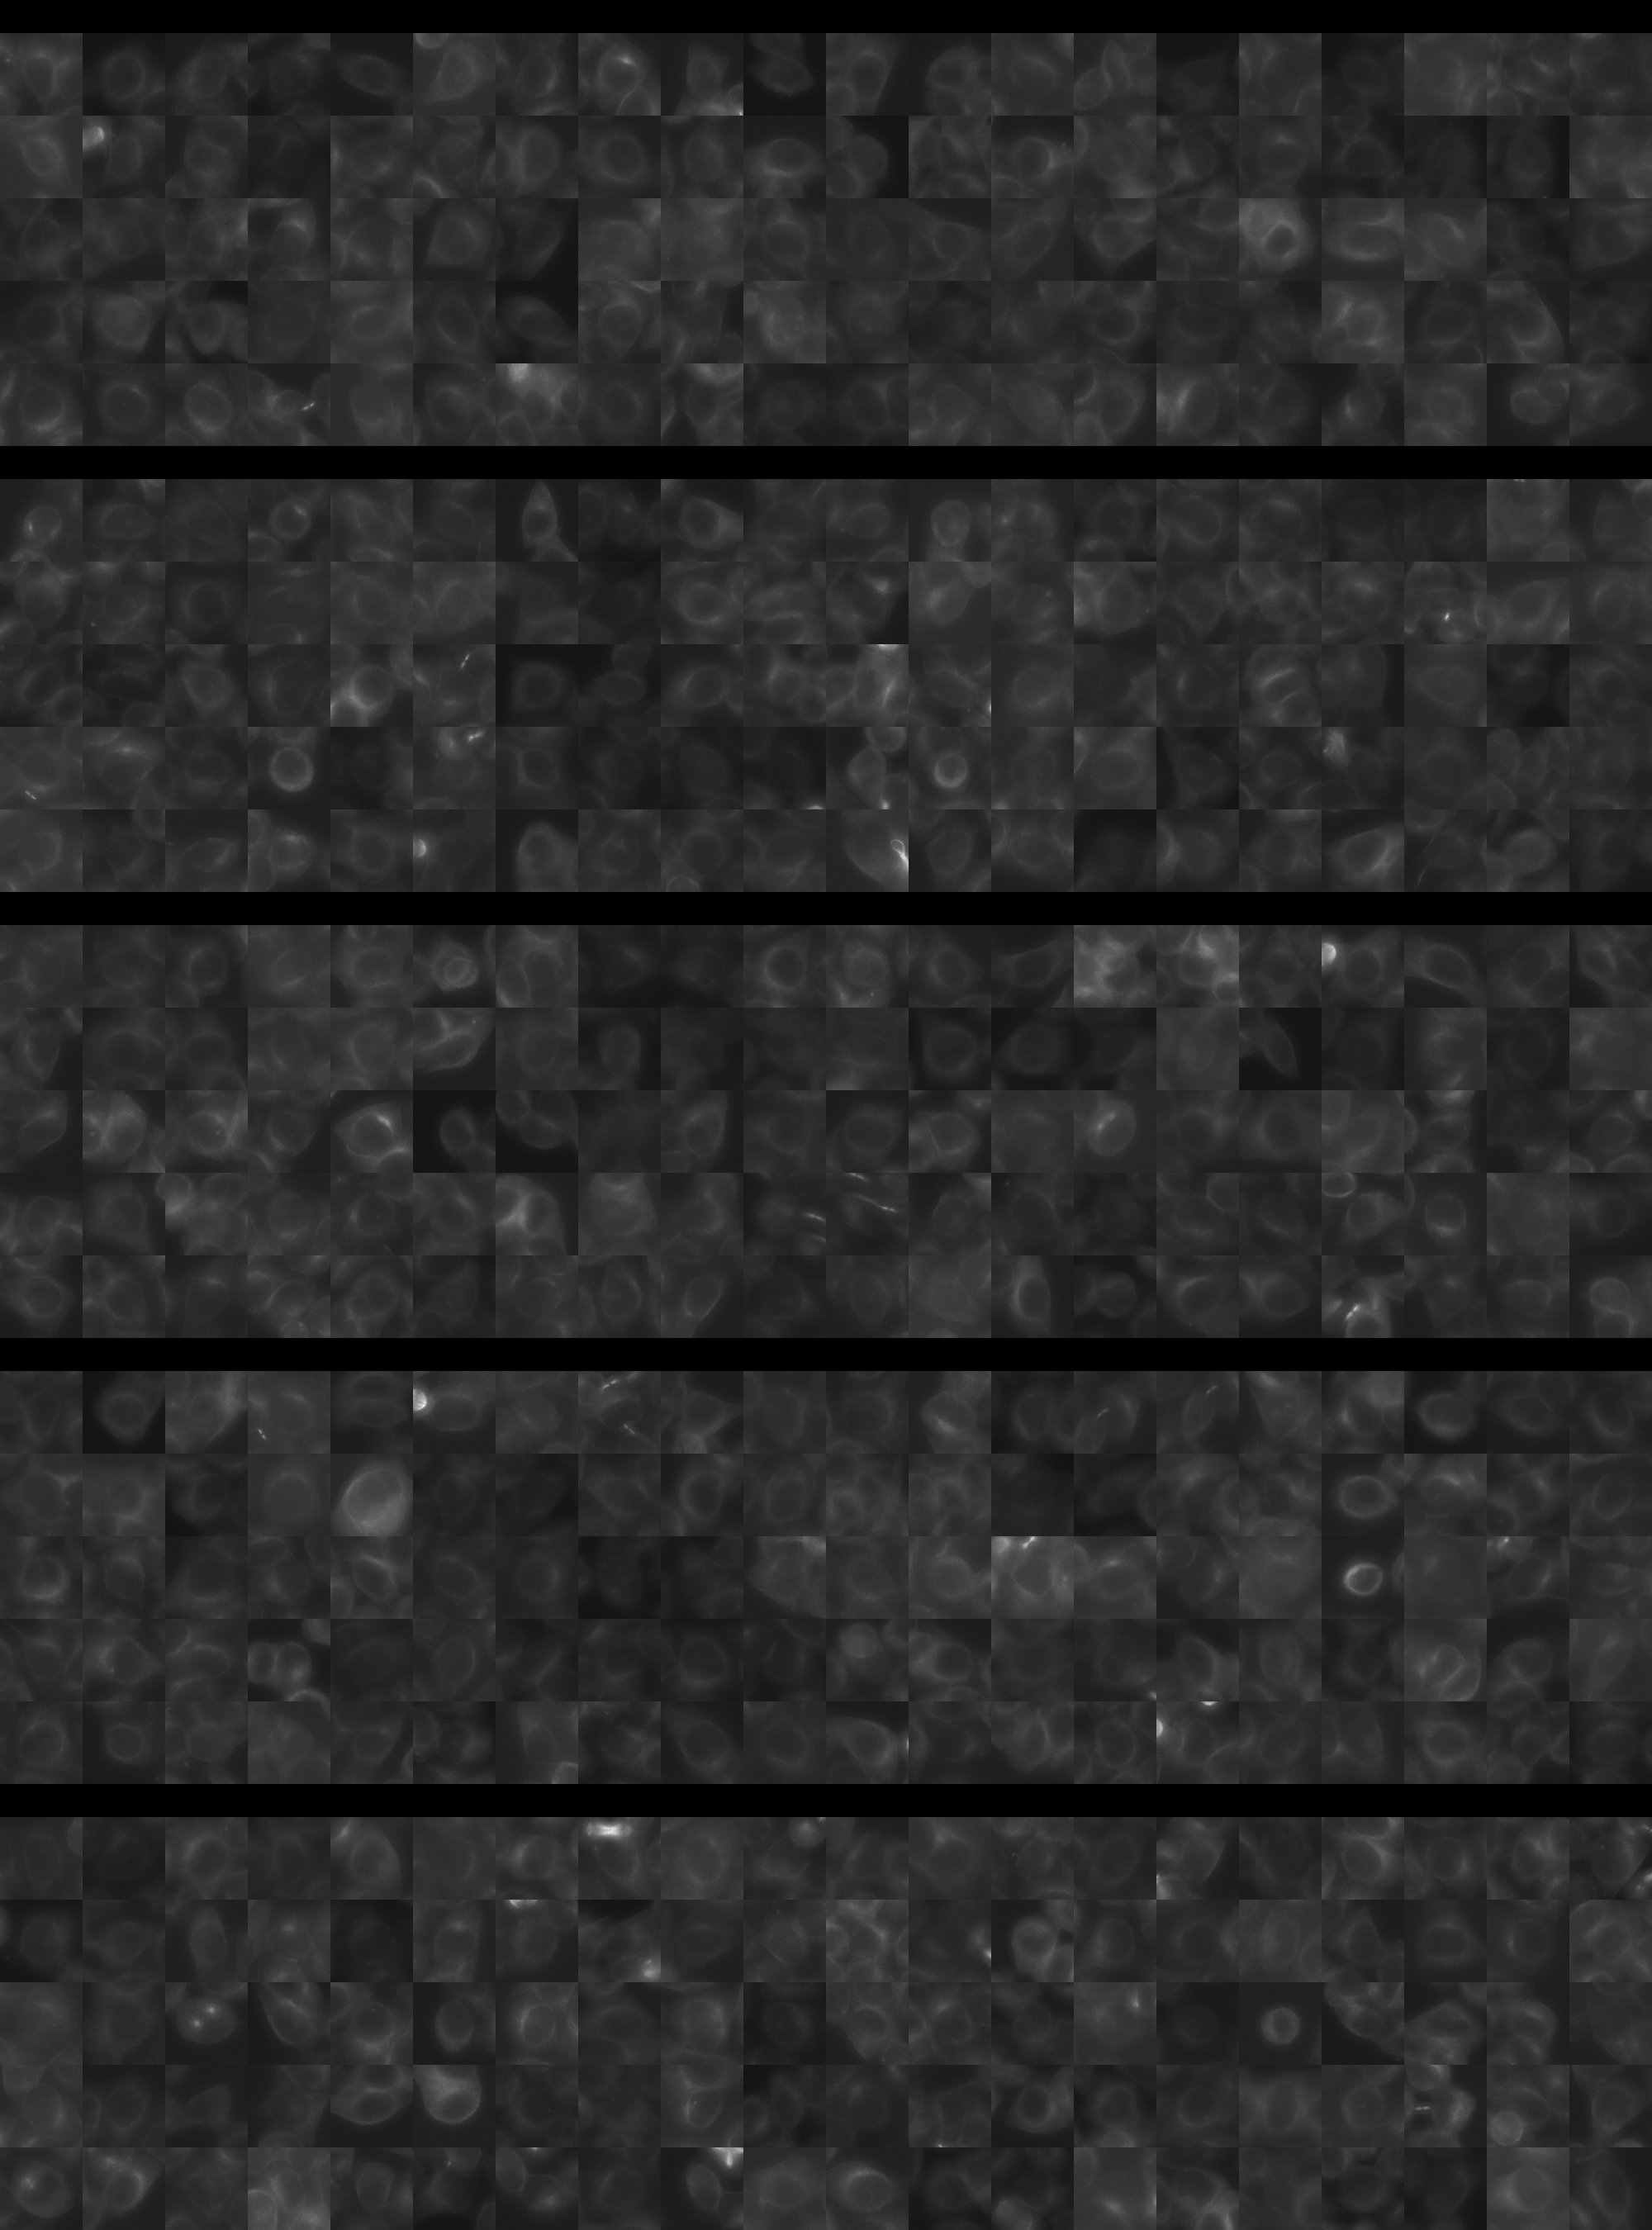
Each montage below shows randomly selected individual cell images for the same target gene separated by sgRNA, along with an example montage of cells expressing a non-targeting negative control sgRNA at the bottom. sgRNA labels in the montages correspond to the numbered sgRNA sequences in the gene info table above. The DNA (blue) and tubulin (green) channels are displayed by default, with gH2AX (grayscale) and actin (yellow) available using the check boxes. Channel brightness, contrast, and opacity are adjustable by clicking the arrow next to the channel name. When only one channel is selected, the display defaults to grayscale. Click the “Zoom” checkbox above the channel controls to enable image zooming (via scrolling) and panning (via click-and-drag).

The cell boxes displayed for this gene are square, 30.36 μm per side for the interphase montage and 30.36 μm per side for the mitotic montage.
Features

Interphase Score Rank FDR q-value
Nucleus DNA Integrated -2.516e-02 4230 of 5322 0.681
Nucleus DNA Mean -2.666e-02 2860 of 5322 0.608
Nucleus gH2AX Mean -1.004e-02 4746 of 5322 0.771
Nucleus DNA - gH2AX Correlation -2.207e-02 1461 of 5322 0.437
Nucleus Shape Area -8.280e-03 3575 of 5322 0.814
Nucleus Shape Eccentricity -8.529e-04 3410 of 5322 0.981
Nucleus Shape Form Factor 0.003 566 of 5322 0.843
Nucleus Shape Solidity -1.762e-02 1212 of 5322 0.652
Cell DNA Mass Displacement 0.032 2159 of 5322 0.623
Cell Tubulin Mean -4.621e-02 4230 of 5322 0.343
Cell Tubulin Mass Displacement 0.025 1521 of 5322 0.669
Cell Actin Mean -2.020e-02 3637 of 5322 0.769
Cell Tubulin - Actin Correlation -5.947e-02 5100 of 5322 0.130
Cell DNA - Tubulin Correlation 0.011 3410 of 5322 0.842
Cell Shape Area 0.003 3138 of 5322 0.953
Cell Shape Eccentricity 0.038 1003 of 5322 0.537
Mitotic Score Rank FDR q-value
Nucleus DNA Integrated 0.074 2856 of 5322 0.973
Nucleus DNA Mean 0.018 2625 of 5322 1.000
Nucleus DNA Mass Displacement 0.079 2244 of 5322 0.999
Nucleus DNA Mean Frac 3 0.015 2894 of 5322 1.000
Nucleus gH2AX Mean 0.023 2622 of 5322 1.000
Nucleus gH2AX Mean Frac 0 0.109 885 of 5322 1.000
Nucleus Tubulin Mean Frac 0 0.050 2743 of 5322 0.999
Nucleus Tubulin Mean Edge 0.232 580 of 5322 0.969
Nucleus Tubulin Std Edge 0.223 364 of 5322 0.999
Nucleus Shape Area -1.196e-02 4072 of 5322 0.990
Nucleus Shape Eccentricity -1.147e-01 3762 of 5322 1.000
Nucleus Shape Form Factor 0.049 806 of 5322 0.998
Cell Tubulin Mean 0.045 2879 of 5322 0.997
Cell Tubulin Mean Frac 3 -1.051e-01 2992 of 5322 0.999
Cell Actin Mean 0.151 1285 of 5322 0.997
Cell Shape Area 0.055 3220 of 5322 0.998
( Reset Zoom )
Brightness
Contrast
Opacity
Brightness
Contrast
Opacity
Brightness
Contrast
Opacity
Brightness
Contrast
Opacity
Brightness
Contrast
Opacity

( Reset Zoom )
Brightness
Contrast
Opacity
Brightness
Contrast
Opacity
Brightness
Contrast
Opacity
Brightness
Contrast
Opacity
Brightness
Contrast
Opacity

MIT Central Accessability