VKORC1L1

Gene symbol: VKORC1L1
Gene: 154807
Uniprot Function: Involved in vitamin K metabolism. Can reduce inactive vitamin K 2,3-epoxide to active vitamin K (in vitro), and may contribute to vitamin K-mediated protection against oxidative stress. Plays a role in vitamin K-dependent gamma-carboxylation of Glu residues in target proteins.
Mitotic Index 0.0207
Interphase Cluster: #104 (23 genes)
Mitotic Cluster: #108 (23 genes)
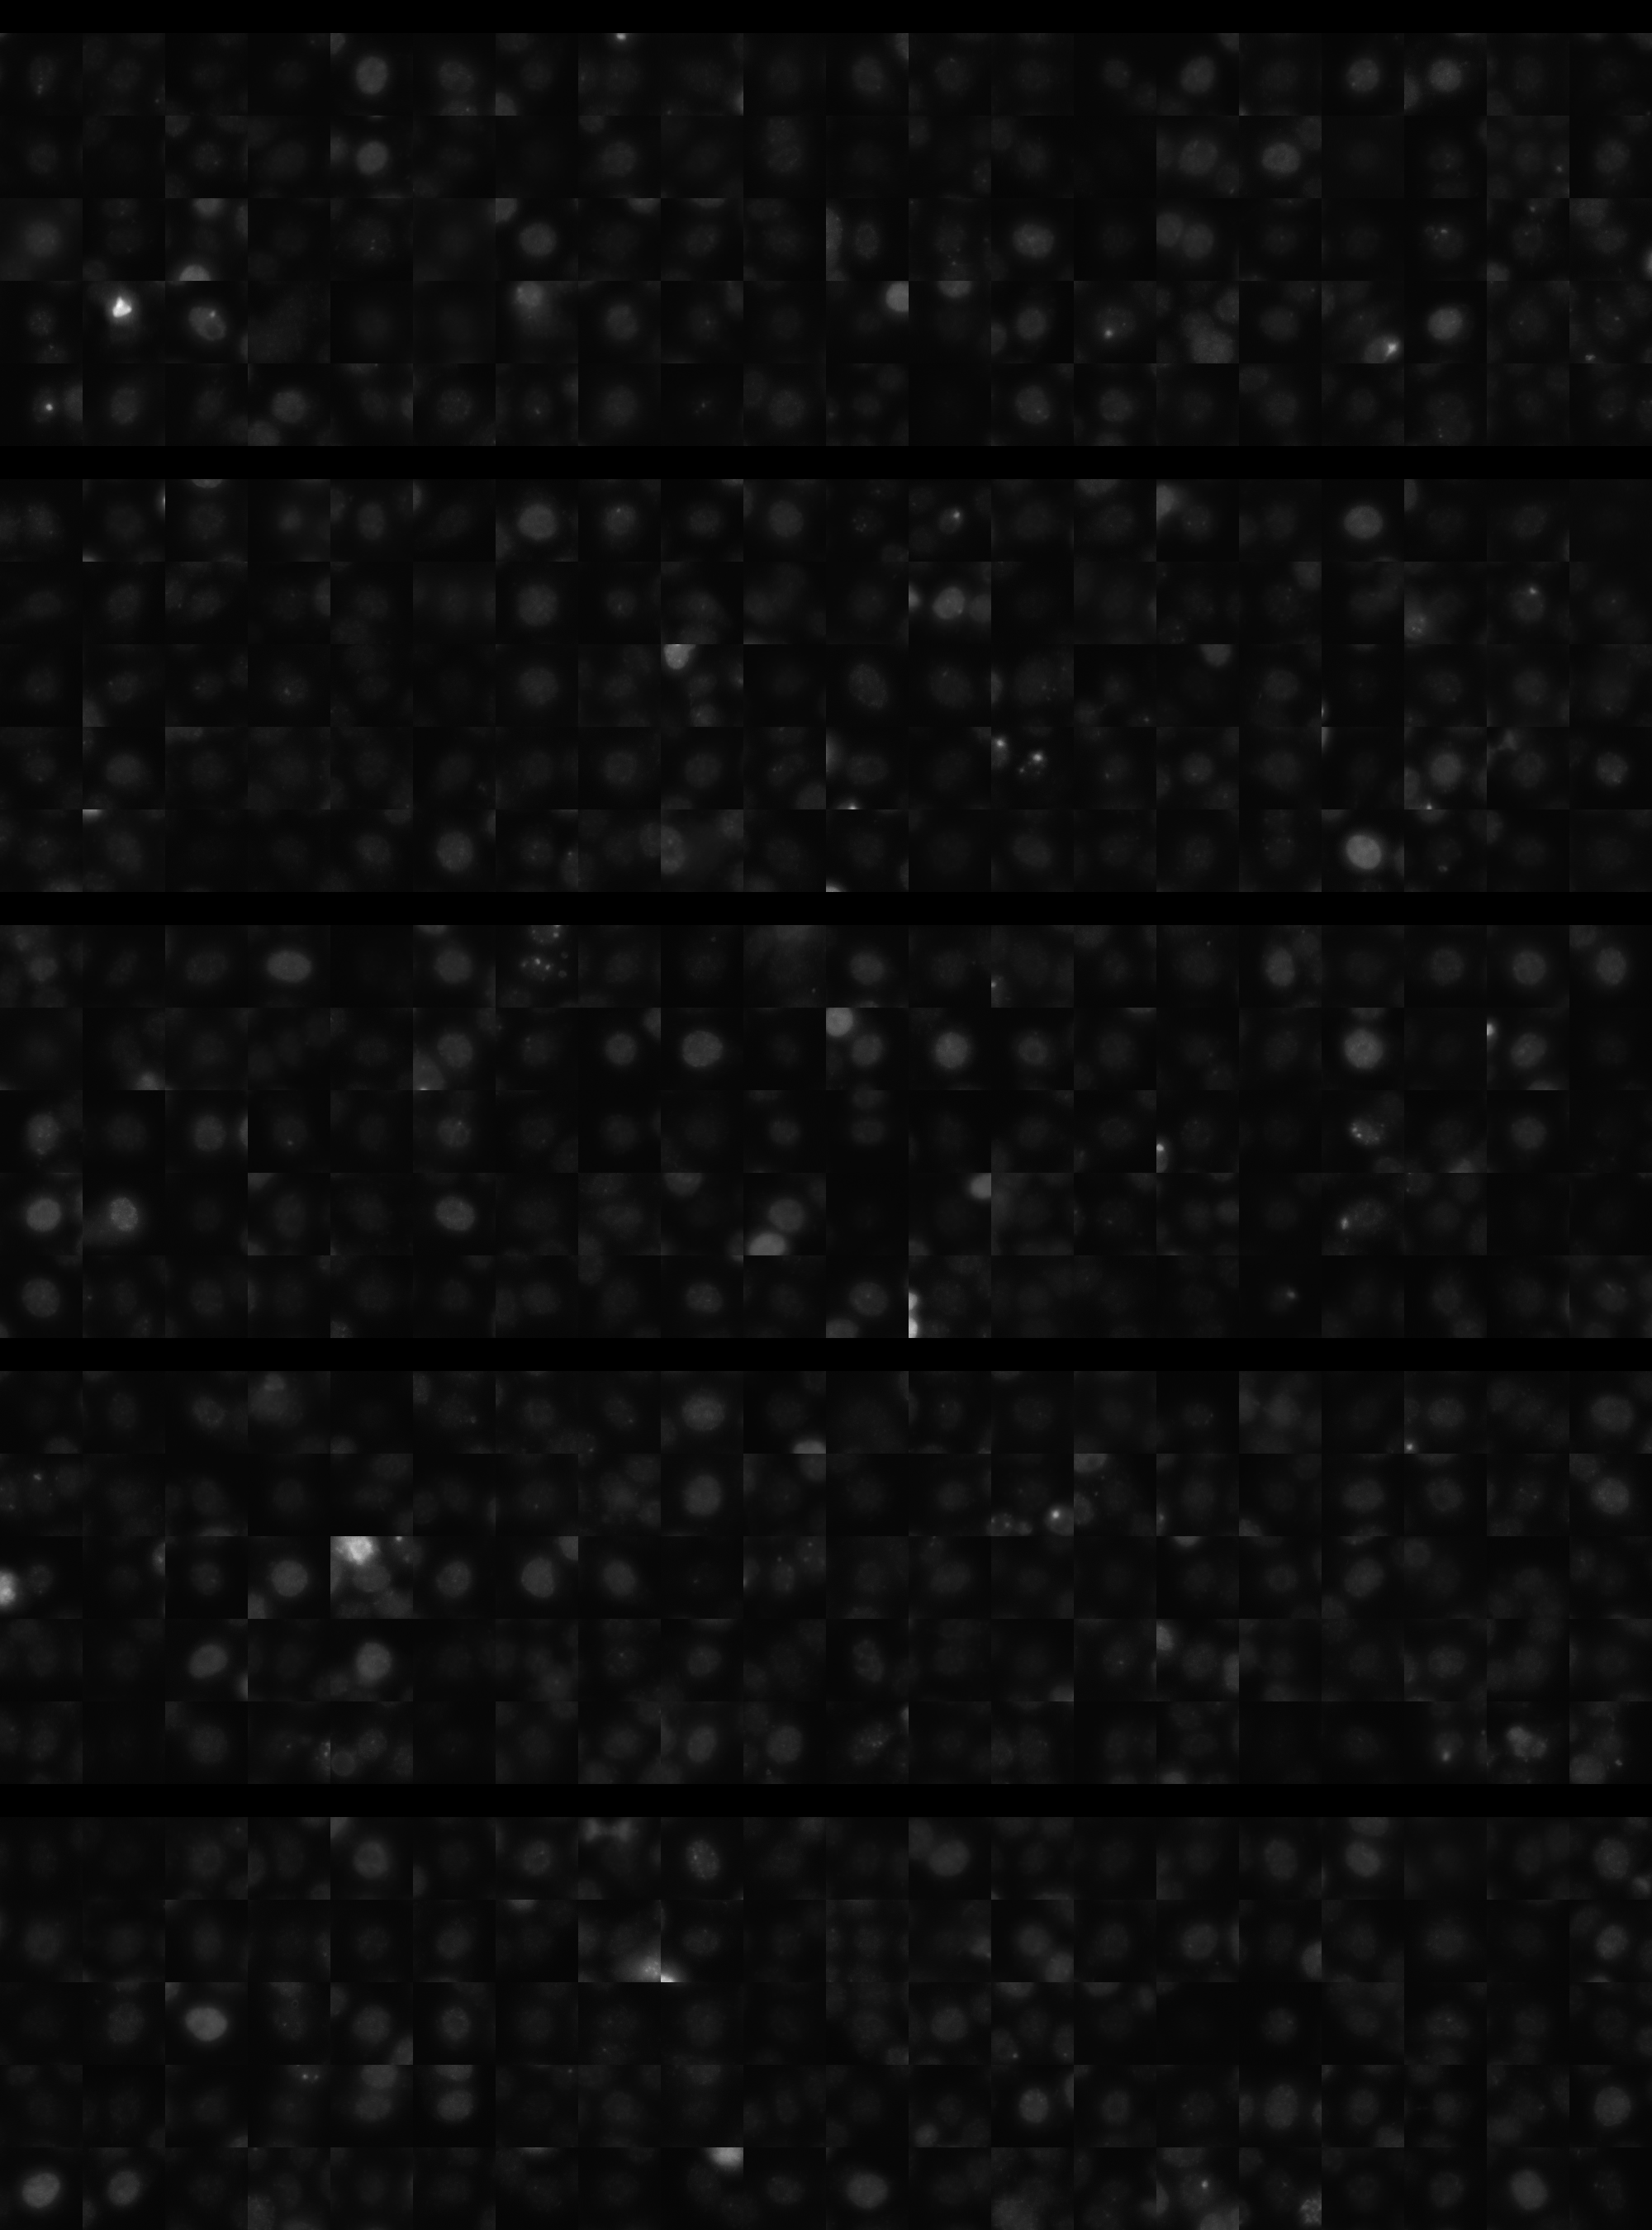
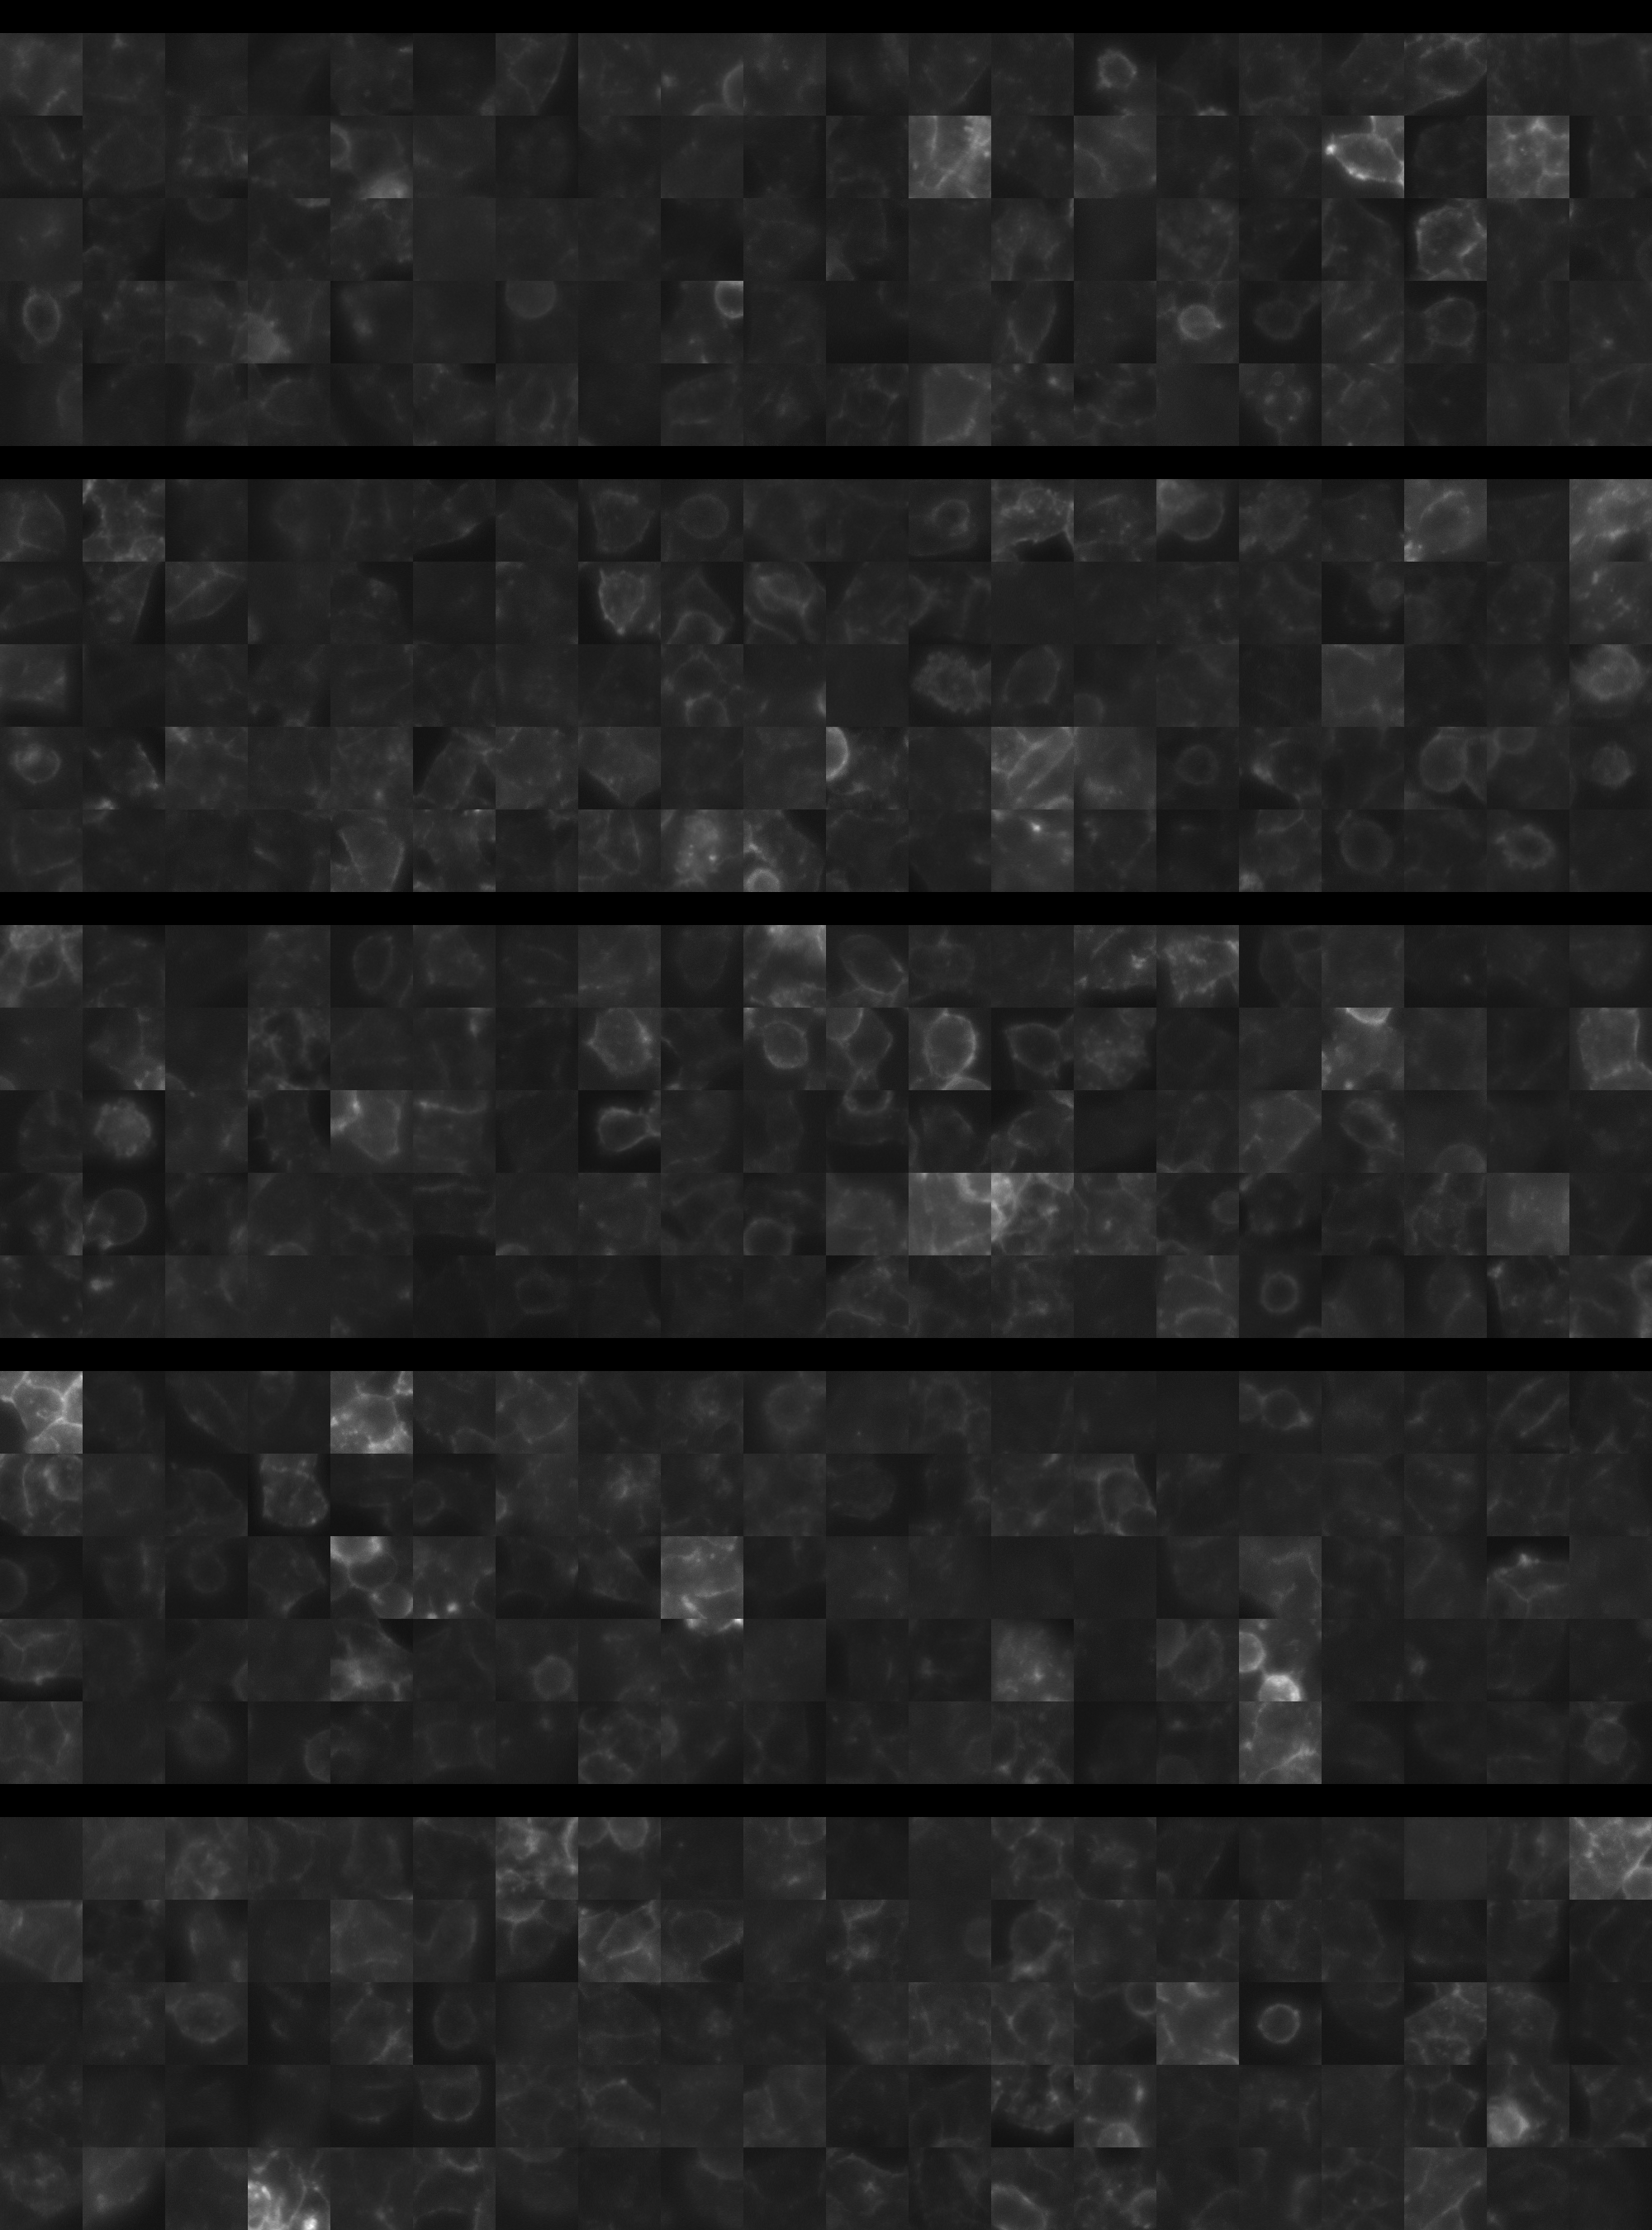
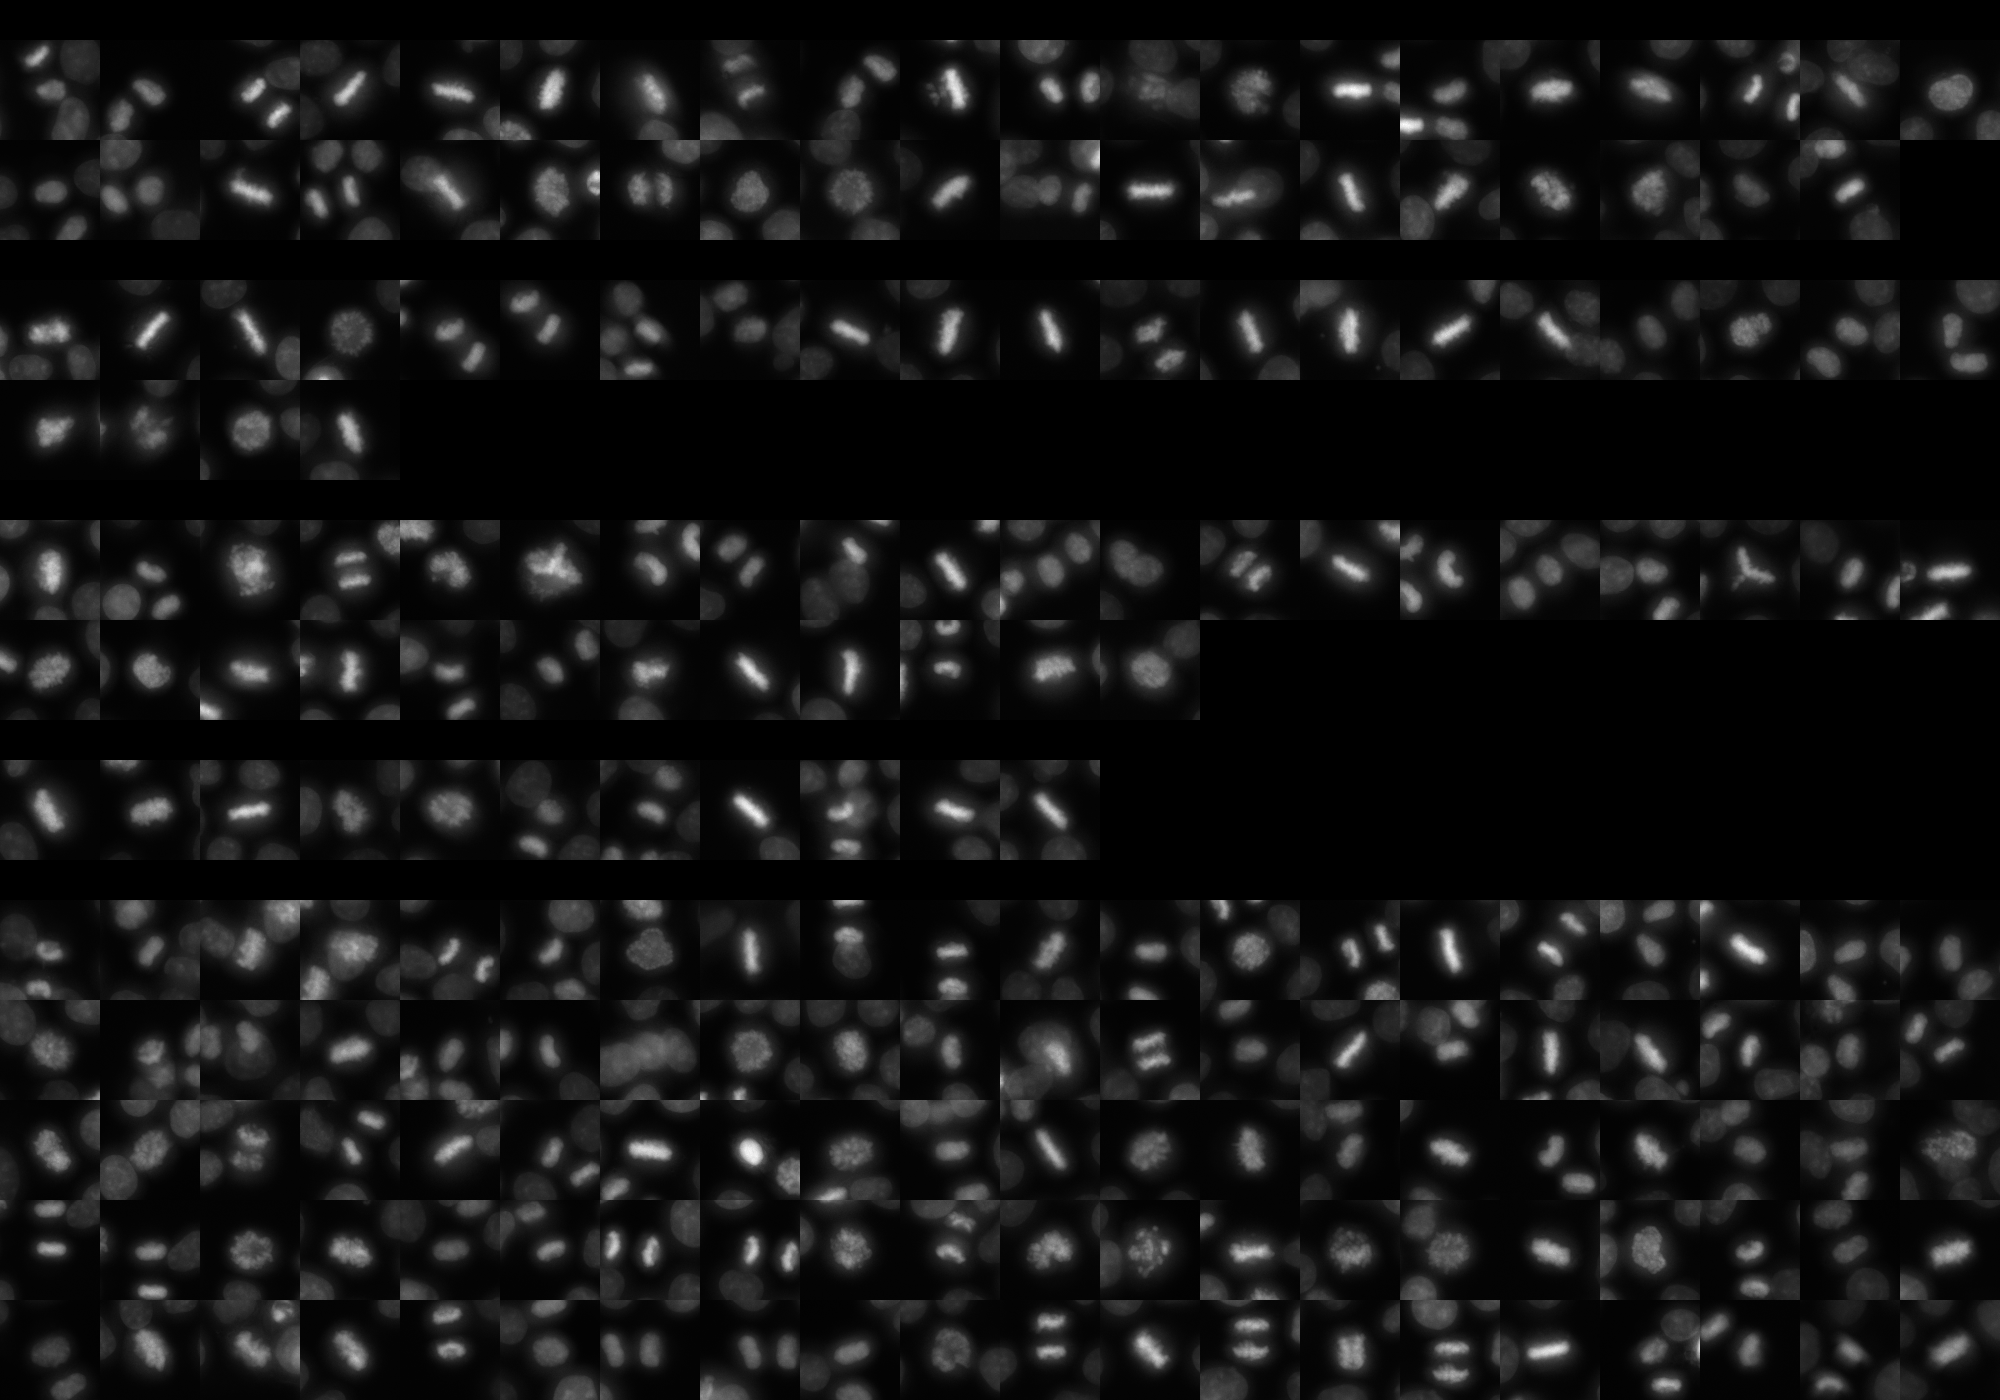
sgRNA 1: AGGCATGACAGCAAGCGCTG (interphase cells: 1773, mitotic cells: 39)
sgRNA 2: GCGGCGGAGCACTTCACCCA (interphase cells: 1228, mitotic cells: 24)
sgRNA 3: GCTCCTTCTCCCGCTCCACG (interphase cells: 1369, mitotic cells: 32)
sgRNA 4: TGCTAAGAGTGTCGGTGCCG (interphase cells: 653, mitotic cells: 11)

Interphase Cluster

Mitotic Cluster

Overview

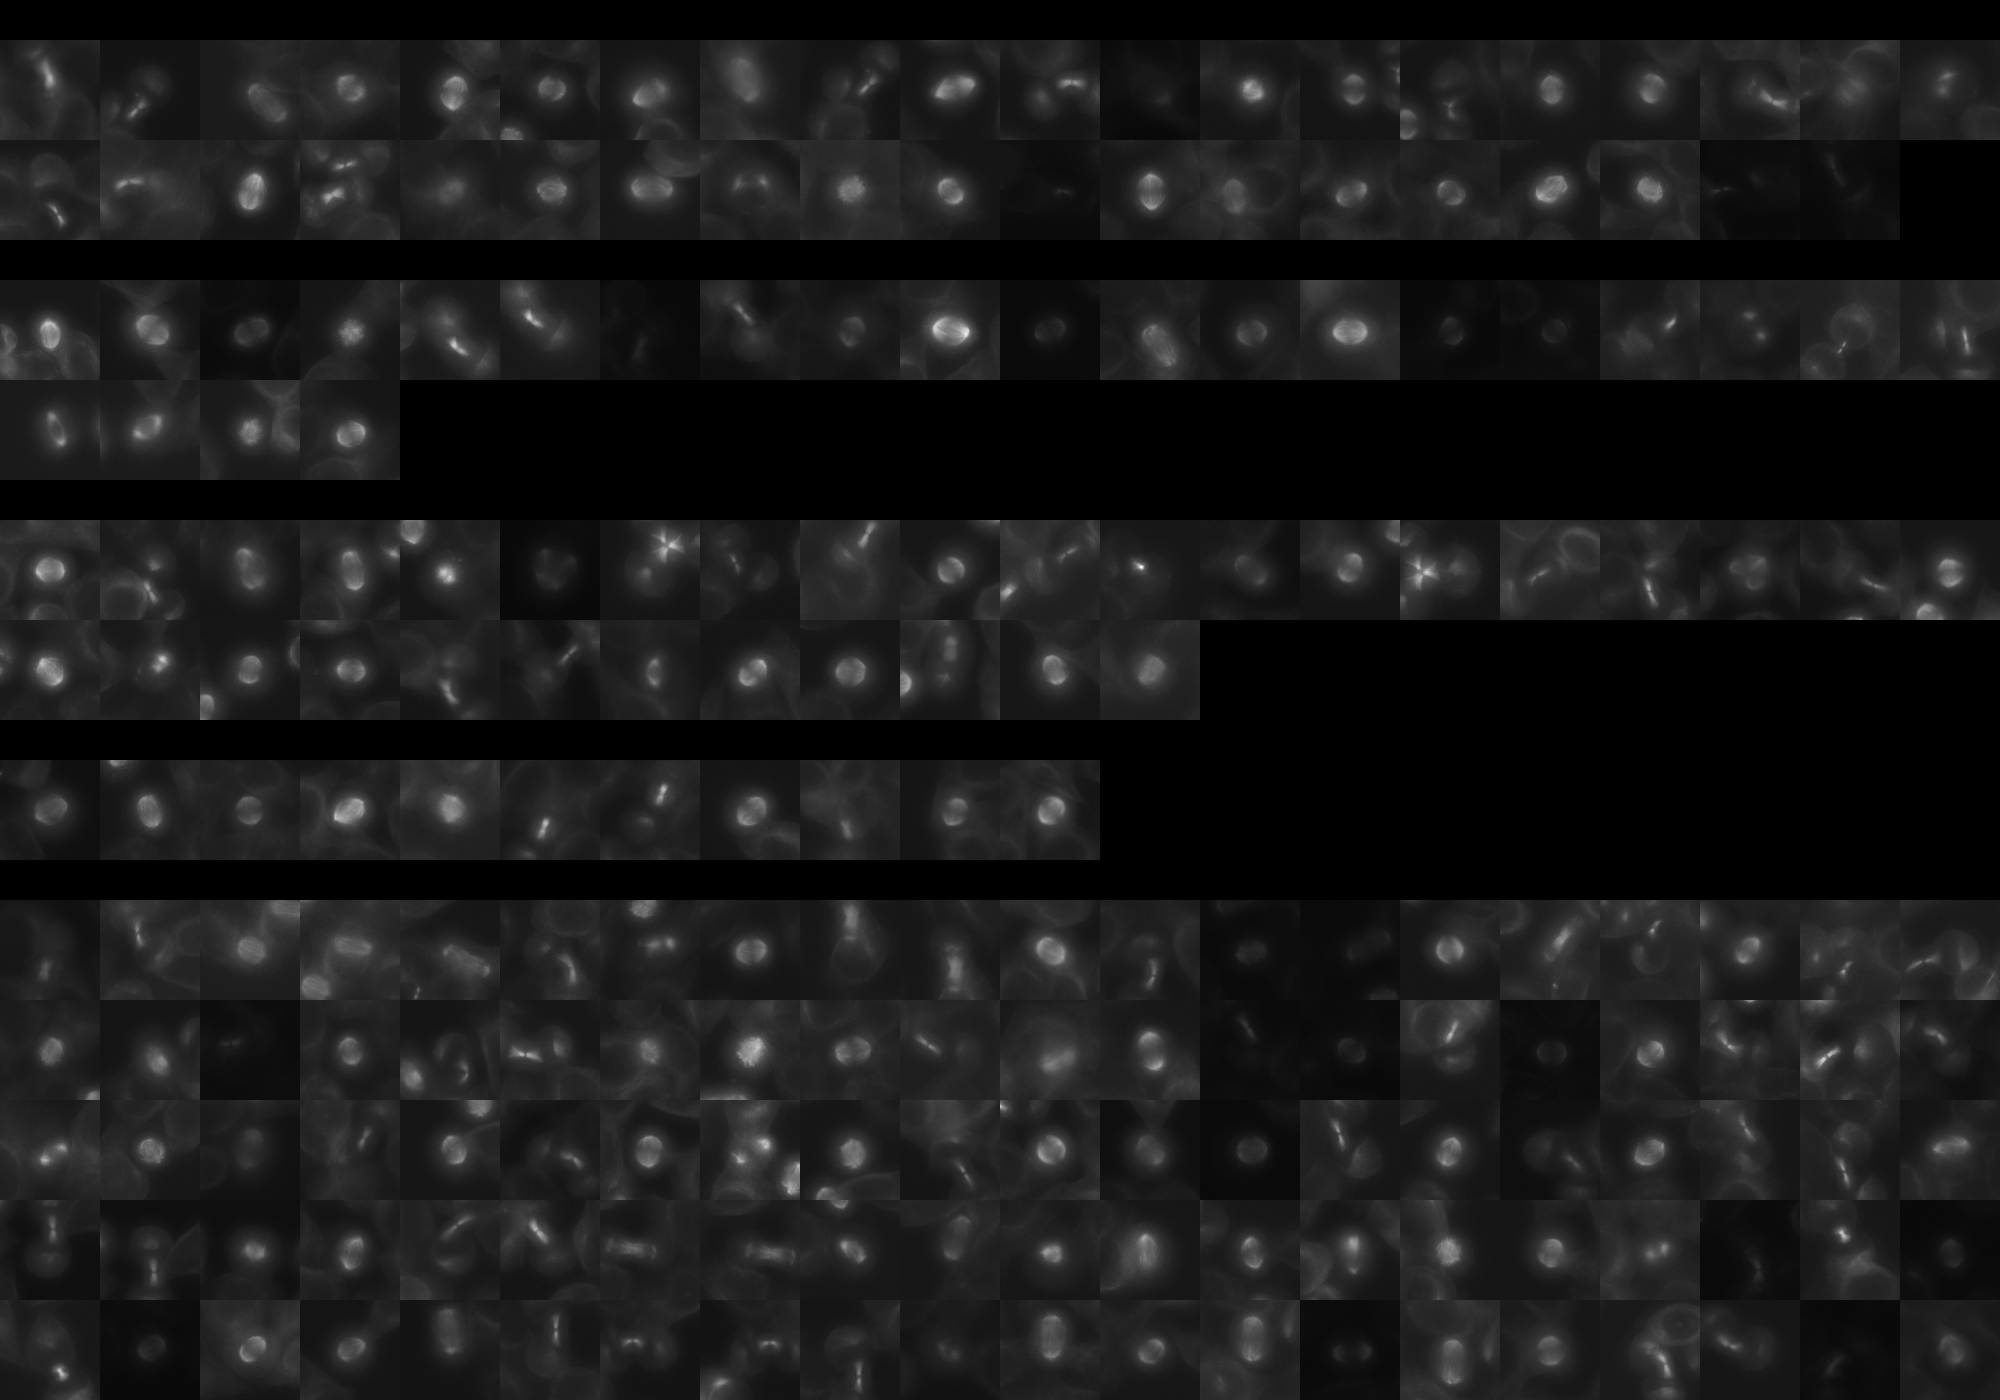
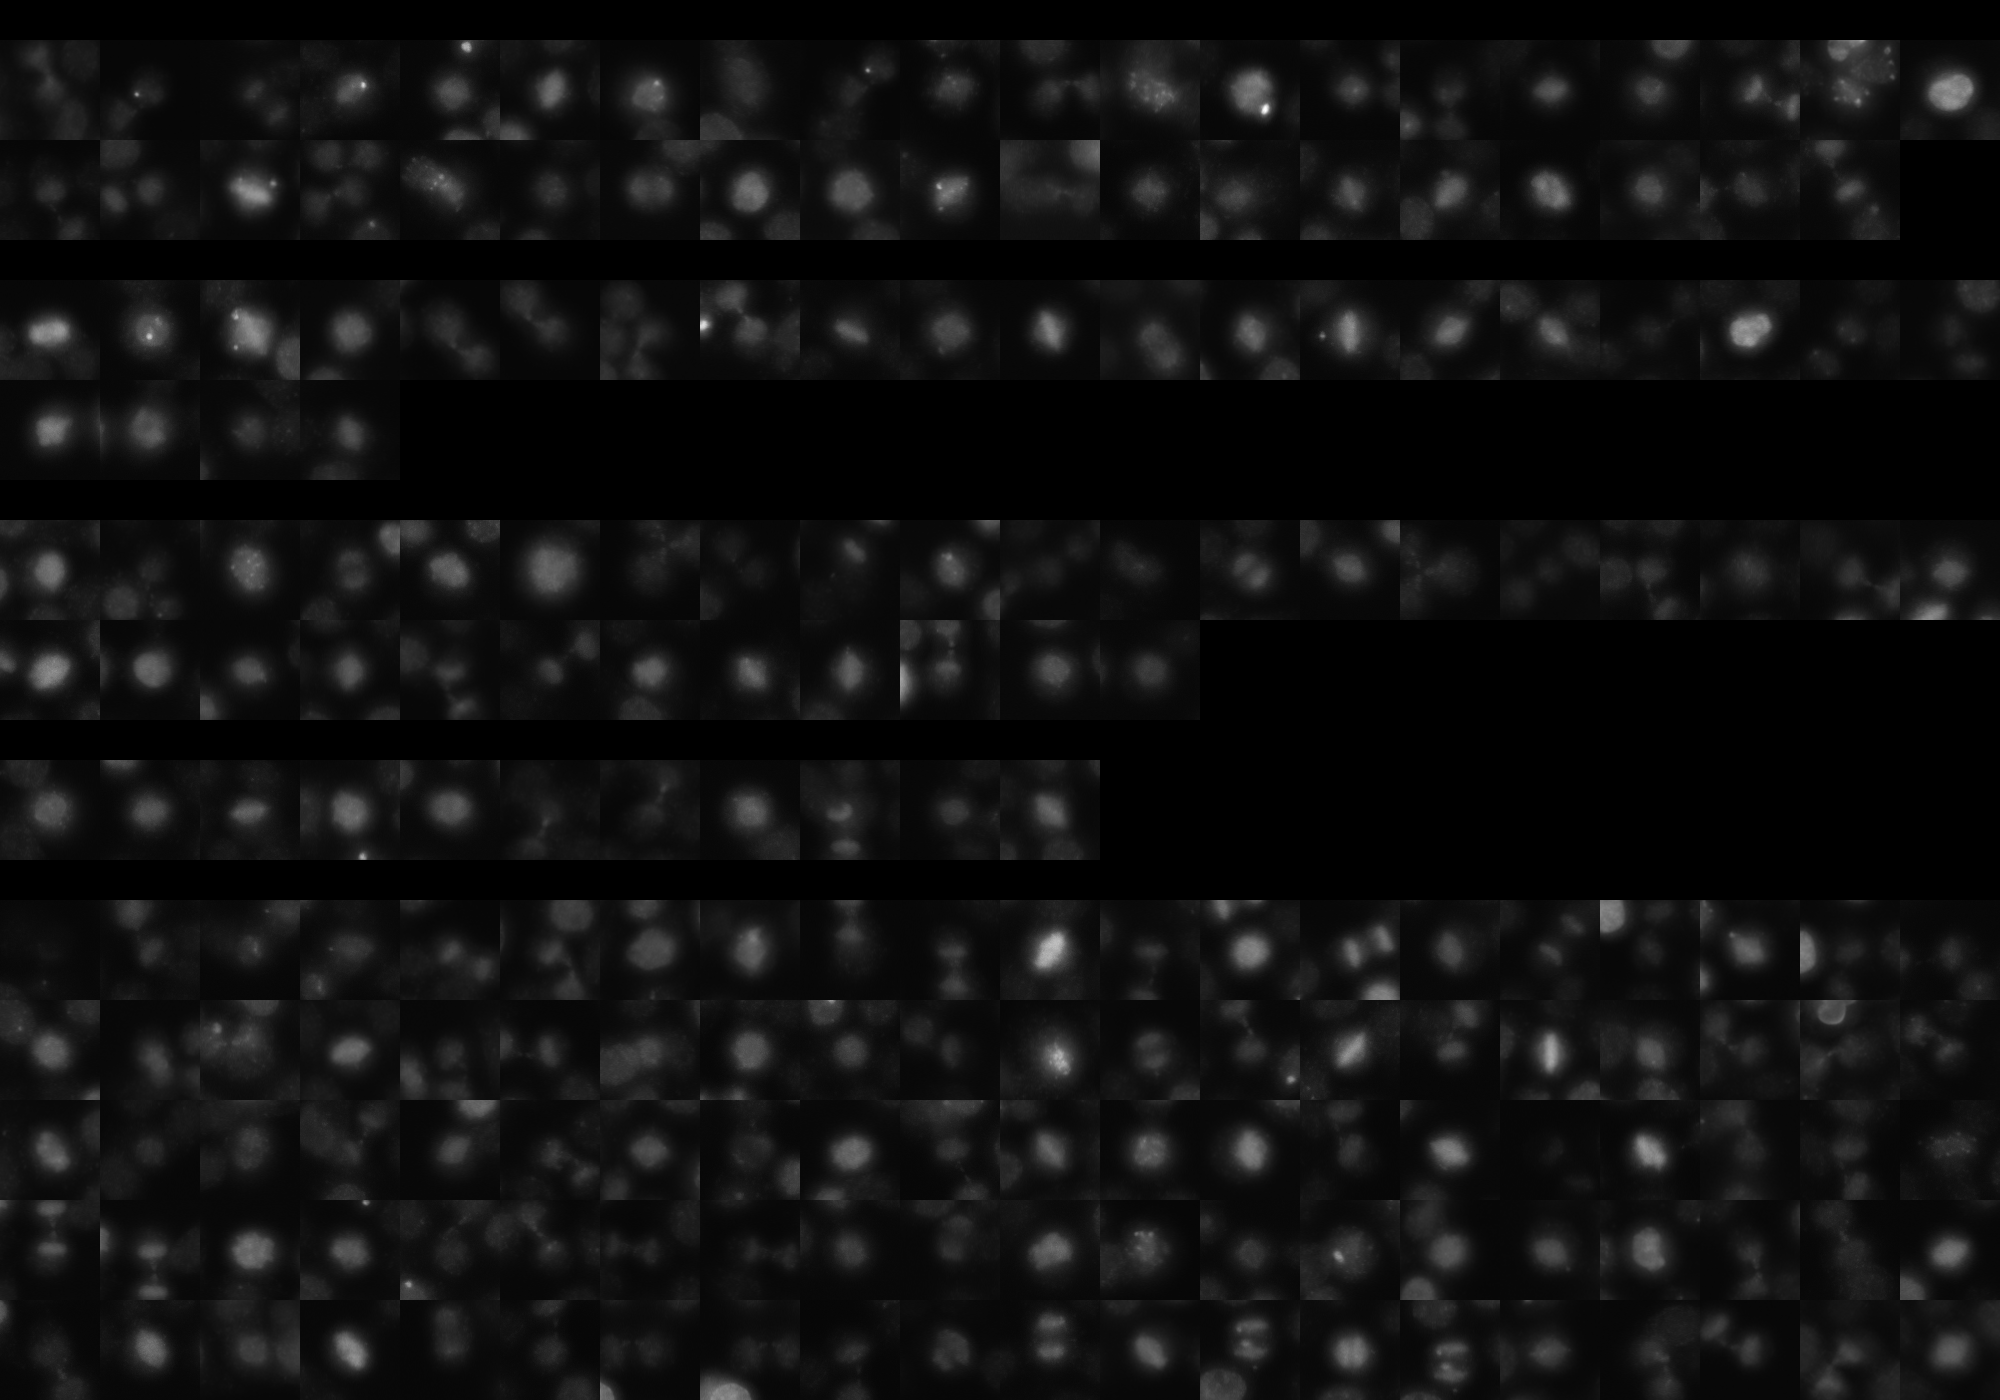
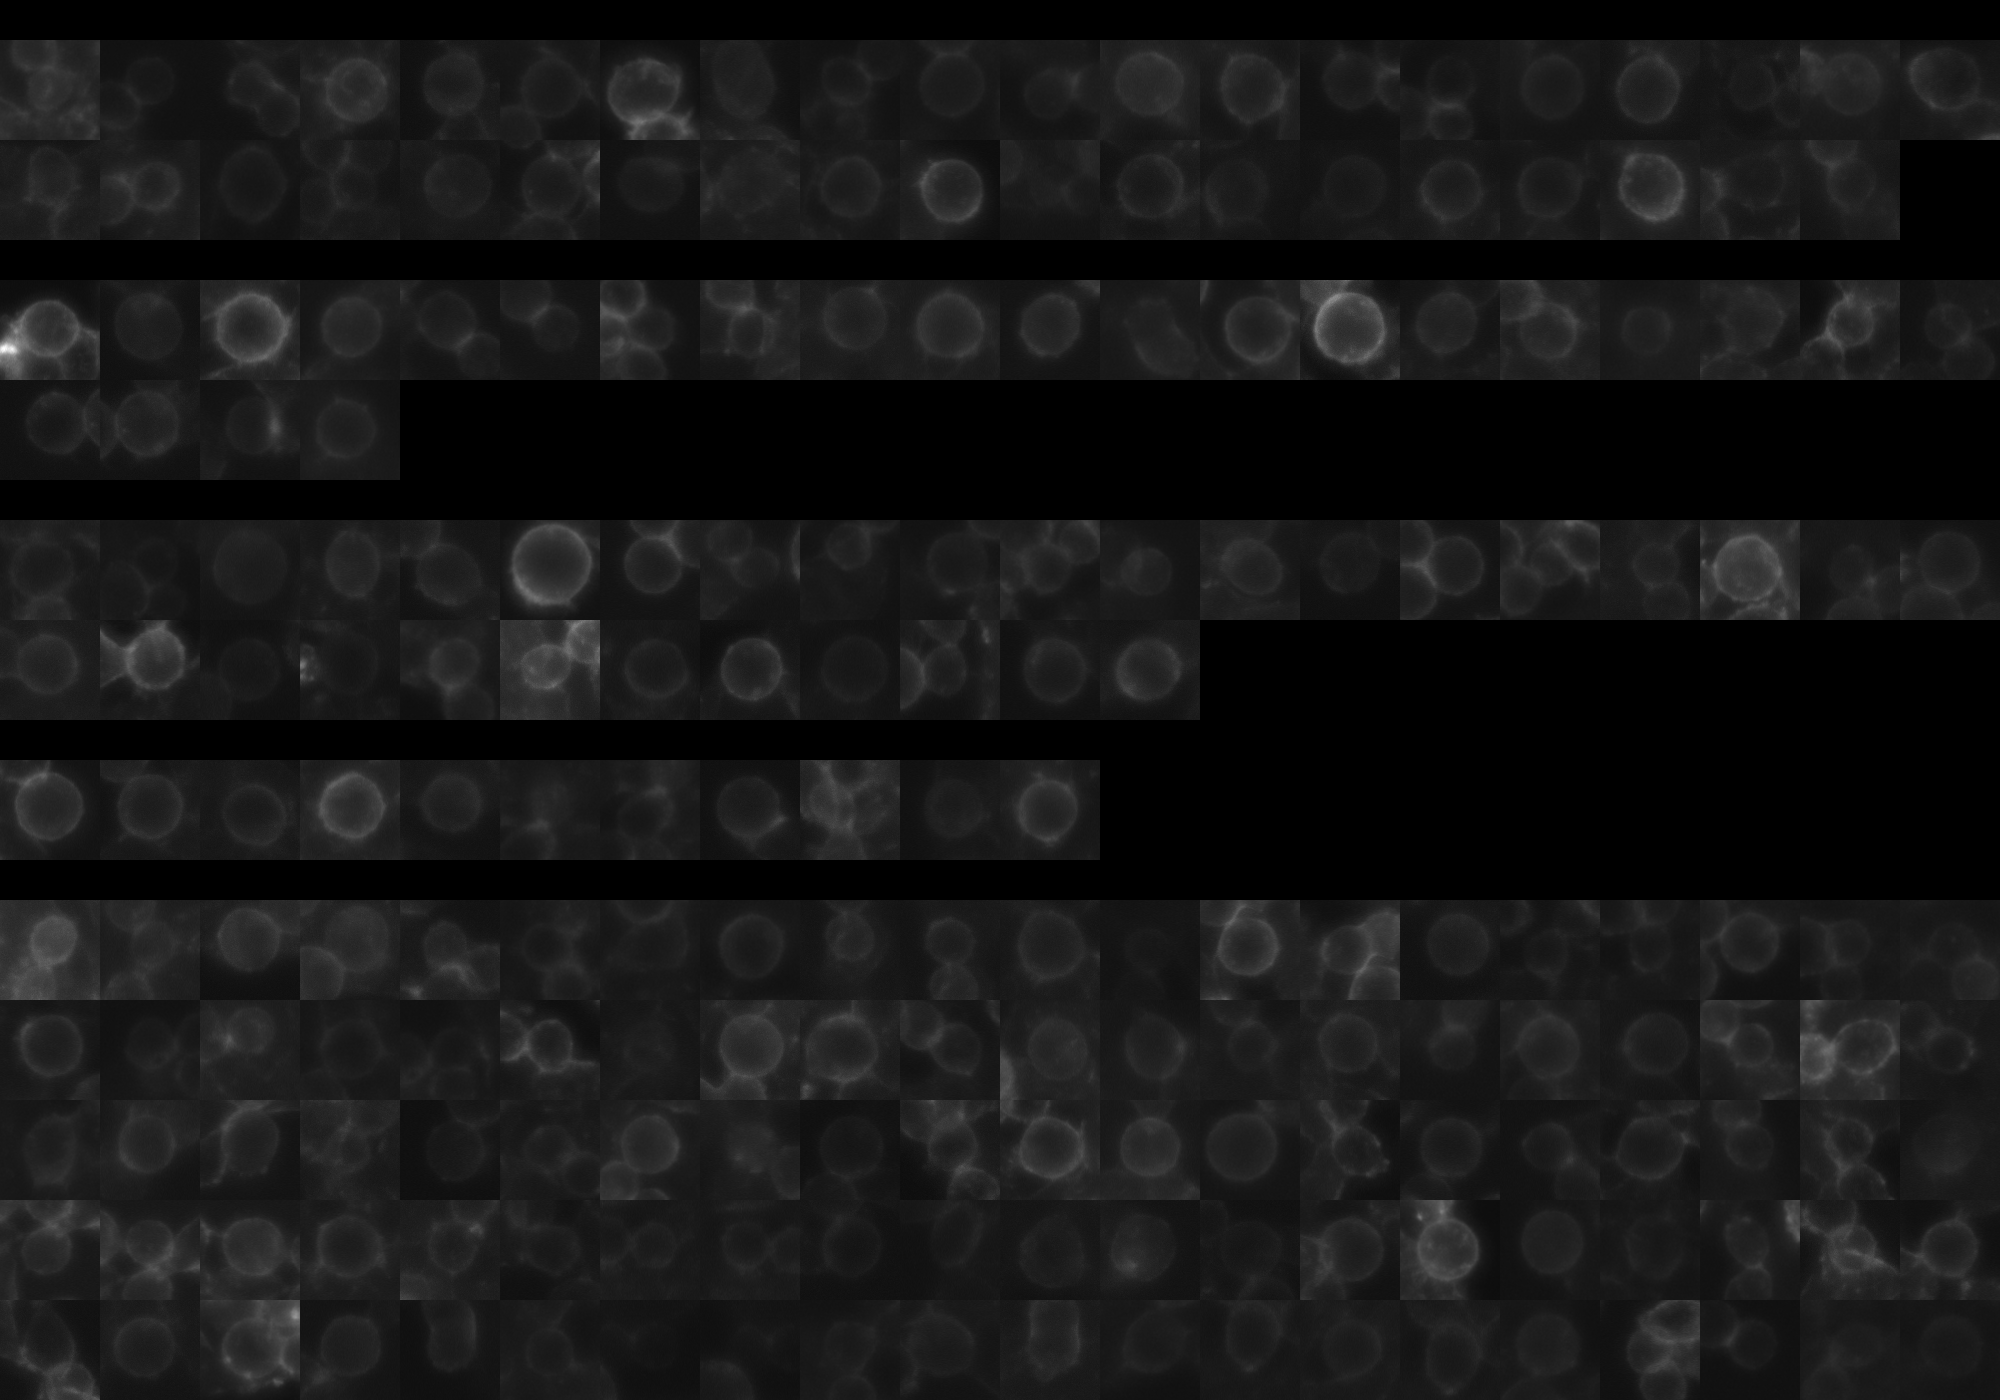
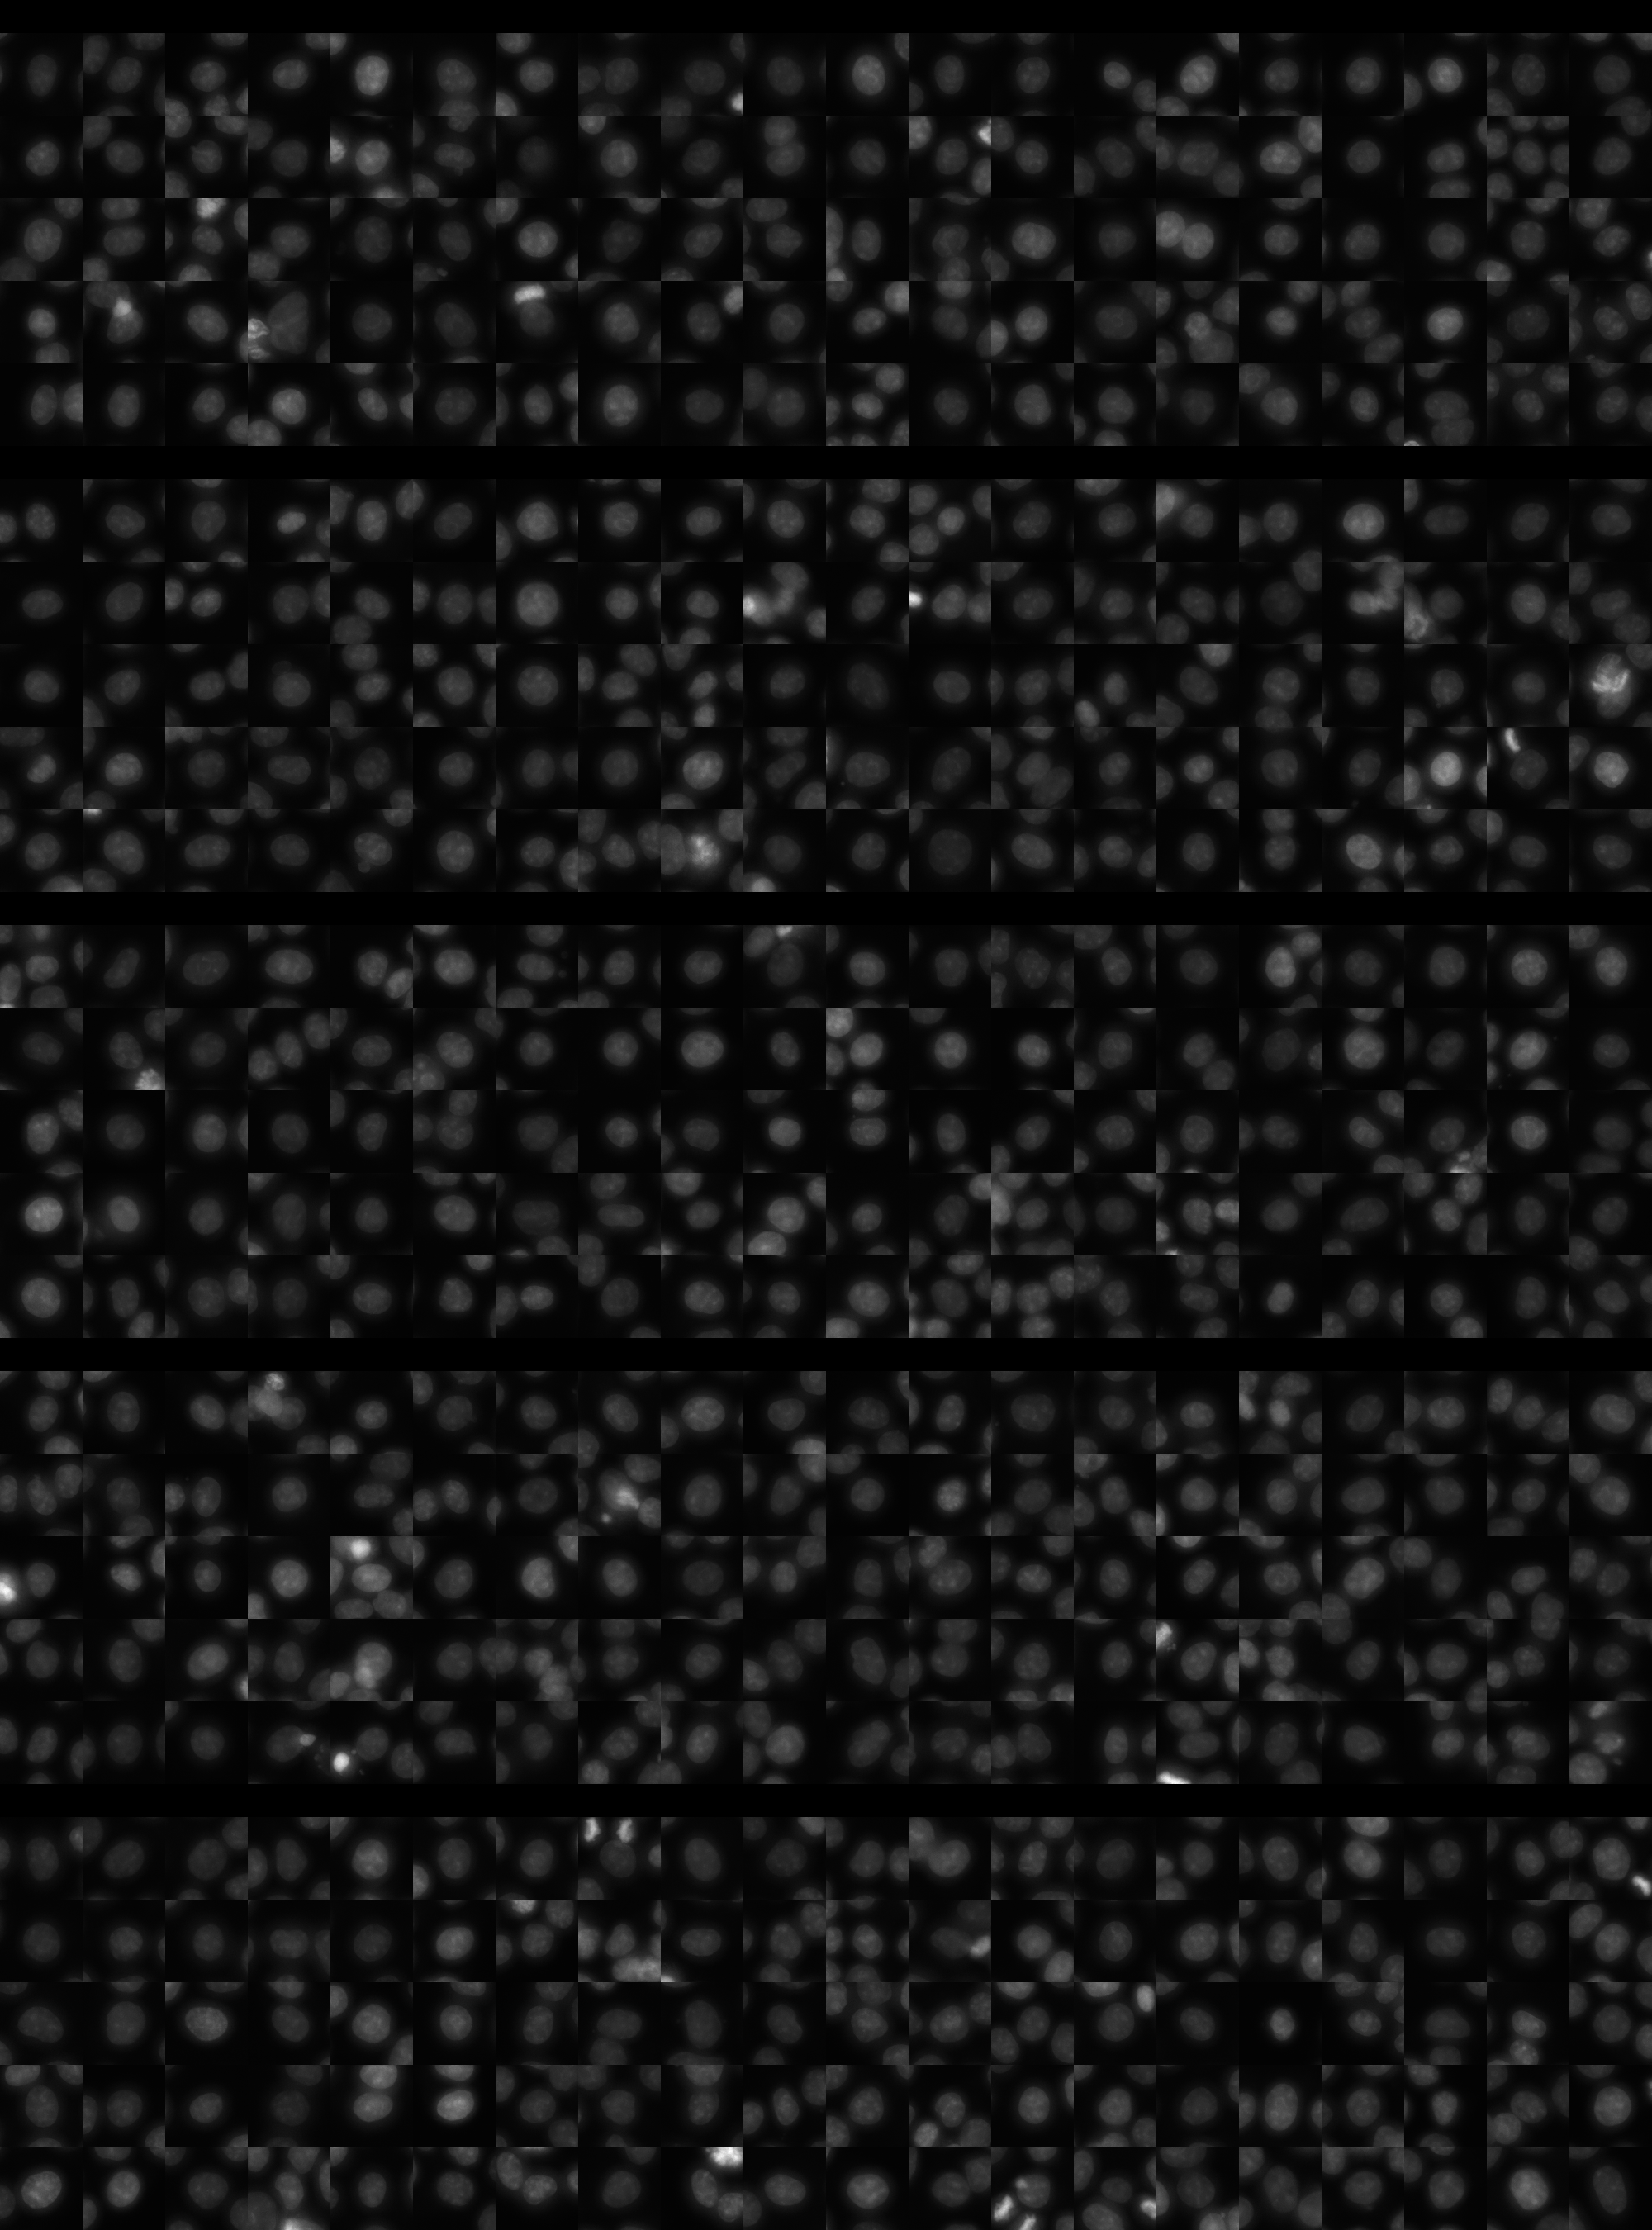
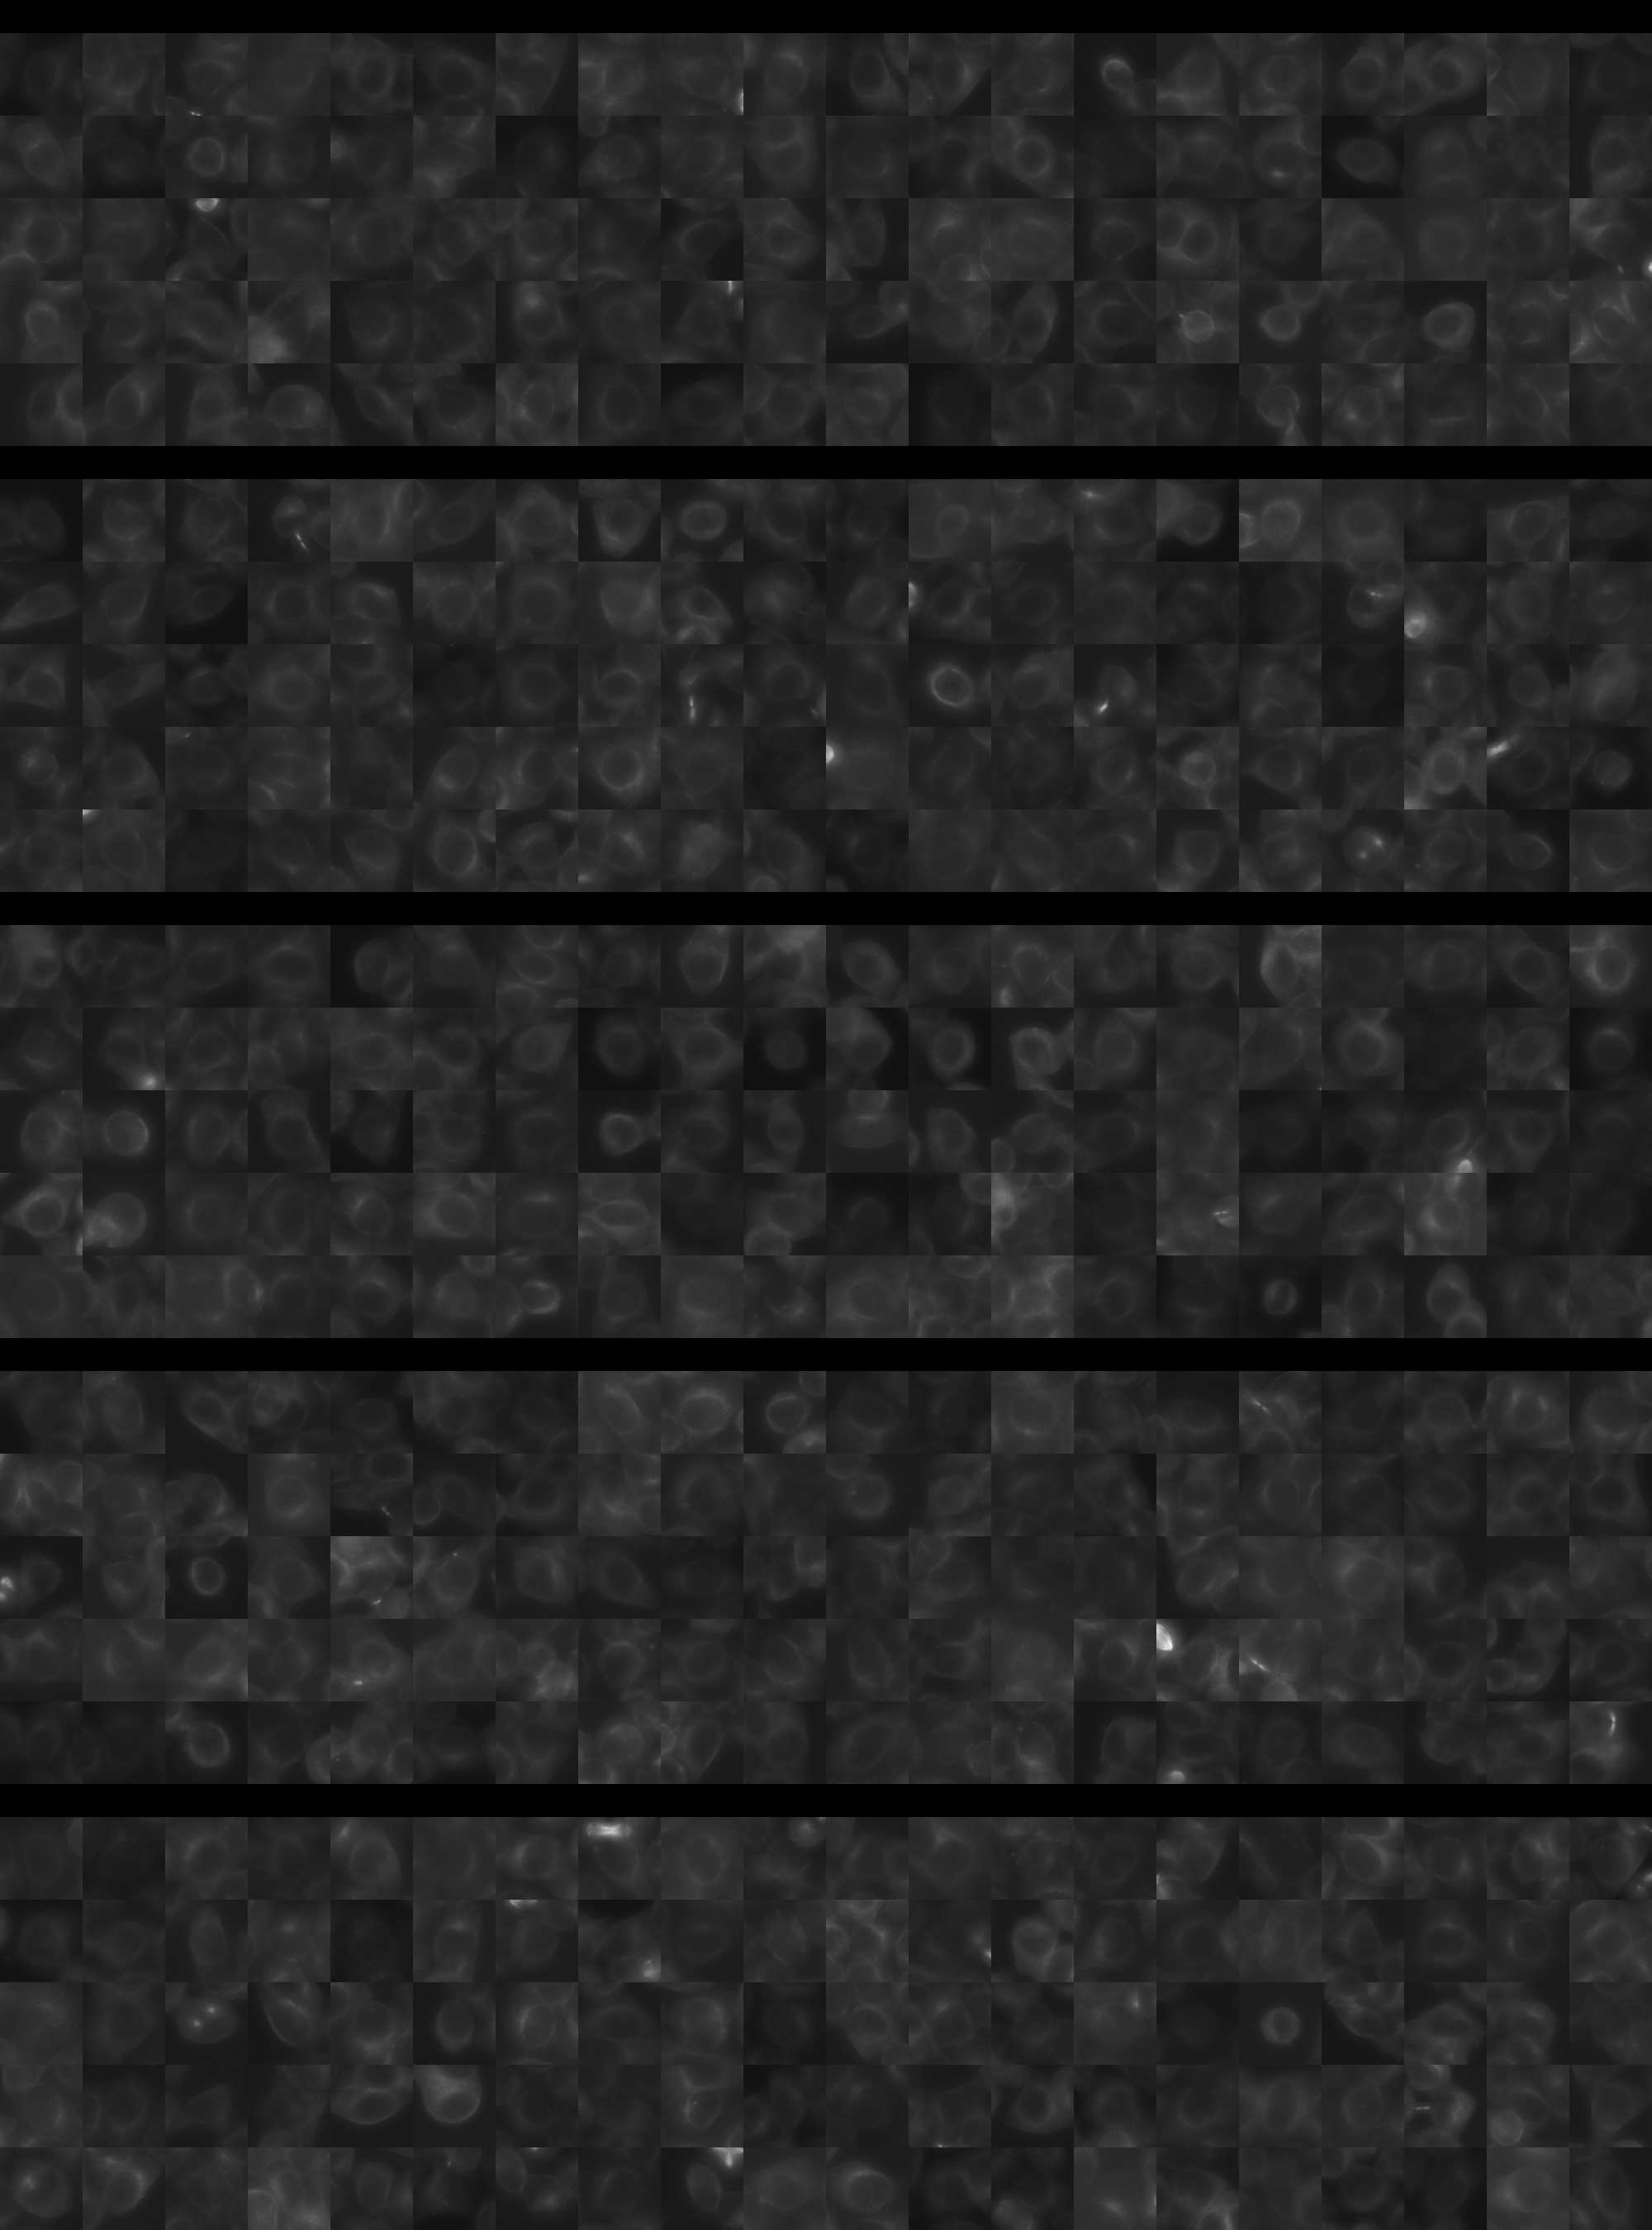
Each montage below shows randomly selected individual cell images for the same target gene separated by sgRNA, along with an example montage of cells expressing a non-targeting negative control sgRNA at the bottom. sgRNA labels in the montages correspond to the numbered sgRNA sequences in the gene info table above. The DNA (blue) and tubulin (green) channels are displayed by default, with gH2AX (grayscale) and actin (yellow) available using the check boxes. Channel brightness, contrast, and opacity are adjustable by clicking the arrow next to the channel name. When only one channel is selected, the display defaults to grayscale. Click the “Zoom” checkbox above the channel controls to enable image zooming (via scrolling) and panning (via click-and-drag).

The cell boxes displayed for this gene are square, 30.36 μm per side for the interphase montage and 30.36 μm per side for the mitotic montage.
Features

Interphase Score Rank FDR q-value
Nucleus DNA Integrated 0.006 2846 of 5322 0.981
Nucleus DNA Mean -1.161e-03 2014 of 5322 0.986
Nucleus gH2AX Mean 0.133 1271 of 5322 0.002
Nucleus DNA - gH2AX Correlation 0.080 231 of 5322 0.022
Nucleus Shape Area -3.754e-02 4270 of 5322 0.391
Nucleus Shape Eccentricity -1.778e-01 5242 of 5322 4.529e-04
Nucleus Shape Form Factor -6.796e-02 3475 of 5322 0.093
Nucleus Shape Solidity -9.412e-02 4170 of 5322 0.008
Cell DNA Mass Displacement 0.045 1383 of 5322 0.450
Cell Tubulin Mean -3.010e-02 3840 of 5322 0.606
Cell Tubulin Mass Displacement -1.500e-02 3817 of 5322 0.853
Cell Actin Mean -4.911e-02 4348 of 5322 0.359
Cell Tubulin - Actin Correlation -5.385e-02 5060 of 5322 0.196
Cell DNA - Tubulin Correlation -1.007e-01 5198 of 5322 0.004
Cell Shape Area 0.109 517 of 5322 0.034
Cell Shape Eccentricity 0.017 2358 of 5322 0.866
Mitotic Score Rank FDR q-value
Nucleus DNA Integrated 0.187 1394 of 5322 0.911
Nucleus DNA Mean 0.241 392 of 5322 1.000
Nucleus DNA Mass Displacement 0.107 1808 of 5322 0.999
Nucleus DNA Mean Frac 3 -8.299e-02 4259 of 5322 1.000
Nucleus gH2AX Mean 0.236 562 of 5322 1.000
Nucleus gH2AX Mean Frac 0 -2.170e-02 2612 of 5322 1.000
Nucleus Tubulin Mean Frac 0 -1.229e-01 4839 of 5322 0.999
Nucleus Tubulin Mean Edge 0.272 402 of 5322 0.965
Nucleus Tubulin Std Edge 0.313 141 of 5322 0.908
Nucleus Shape Area 0.224 1271 of 5322 0.907
Nucleus Shape Eccentricity 0.293 55 of 5322 1.000
Nucleus Shape Form Factor -4.597e-01 5156 of 5322 0.537
Cell Tubulin Mean 0.136 1595 of 5322 0.997
Cell Tubulin Mean Frac 3 -2.865e-01 4643 of 5322 0.999
Cell Actin Mean 0.121 1605 of 5322 0.997
Cell Shape Area 0.189 1498 of 5322 0.998
( Reset Zoom )
Brightness
Contrast
Opacity
Brightness
Contrast
Opacity
Brightness
Contrast
Opacity
Brightness
Contrast
Opacity
Brightness
Contrast
Opacity

( Reset Zoom )
Brightness
Contrast
Opacity
Brightness
Contrast
Opacity
Brightness
Contrast
Opacity
Brightness
Contrast
Opacity
Brightness
Contrast
Opacity

MIT Central Accessability