TUT1

Gene symbol: TUT1
Gene: 64852
Uniprot Function: Poly(A) polymerase that creates the 3'-poly(A) tail of specific pre-mRNAs (PubMed:18288197, PubMed:21102410). Localizes to nuclear speckles together with PIP5K1A and mediates polyadenylation of a select set of mRNAs, such as HMOX1 (PubMed:18288197). In addition to polyadenylation, it is also required for the 3'-end cleavage of pre-mRNAs: binds to the 3'UTR of targeted pre-mRNAs and promotes the recruitment and assembly of the CPSF complex on the 3'UTR of pre-mRNAs (PubMed:21102410). In addition to adenylyltransferase activity, also has uridylyltransferase activity (PubMed:16790842, PubMed:18288197, PubMed:28589955). However, the ATP ratio is higher than UTP in cells, suggesting that it functions primarily as a poly(A) polymerase (PubMed:18288197). Acts as a specific terminal uridylyltransferase for U6 snRNA in vitro: responsible for a controlled elongation reaction that results in the restoration of the four 3'-terminal UMP-residues found in newly transcribed U6 snRNA (PubMed:16790842, PubMed:18288197, PubMed:28589955). Not involved in replication-dependent histone mRNA degradation.
Mitotic Index 0.0618
Interphase Cluster: #52 (30 genes)
Mitotic Cluster: #6 (49 genes)
sgRNA 1: AAGATCCCAACAAGATACAC (interphase cells: 501, mitotic cells: 69)
sgRNA 2: CAGCGGAGGGTGTACACGAG (interphase cells: 475, mitotic cells: 33)
sgRNA 3: CAGGAGAGTCGCTATGGCGG (interphase cells: 1037, mitotic cells: 32)
sgRNA 4: TACGGTTGGCTGTAGTAACG (interphase cells: 266, mitotic cells: 16)

Interphase Cluster

Mitotic Cluster

Overview

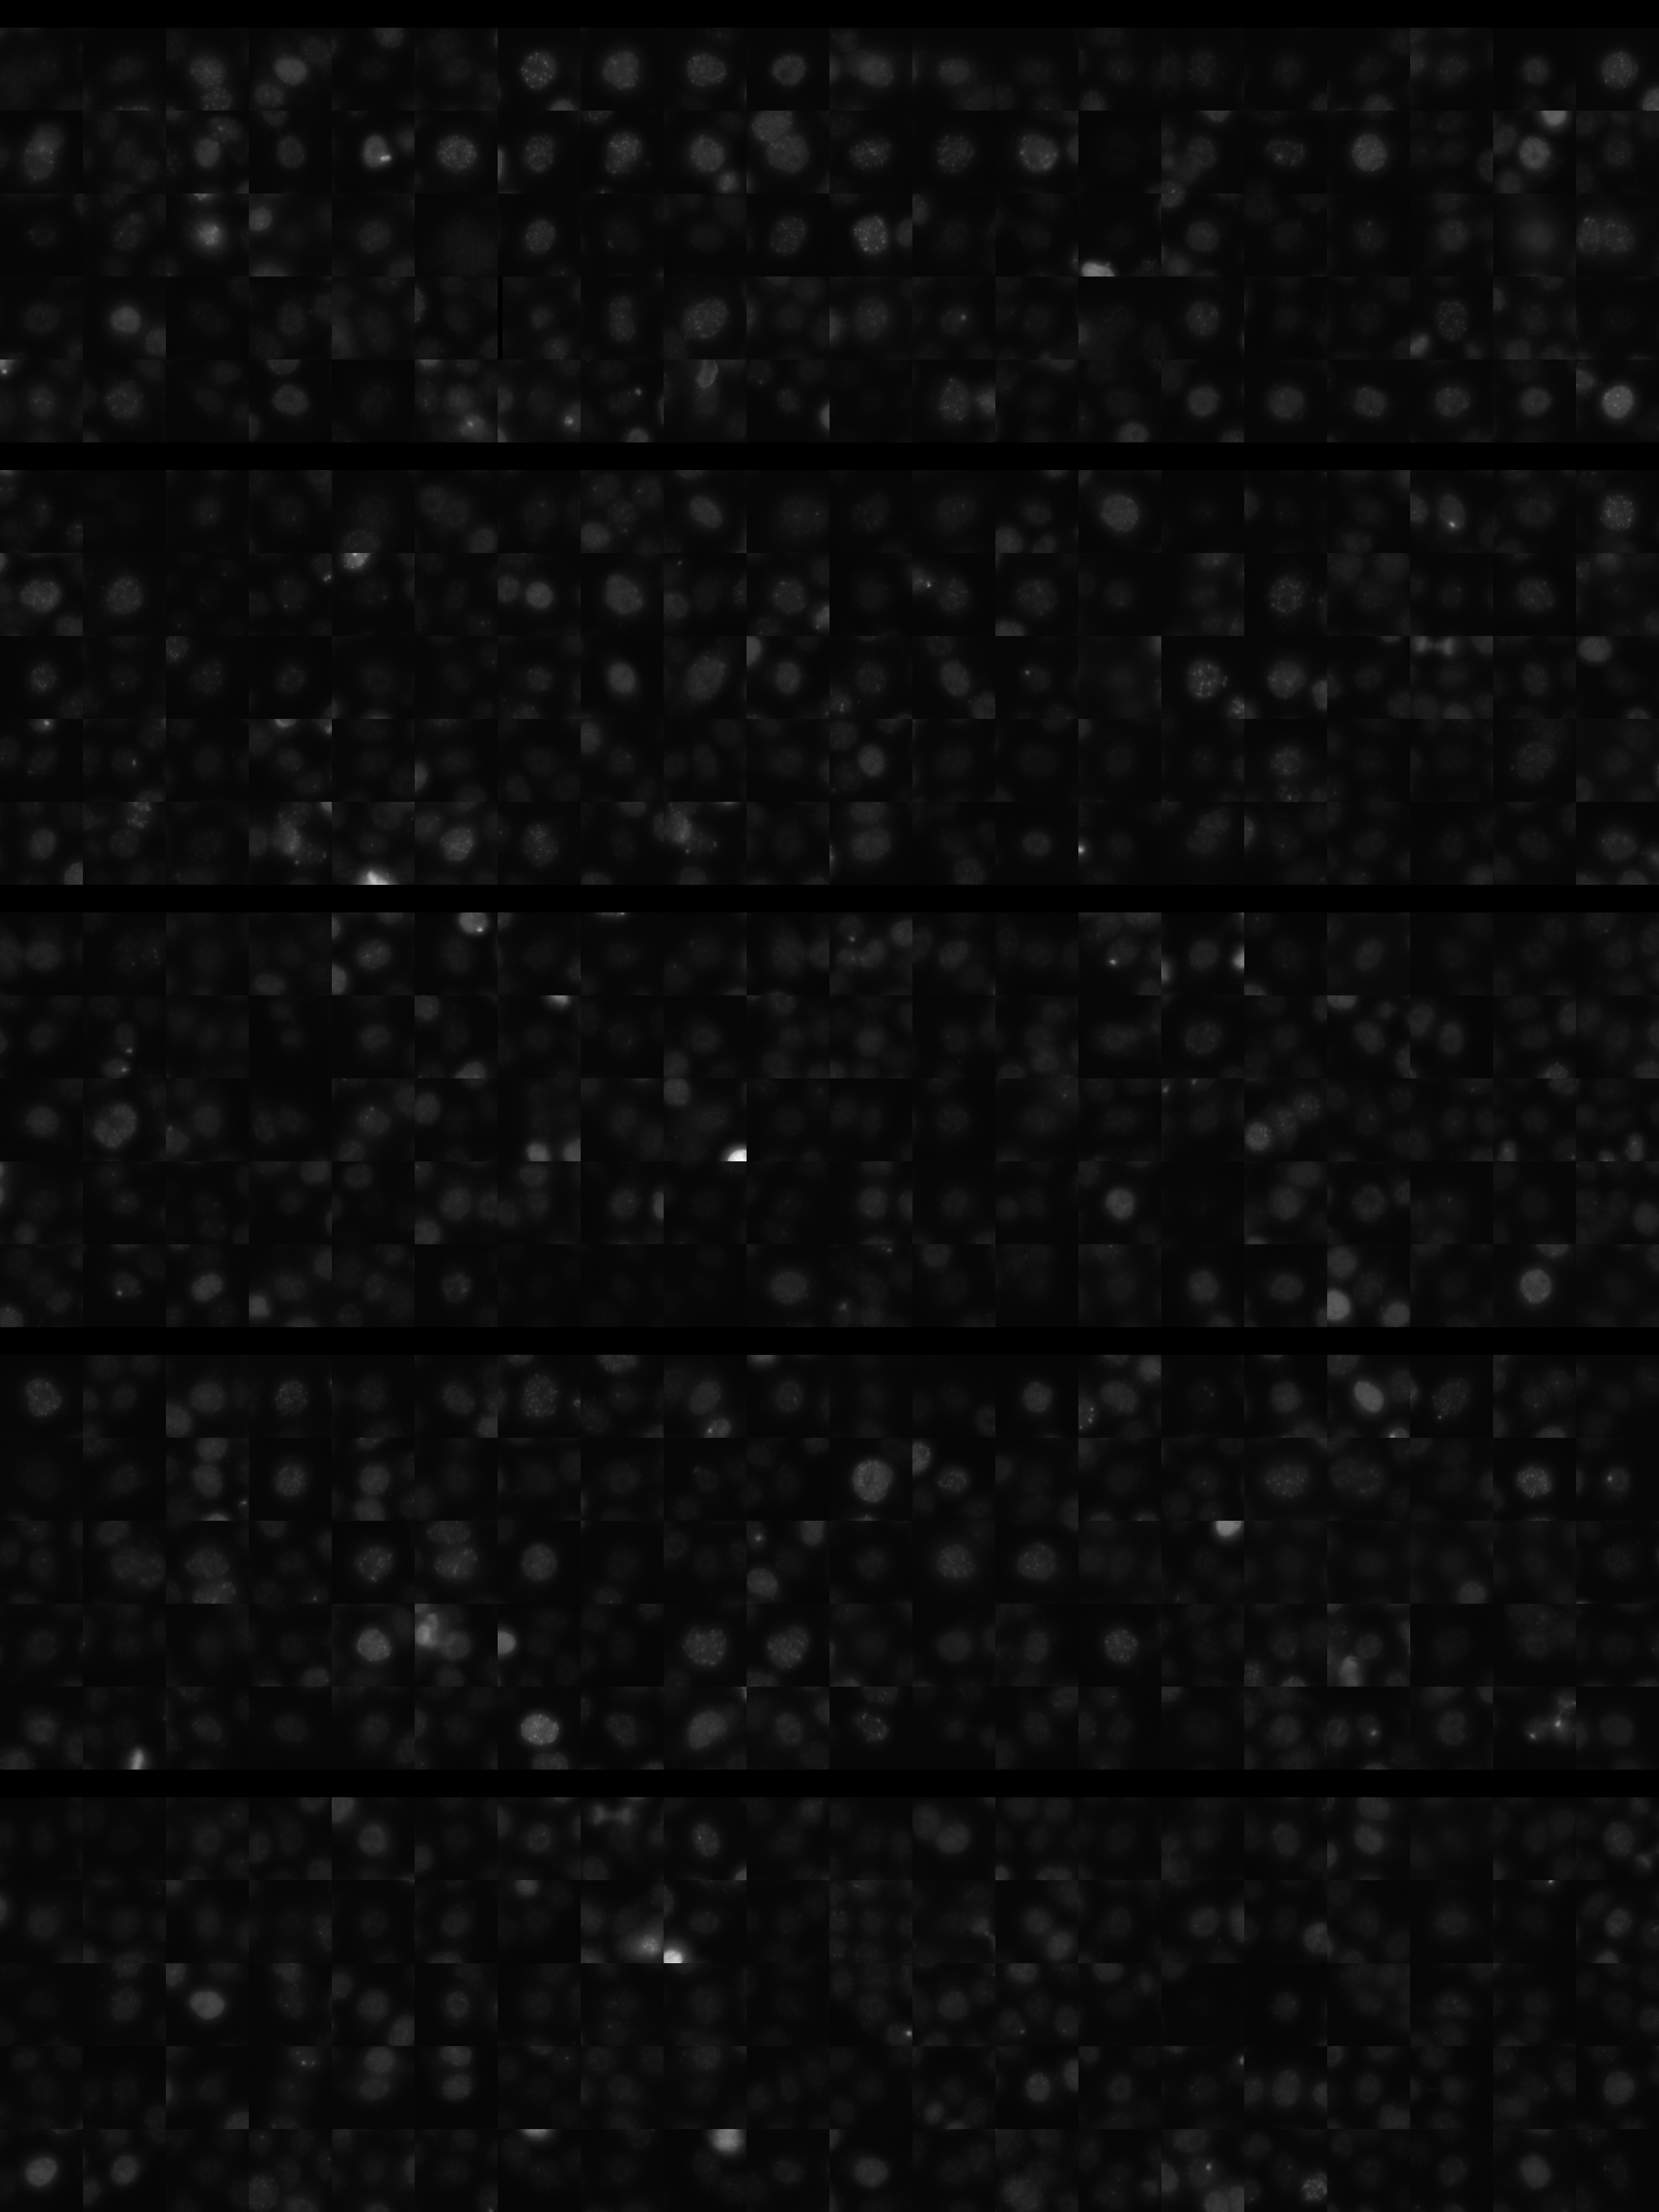
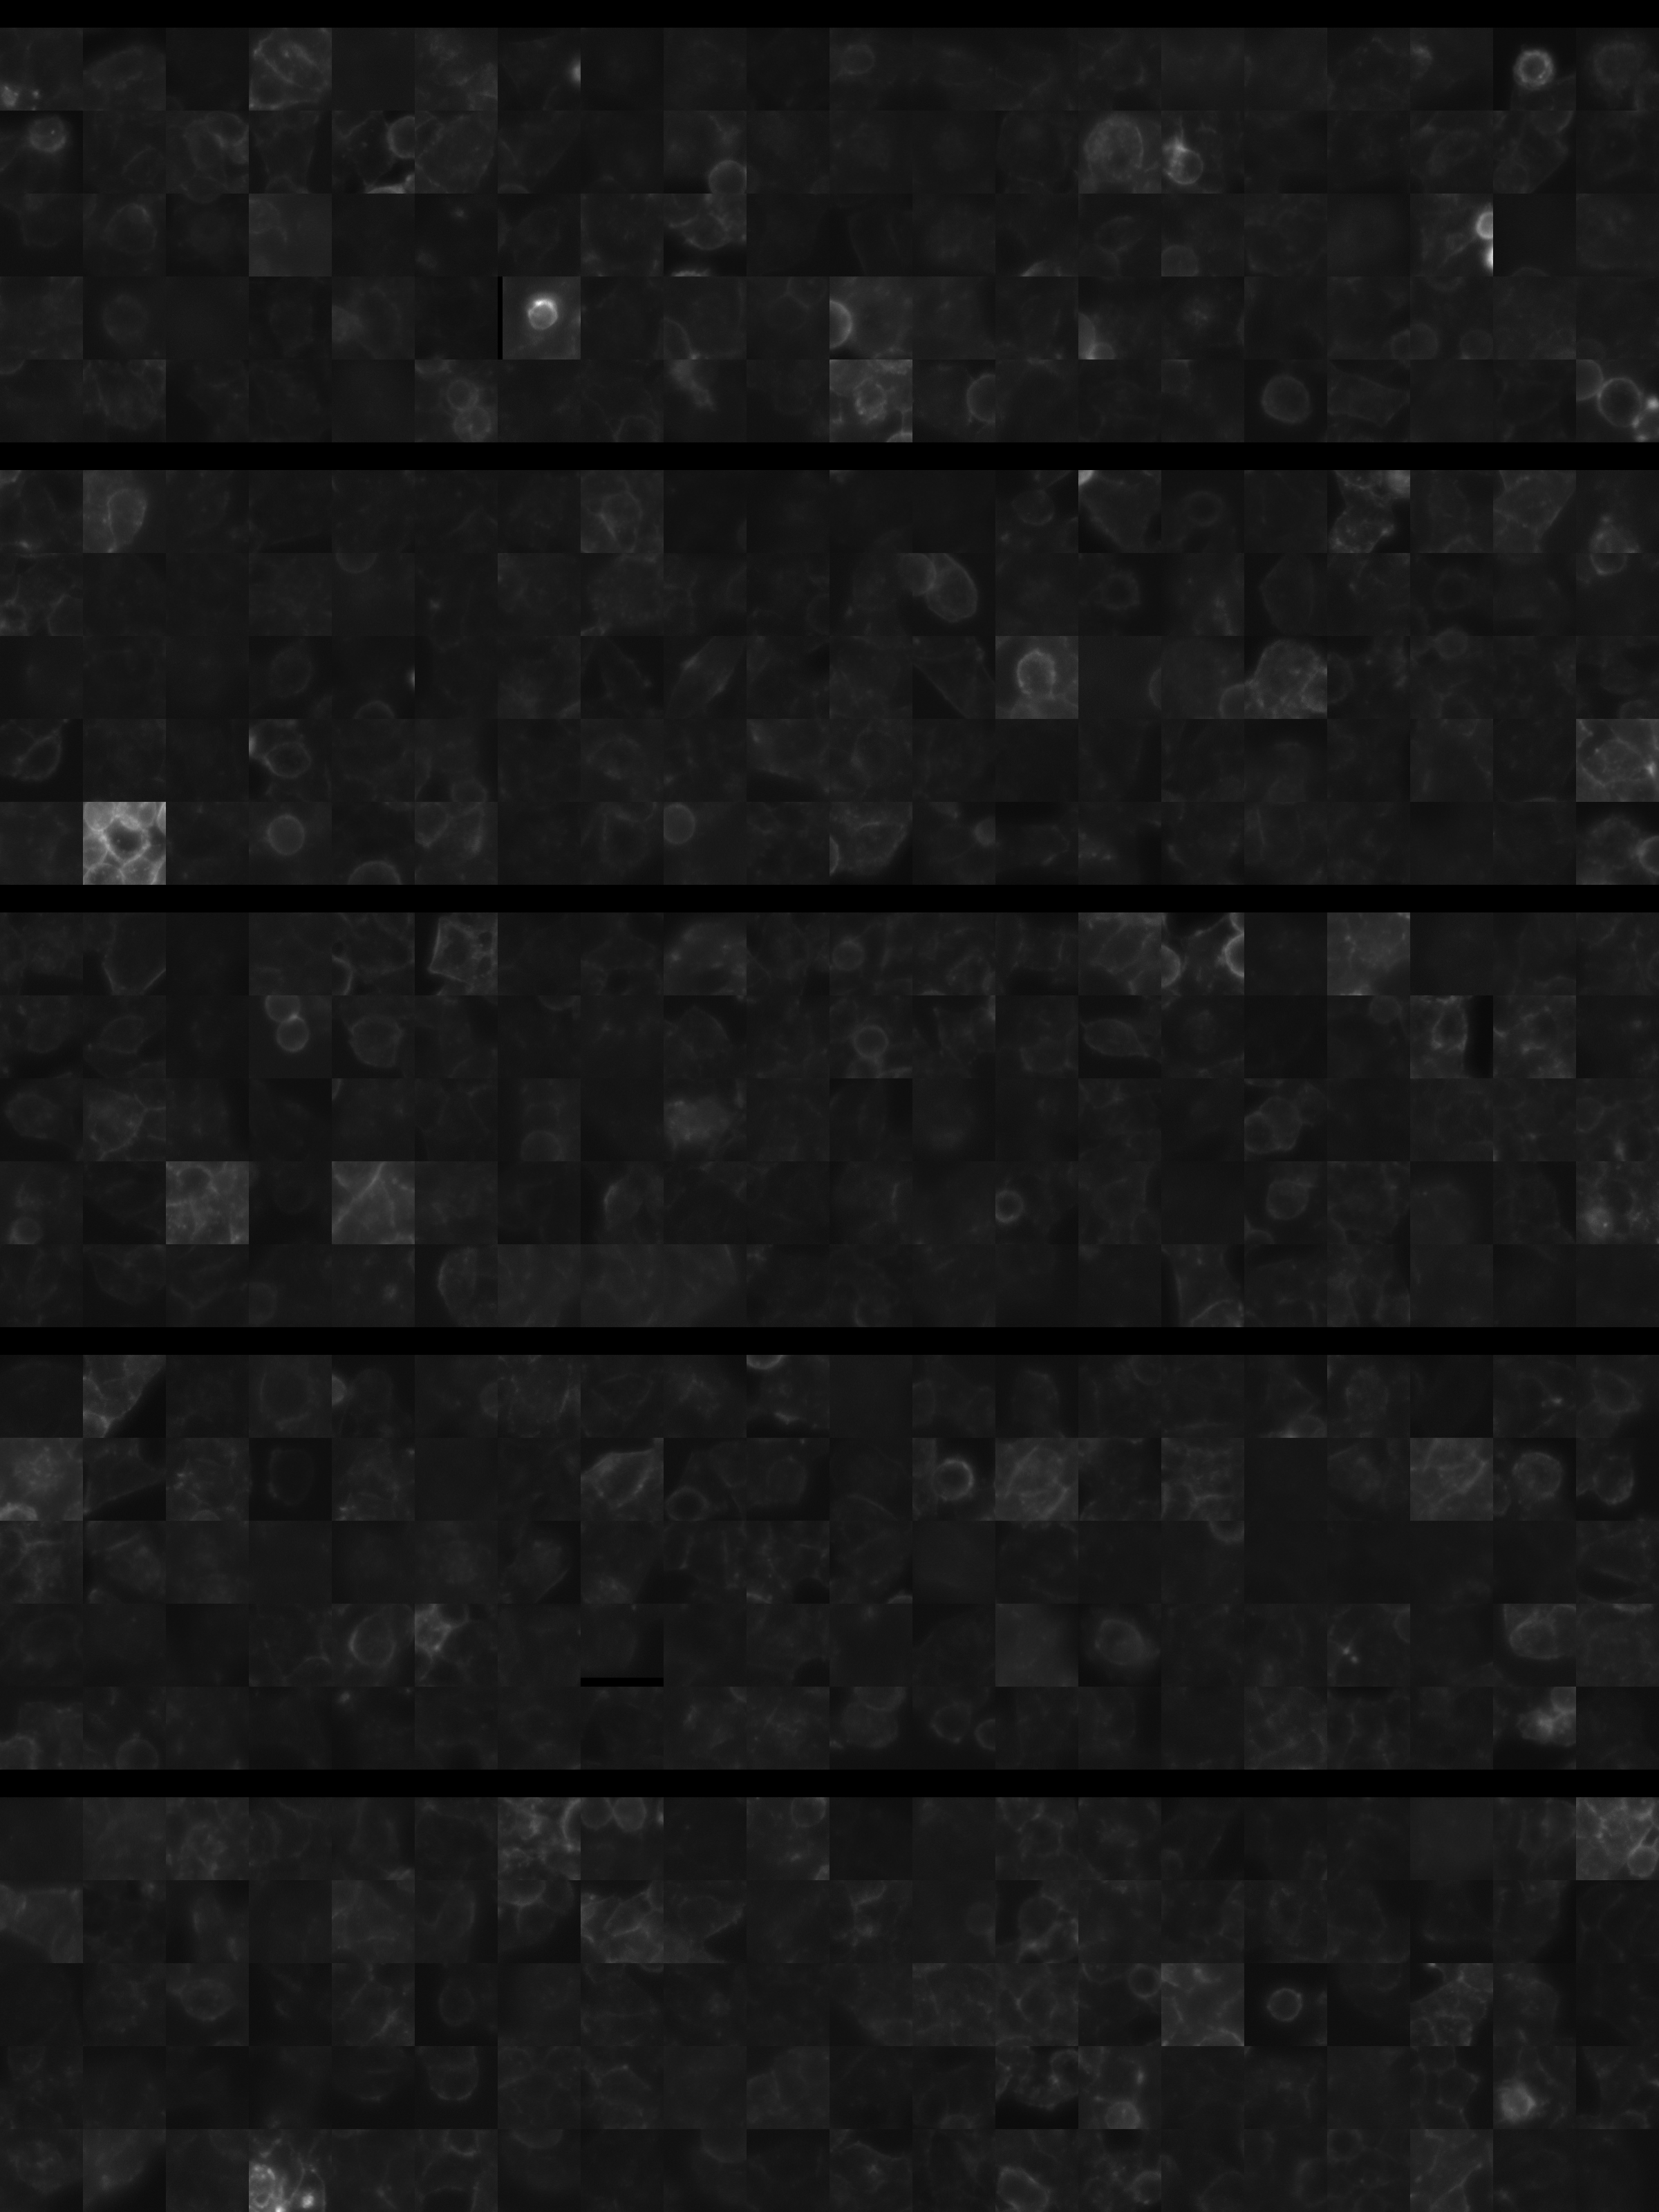
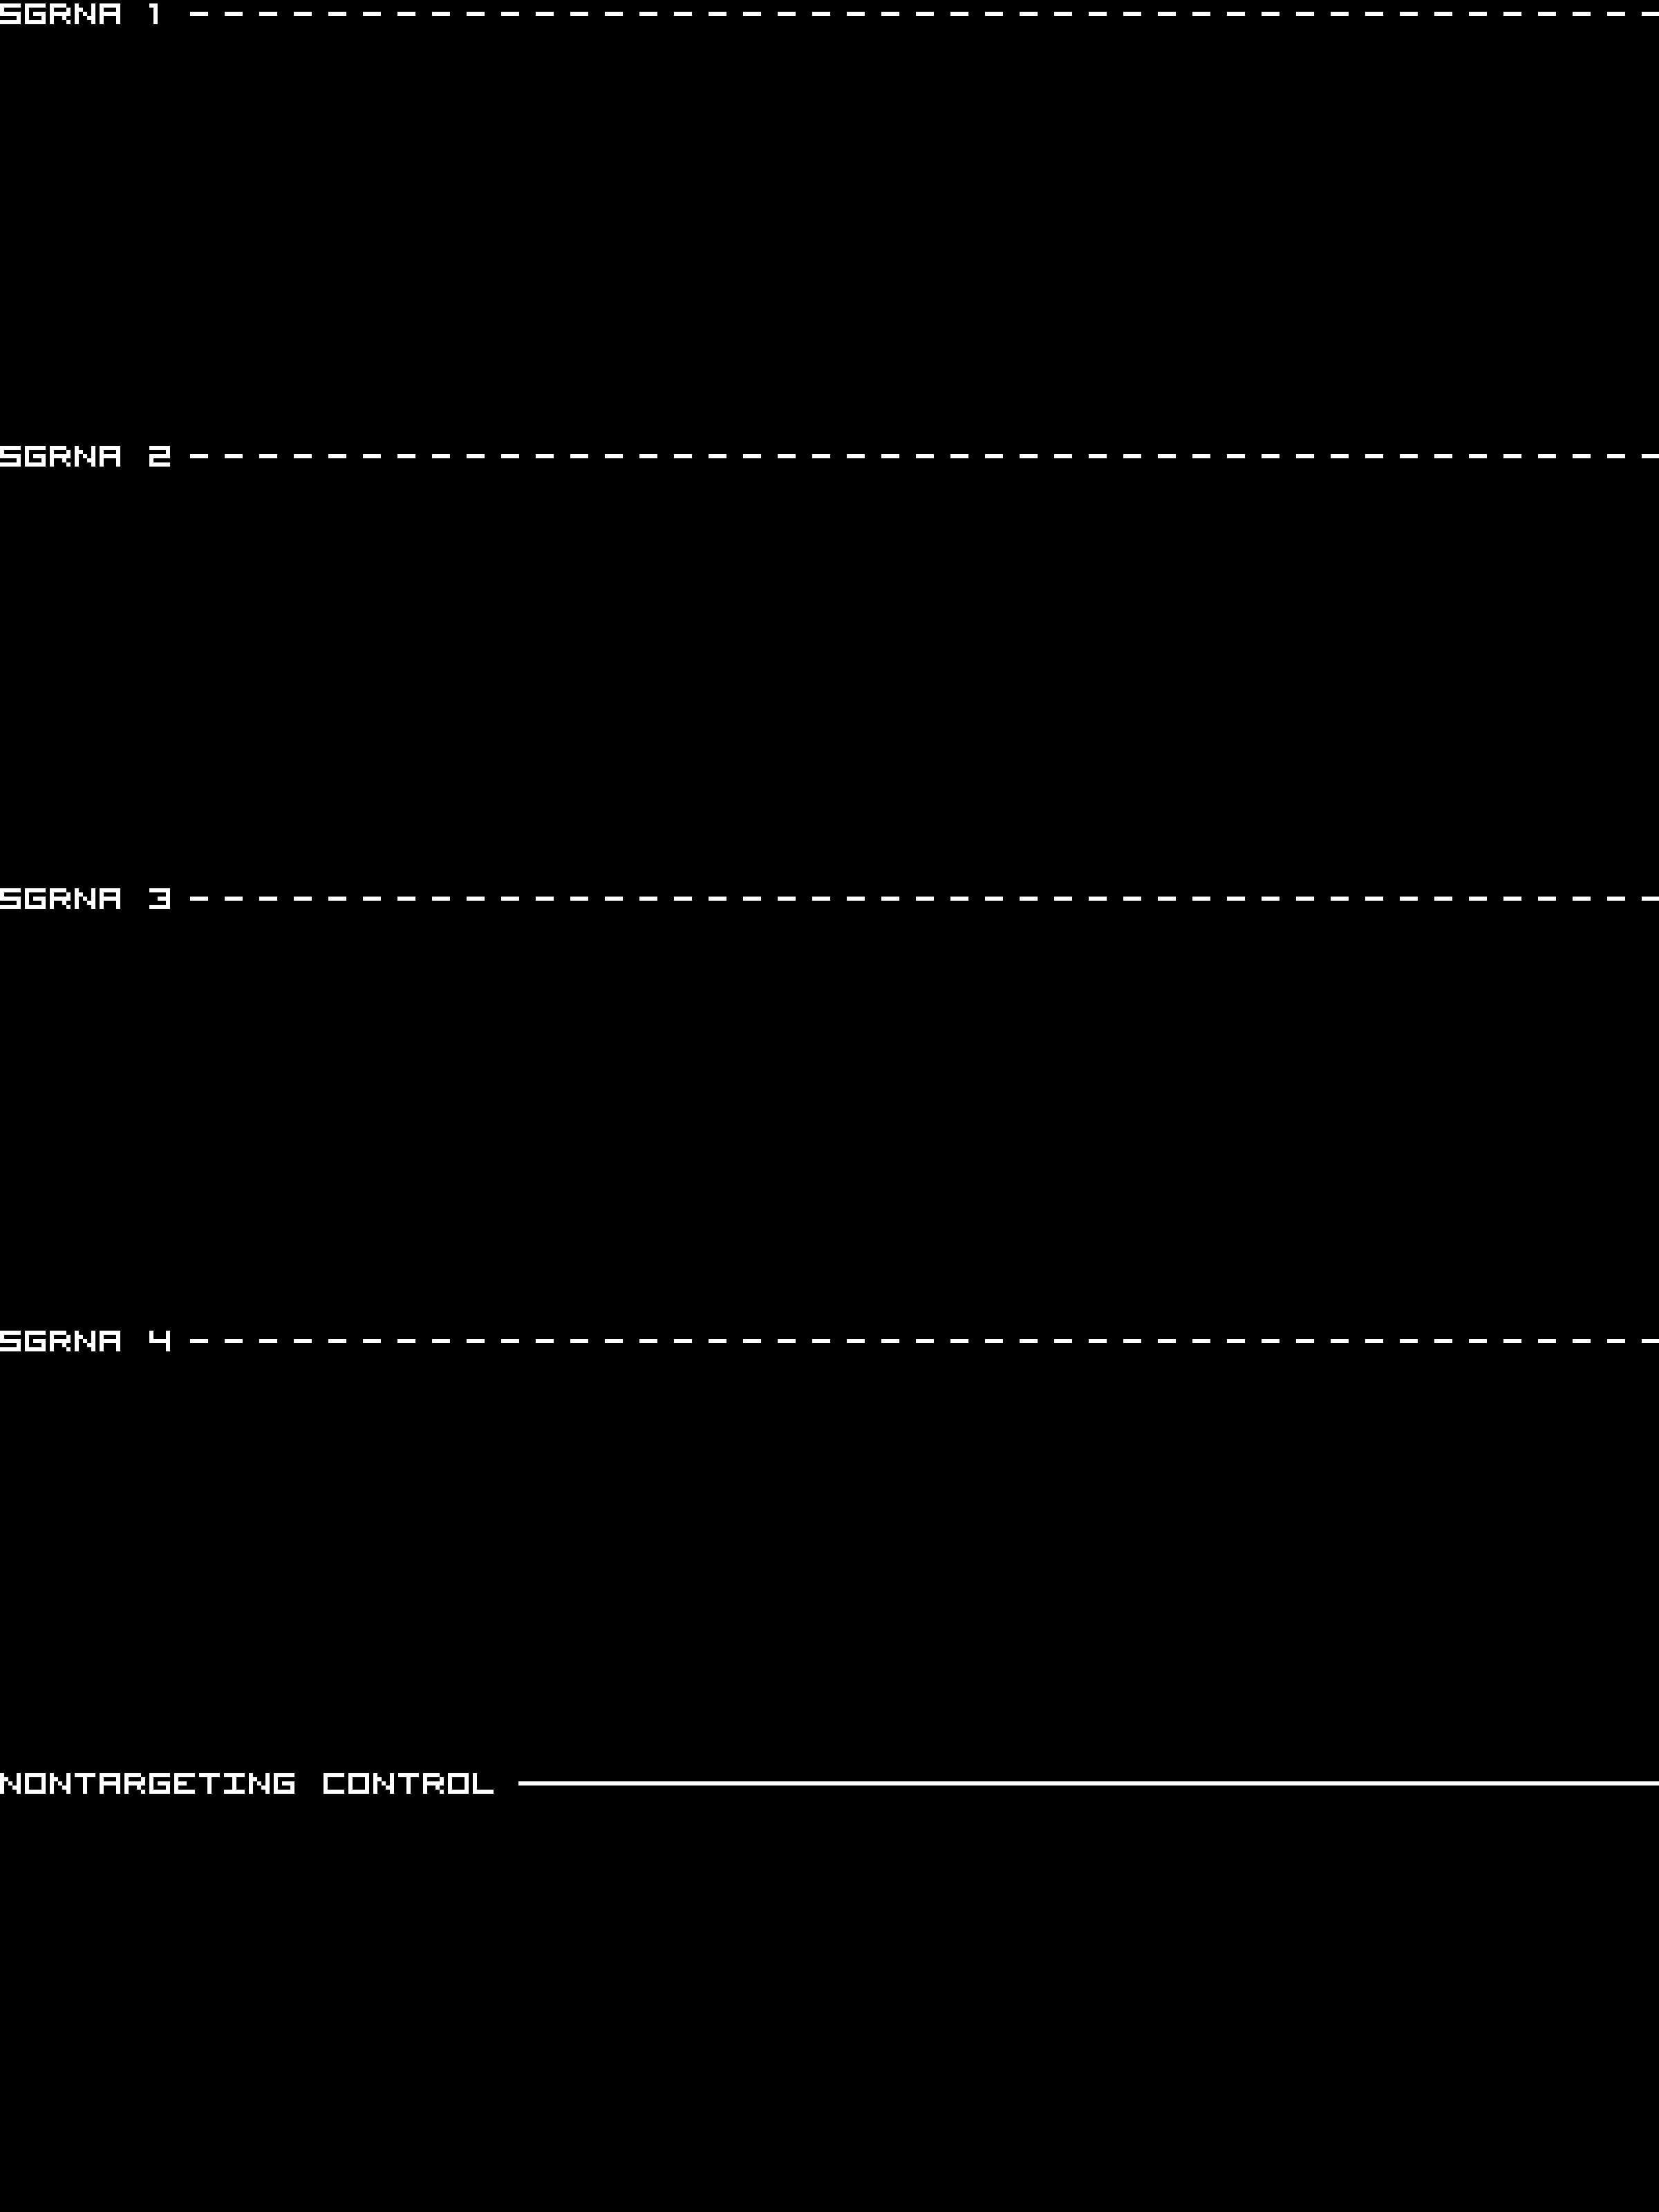
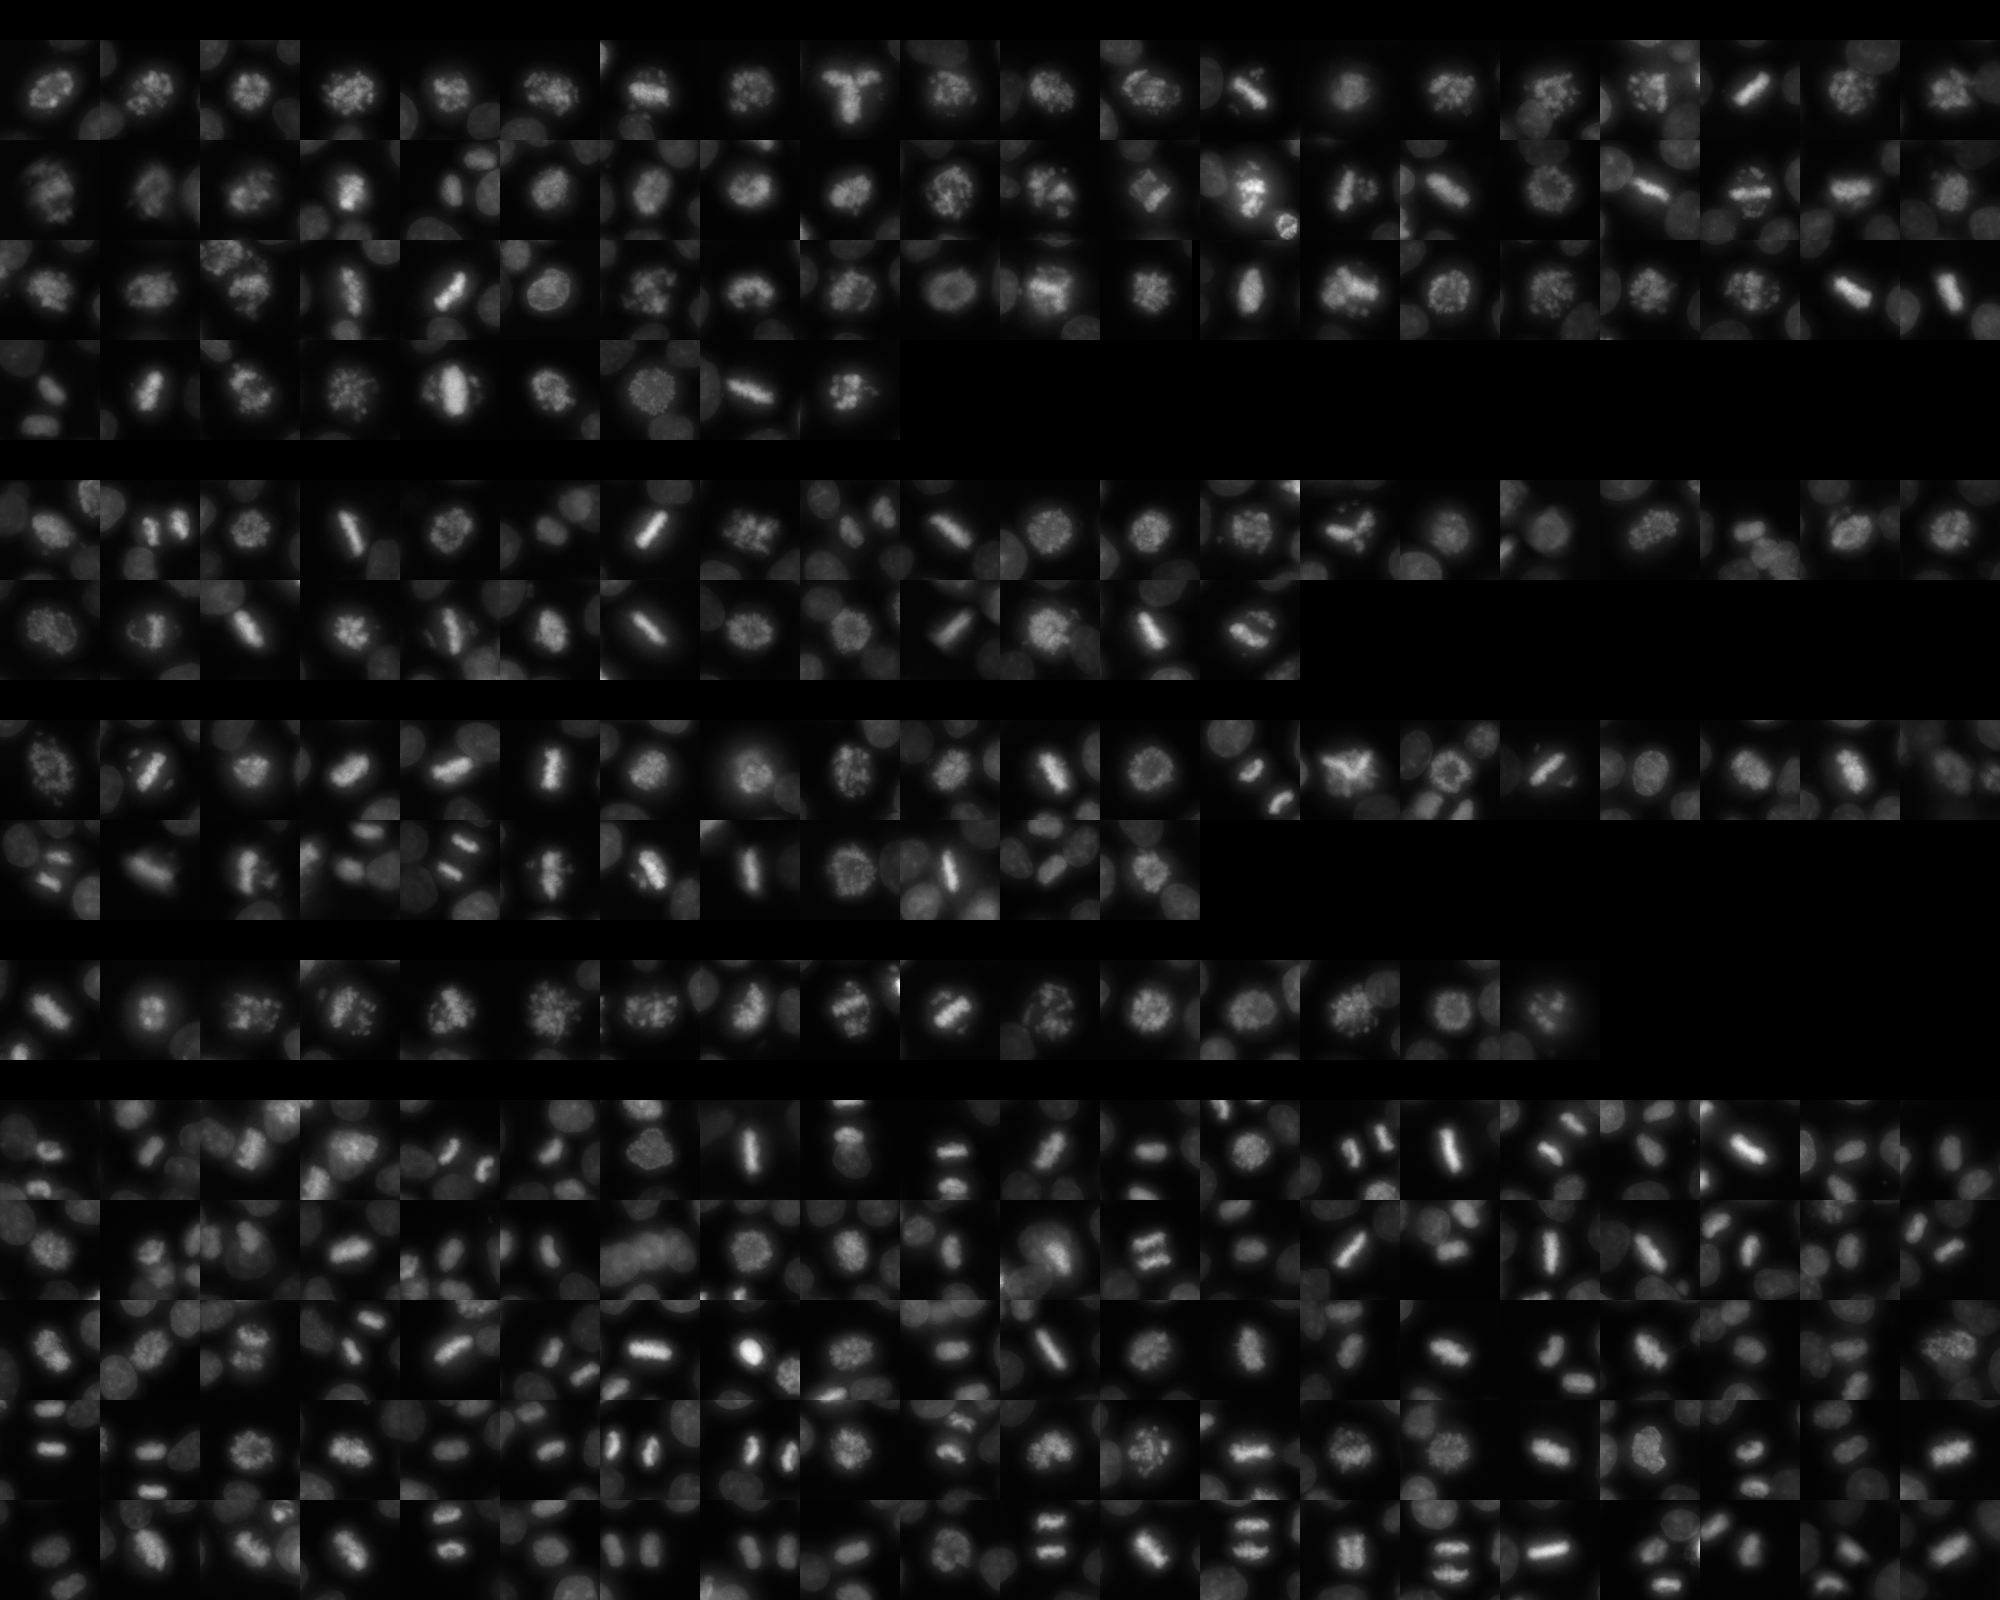
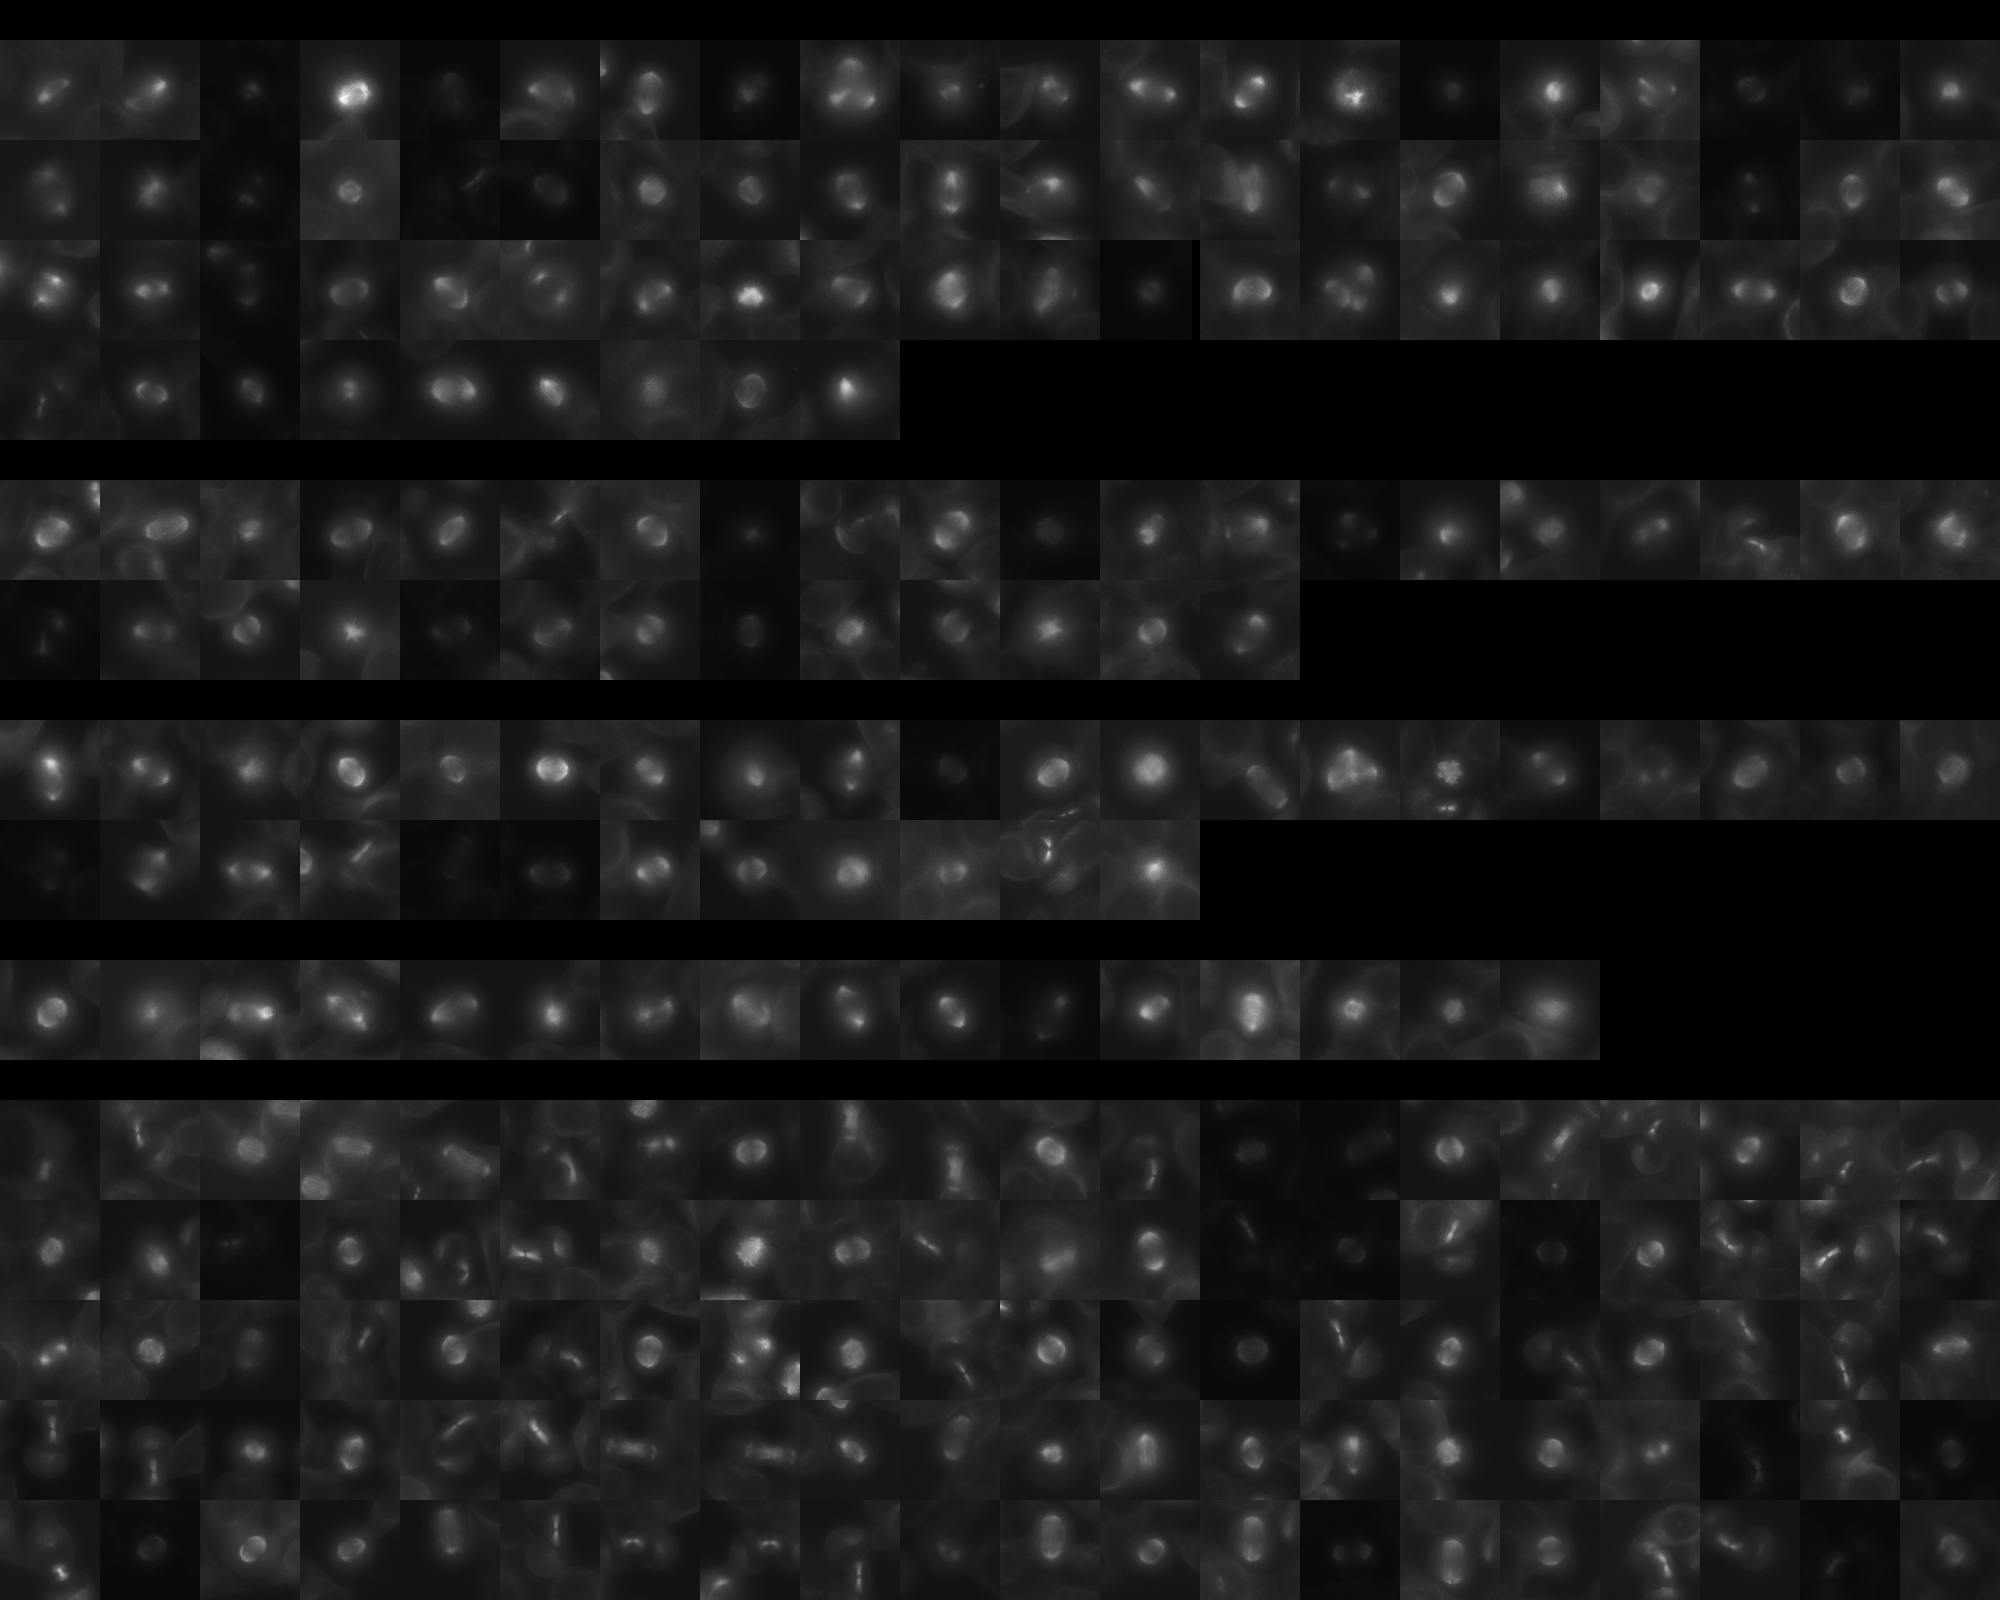
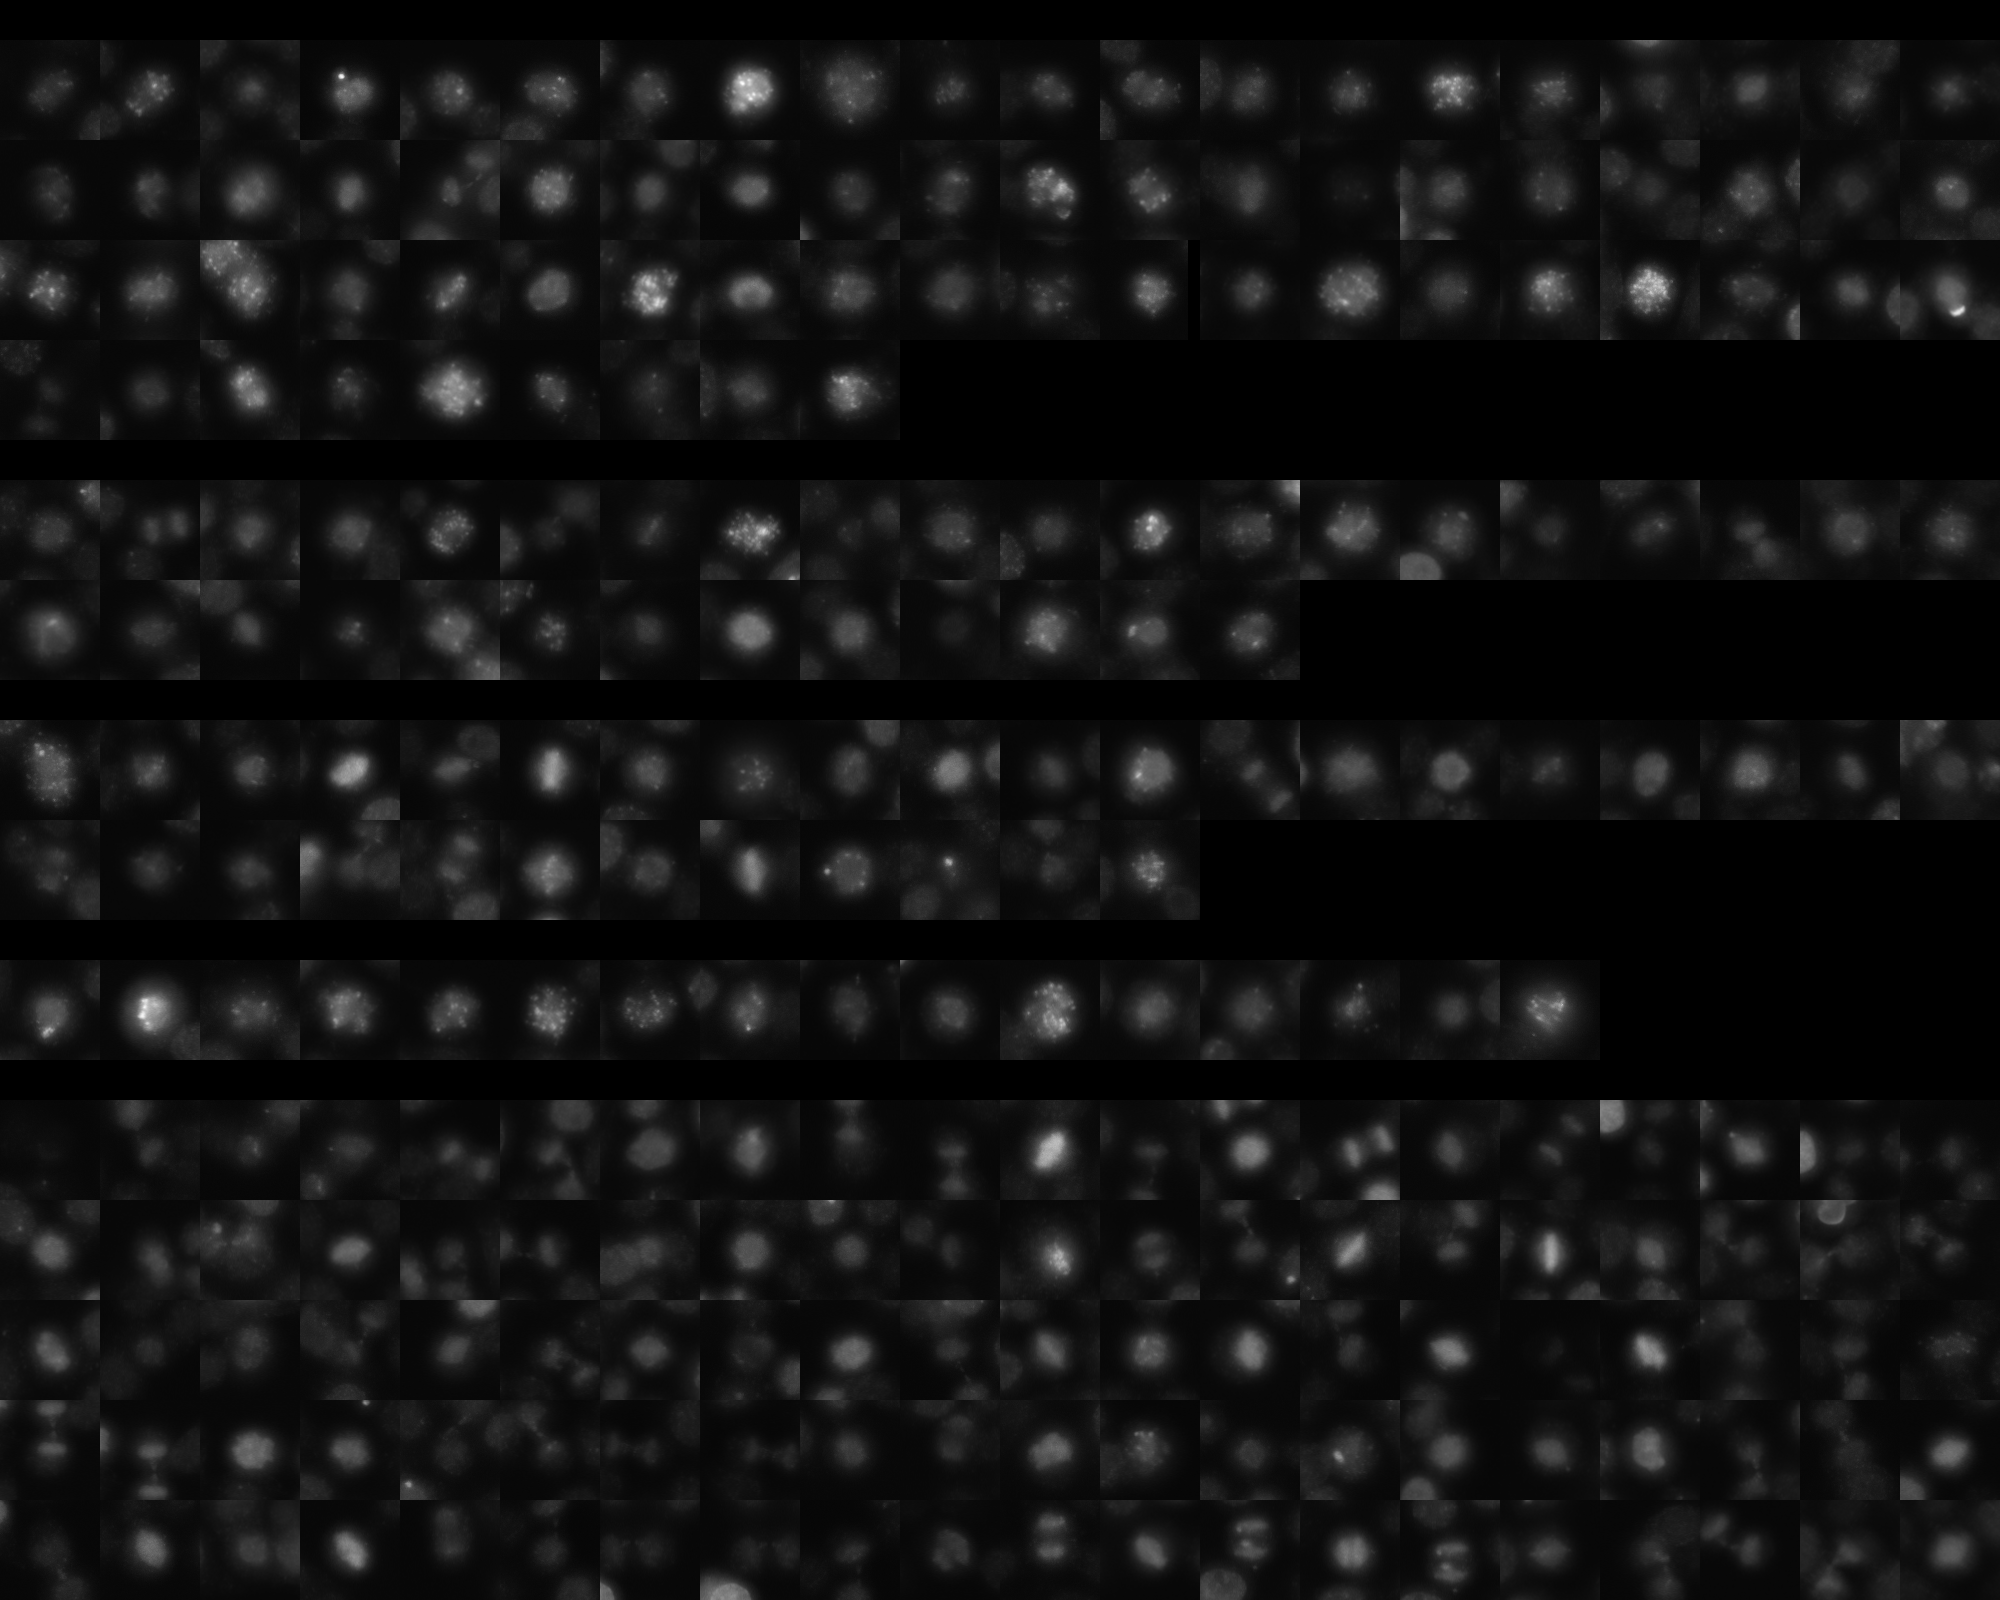
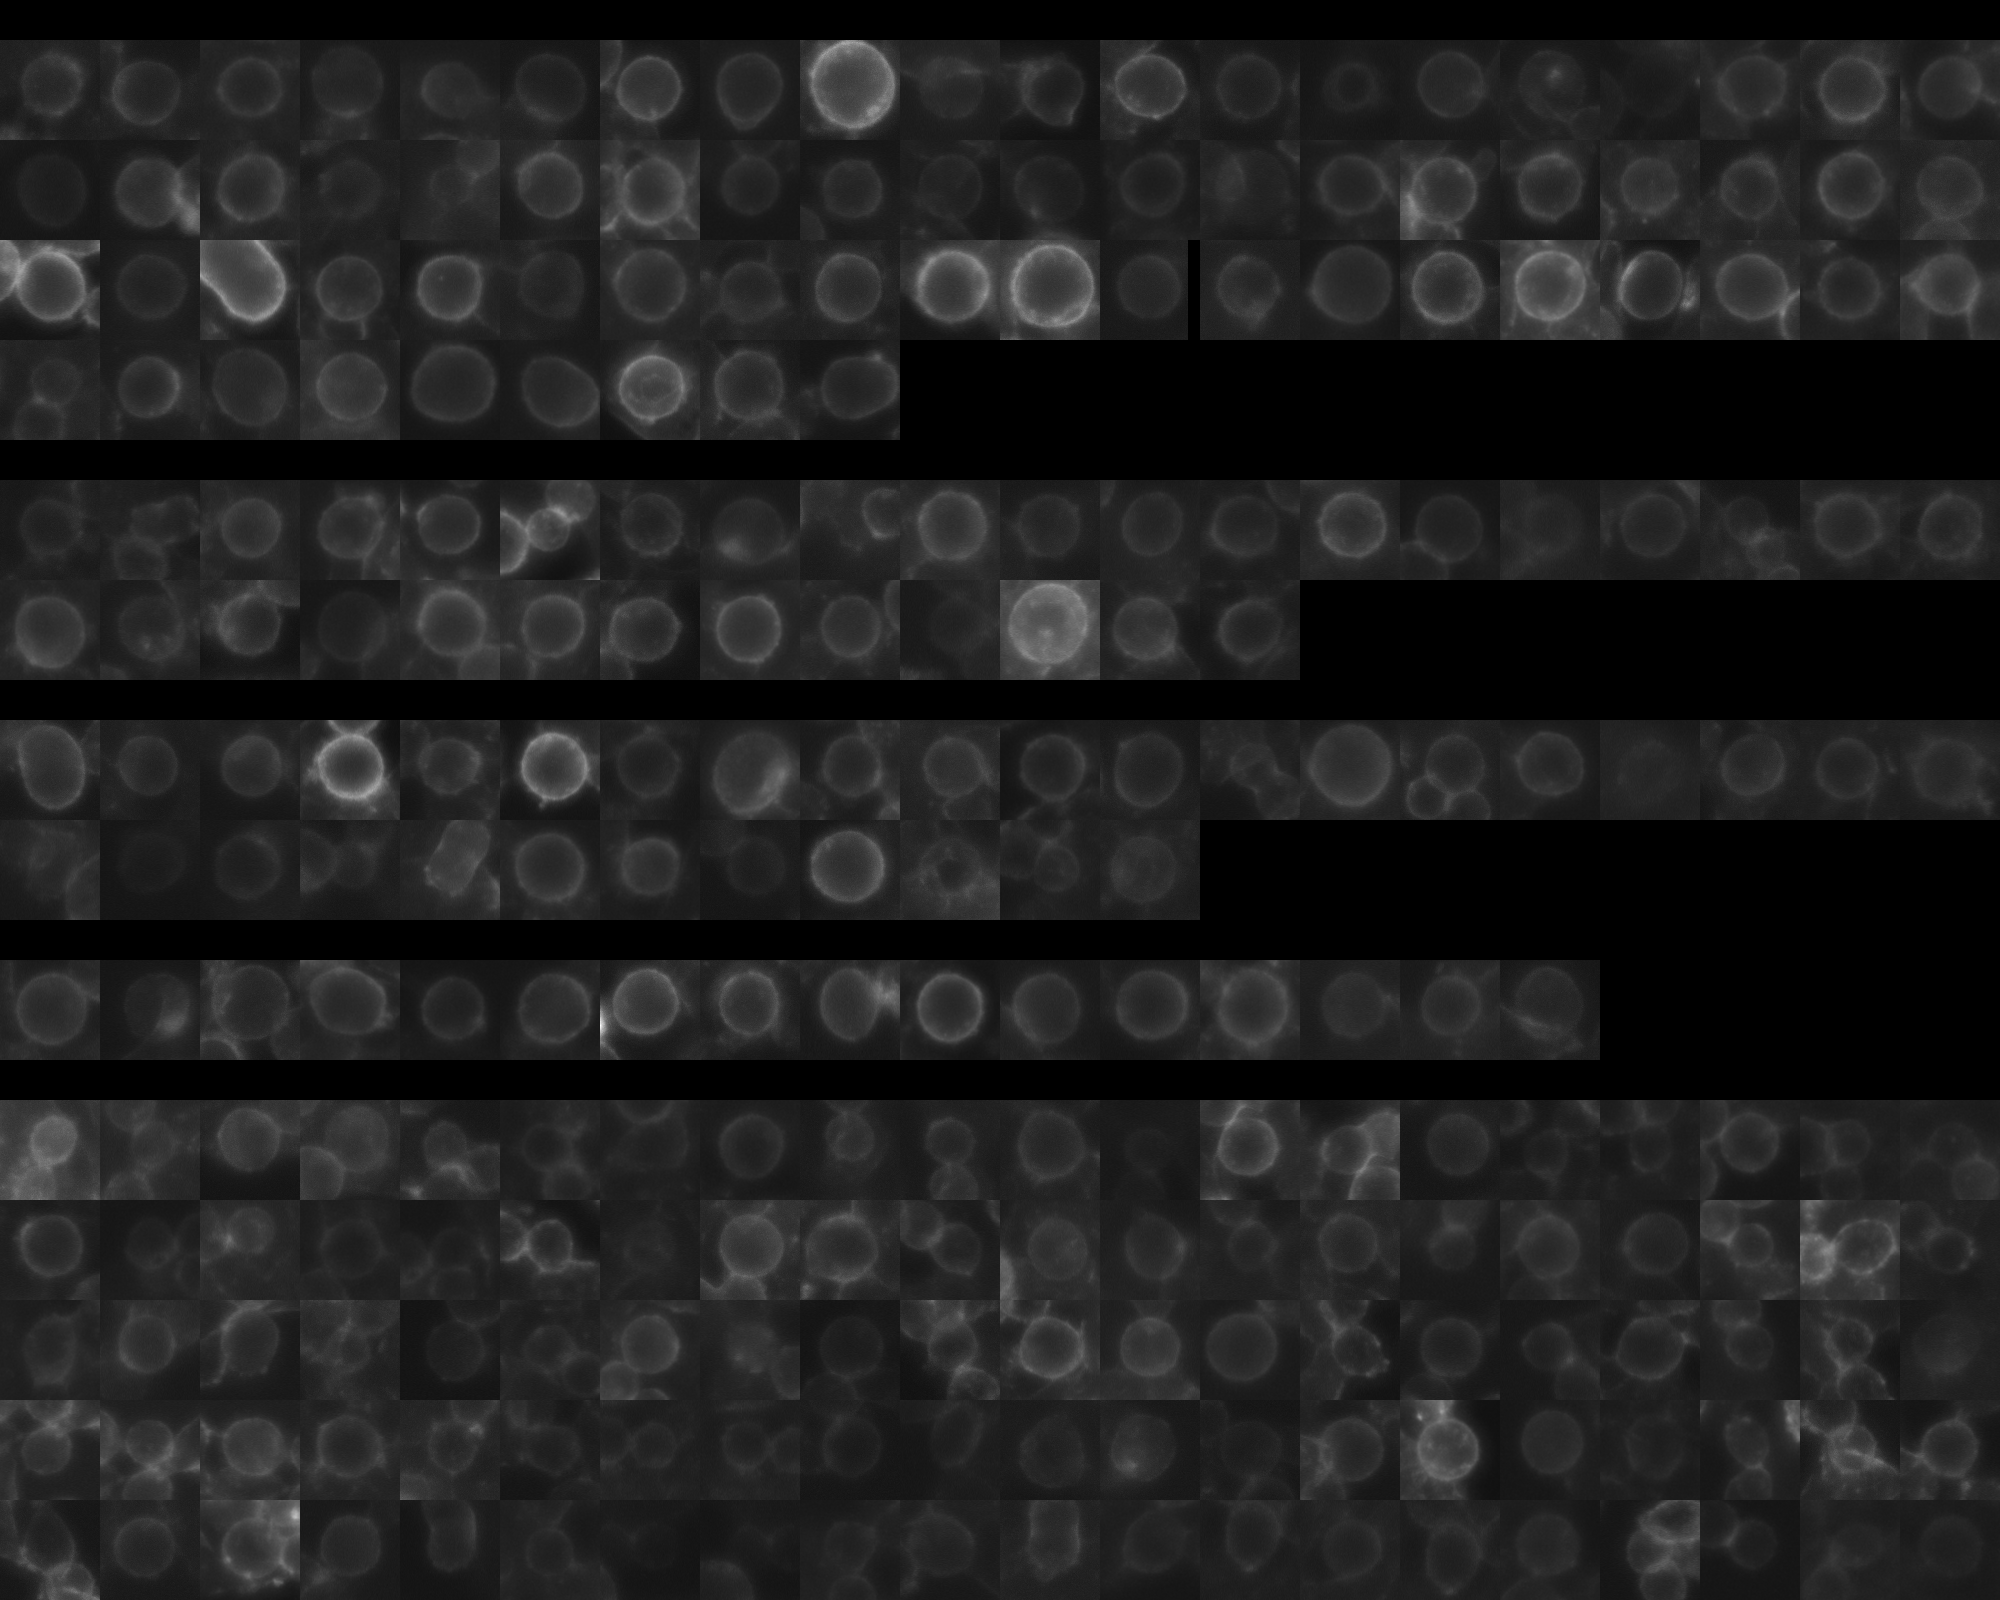
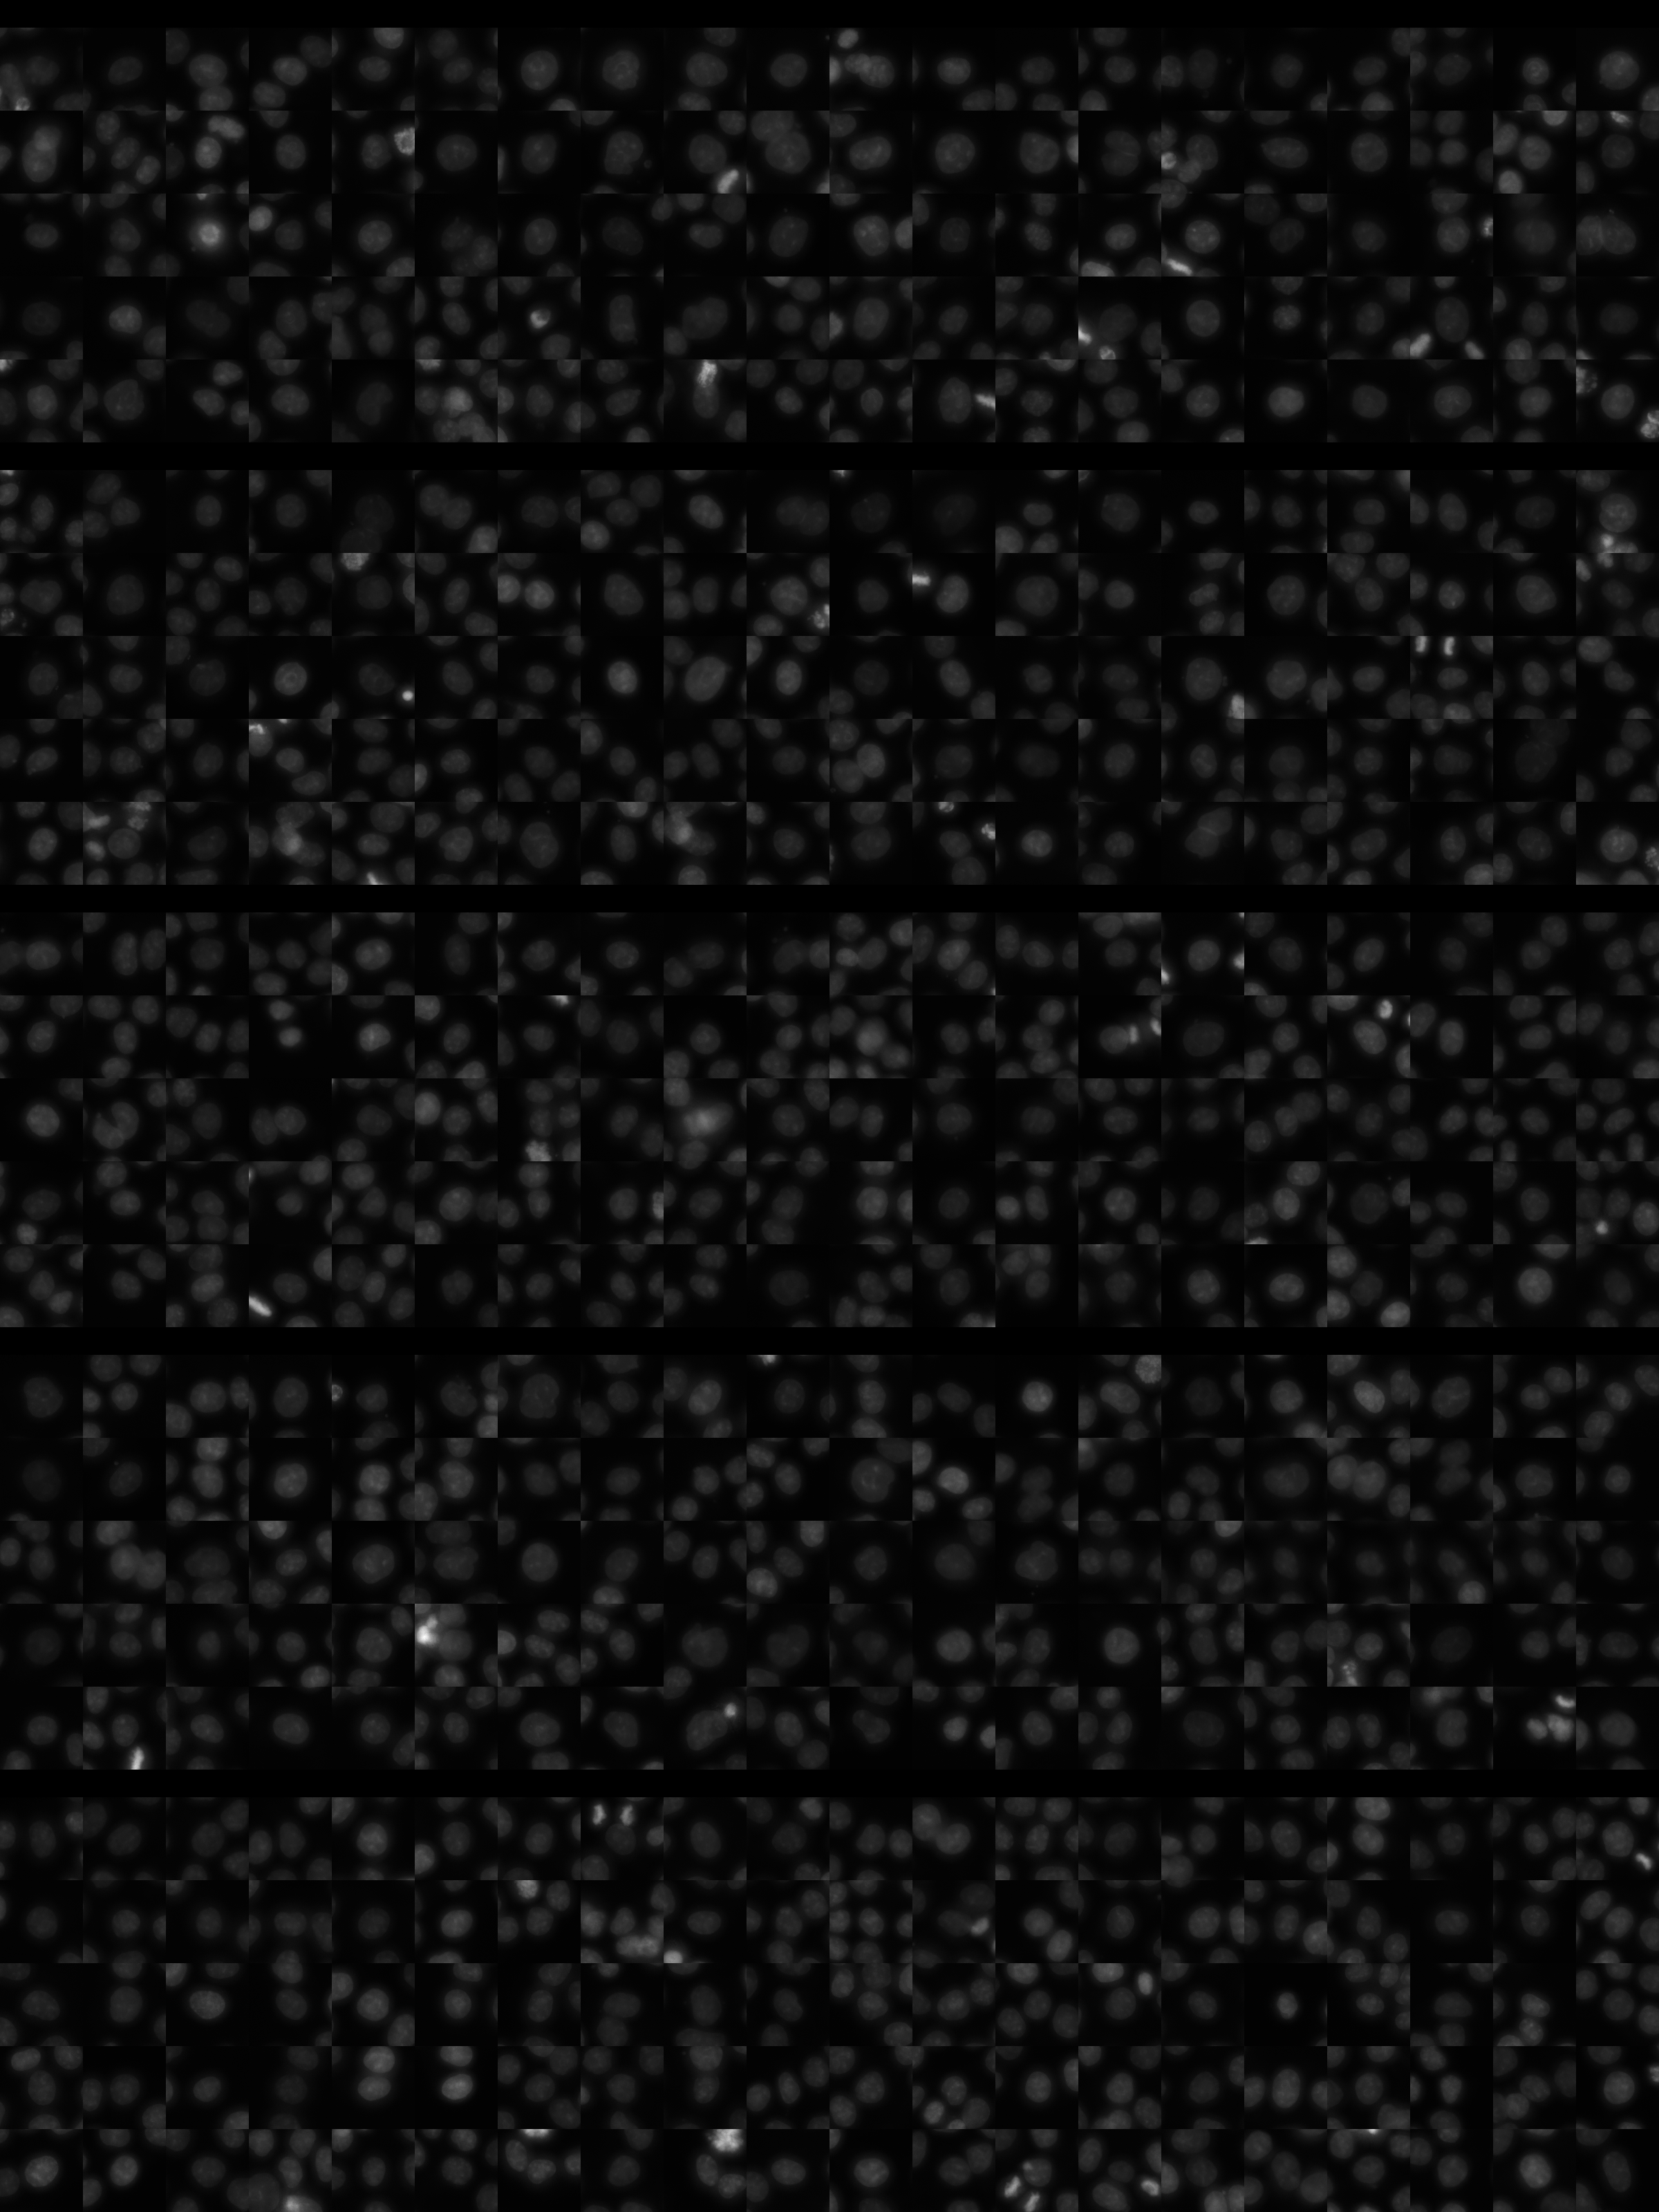
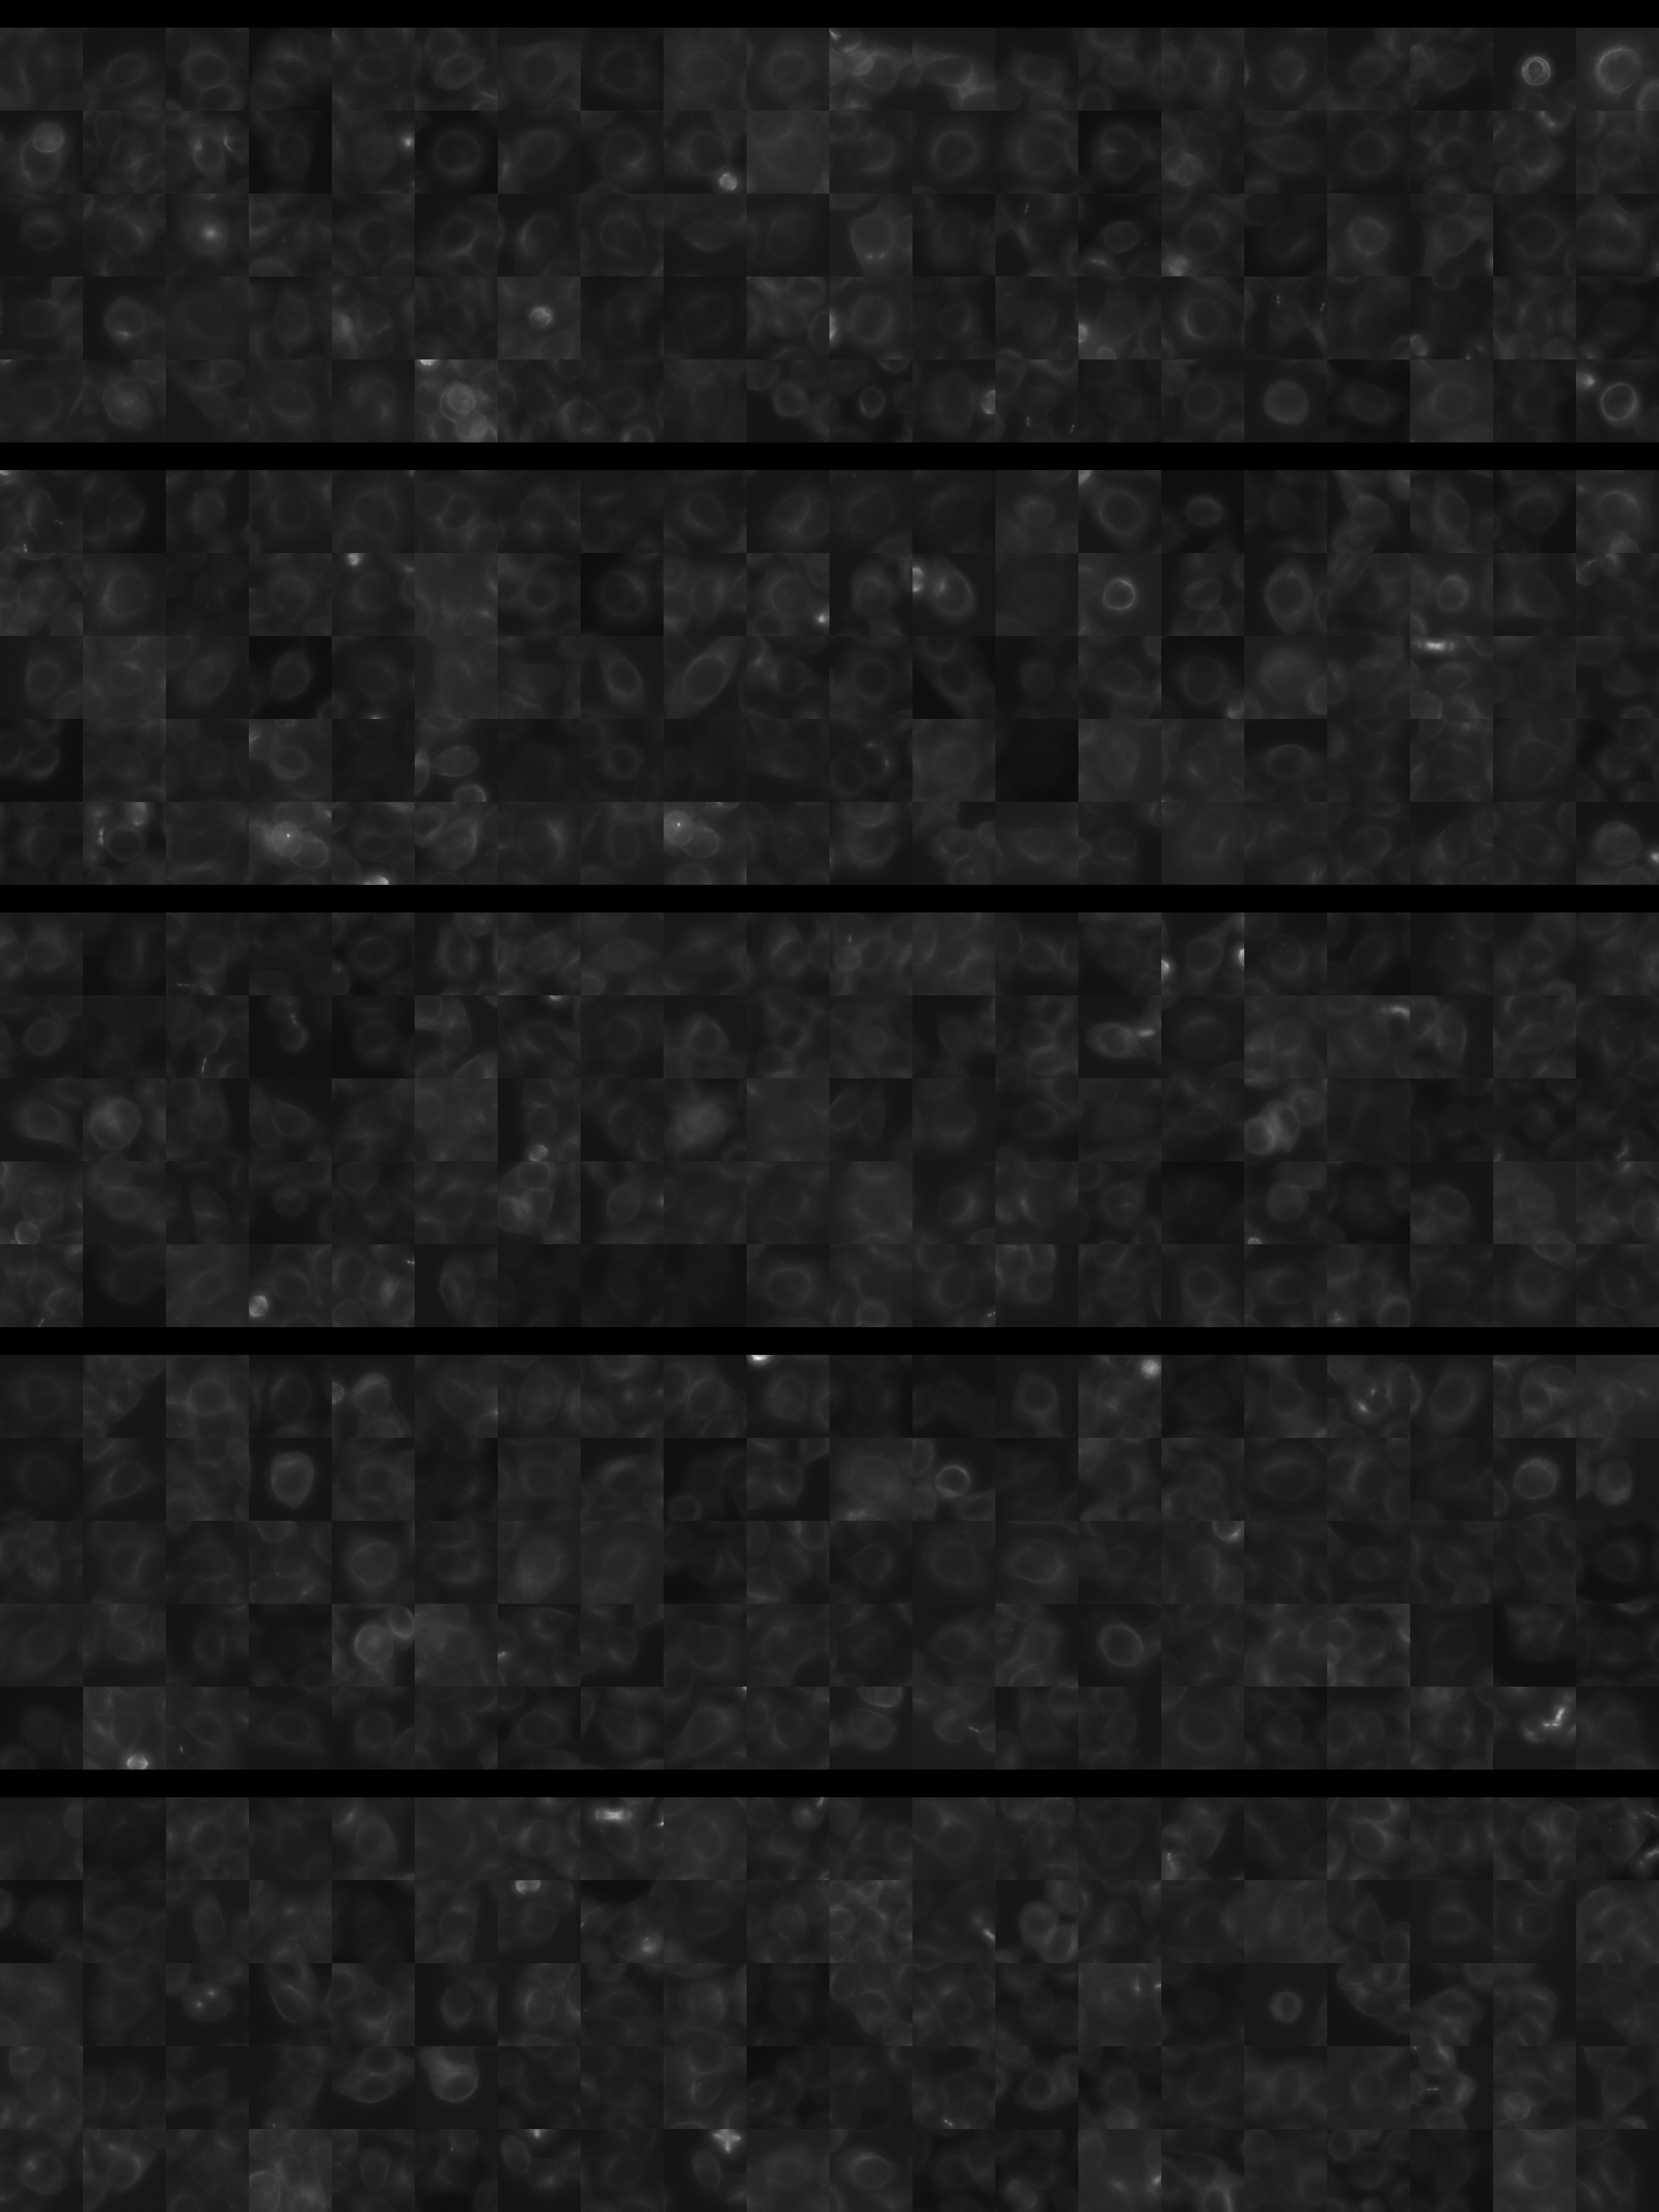
Each montage below shows randomly selected individual cell images for the same target gene separated by sgRNA, along with an example montage of cells expressing a non-targeting negative control sgRNA at the bottom. sgRNA labels in the montages correspond to the numbered sgRNA sequences in the gene info table above. The DNA (blue) and tubulin (green) channels are displayed by default, with gH2AX (grayscale) and actin (yellow) available using the check boxes. Channel brightness, contrast, and opacity are adjustable by clicking the arrow next to the channel name. When only one channel is selected, the display defaults to grayscale. Click the “Zoom” checkbox above the channel controls to enable image zooming (via scrolling) and panning (via click-and-drag).

The cell boxes displayed for this gene are square, 36.43 μm per side for the interphase montage and 30.36 μm per side for the mitotic montage.
Features

Interphase Score Rank FDR q-value
Nucleus DNA Integrated 0.473 43 of 5322 5.407e-04
Nucleus DNA Mean -2.284e-01 5165 of 5322 1.505e-04
Nucleus gH2AX Mean 0.462 120 of 5322 1.367e-04
Nucleus DNA - gH2AX Correlation -1.609e-01 4859 of 5322 1.021e-04
Nucleus Shape Area 0.825 26 of 5322 1.633e-04
Nucleus Shape Eccentricity -1.218e-01 5165 of 5322 0.013
Nucleus Shape Form Factor -8.030e-02 3914 of 5322 0.118
Nucleus Shape Solidity 0.116 24 of 5322 0.004
Cell DNA Mass Displacement 0.072 515 of 5322 0.326
Cell Tubulin Mean -5.908e-02 4493 of 5322 0.347
Cell Tubulin Mass Displacement 0.008 2503 of 5322 0.946
Cell Actin Mean 0.044 1692 of 5322 0.515
Cell Tubulin - Actin Correlation 0.243 109 of 5322 2.896e-04
Cell DNA - Tubulin Correlation 0.213 311 of 5322 1.948e-04
Cell Shape Area 0.645 35 of 5322 1.651e-04
Cell Shape Eccentricity -1.698e-01 5314 of 5322 0.004
Mitotic Score Rank FDR q-value
Nucleus DNA Integrated 0.660 34 of 5322 0.061
Nucleus DNA Mean -3.431e-01 5265 of 5322 1.000
Nucleus DNA Mass Displacement -6.367e-02 4343 of 5322 0.999
Nucleus DNA Mean Frac 3 0.703 10 of 5322 0.018
Nucleus gH2AX Mean 0.576 58 of 5322 0.251
Nucleus gH2AX Mean Frac 0 -3.167e-01 5210 of 5322 1.000
Nucleus Tubulin Mean Frac 0 0.315 291 of 5322 0.968
Nucleus Tubulin Mean Edge -1.217e-01 4484 of 5322 0.999
Nucleus Tubulin Std Edge -6.186e-01 5248 of 5322 0.004
Nucleus Shape Area 1.261 7 of 5322 0.001
Nucleus Shape Eccentricity -4.750e-01 5193 of 5322 0.562
Nucleus Shape Form Factor -7.612e-01 5293 of 5322 0.047
Cell Tubulin Mean 0.244 690 of 5322 0.975
Cell Tubulin Mean Frac 3 -5.959e-01 5263 of 5322 0.042
Cell Actin Mean 0.695 31 of 5322 0.084
Cell Shape Area 1.064 11 of 5322 0.004
( Reset Zoom )
Brightness
Contrast
Opacity
Brightness
Contrast
Opacity
Brightness
Contrast
Opacity
Brightness
Contrast
Opacity
Brightness
Contrast
Opacity

( Reset Zoom )
Brightness
Contrast
Opacity
Brightness
Contrast
Opacity
Brightness
Contrast
Opacity
Brightness
Contrast
Opacity
Brightness
Contrast
Opacity

Day 3

Day 4

MIT Central Accessability