TRMT61A

Gene symbol: TRMT61A
Gene: 115708
Uniprot Function: Catalytic subunit of tRNA (adenine-N(1)-)-methyltransferase, which catalyzes the formation of N(1)-methyladenine at position 58 (m1A58) in initiator methionyl-tRNA (PubMed:16043508). Catalytic subunit of mRNA N(1)-methyltransferase complex, which mediates methylation of adenosine residues at the N(1) position of a small subset of mRNAs: N(1) methylation takes place in tRNA T-loop-like structures of mRNAs and is only present at low stoichiometries (PubMed:29107537, PubMed:29072297).
Mitotic Index 0.0234
Interphase Cluster: #90 (25 genes)
Mitotic Cluster: #140 (20 genes)
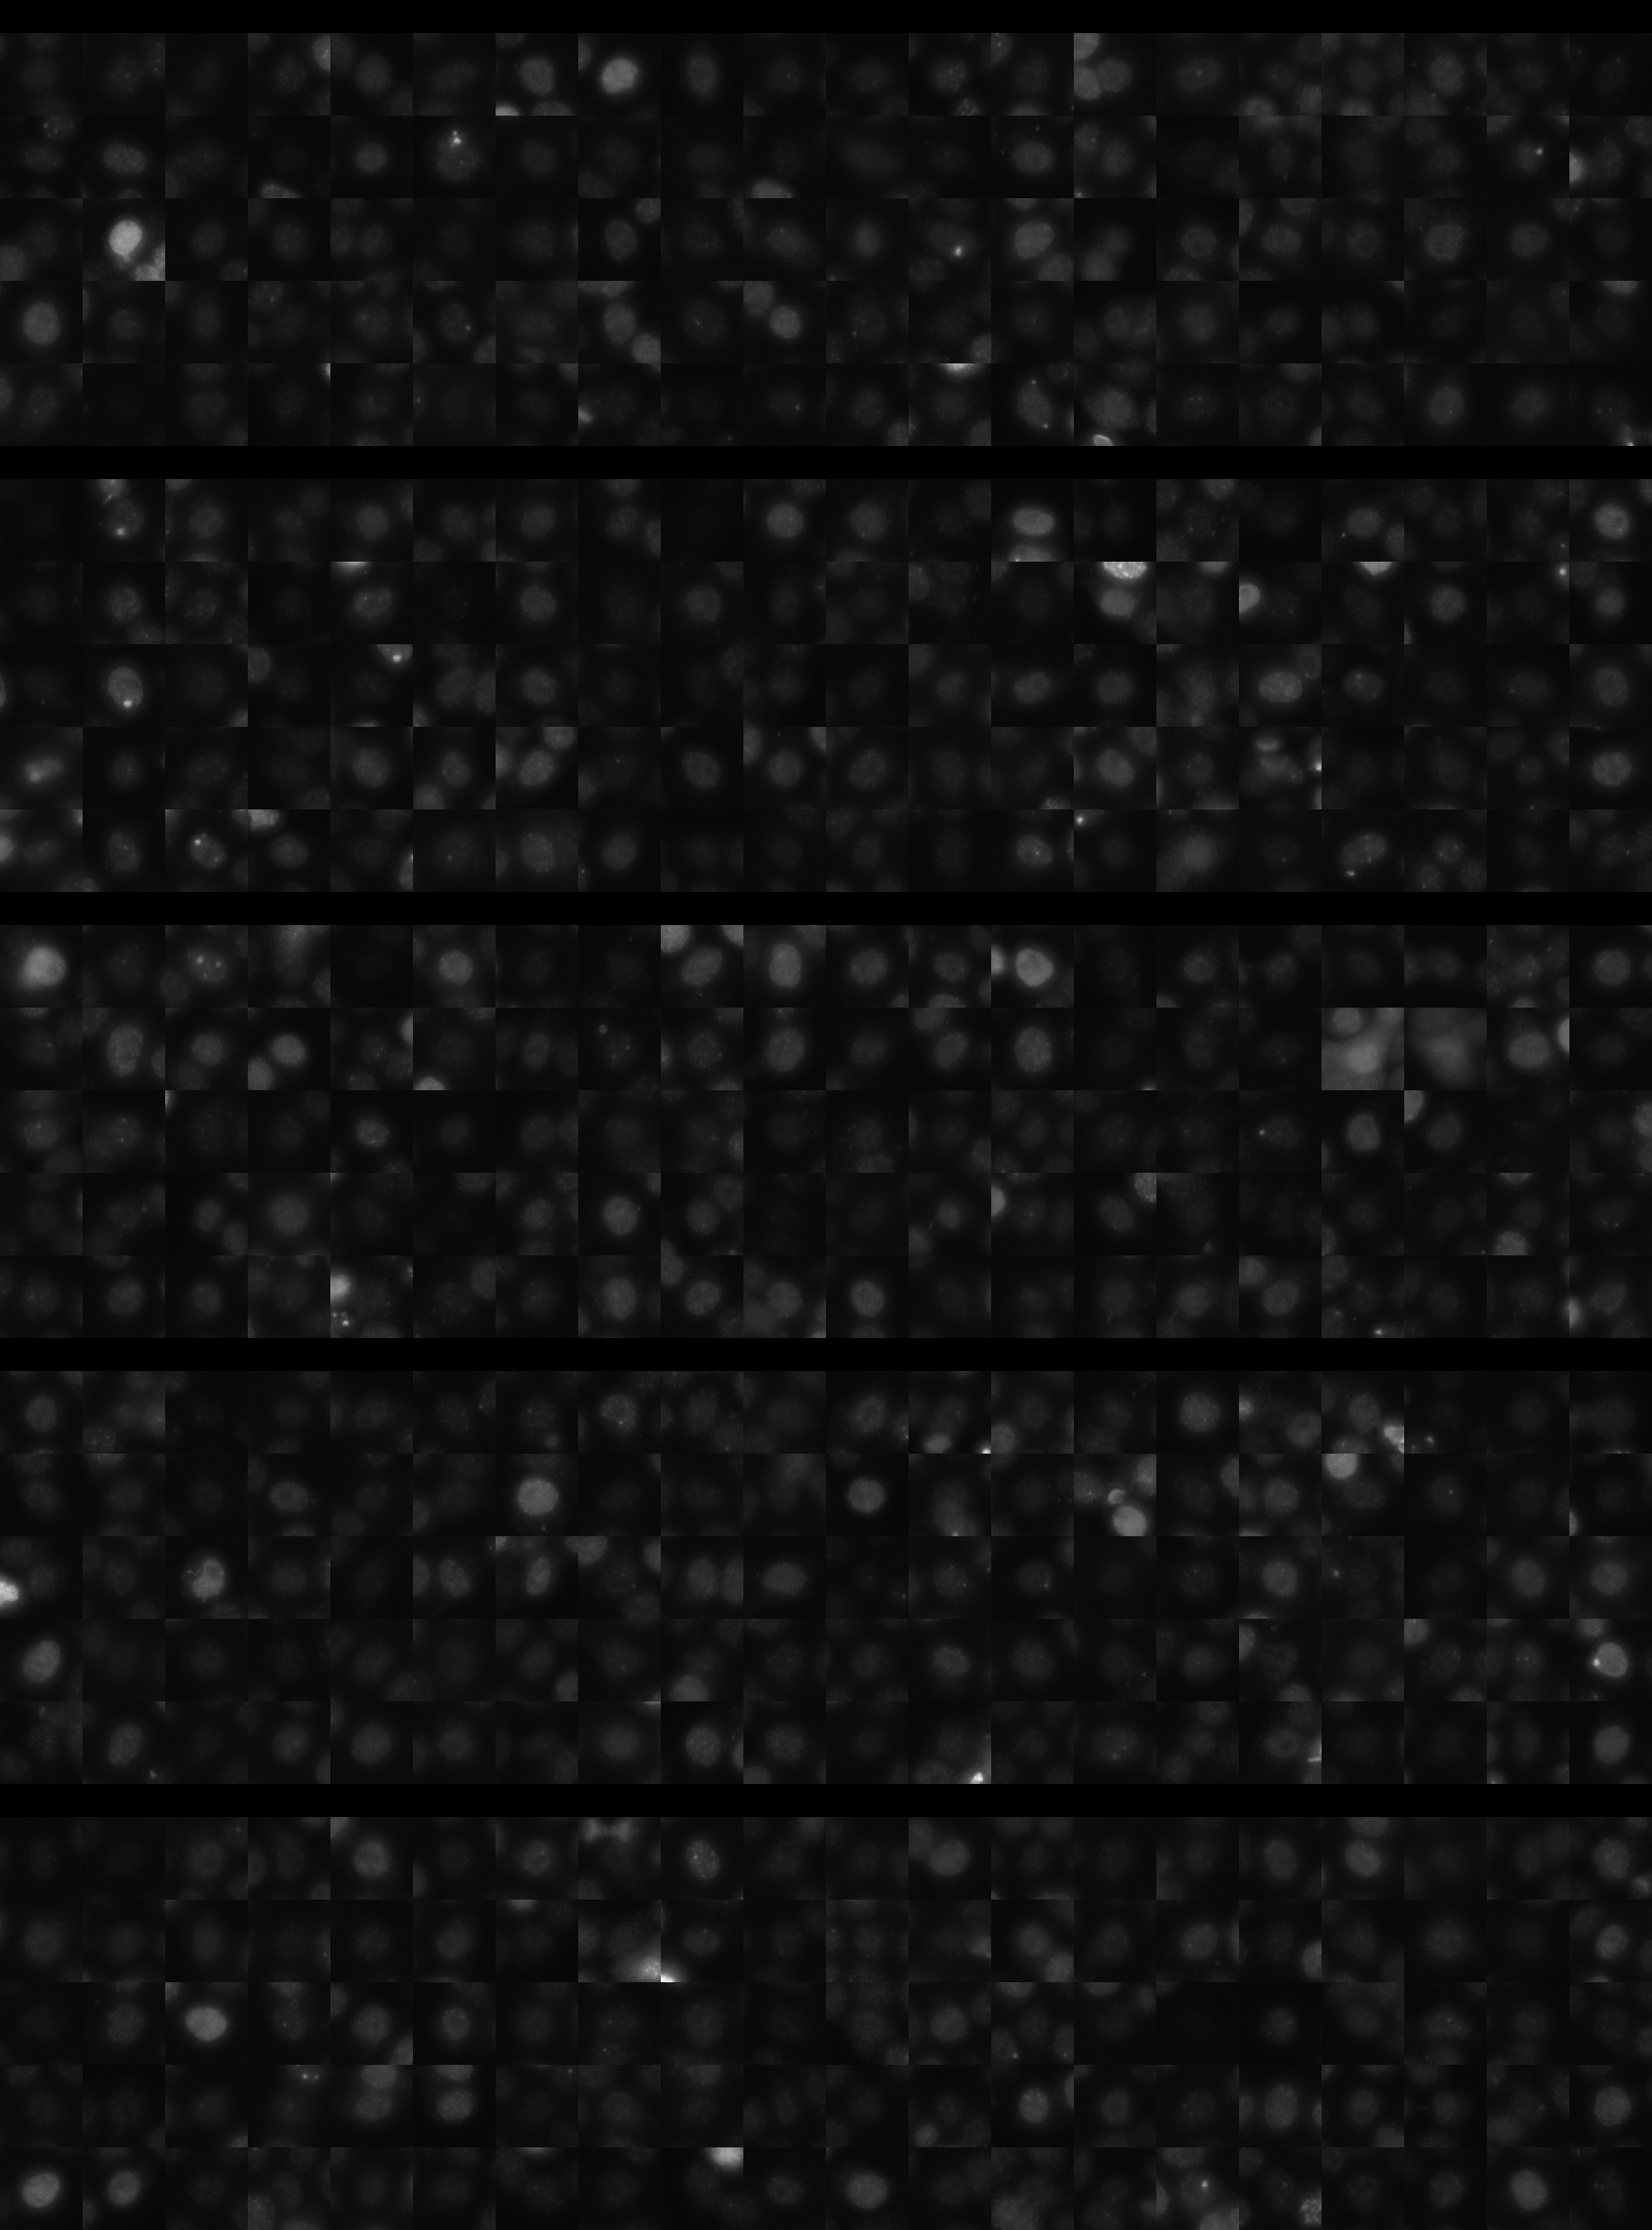
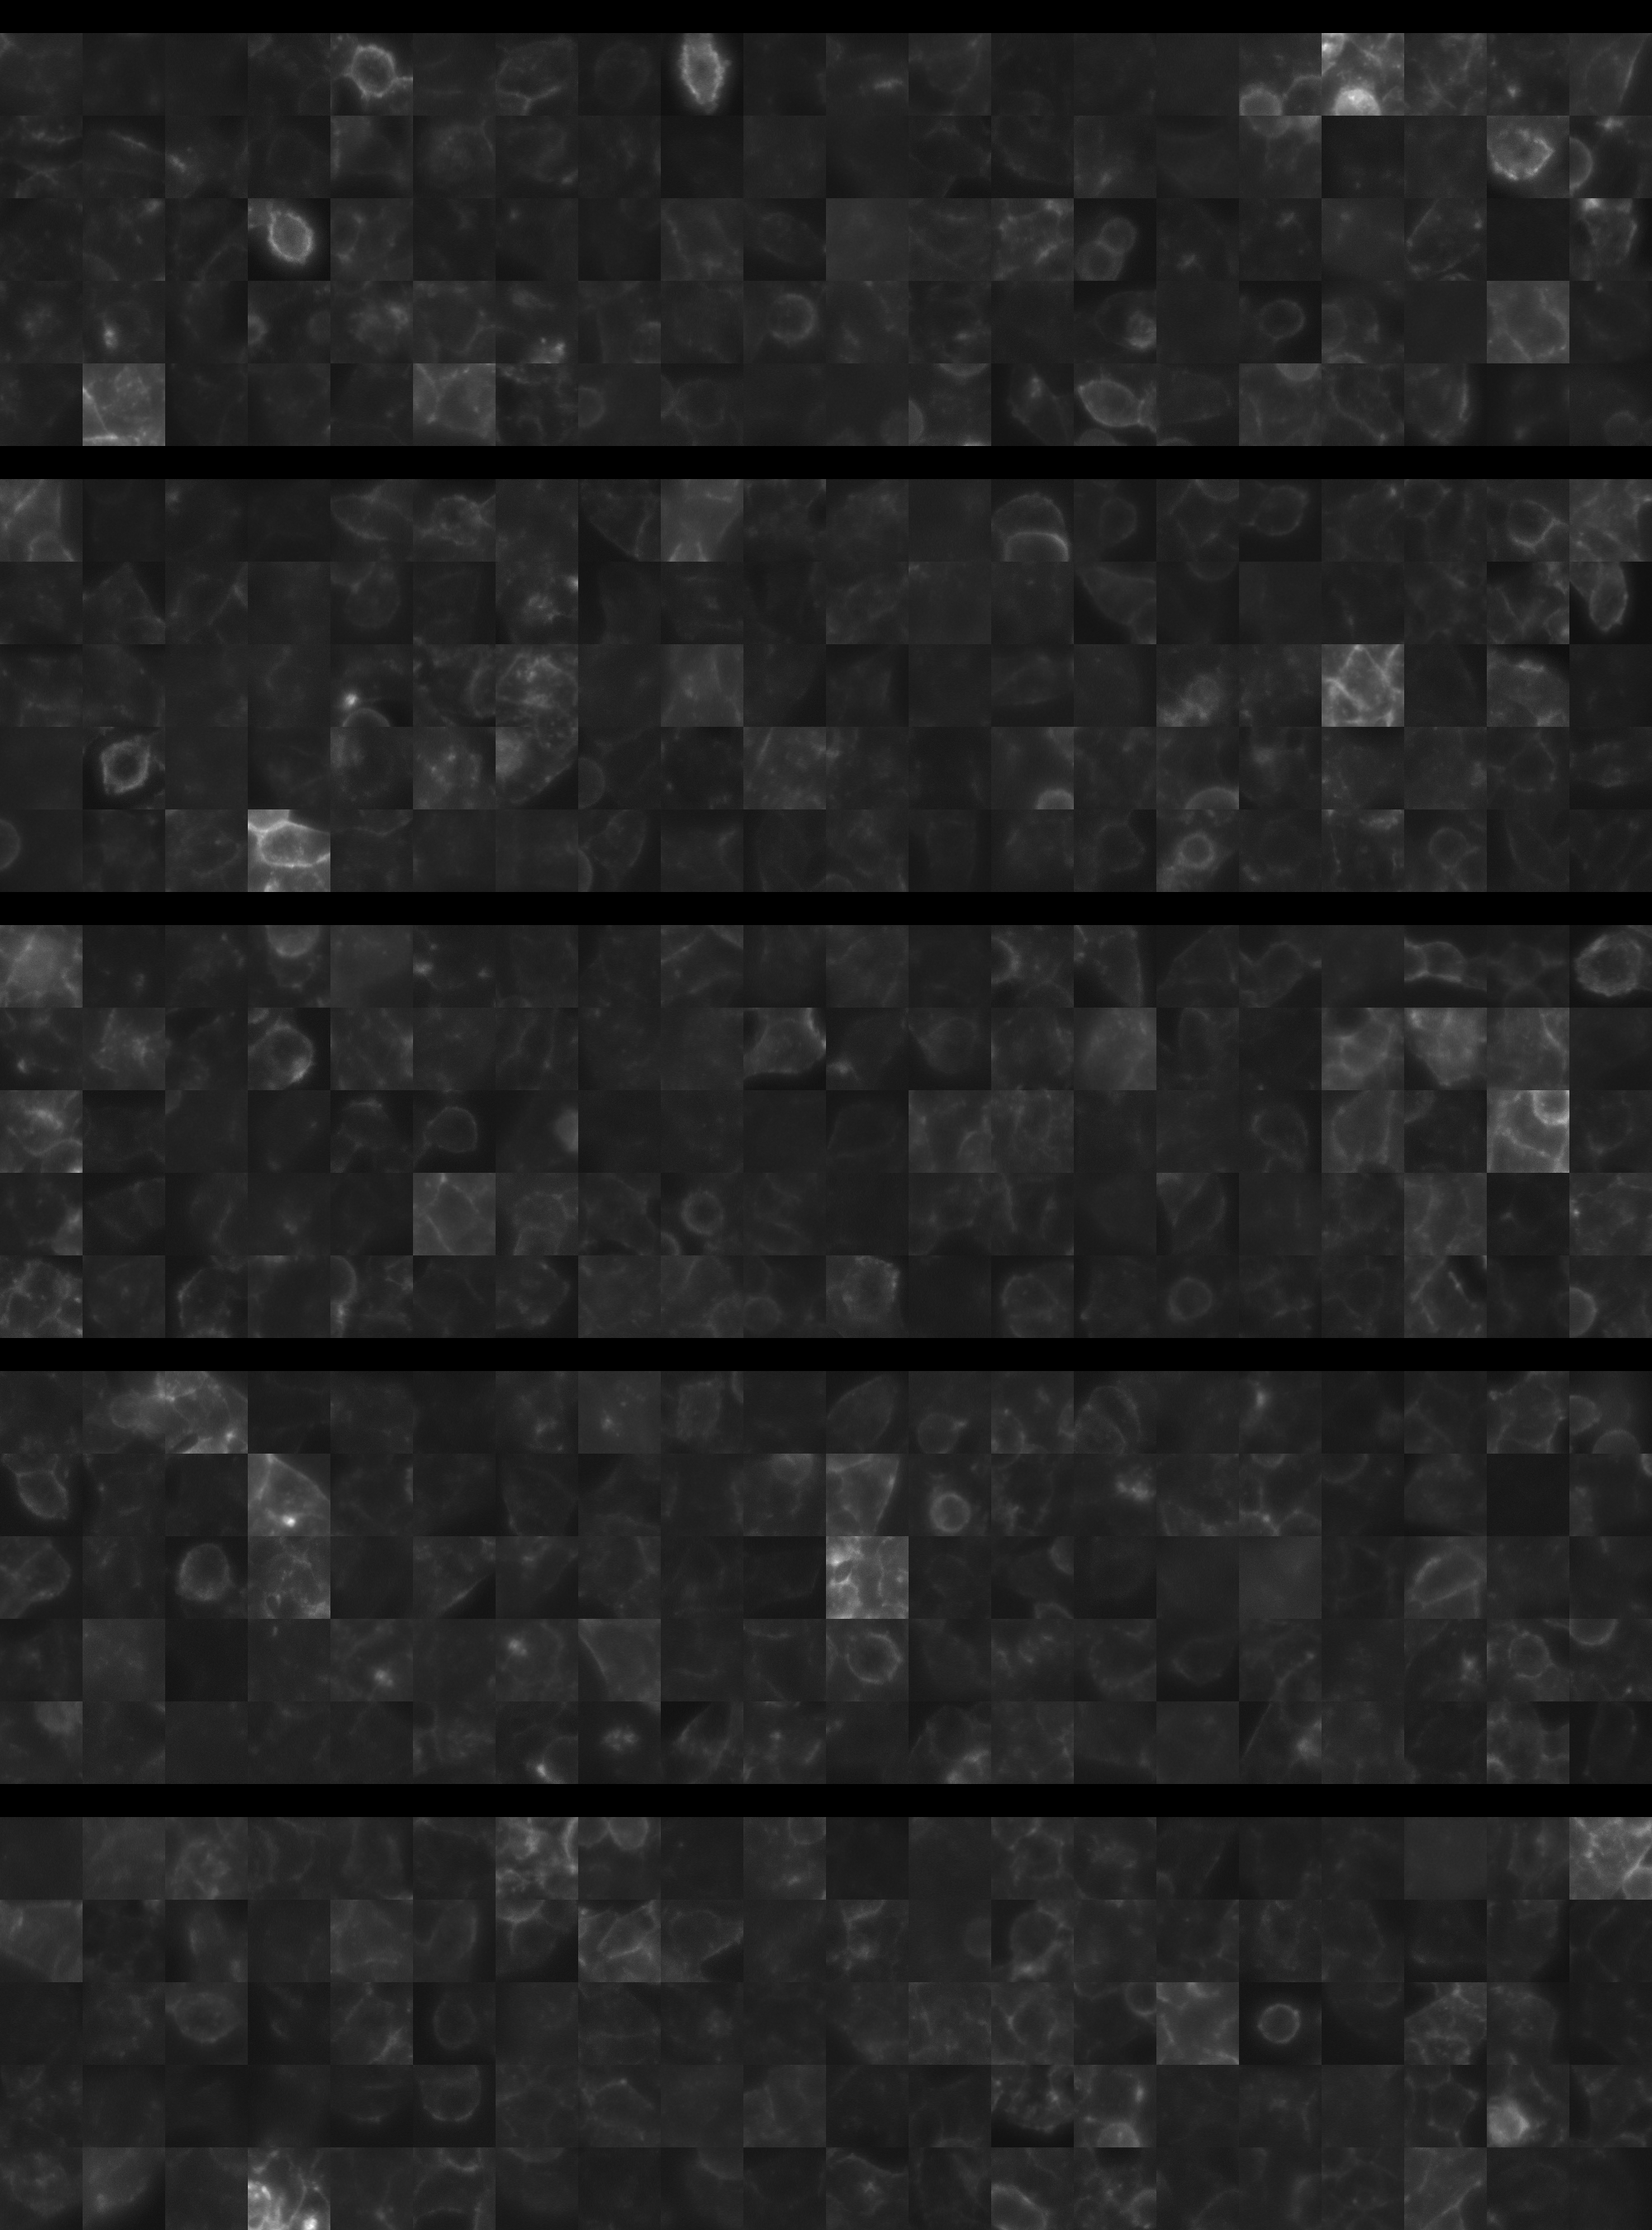
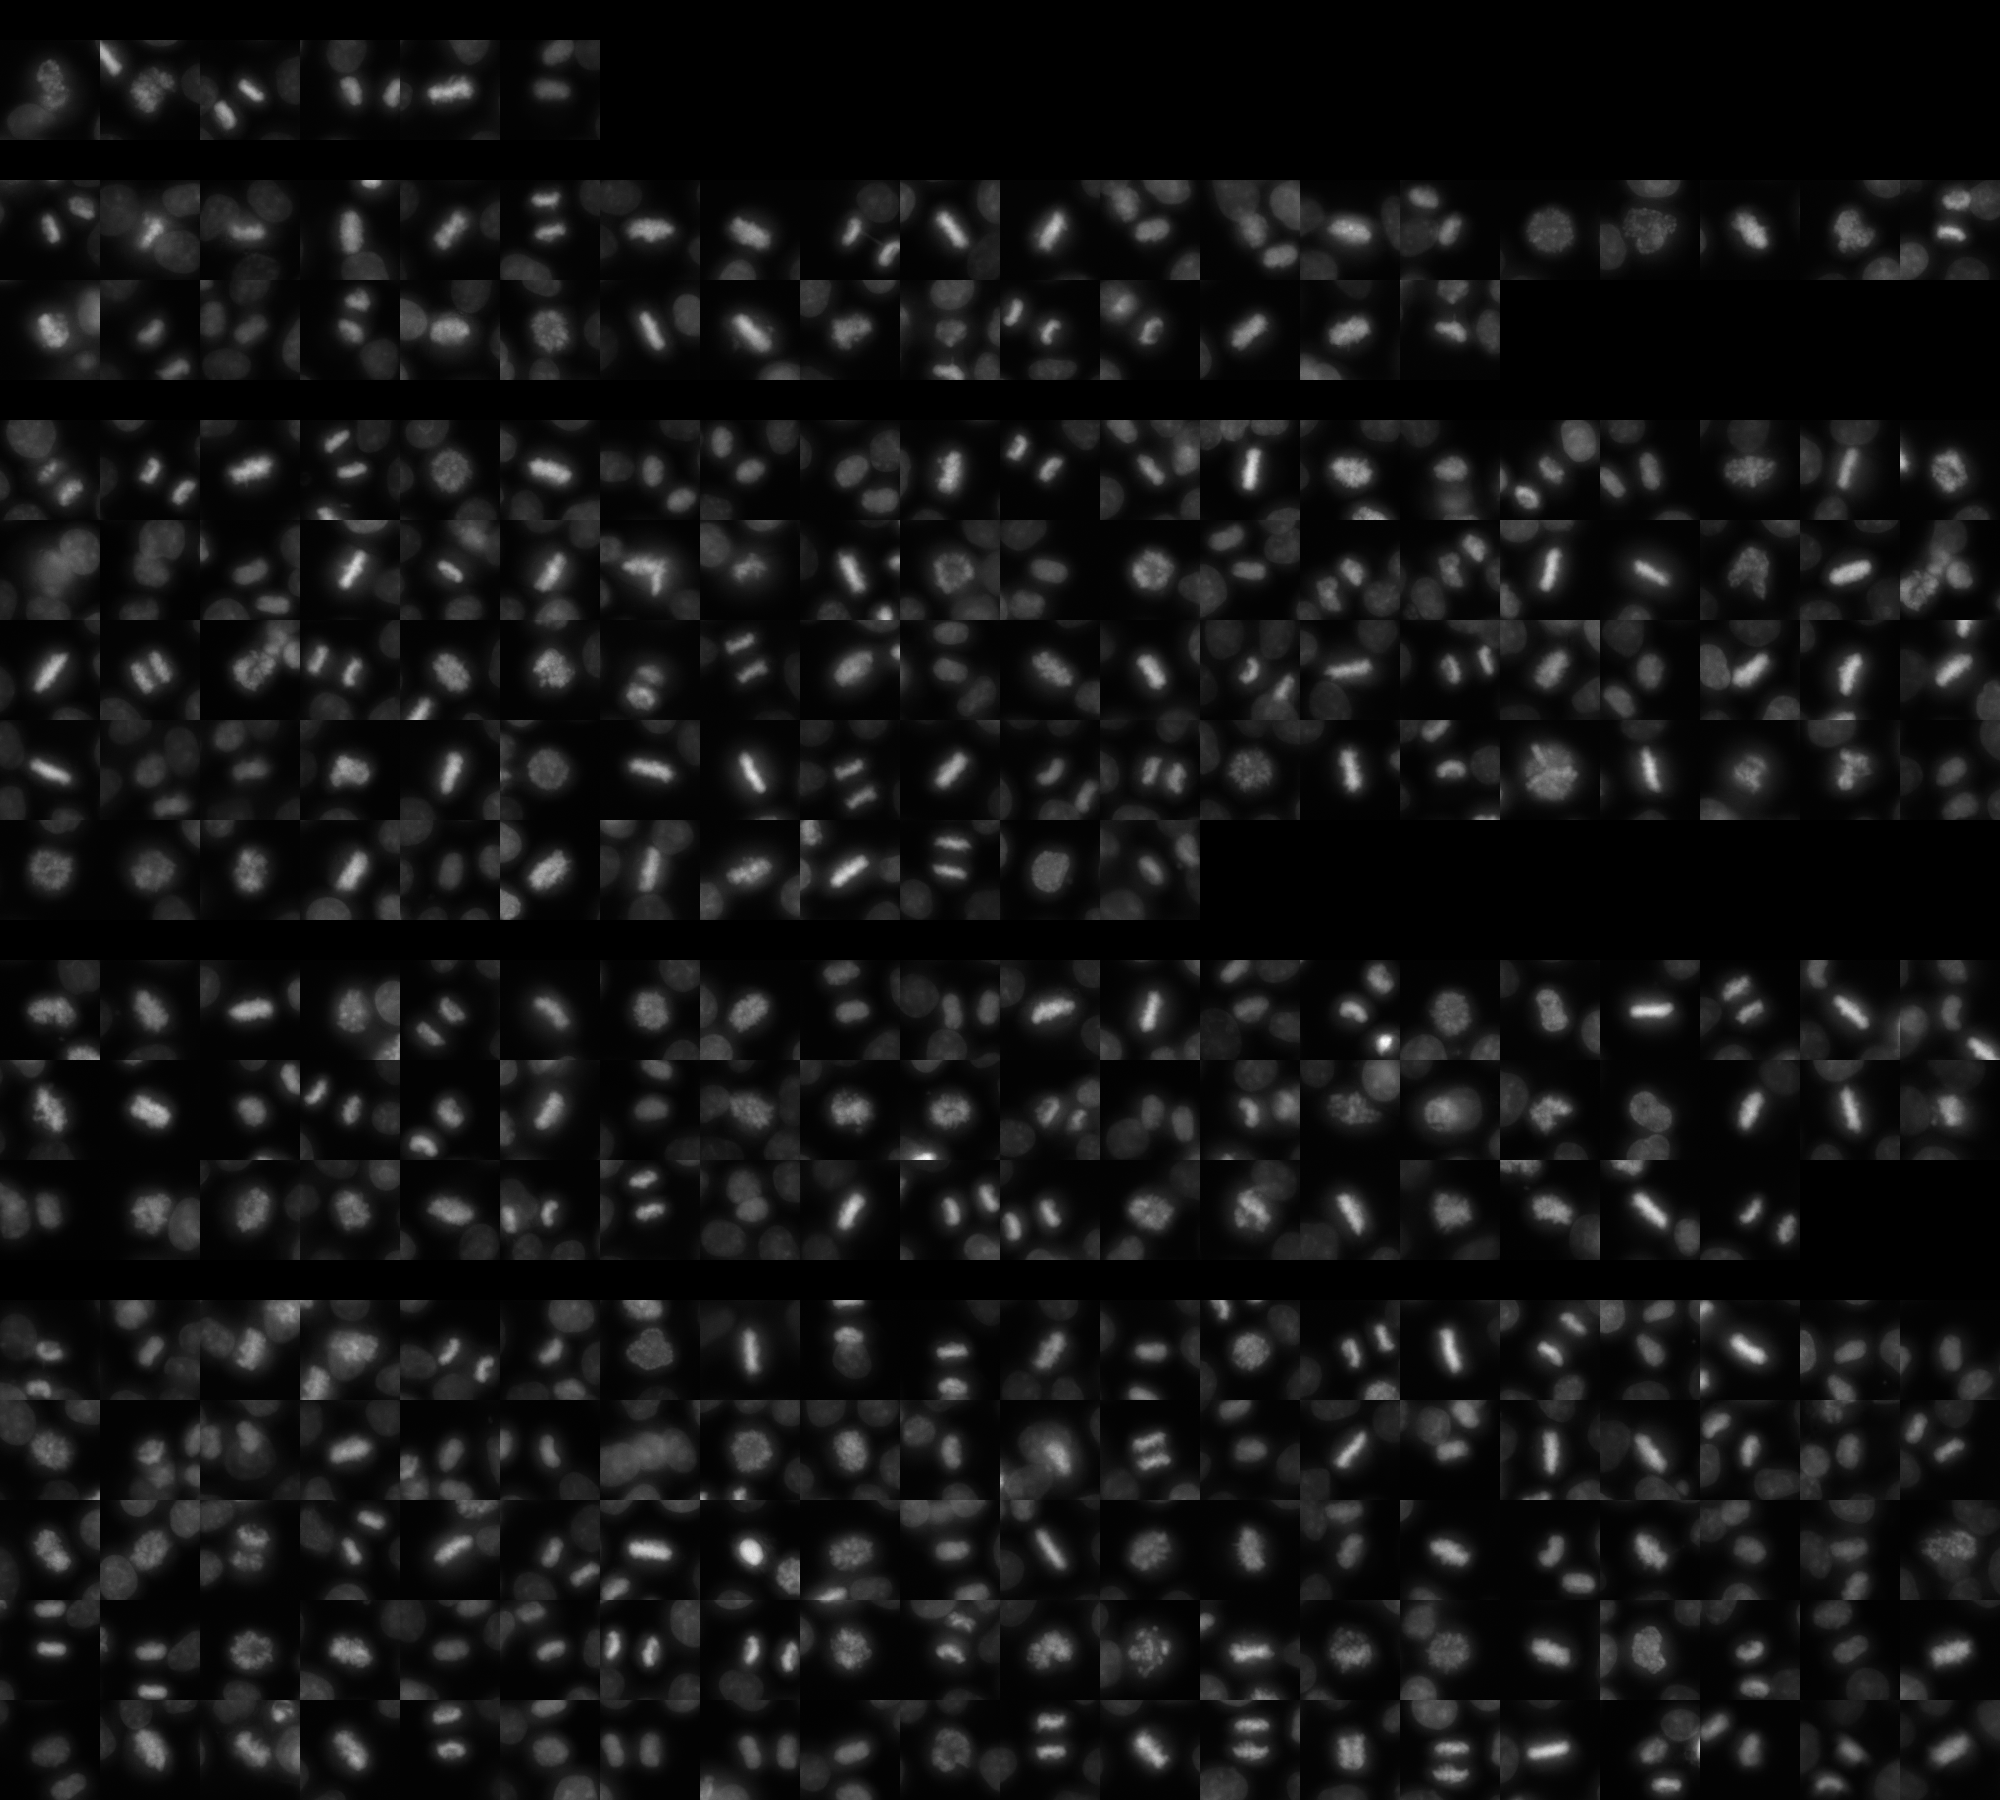
sgRNA 1: CTGGGTGACTGTGCGCACCC (interphase cells: 329, mitotic cells: 6)
sgRNA 2: GATGTCCAGGAAGACGGCGT (interphase cells: 1881, mitotic cells: 35)
sgRNA 3: GCACCGCCACCATTGCACCA (interphase cells: 3315, mitotic cells: 92)
sgRNA 4: TGGAGTAGAGGATCTGCGTG (interphase cells: 2433, mitotic cells: 58)

Interphase Cluster

Mitotic Cluster

Overview

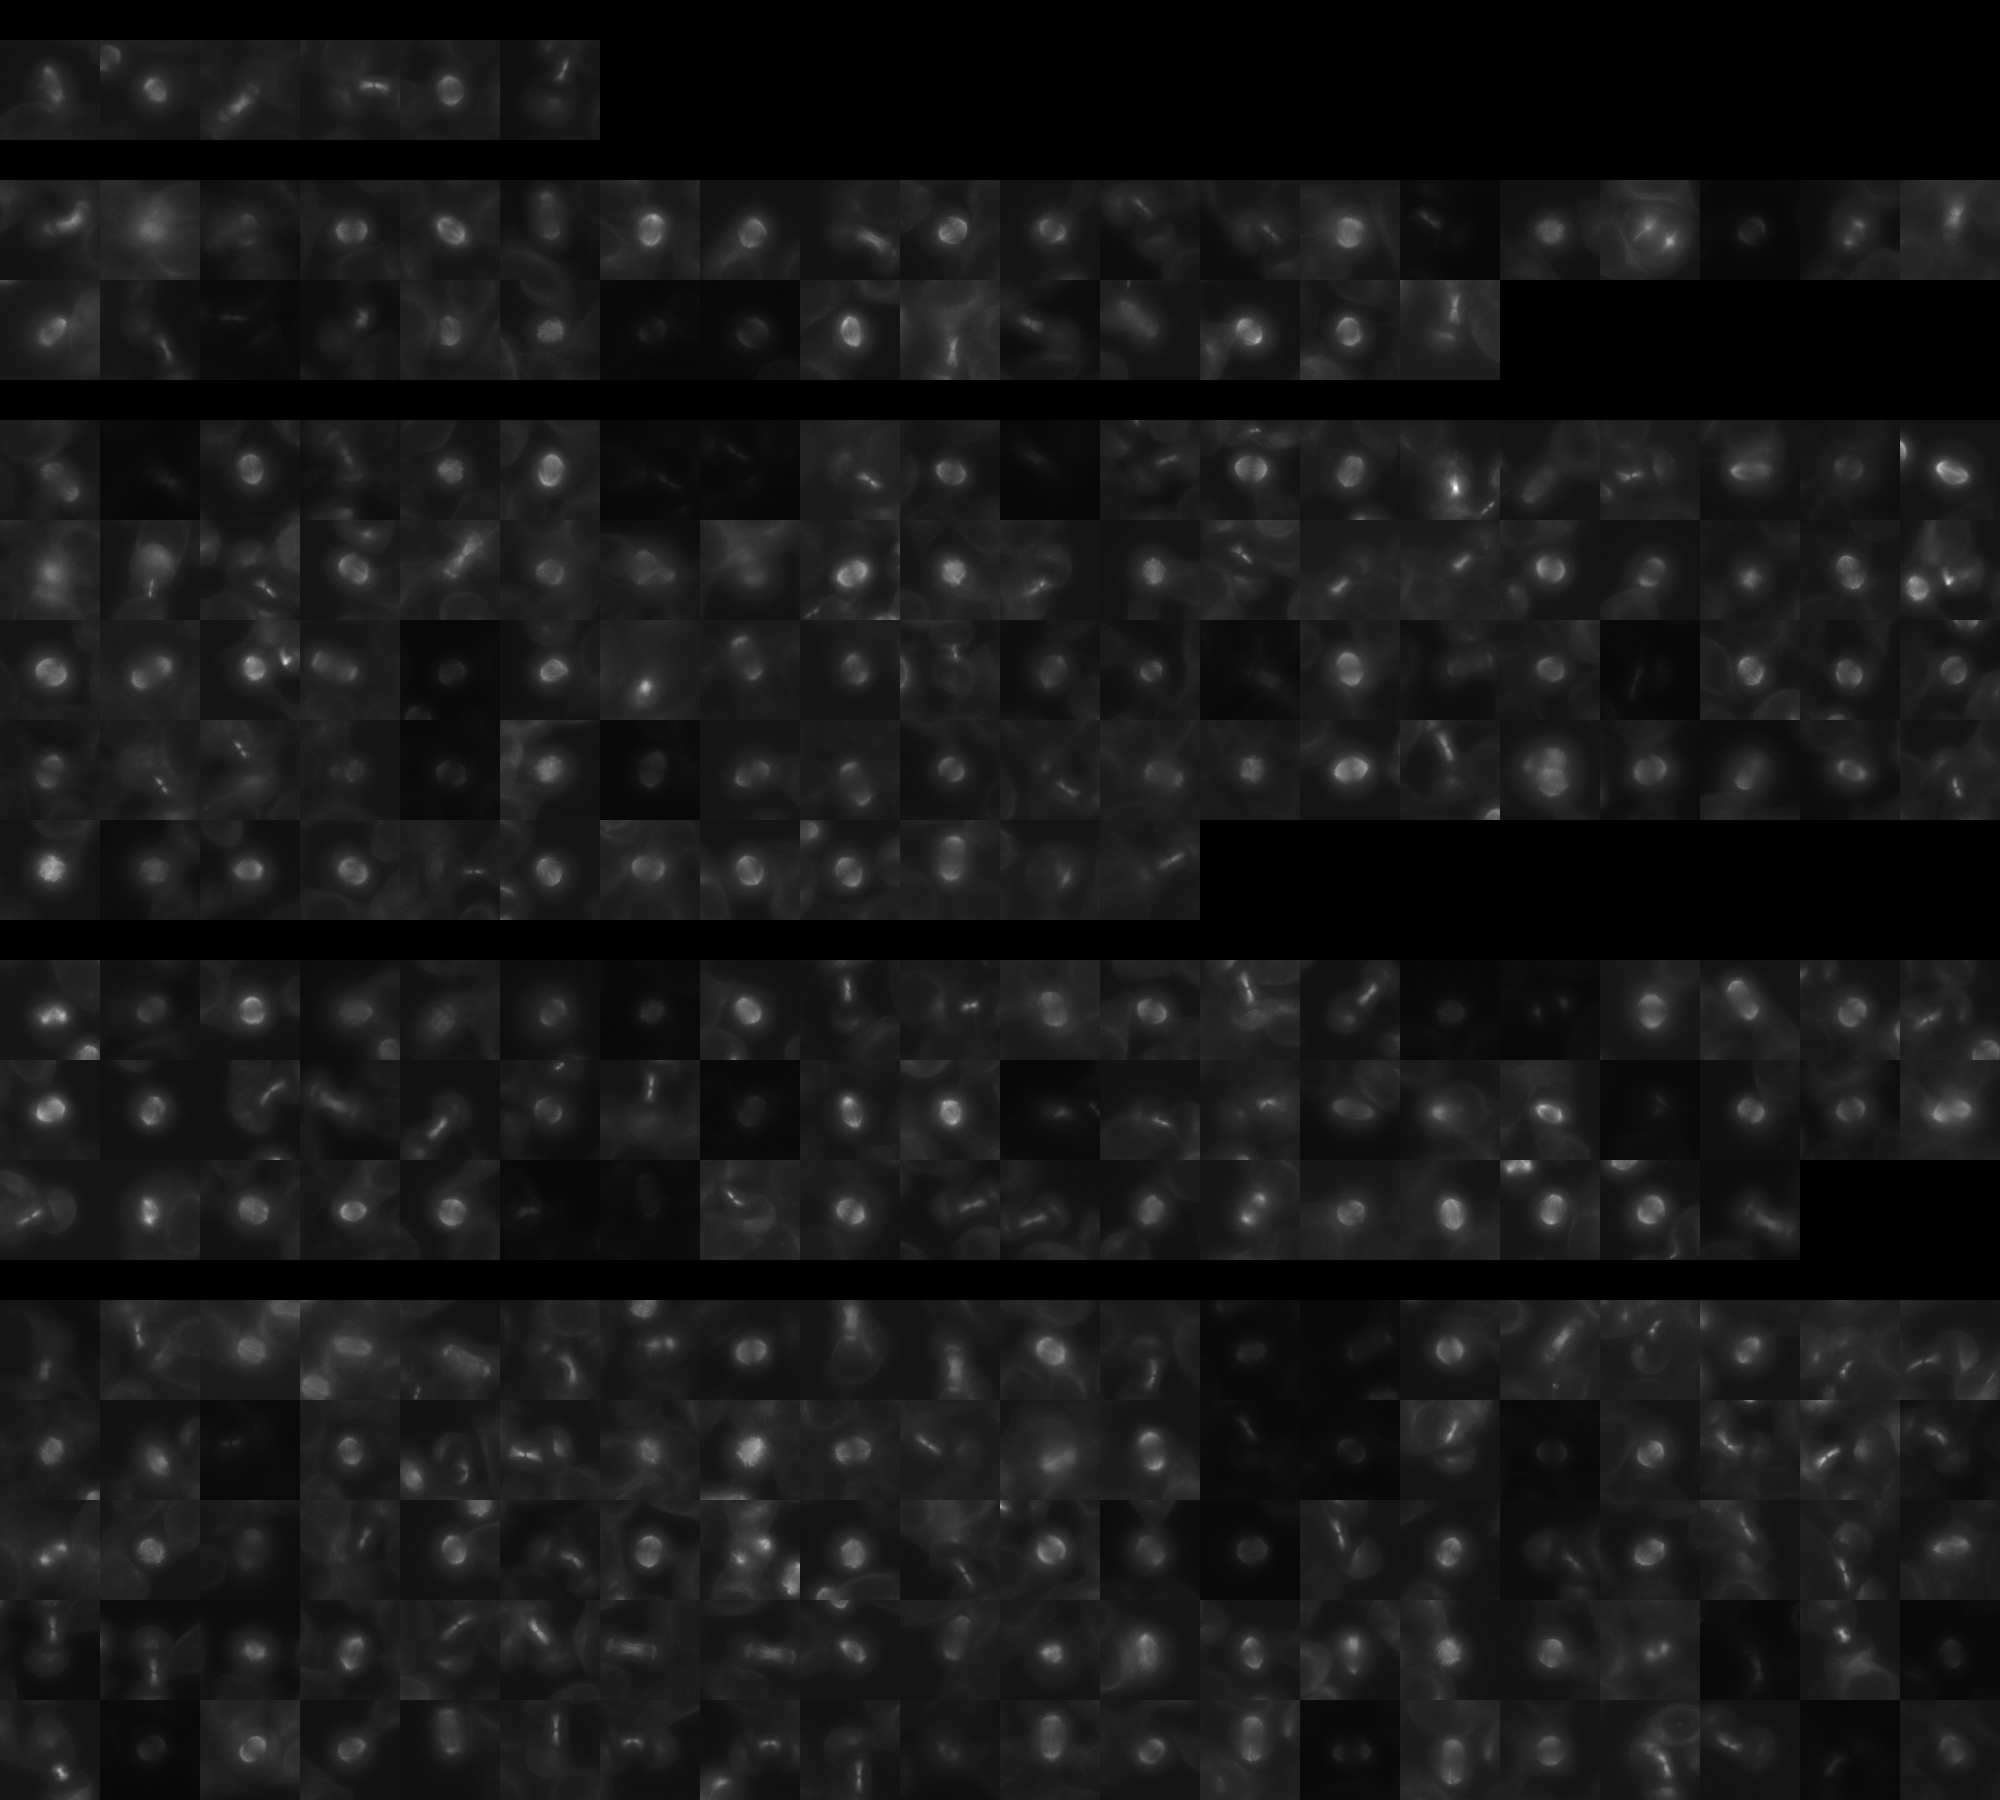
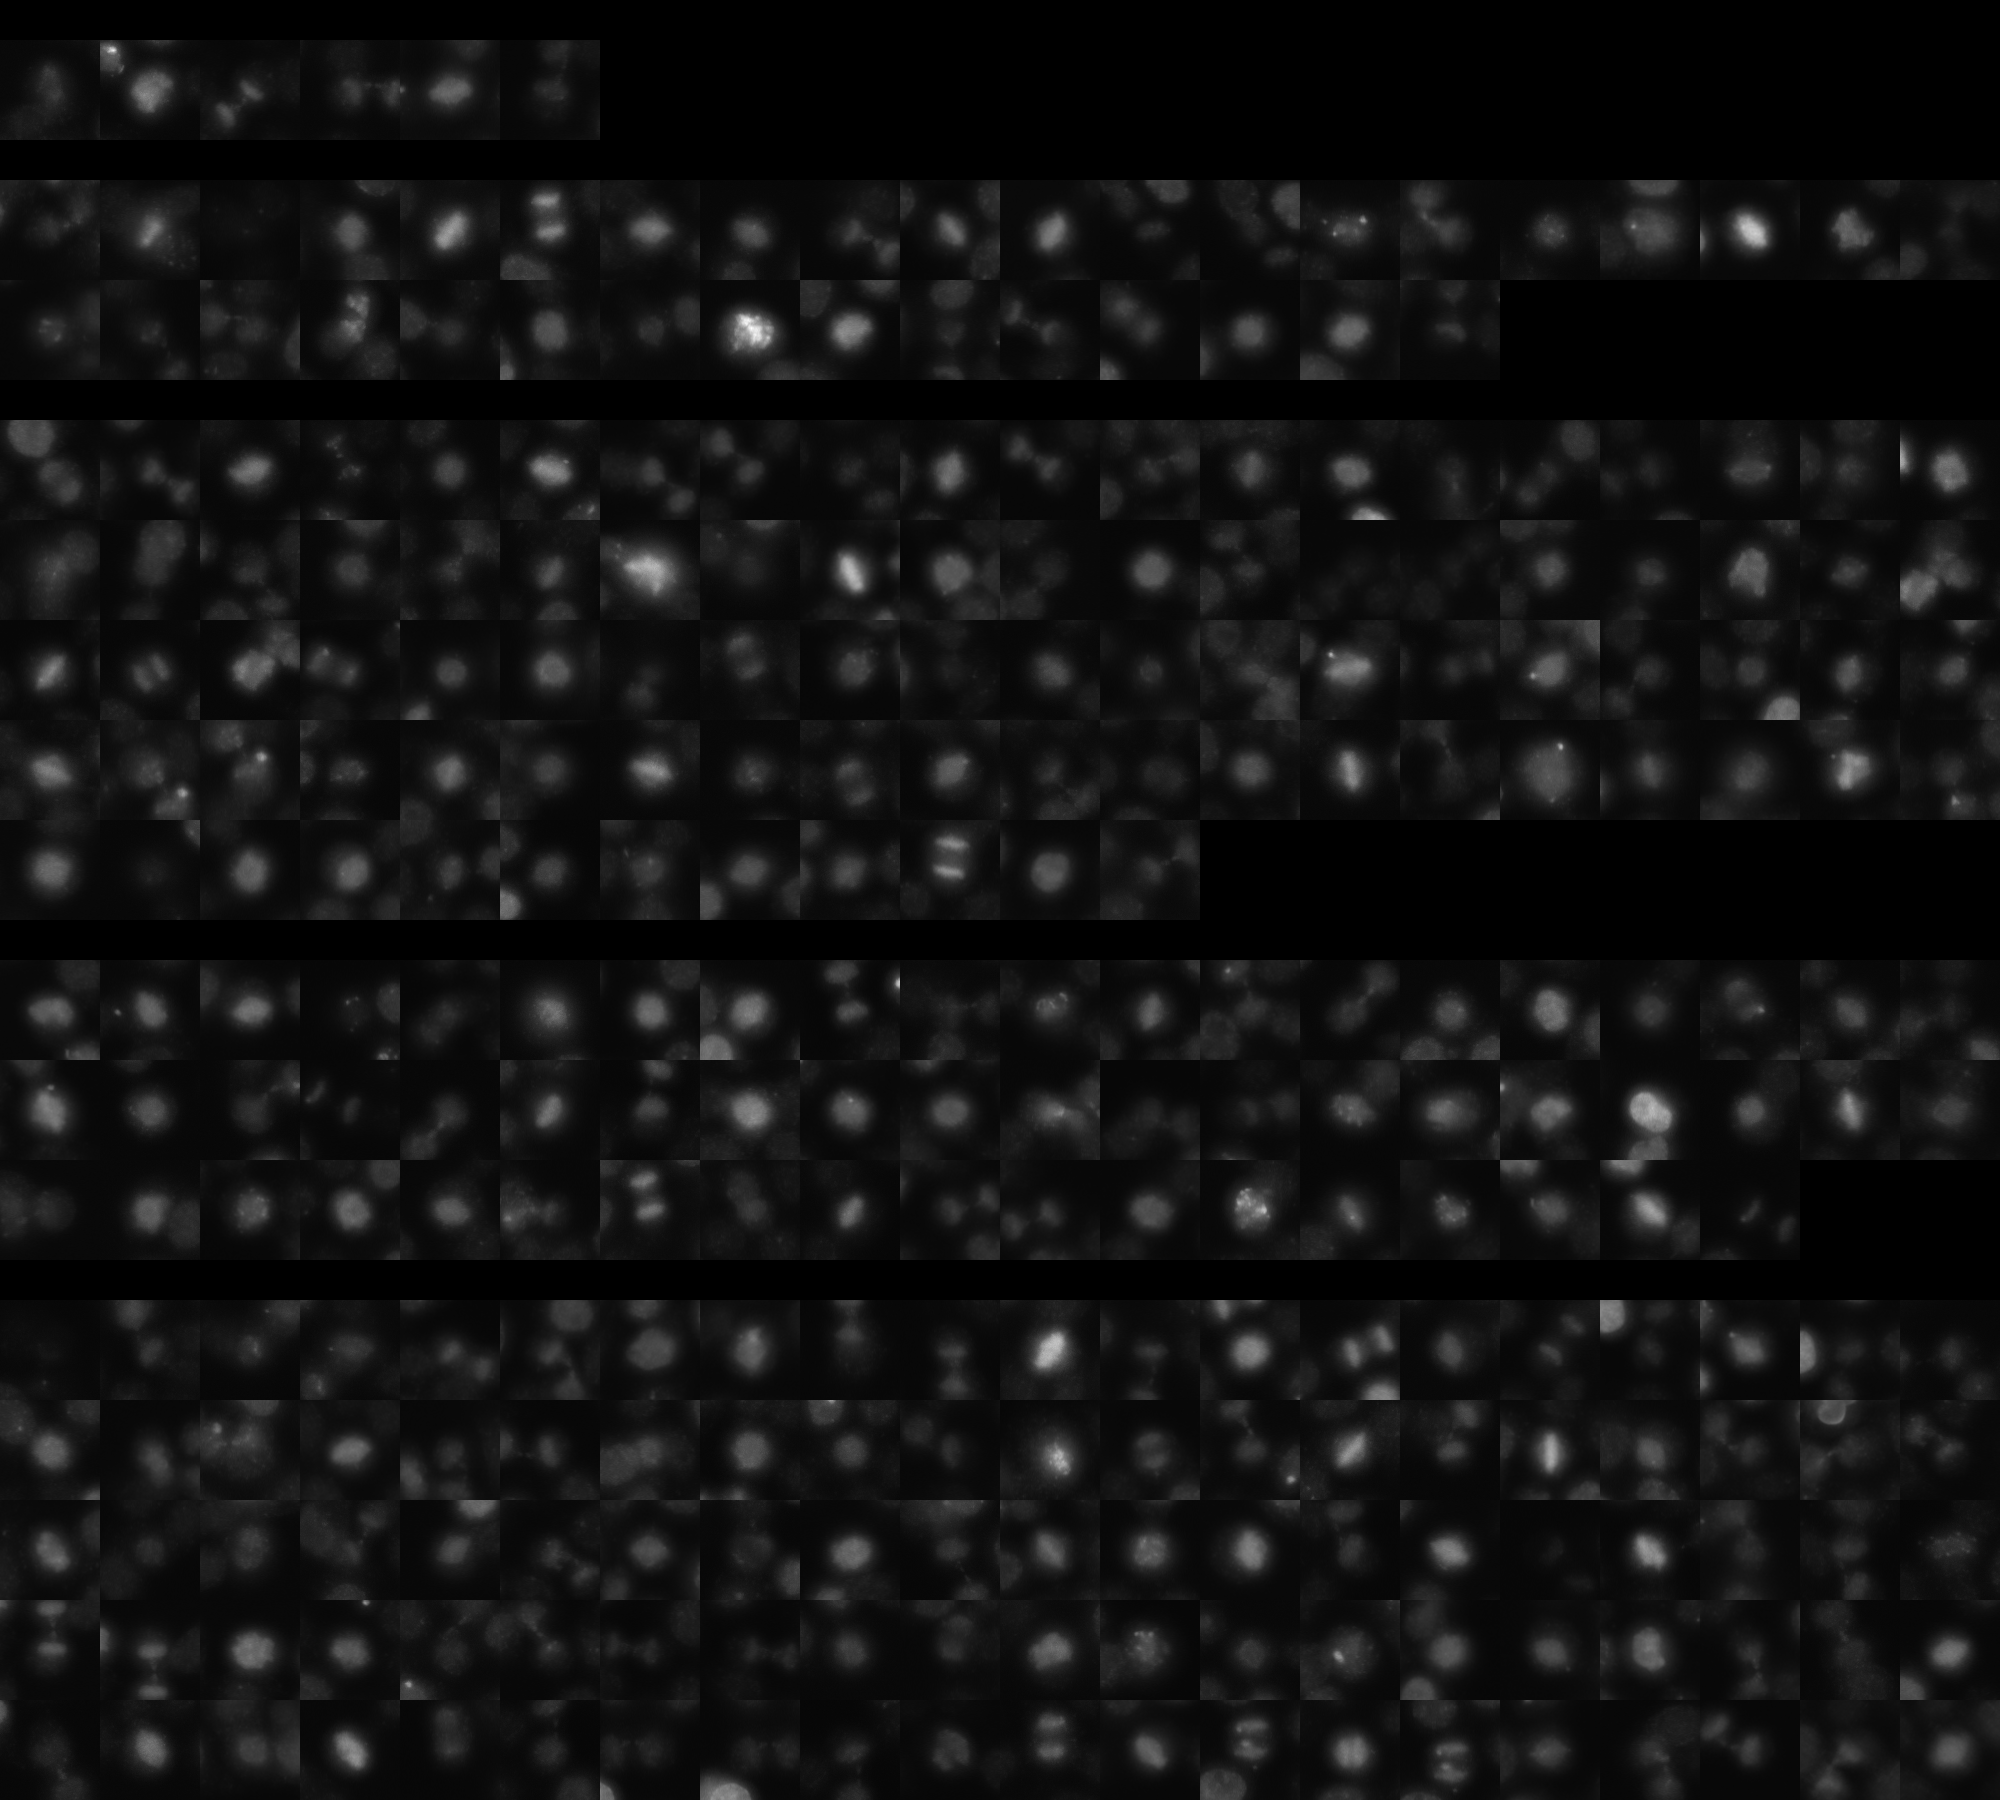
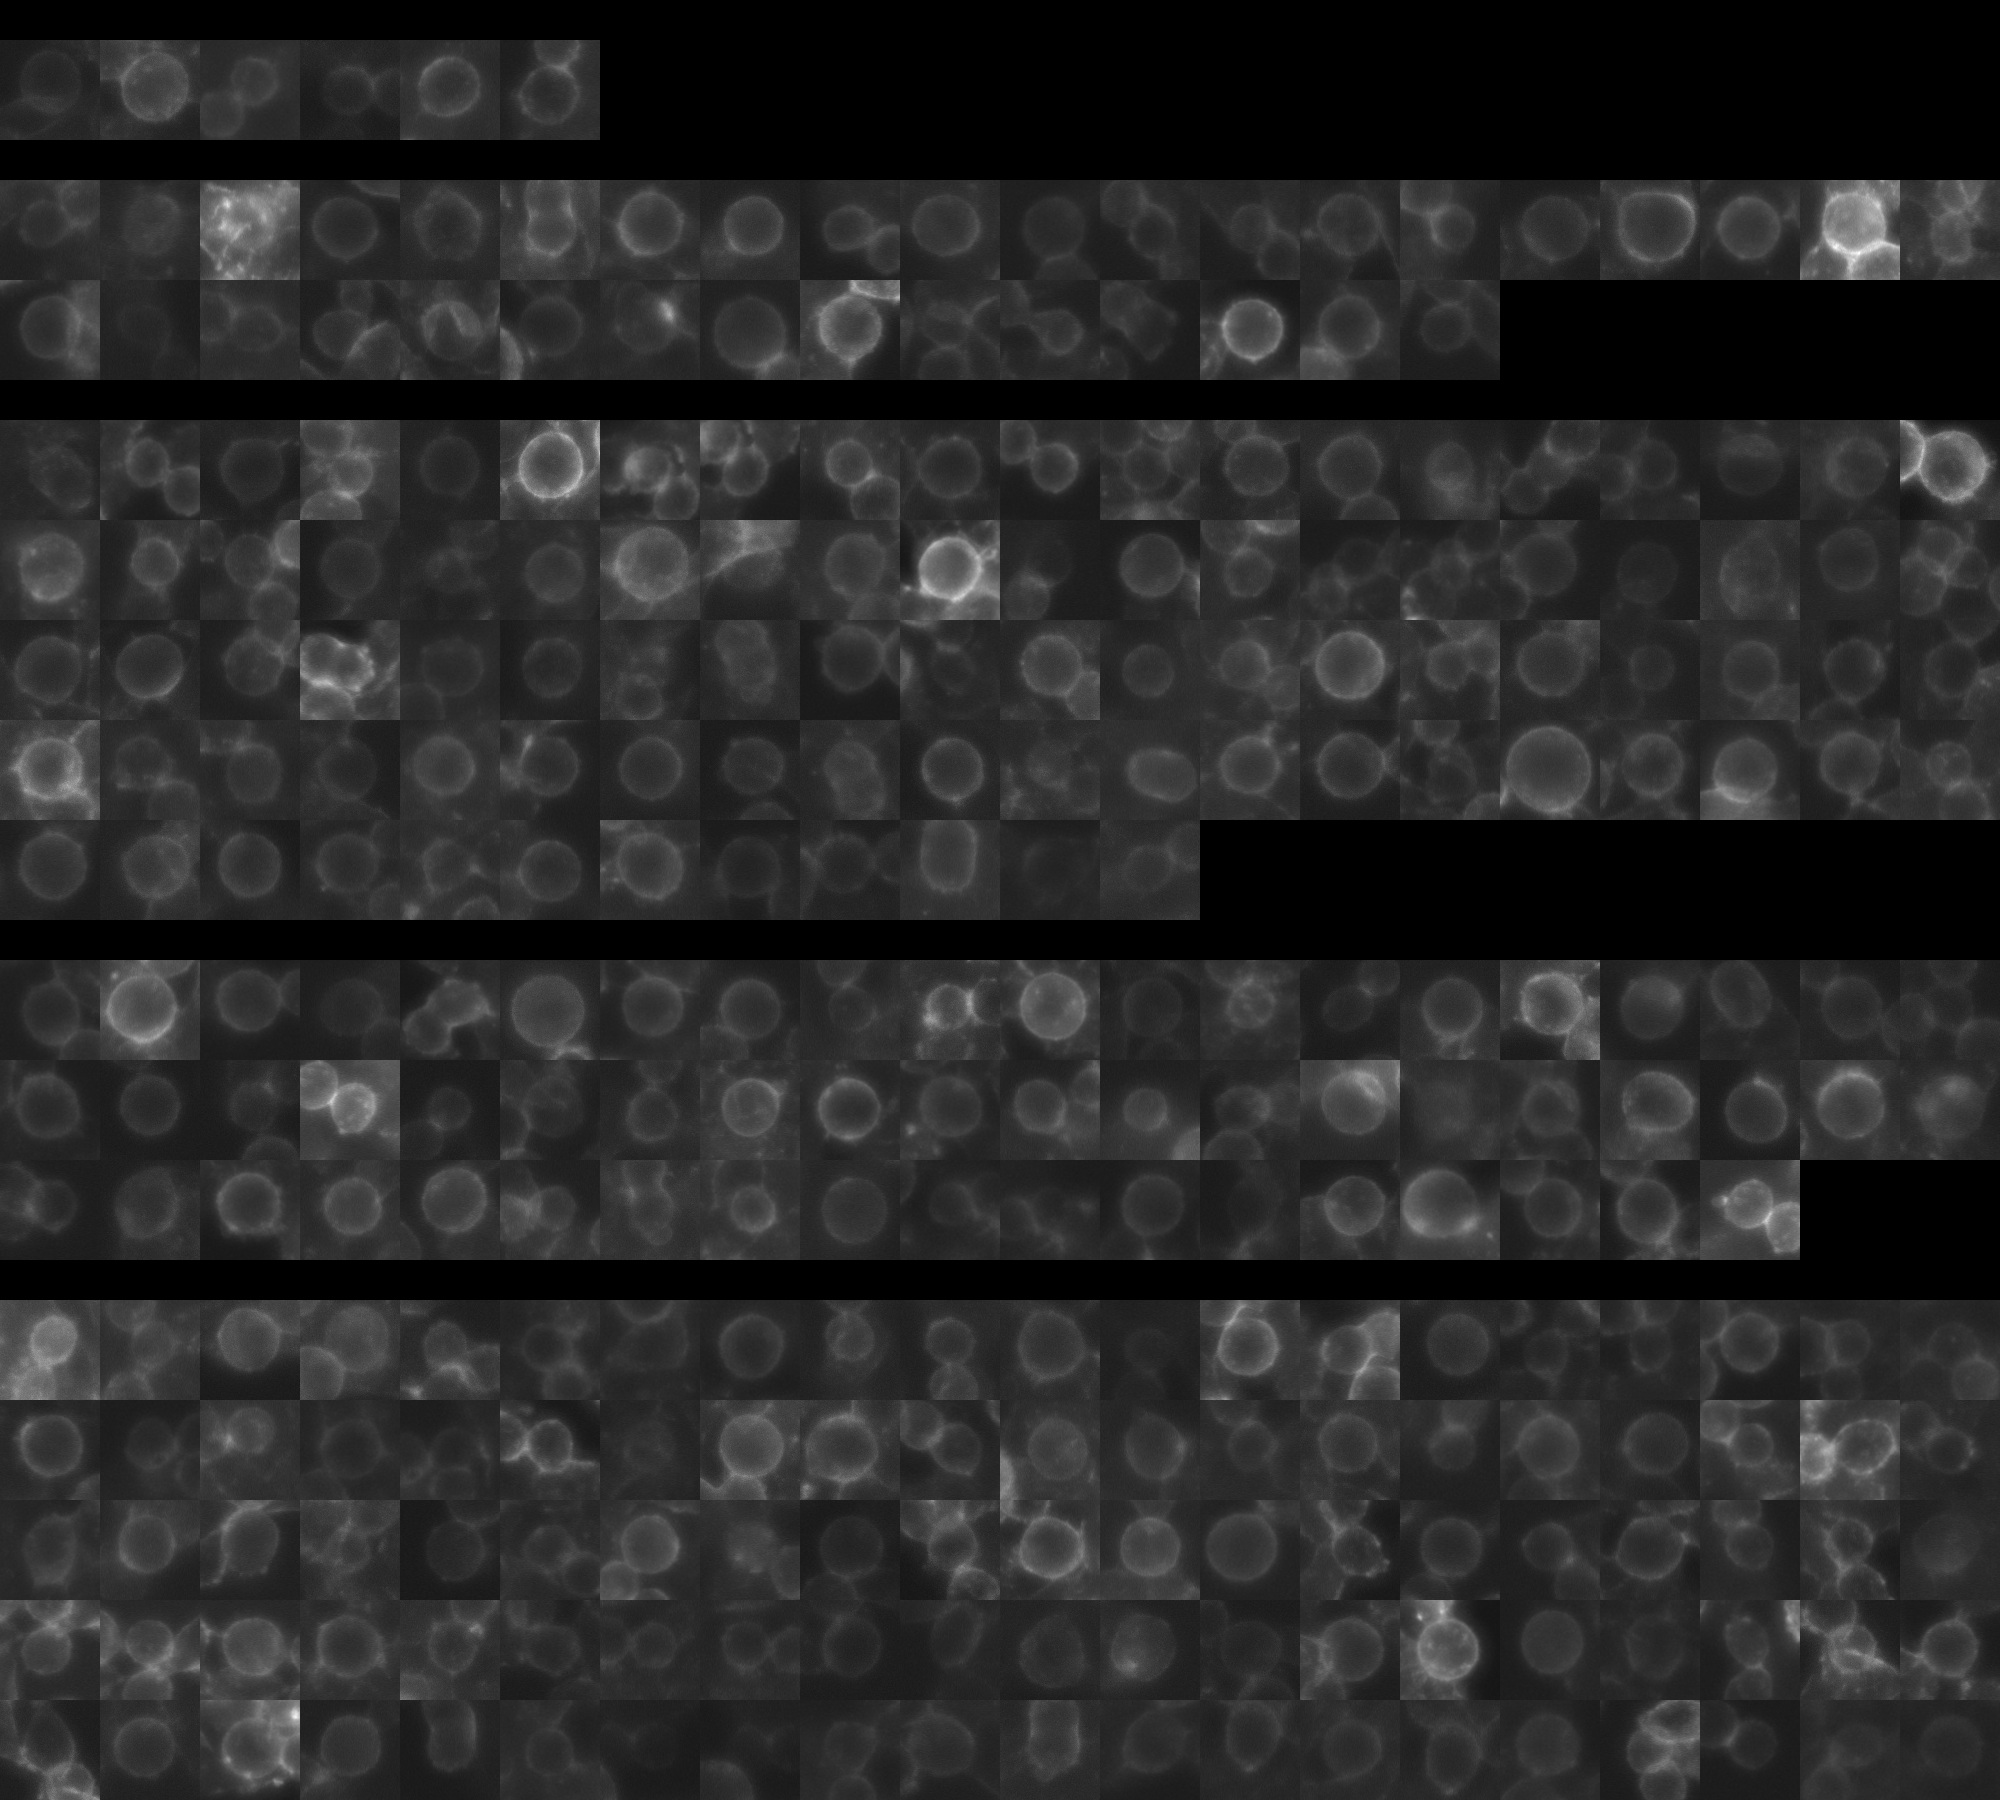
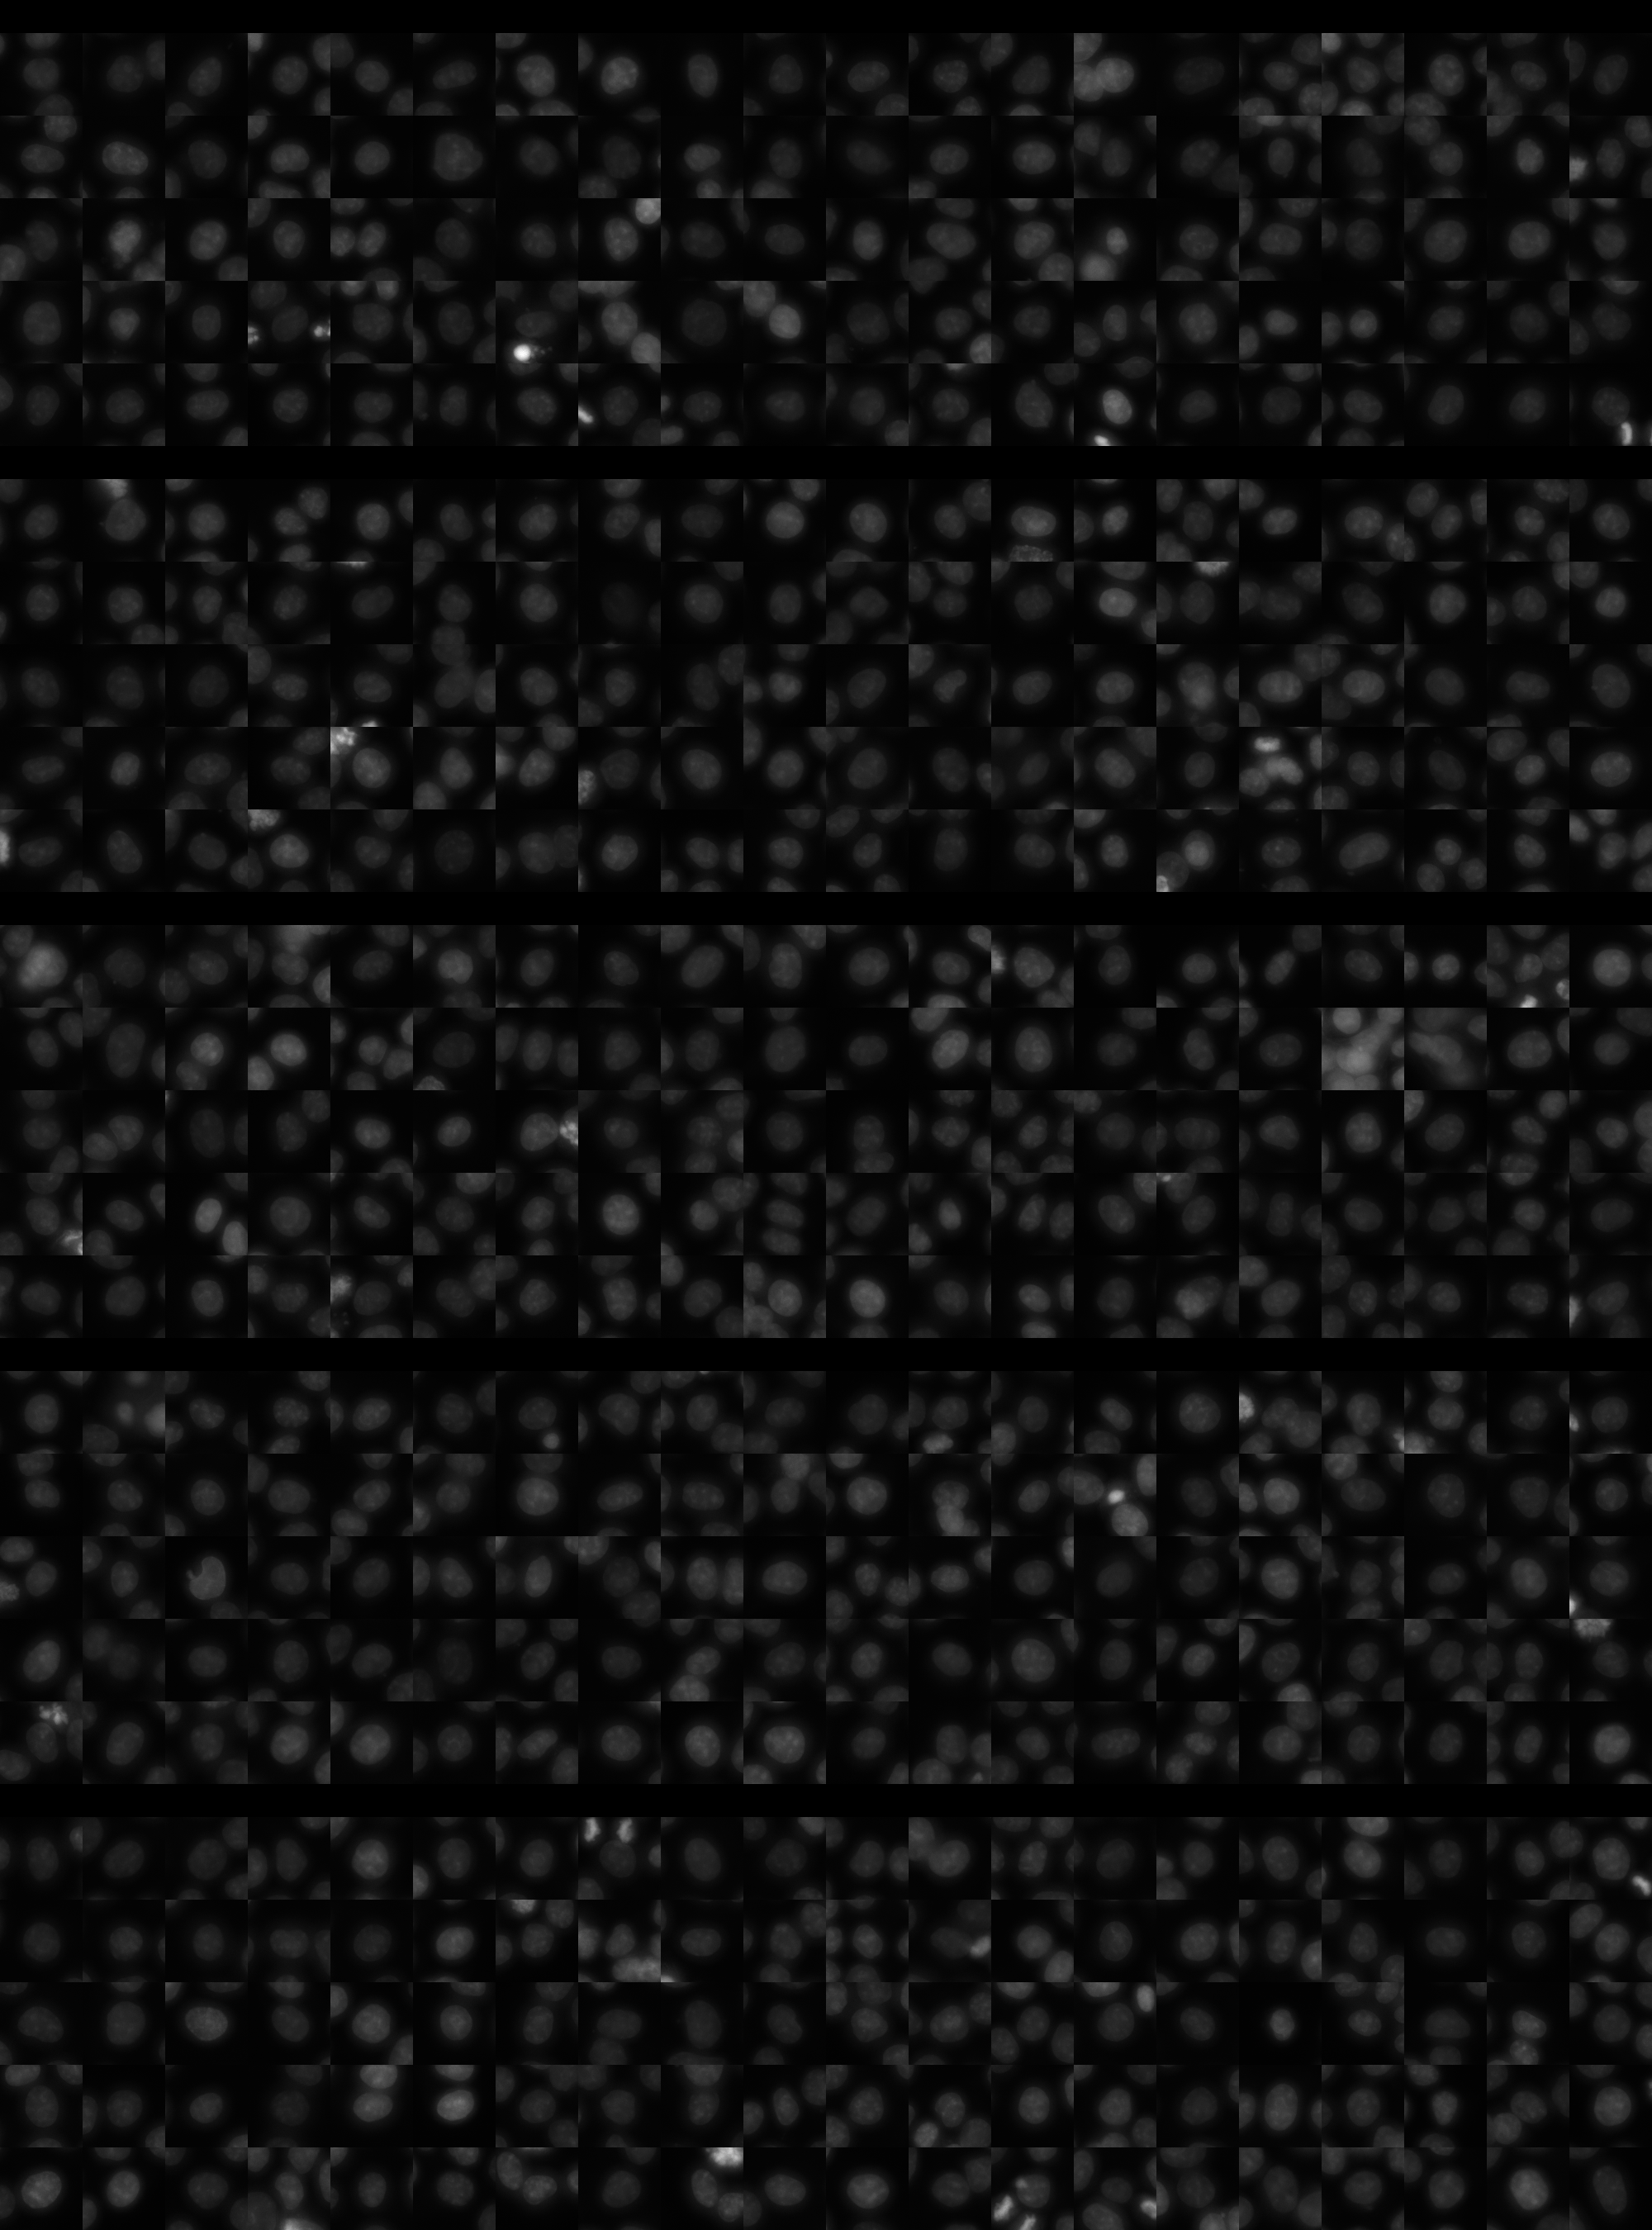
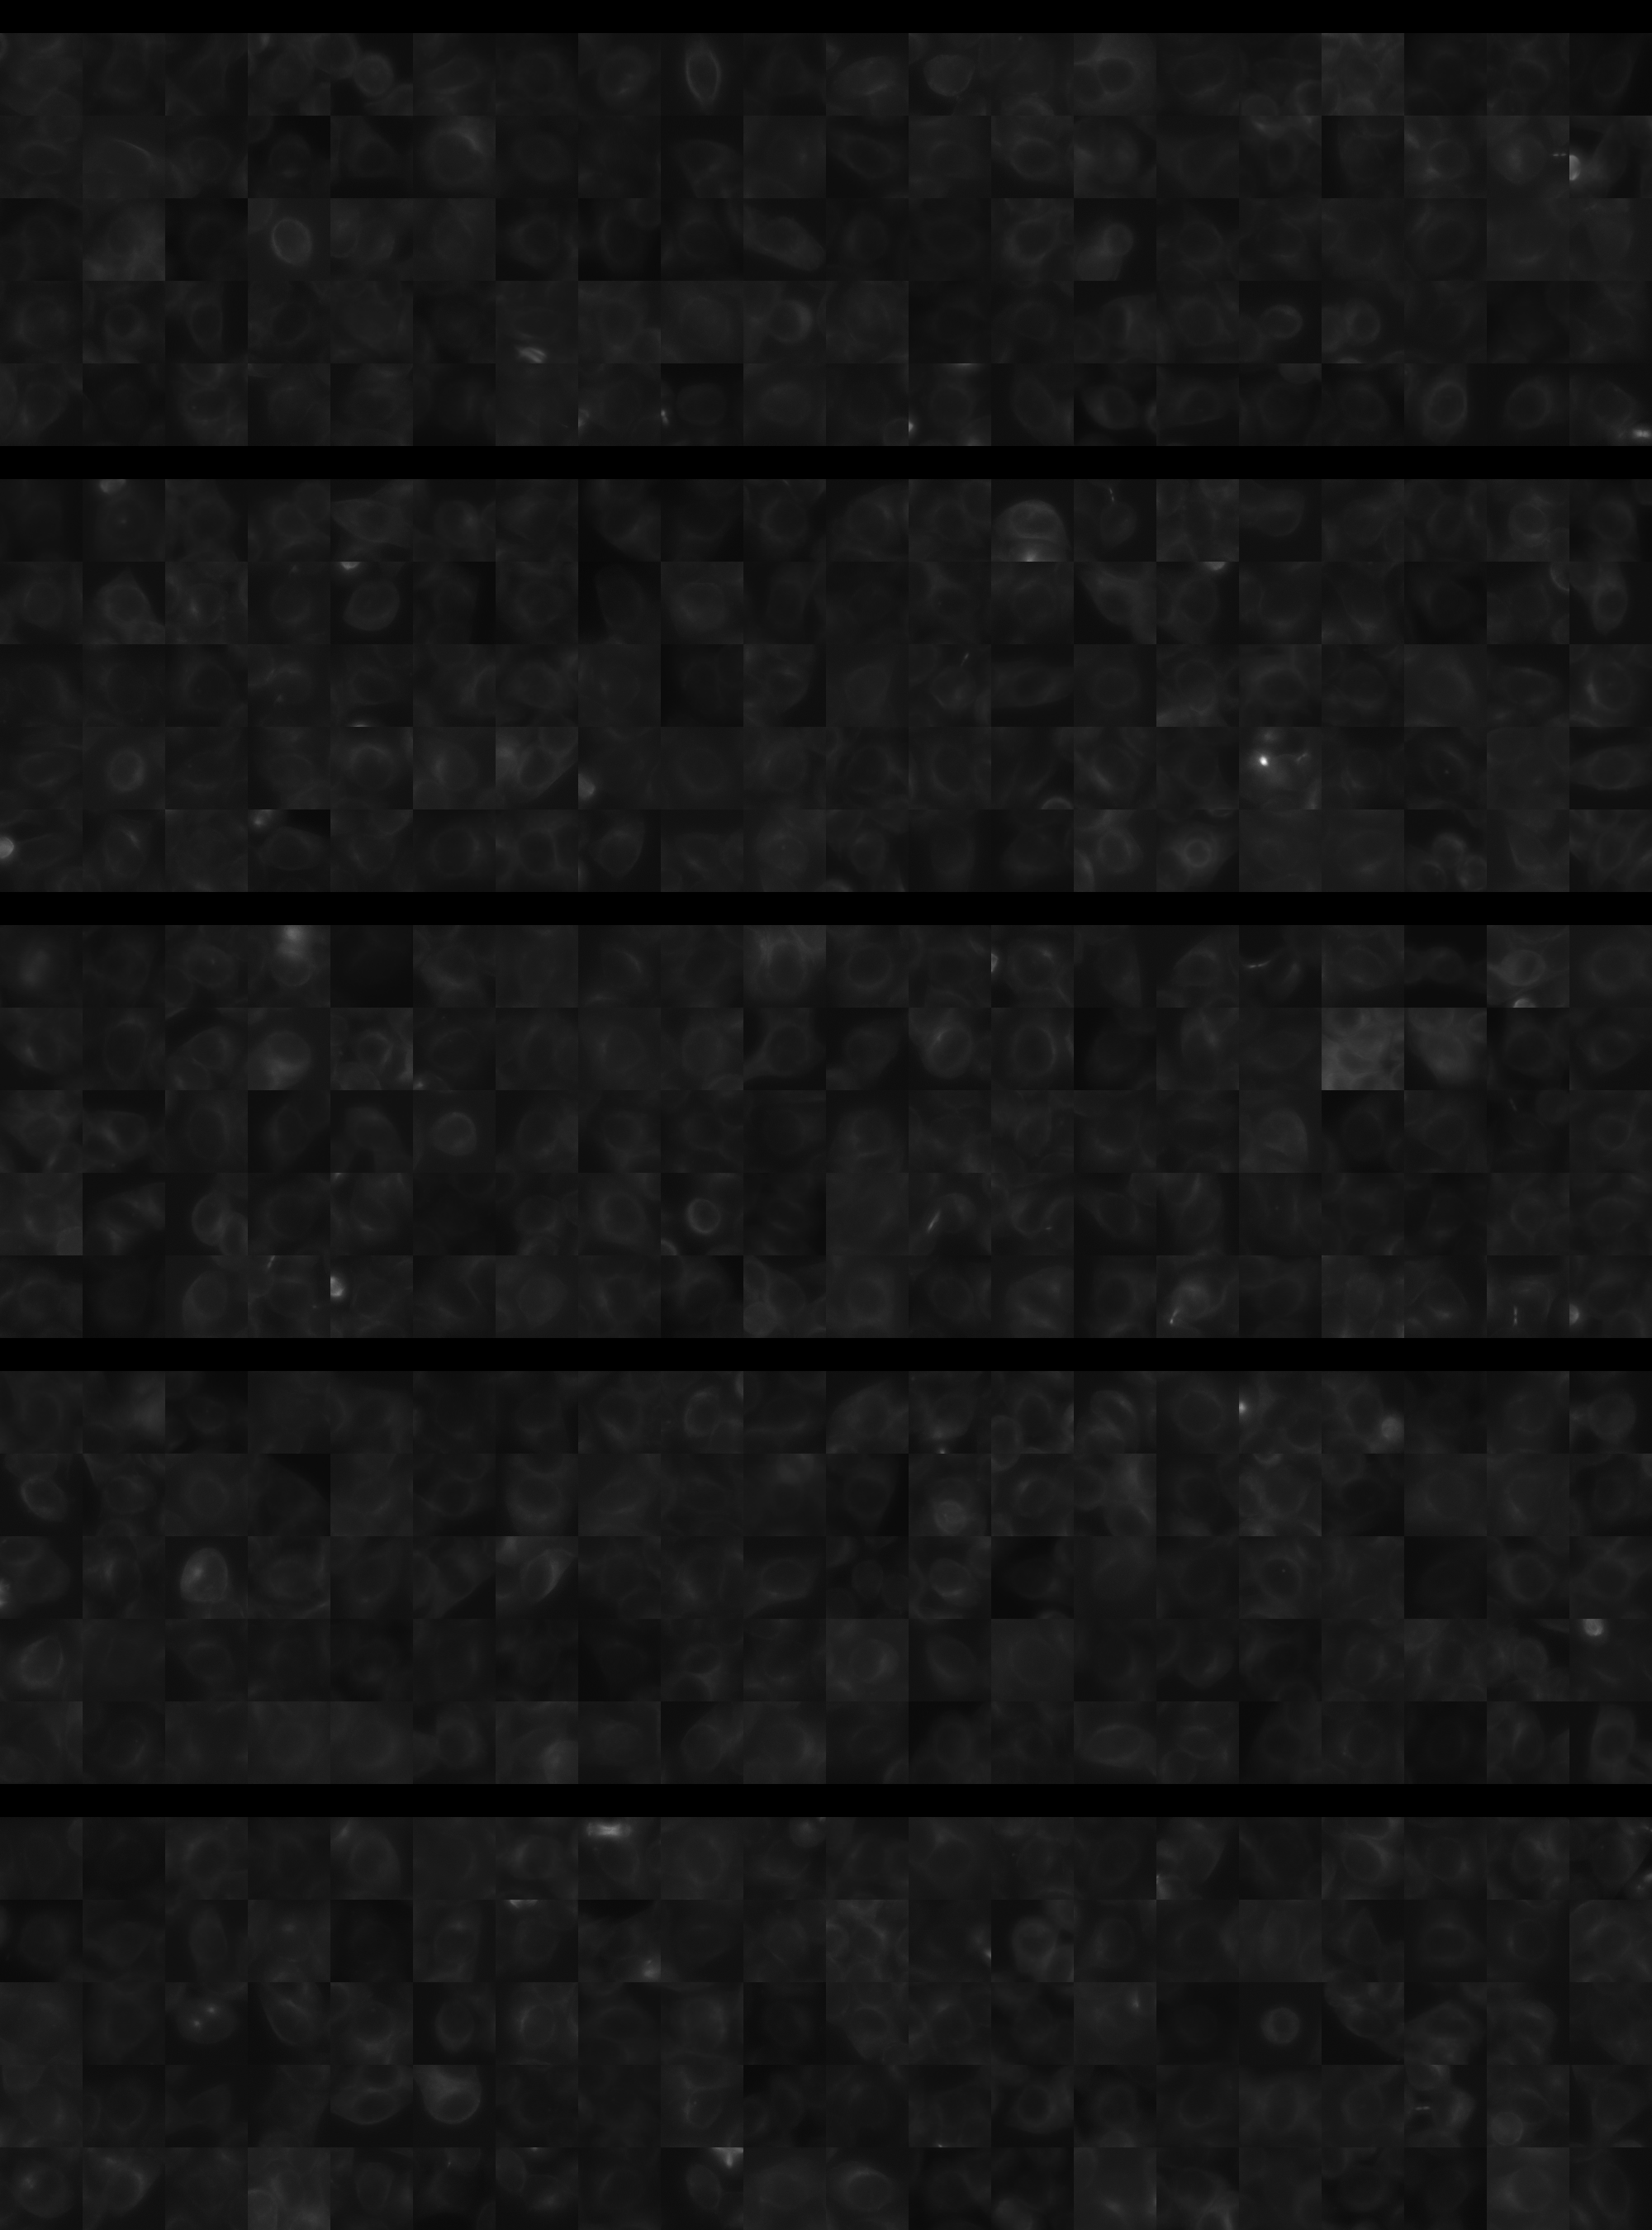
Each montage below shows randomly selected individual cell images for the same target gene separated by sgRNA, along with an example montage of cells expressing a non-targeting negative control sgRNA at the bottom. sgRNA labels in the montages correspond to the numbered sgRNA sequences in the gene info table above. The DNA (blue) and tubulin (green) channels are displayed by default, with gH2AX (grayscale) and actin (yellow) available using the check boxes. Channel brightness, contrast, and opacity are adjustable by clicking the arrow next to the channel name. When only one channel is selected, the display defaults to grayscale. Click the “Zoom” checkbox above the channel controls to enable image zooming (via scrolling) and panning (via click-and-drag).

The cell boxes displayed for this gene are square, 30.36 μm per side for the interphase montage and 30.36 μm per side for the mitotic montage.
Features

Interphase Score Rank FDR q-value
Nucleus DNA Integrated 0.016 2362 of 5322 0.883
Nucleus DNA Mean -2.813e-02 2915 of 5322 0.586
Nucleus gH2AX Mean 0.078 2578 of 5322 0.056
Nucleus DNA - gH2AX Correlation -5.885e-02 2740 of 5322 0.046
Nucleus Shape Area 0.078 1041 of 5322 0.156
Nucleus Shape Eccentricity 0.039 1302 of 5322 0.335
Nucleus Shape Form Factor -3.968e-02 2167 of 5322 0.340
Nucleus Shape Solidity -2.899e-02 1695 of 5322 0.426
Cell DNA Mass Displacement 0.023 2859 of 5322 0.749
Cell Tubulin Mean -3.936e-03 2945 of 5322 0.989
Cell Tubulin Mass Displacement 0.001 2933 of 5322 0.989
Cell Actin Mean -4.914e-03 3158 of 5322 0.963
Cell Tubulin - Actin Correlation -4.879e-02 5009 of 5322 0.240
Cell DNA - Tubulin Correlation 0.003 3715 of 5322 0.965
Cell Shape Area 0.048 1580 of 5322 0.515
Cell Shape Eccentricity 0.015 2519 of 5322 0.880
Mitotic Score Rank FDR q-value
Nucleus DNA Integrated 0.087 2671 of 5322 0.965
Nucleus DNA Mean 0.100 1474 of 5322 1.000
Nucleus DNA Mass Displacement -9.097e-02 4630 of 5322 0.999
Nucleus DNA Mean Frac 3 -2.613e-01 5193 of 5322 1.000
Nucleus gH2AX Mean 0.030 2515 of 5322 1.000
Nucleus gH2AX Mean Frac 0 0.091 1071 of 5322 1.000
Nucleus Tubulin Mean Frac 0 0.066 2477 of 5322 0.999
Nucleus Tubulin Mean Edge -5.548e-02 3865 of 5322 0.999
Nucleus Tubulin Std Edge 0.147 810 of 5322 0.999
Nucleus Shape Area 0.005 3886 of 5322 0.994
Nucleus Shape Eccentricity 0.087 984 of 5322 1.000
Nucleus Shape Form Factor -6.659e-03 1482 of 5322 0.998
Cell Tubulin Mean 0.046 2859 of 5322 0.997
Cell Tubulin Mean Frac 3 -4.033e-02 2168 of 5322 0.999
Cell Actin Mean 0.159 1209 of 5322 0.997
Cell Shape Area 0.137 2125 of 5322 0.998
( Reset Zoom )
Brightness
Contrast
Opacity
Brightness
Contrast
Opacity
Brightness
Contrast
Opacity
Brightness
Contrast
Opacity
Brightness
Contrast
Opacity

( Reset Zoom )
Brightness
Contrast
Opacity
Brightness
Contrast
Opacity
Brightness
Contrast
Opacity
Brightness
Contrast
Opacity
Brightness
Contrast
Opacity

MIT Central Accessability