TCP1

Gene symbol: TCP1
Gene: 6950
Uniprot Function: Component of the chaperonin-containing T-complex (TRiC), a molecular chaperone complex that assists the folding of proteins upon ATP hydrolysis (PubMed:25467444). The TRiC complex mediates the folding of WRAP53/TCAB1, thereby regulating telomere maintenance (PubMed:25467444). As part of the TRiC complex may play a role in the assembly of BBSome, a complex involved in ciliogenesis regulating transports vesicles to the cilia (PubMed:20080638). The TRiC complex plays a role in the folding of actin and tubulin (Probable).
Mitotic Index 0.0455
Interphase Cluster: #212 (9 genes)
Mitotic Cluster: #205 (12 genes)
sgRNA 1: AACTGGACCAAATTAGACAG (interphase cells: 2141, mitotic cells: 87)
sgRNA 2: ACAGAGTTGACTGGATAGCG (interphase cells: 1047, mitotic cells: 71)
sgRNA 3: ATTGTTAACACAGATGAACT (interphase cells: 822, mitotic cells: 28)
sgRNA 4: GATGTAACCATTACTAACGA (interphase cells: 756, mitotic cells: 41)

Interphase Cluster

Mitotic Cluster

Overview

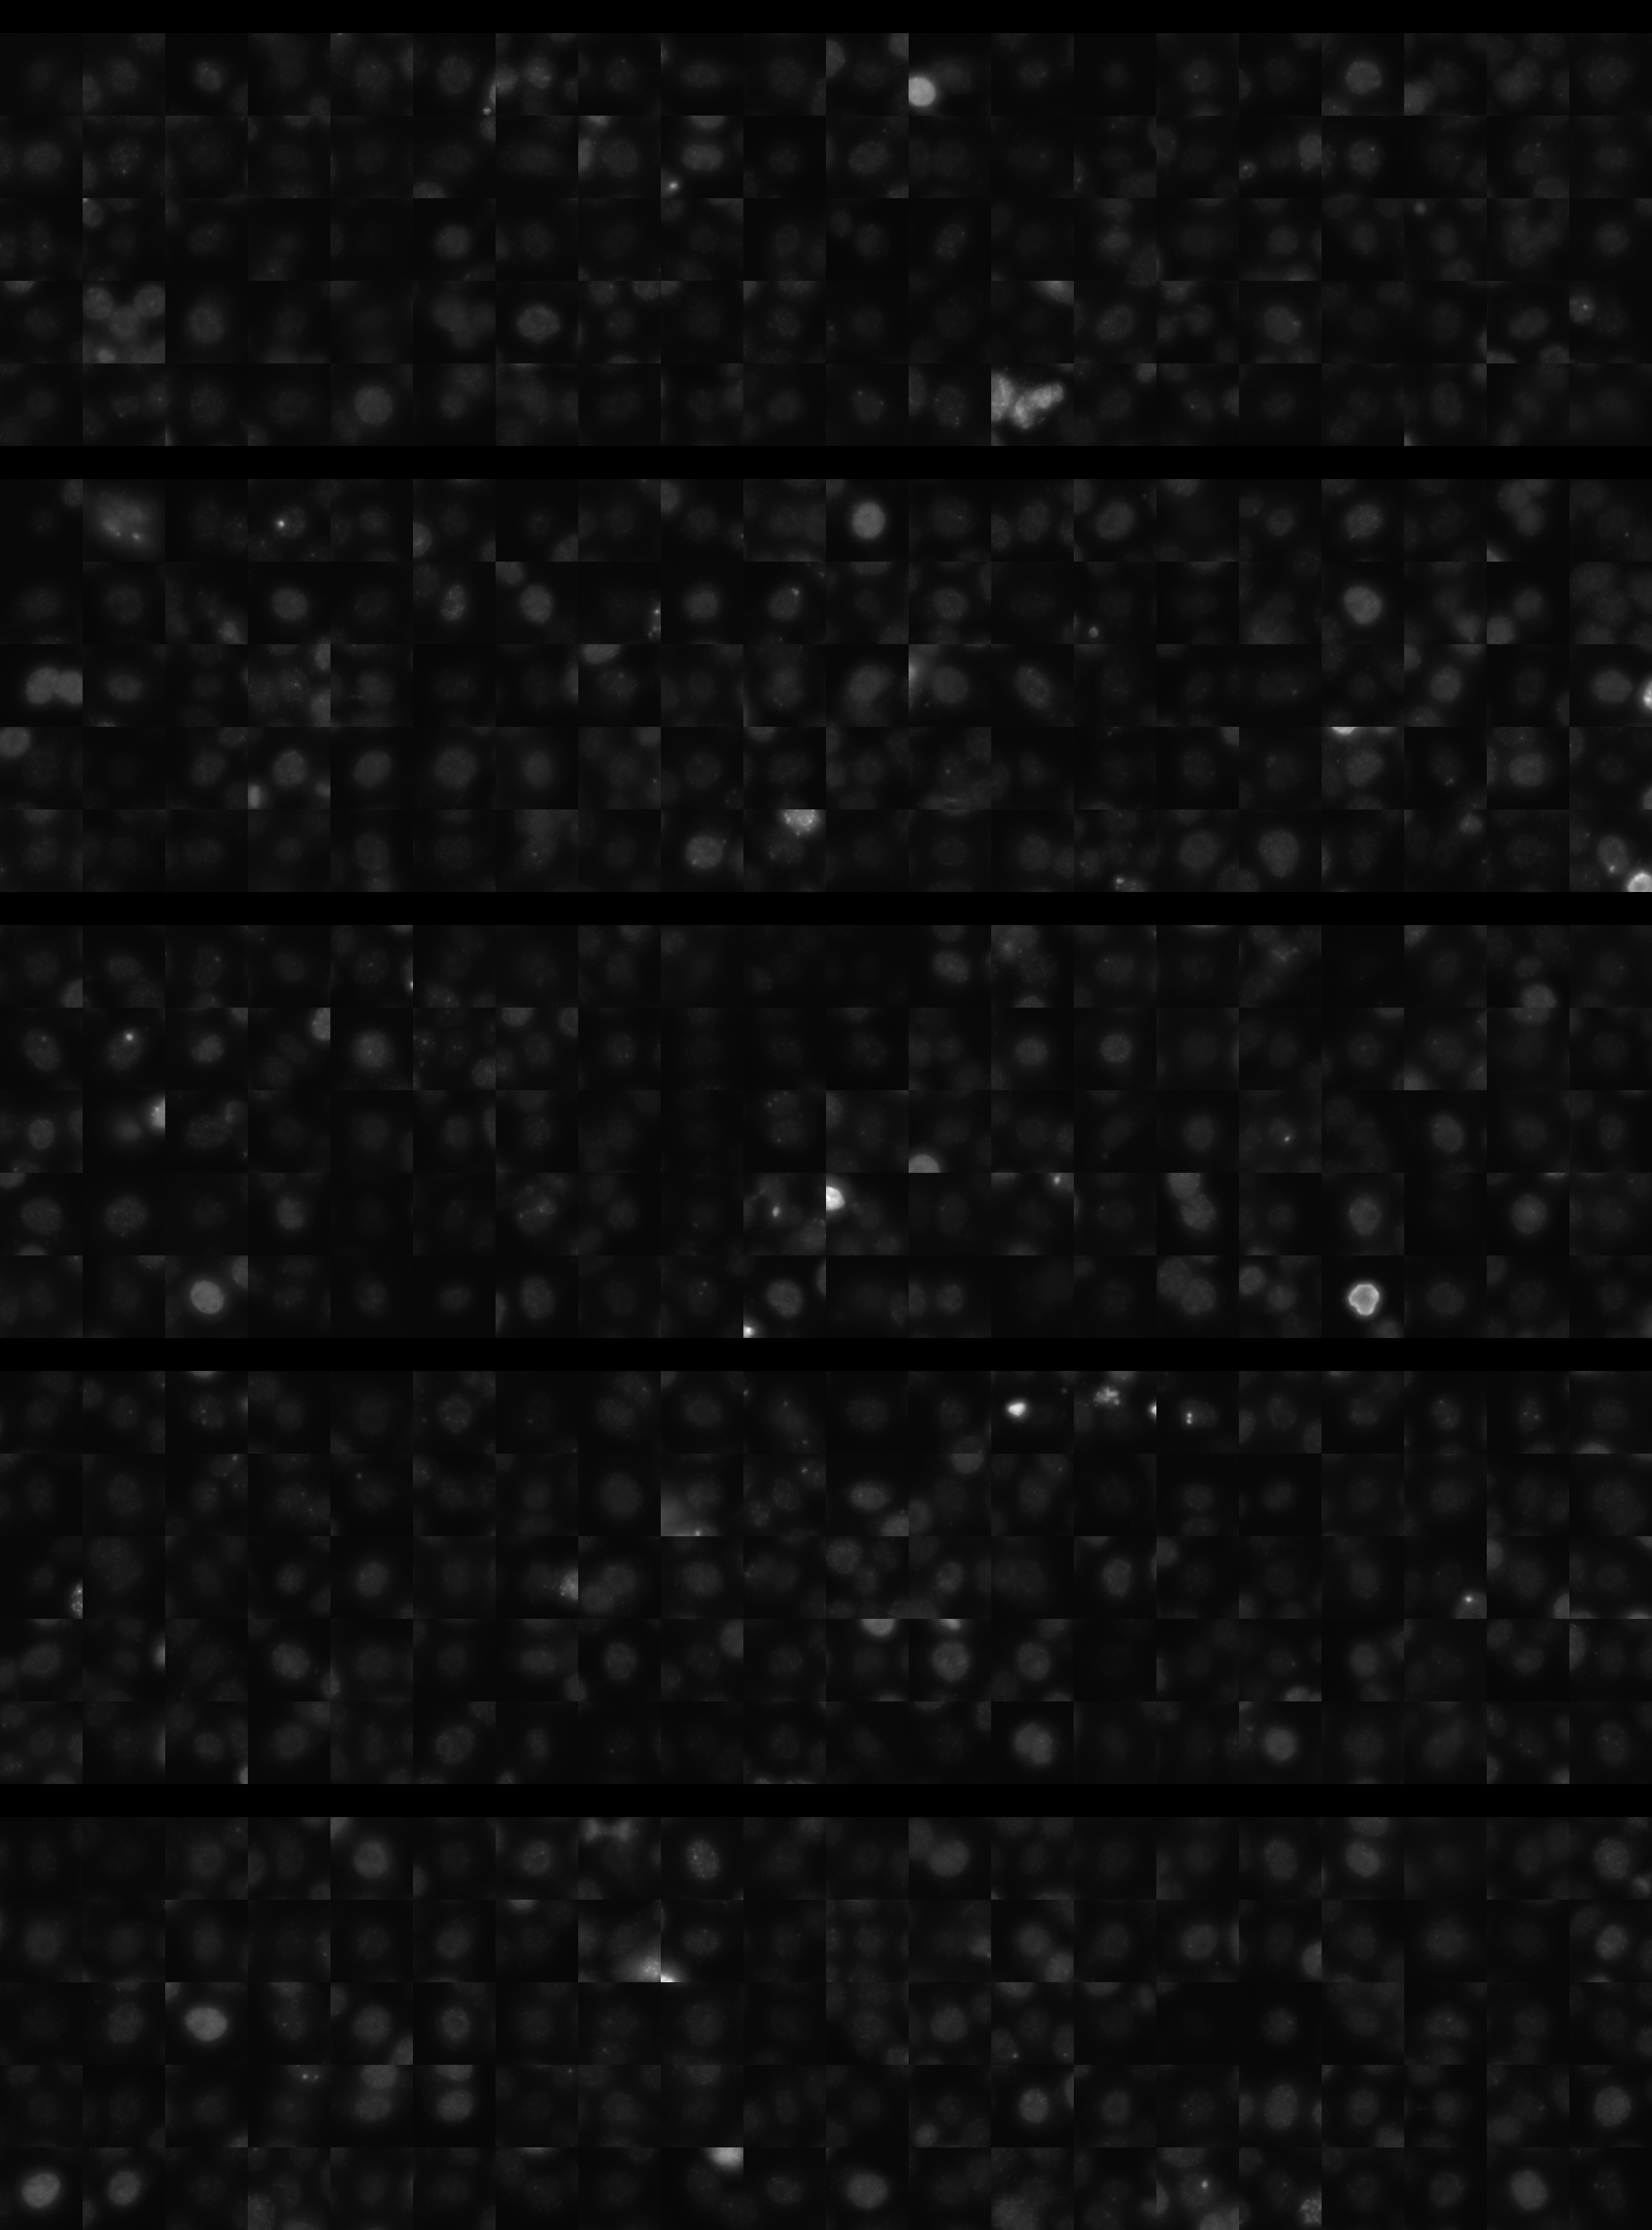
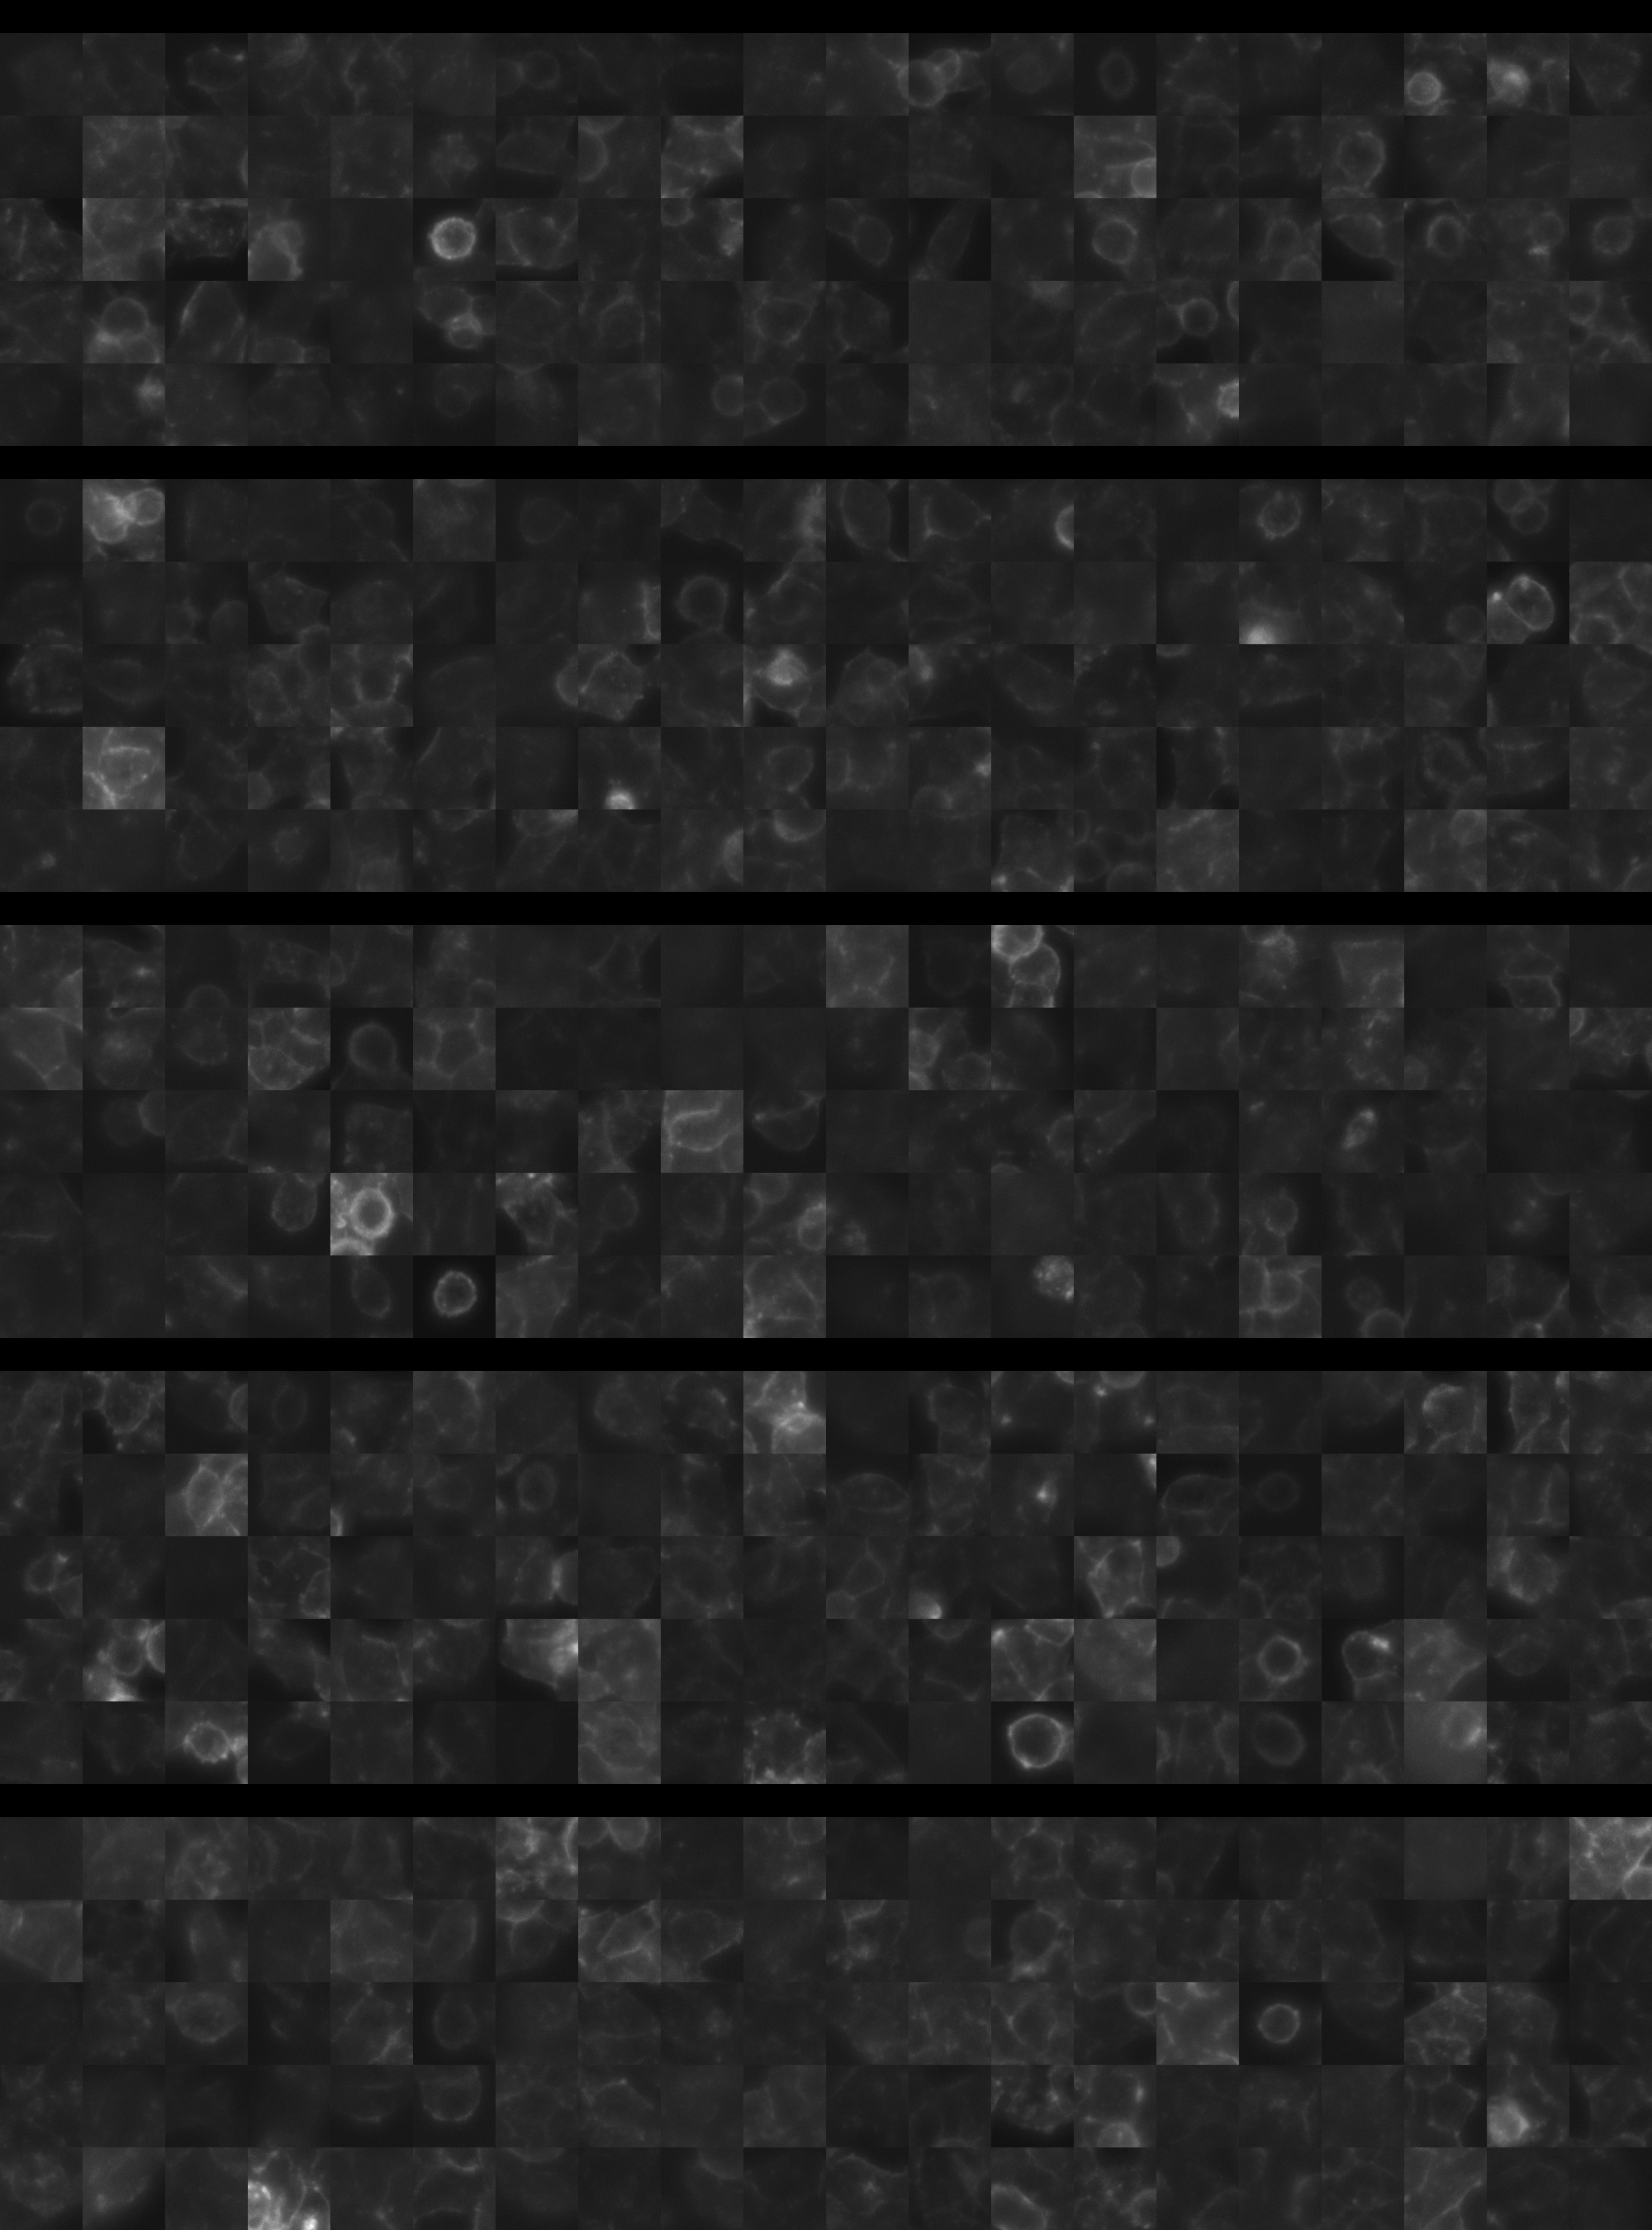
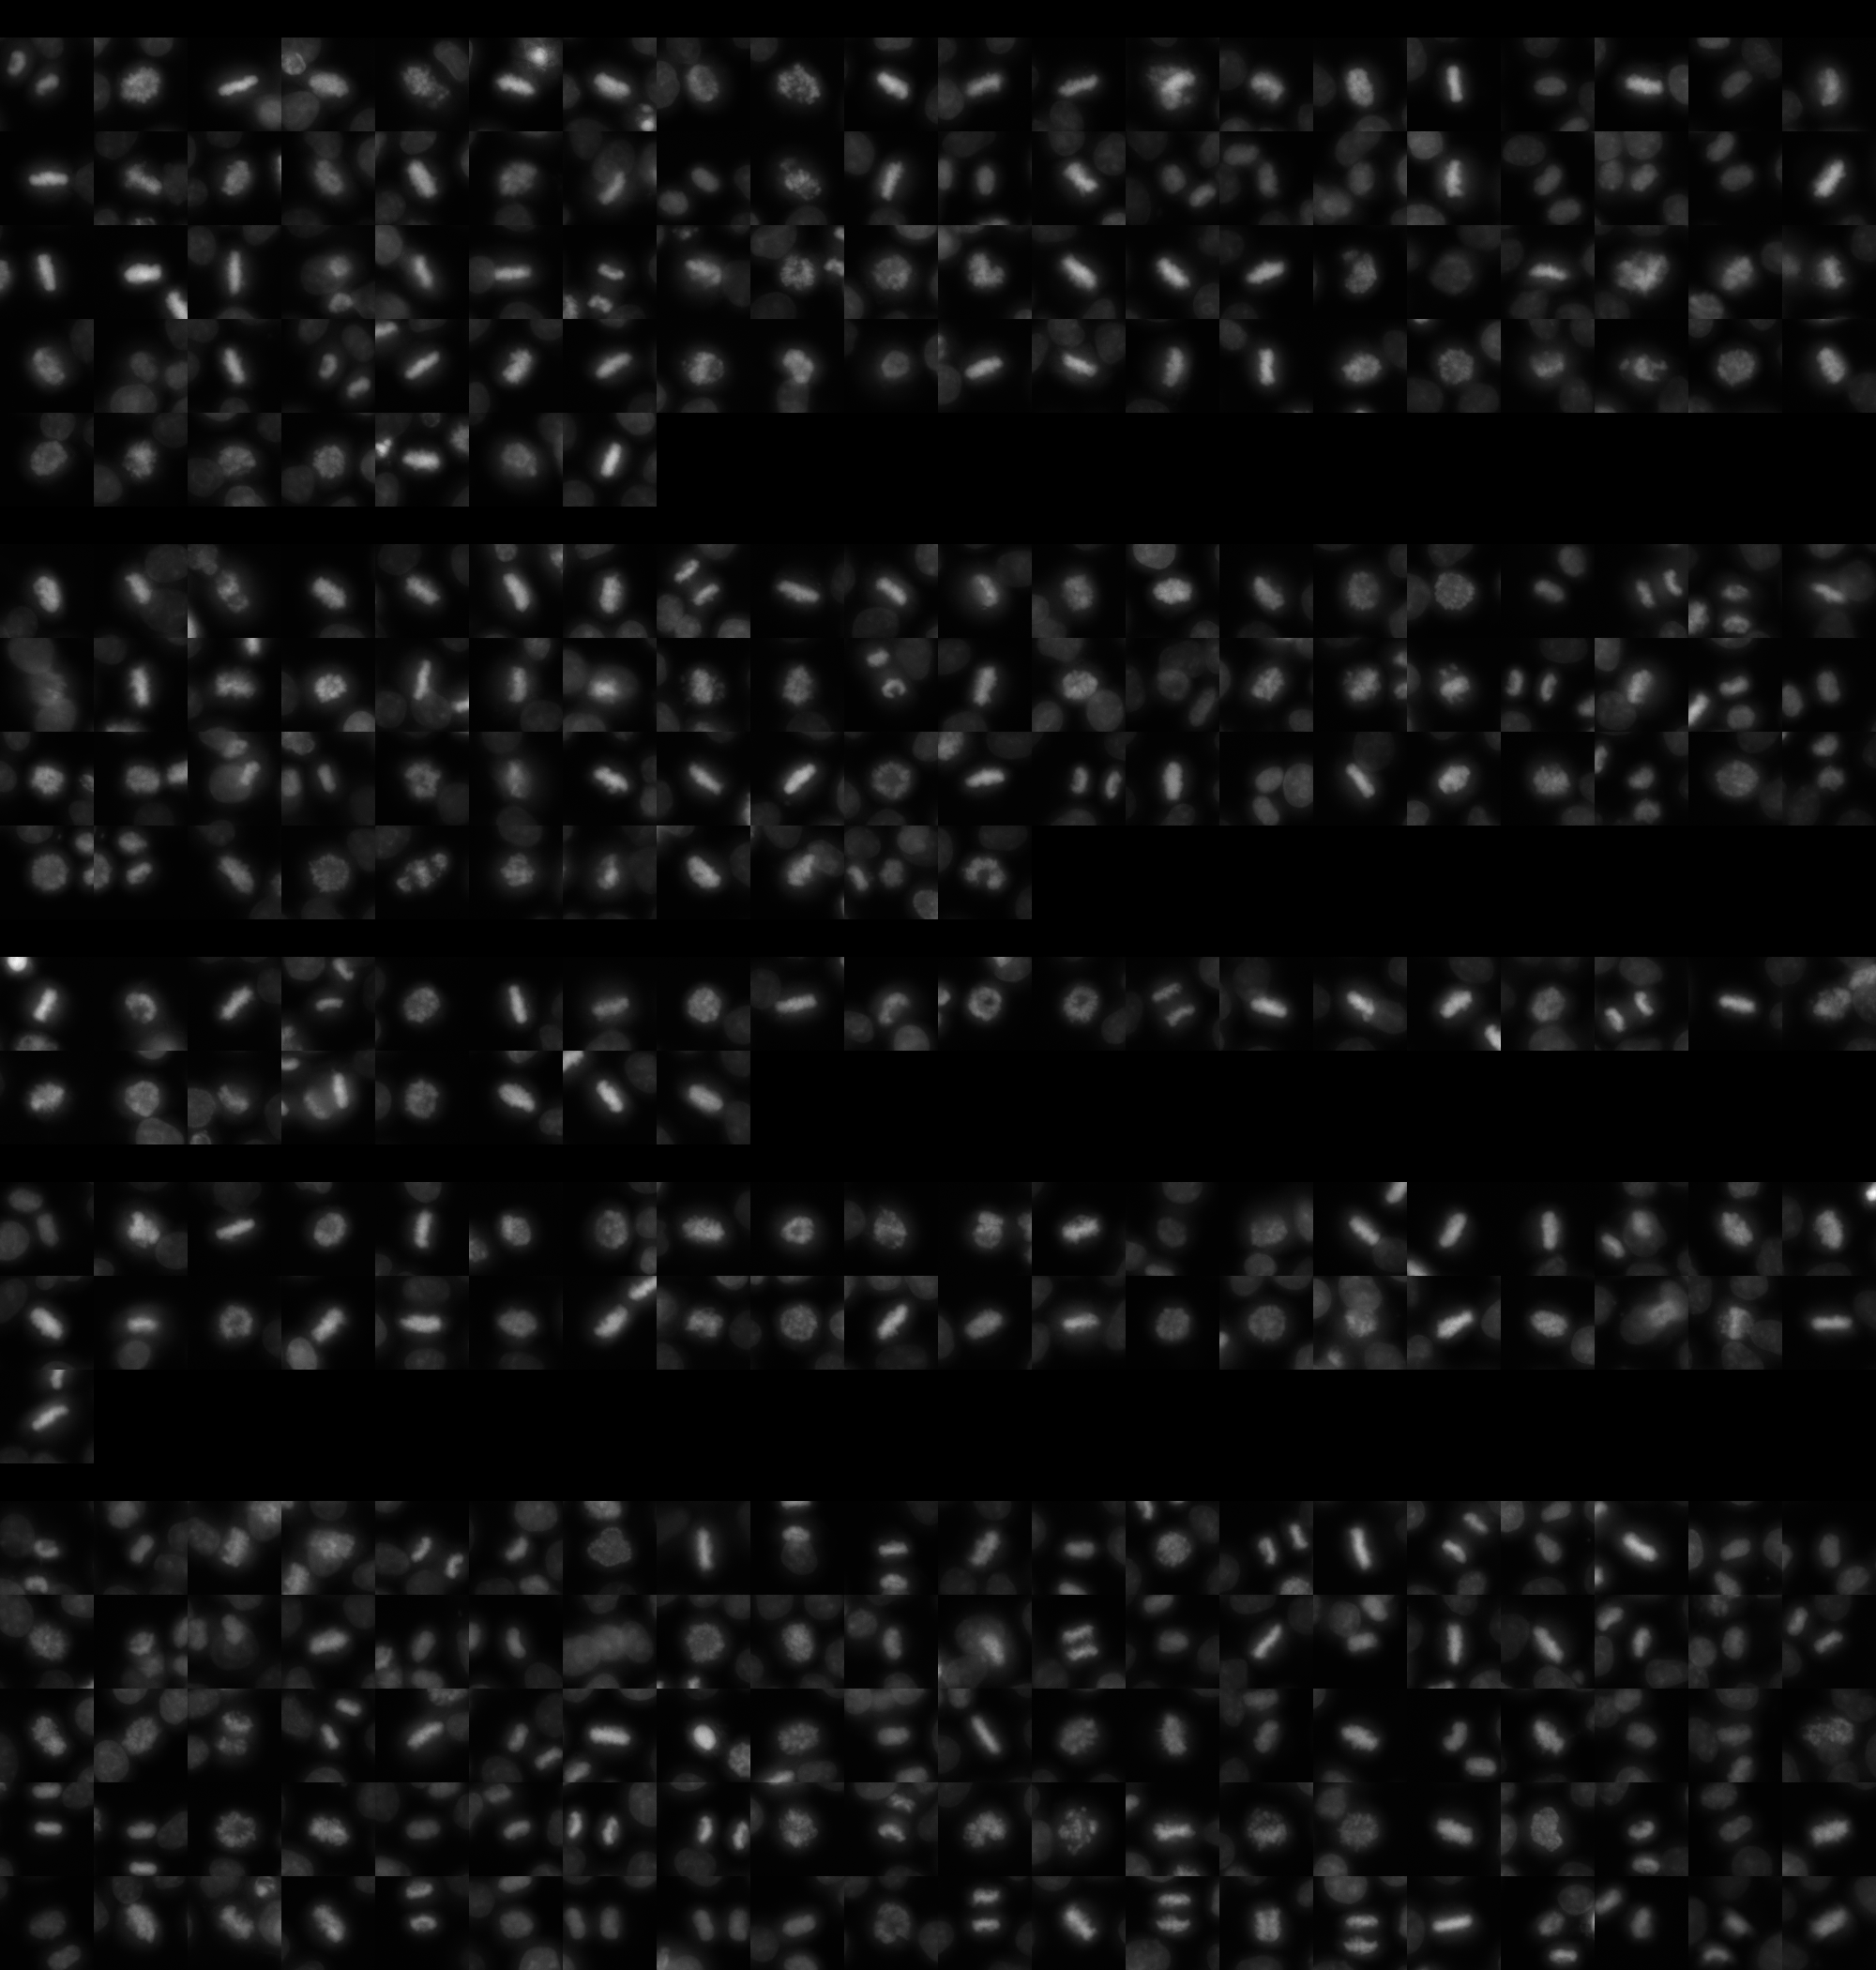
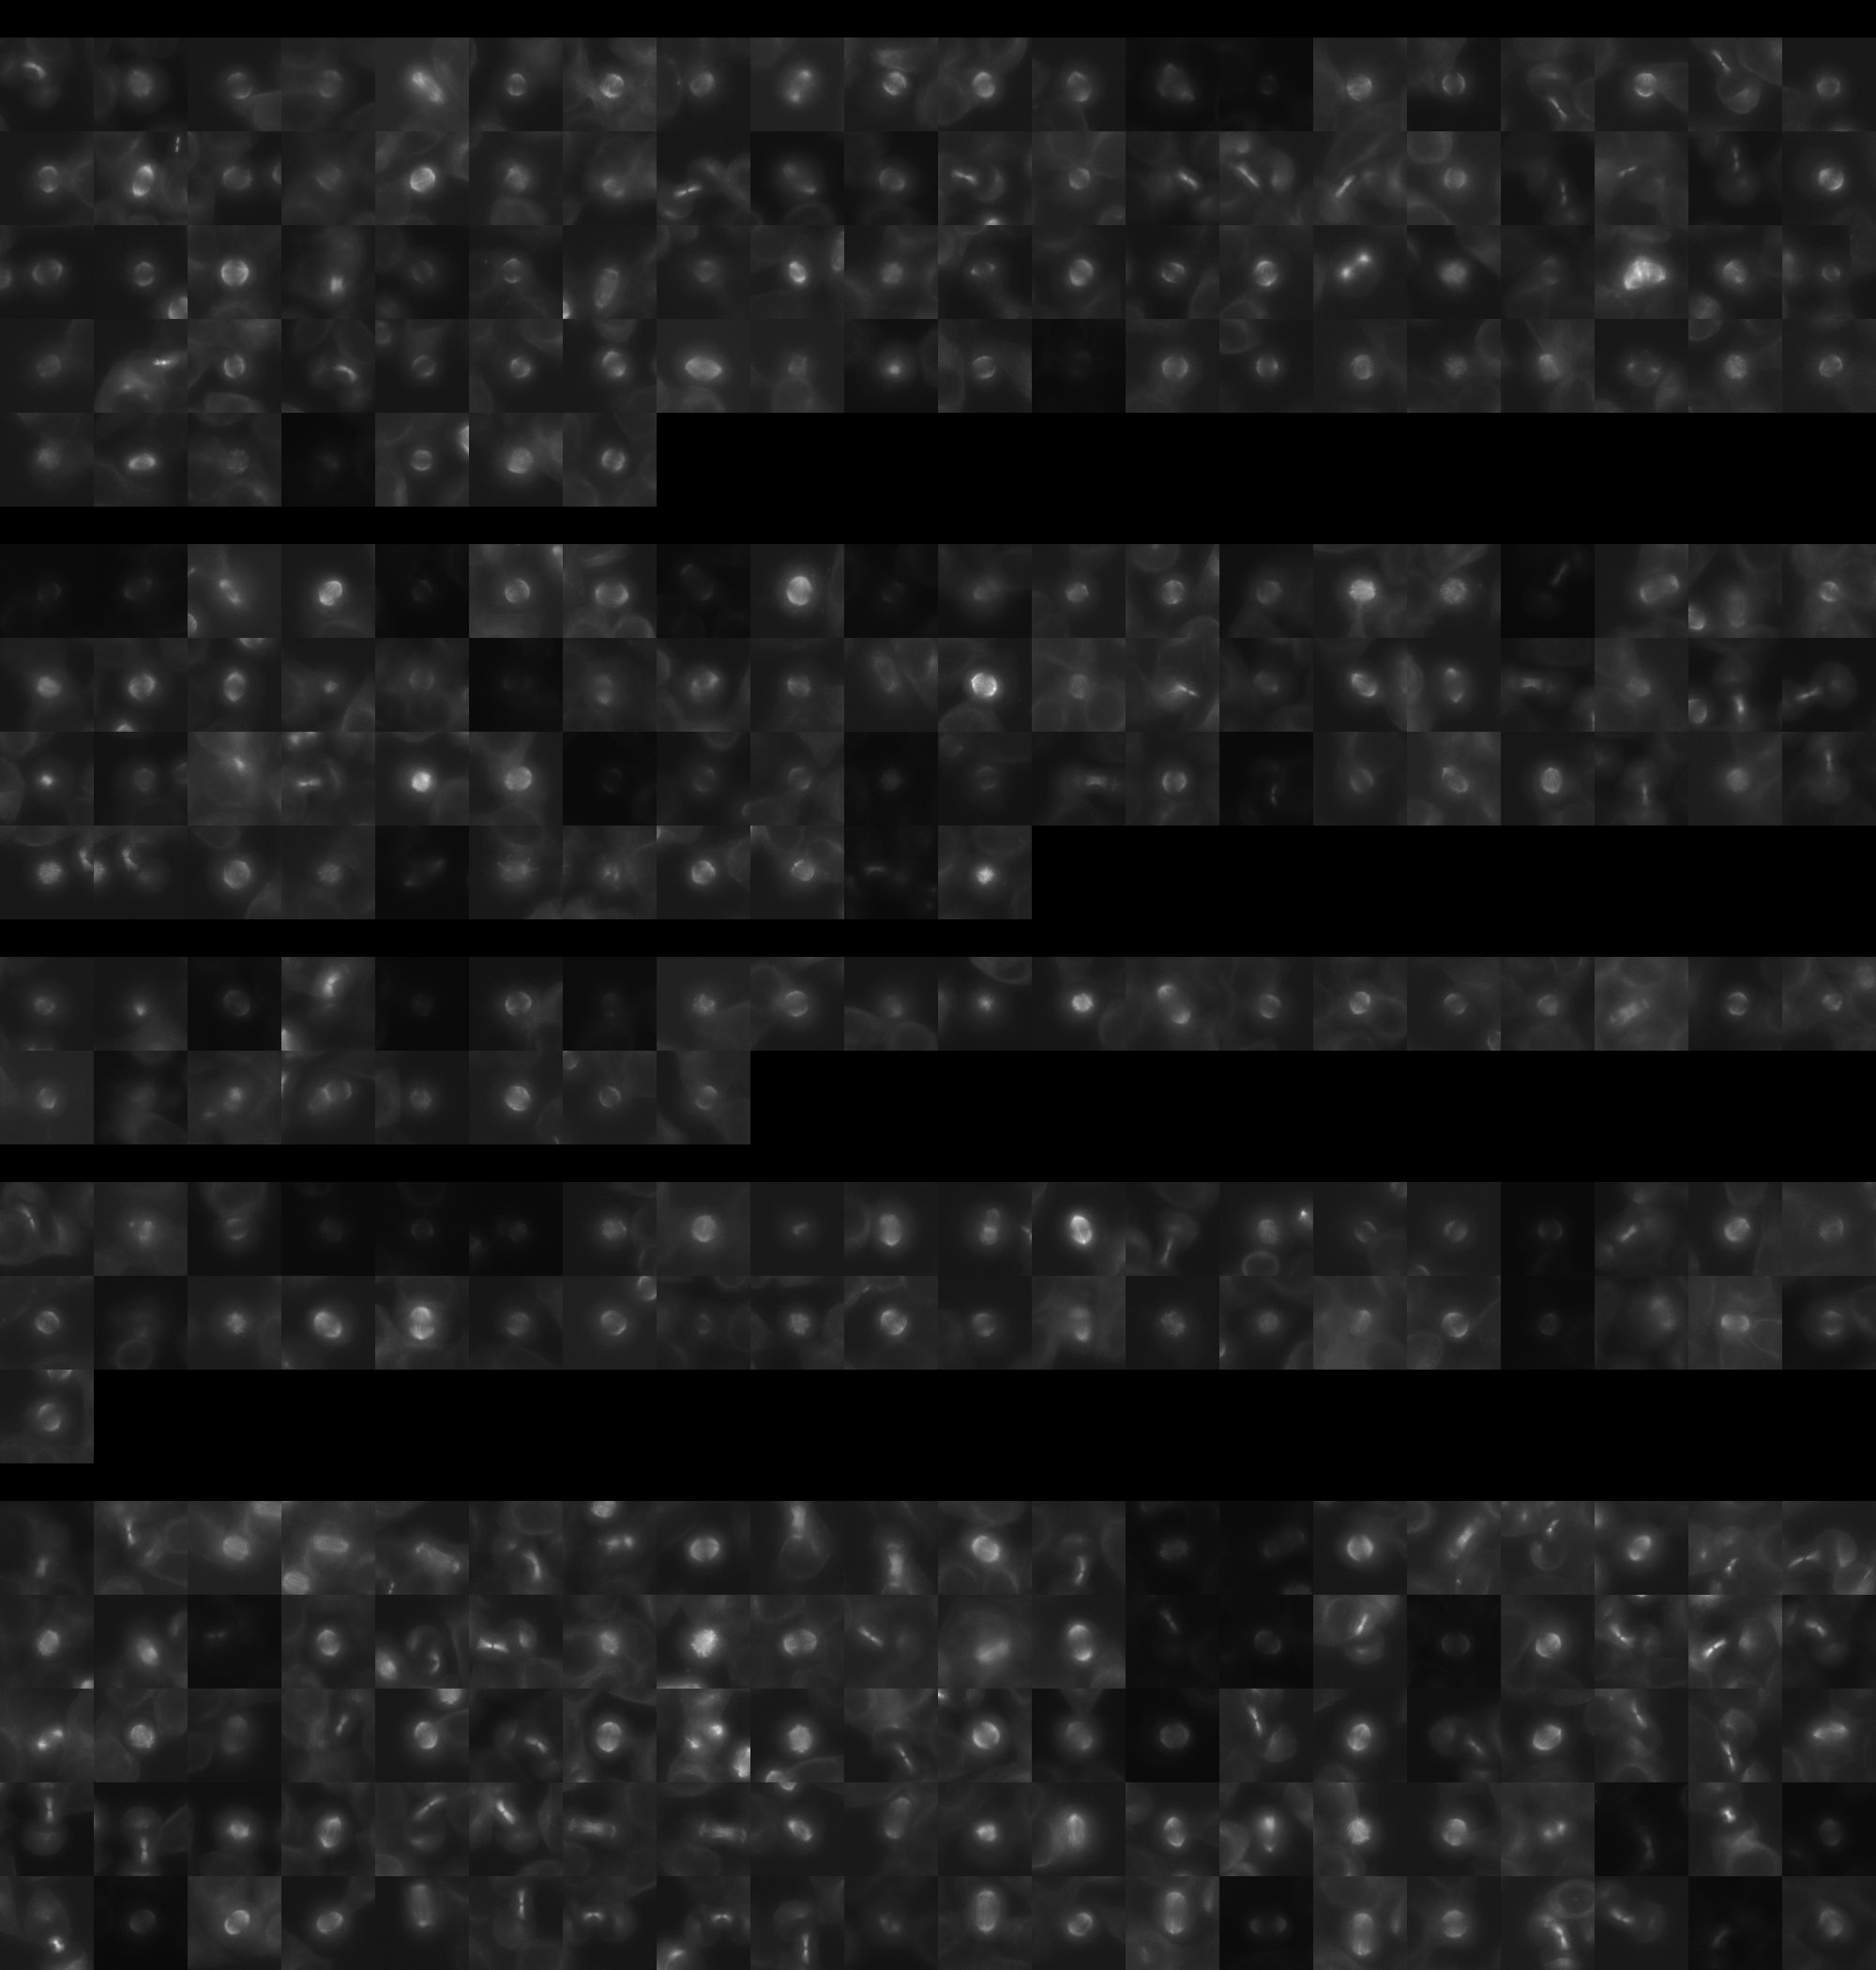
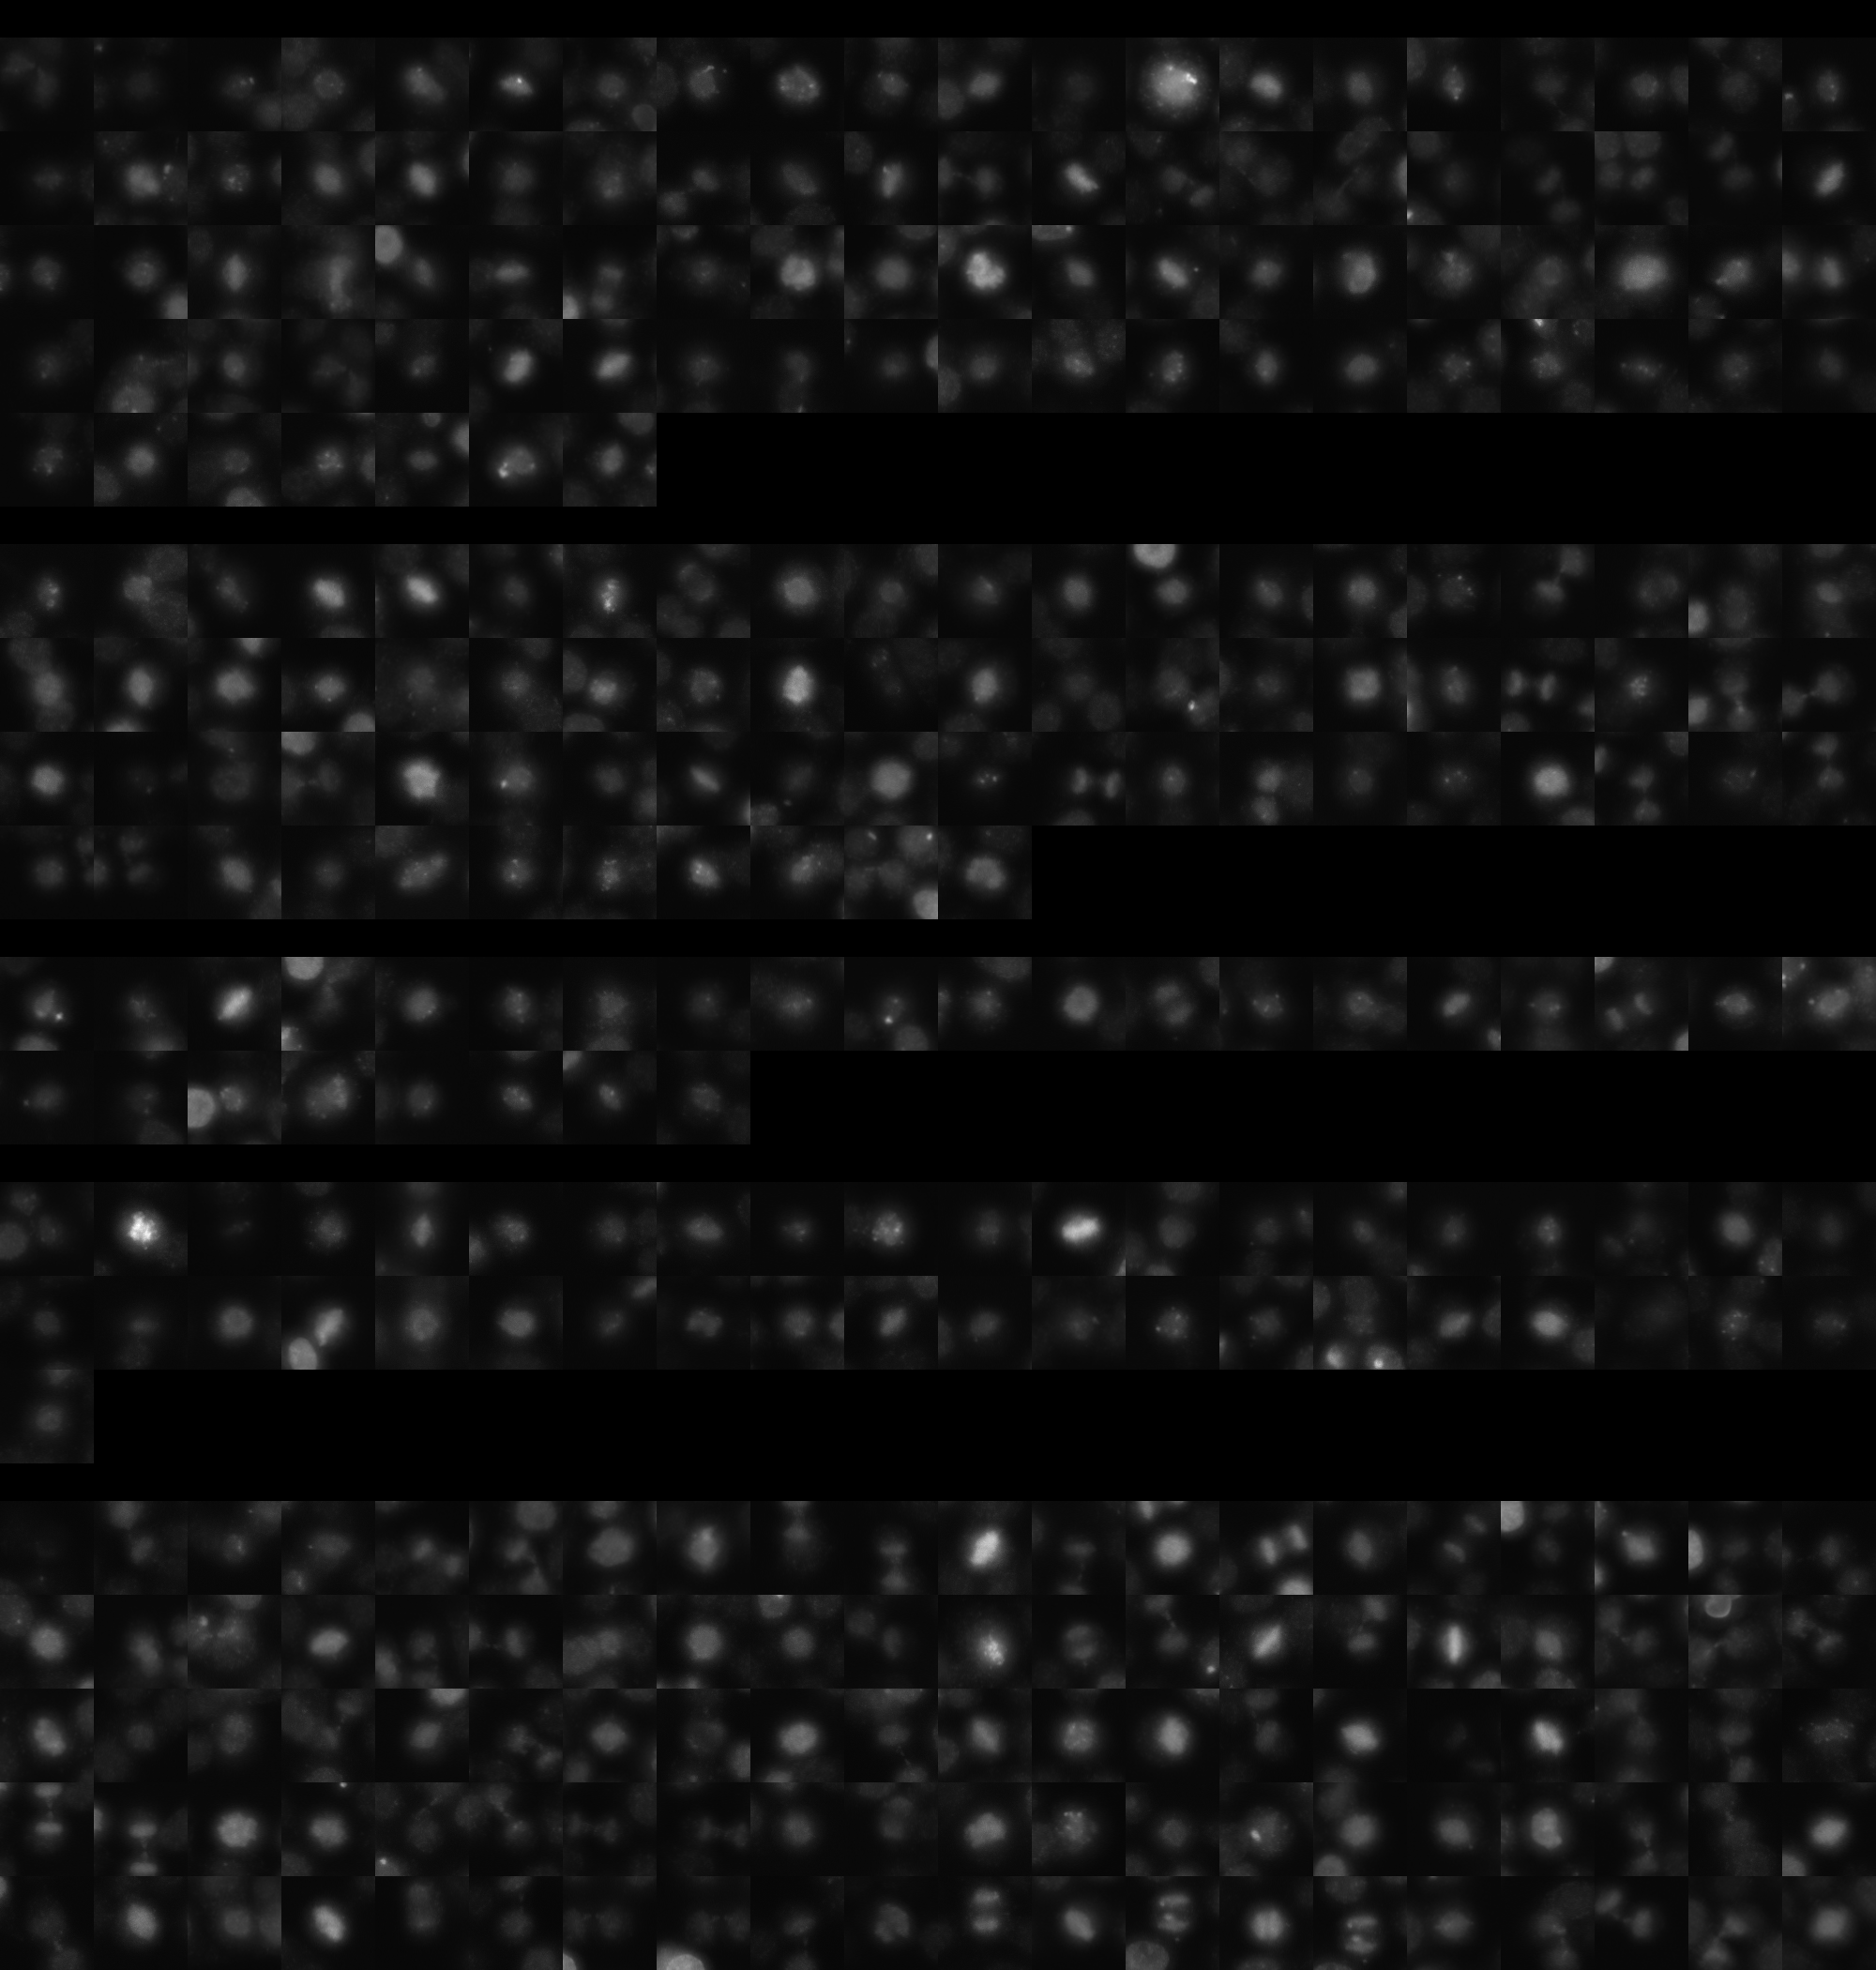
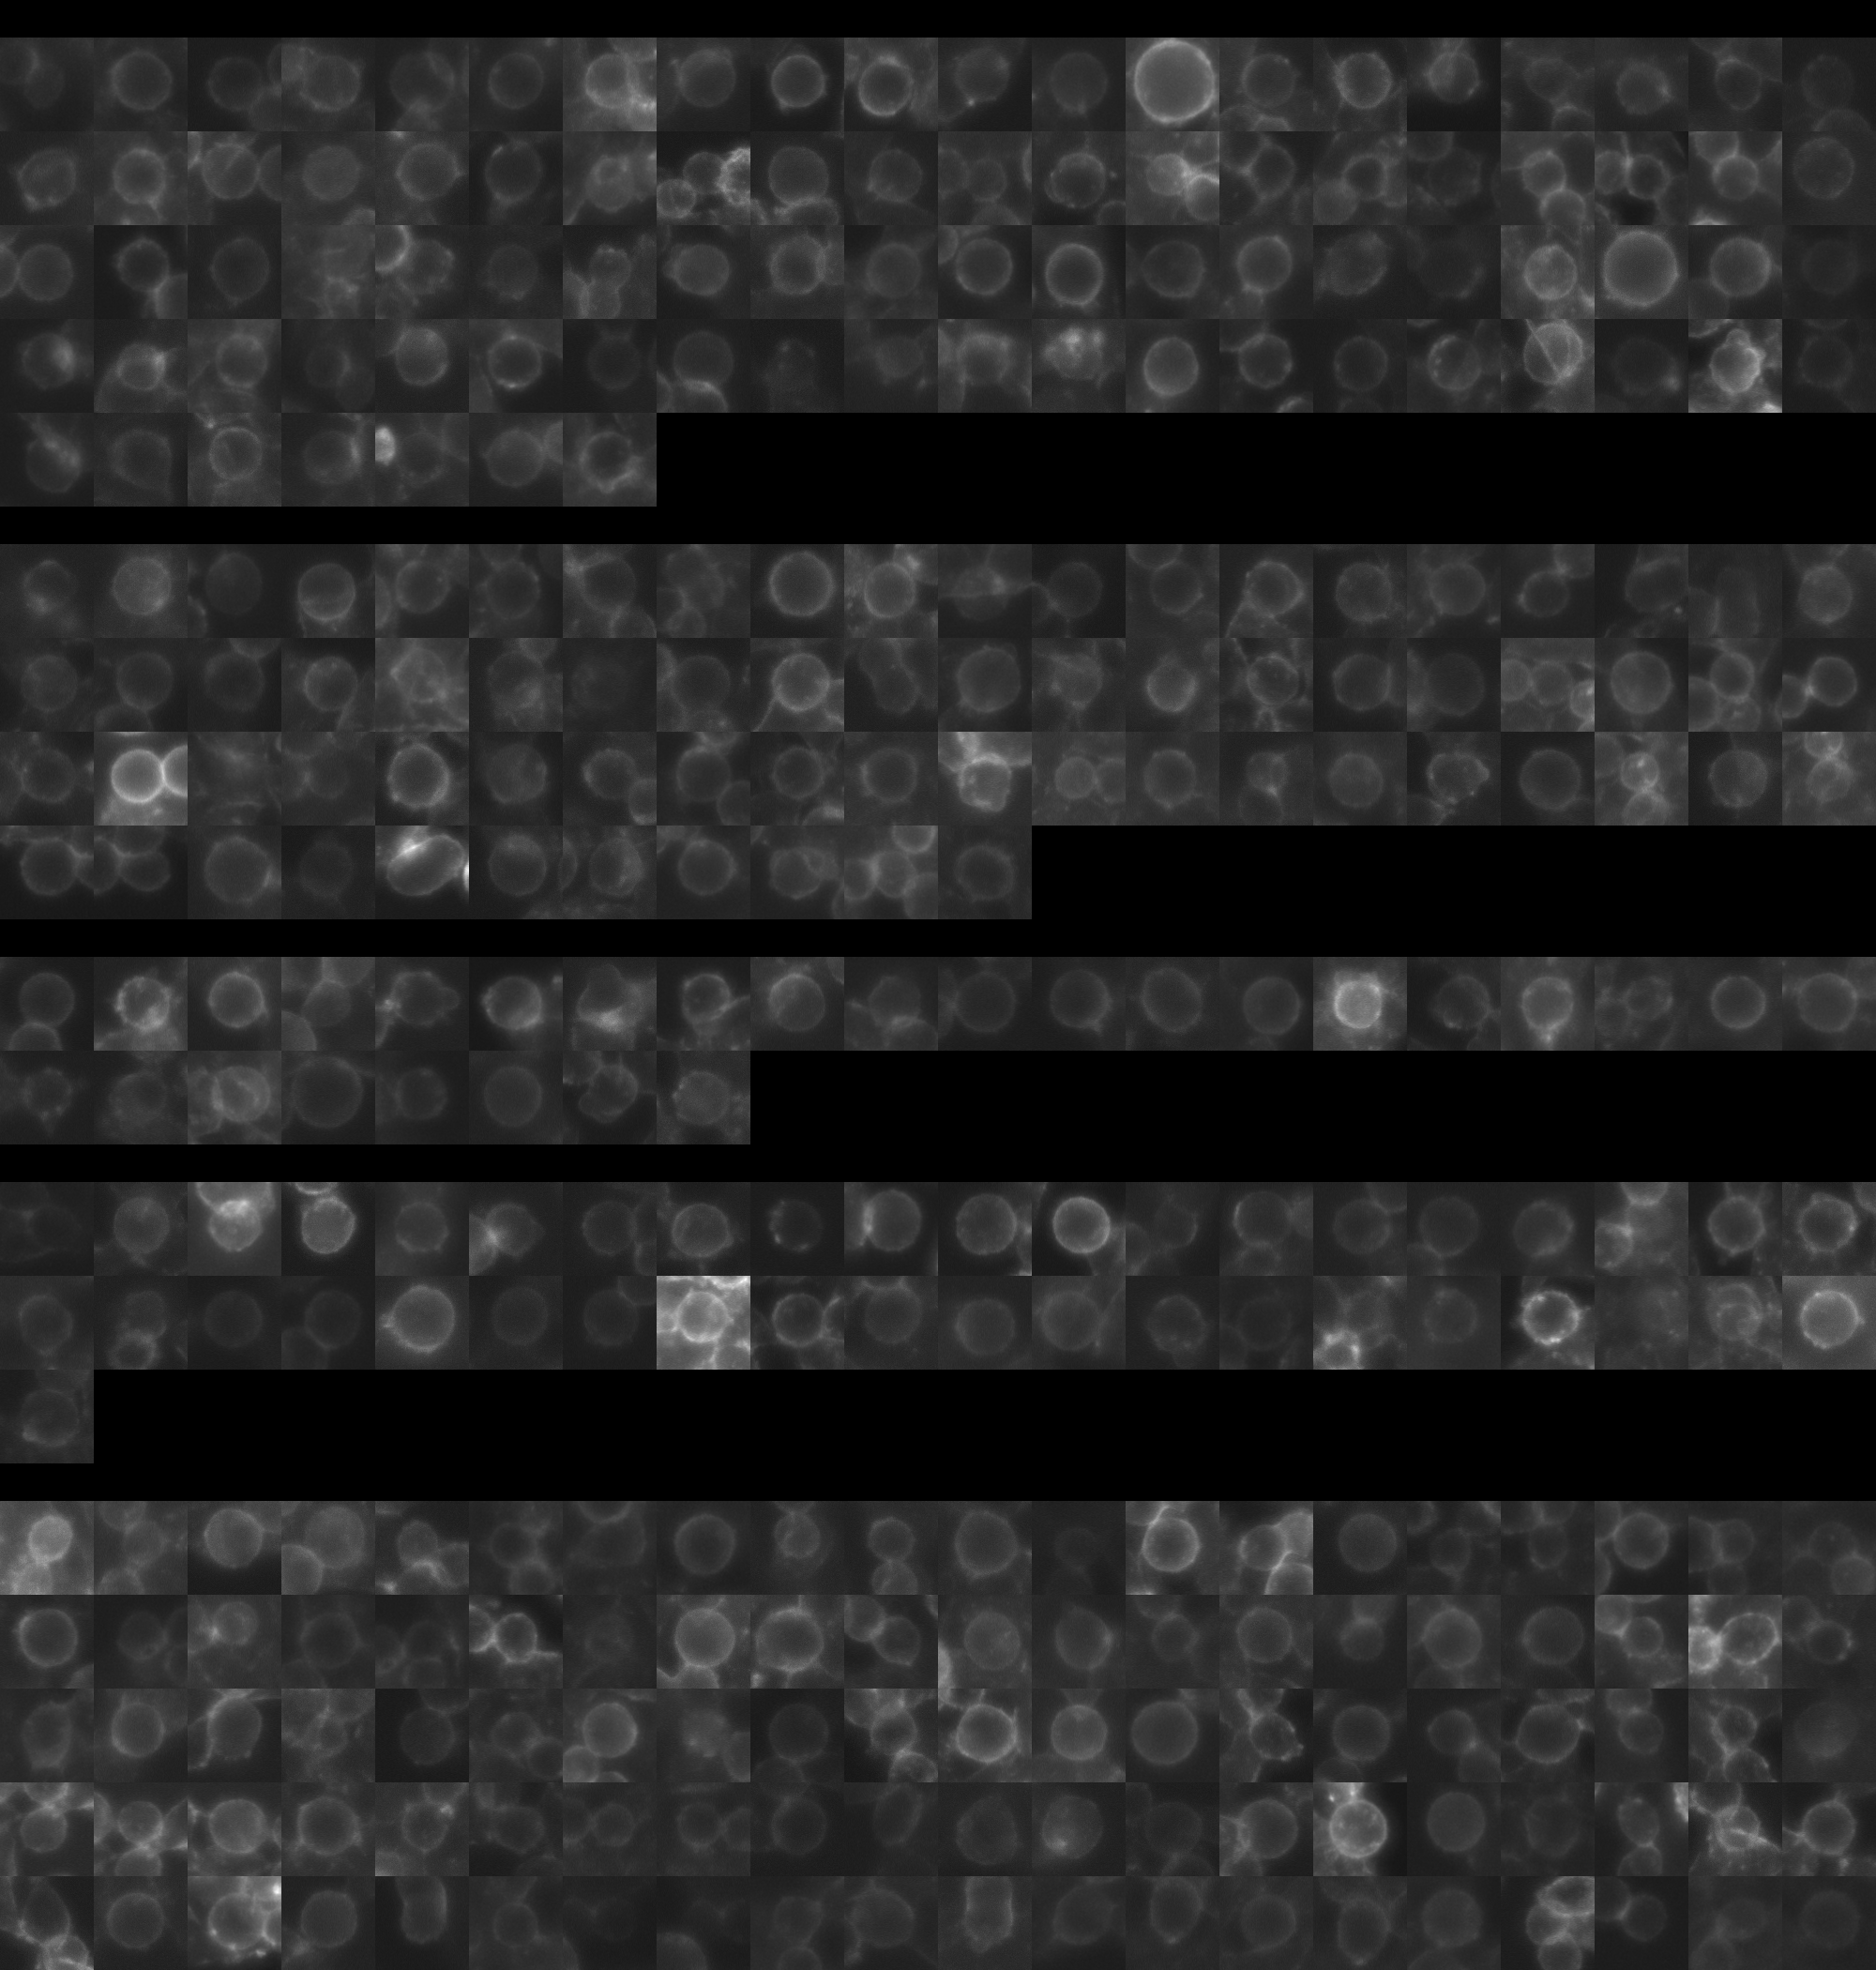
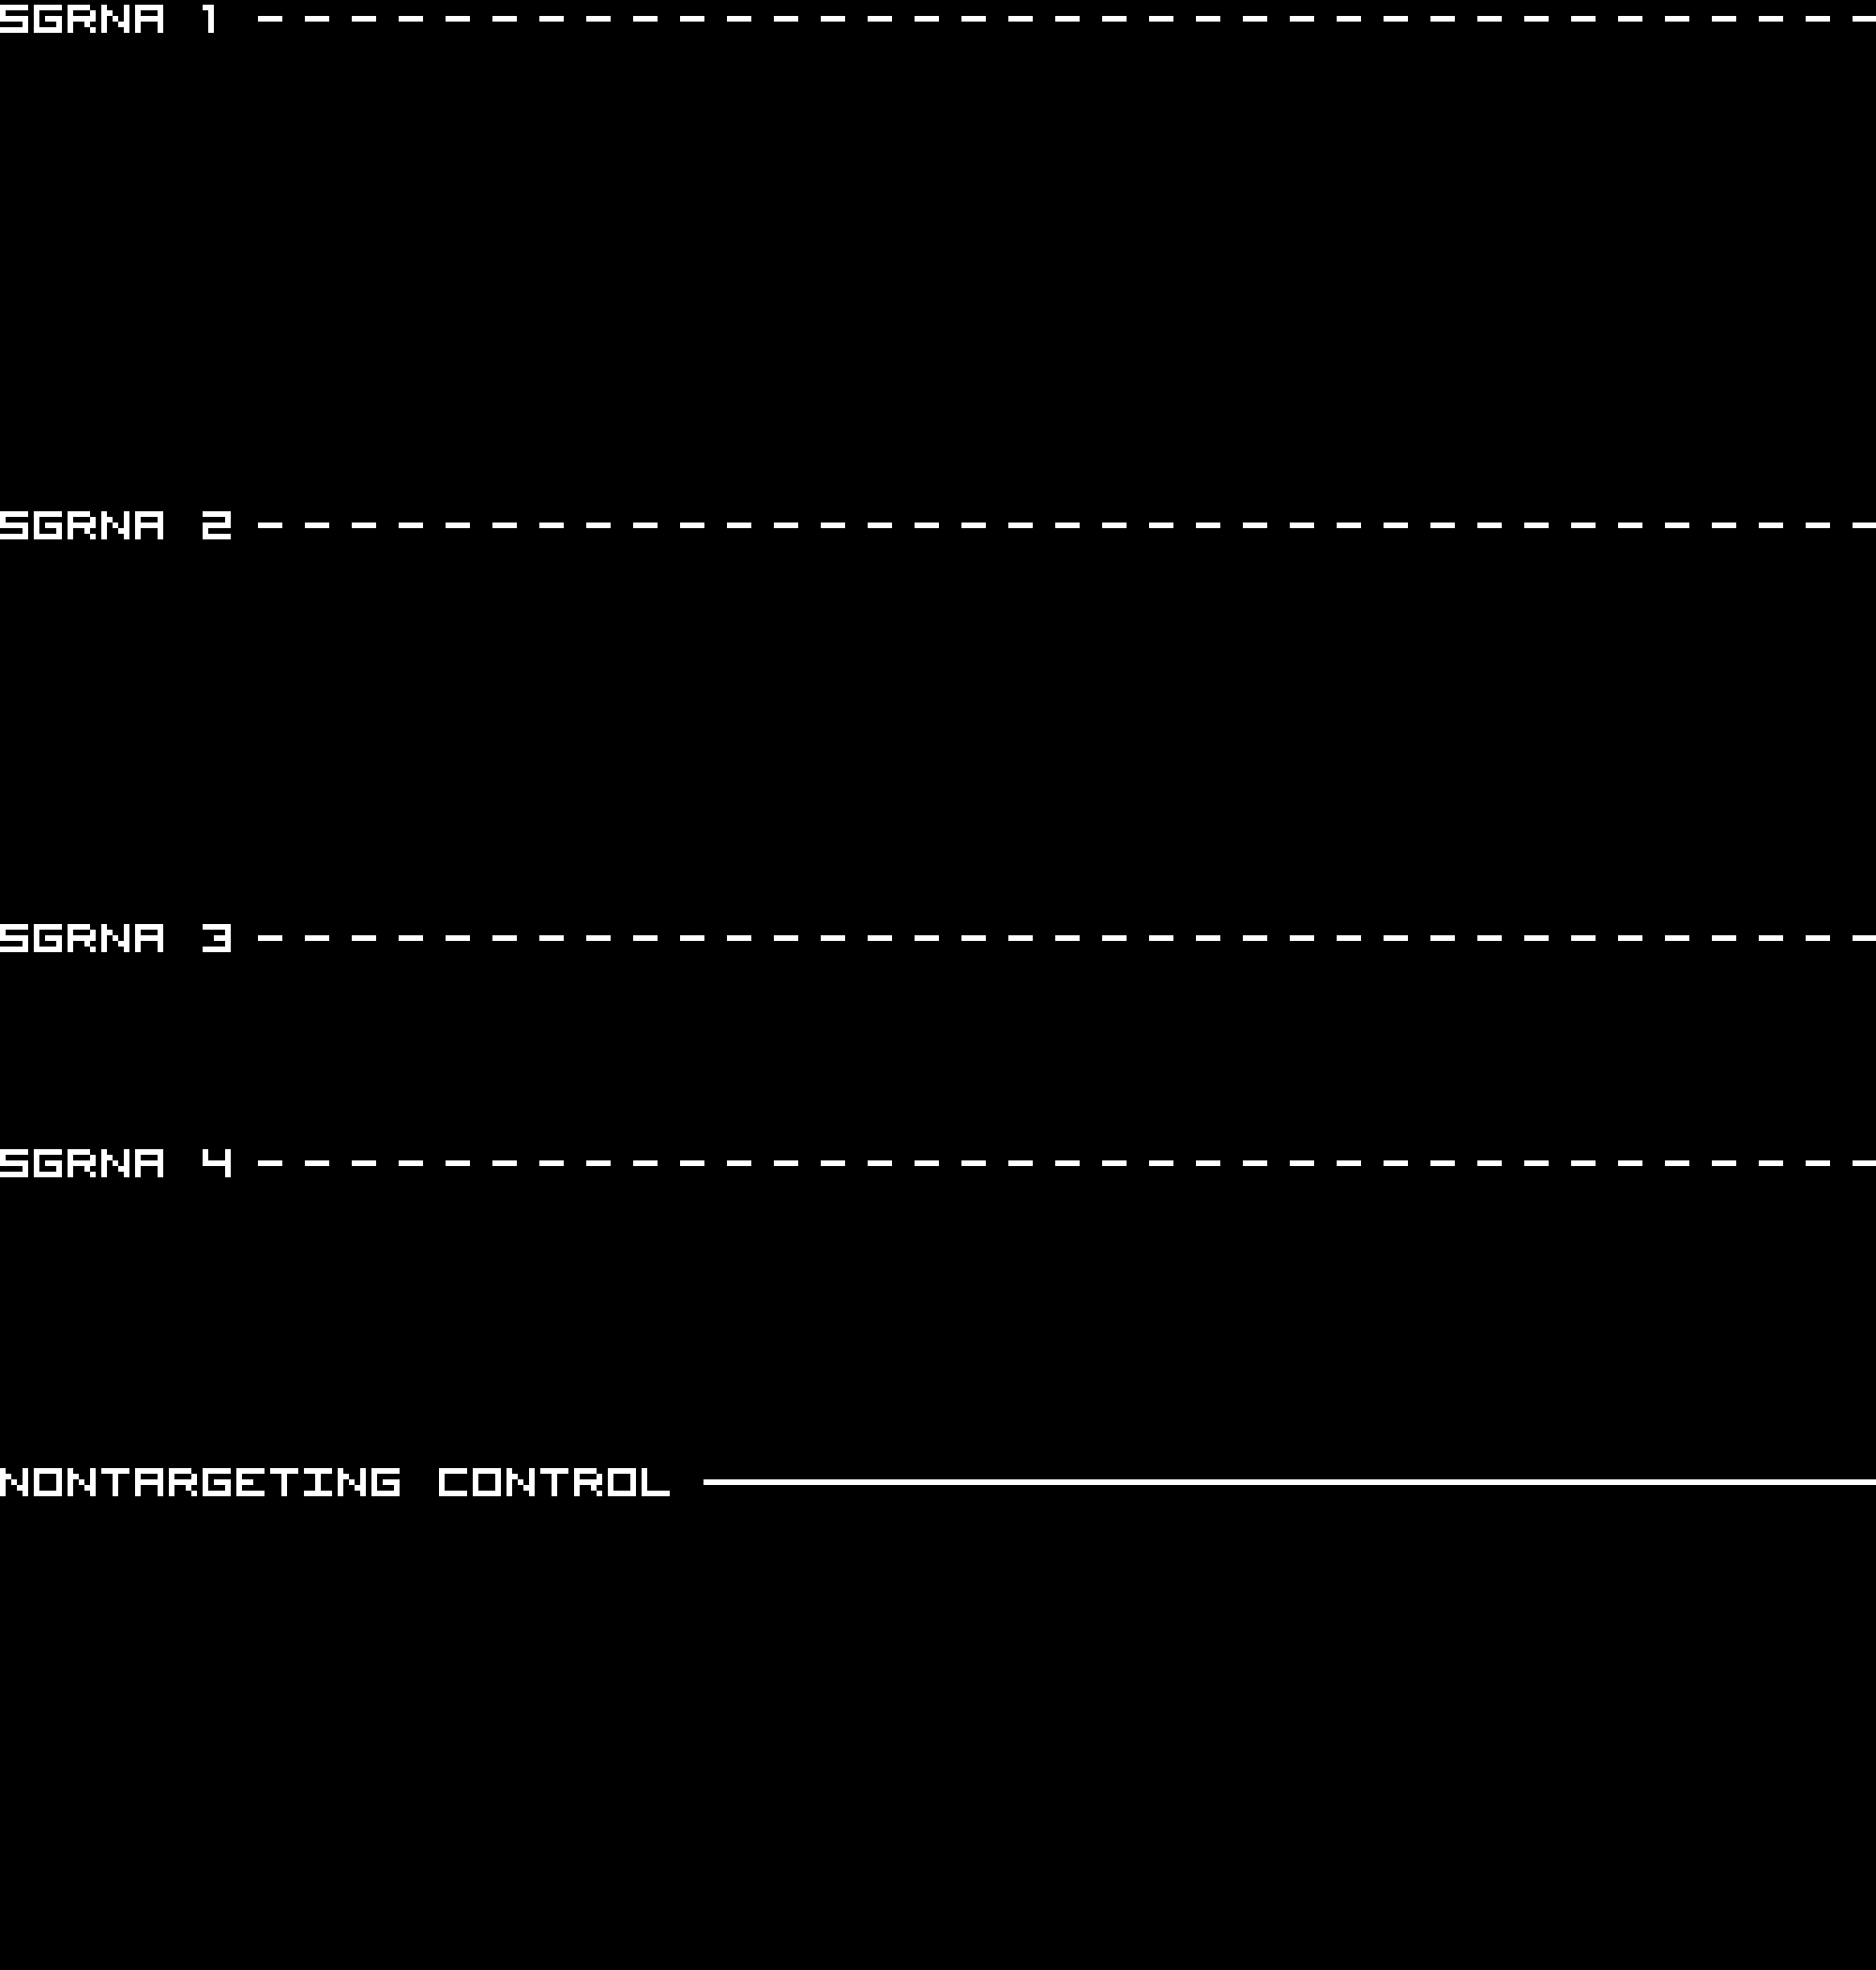
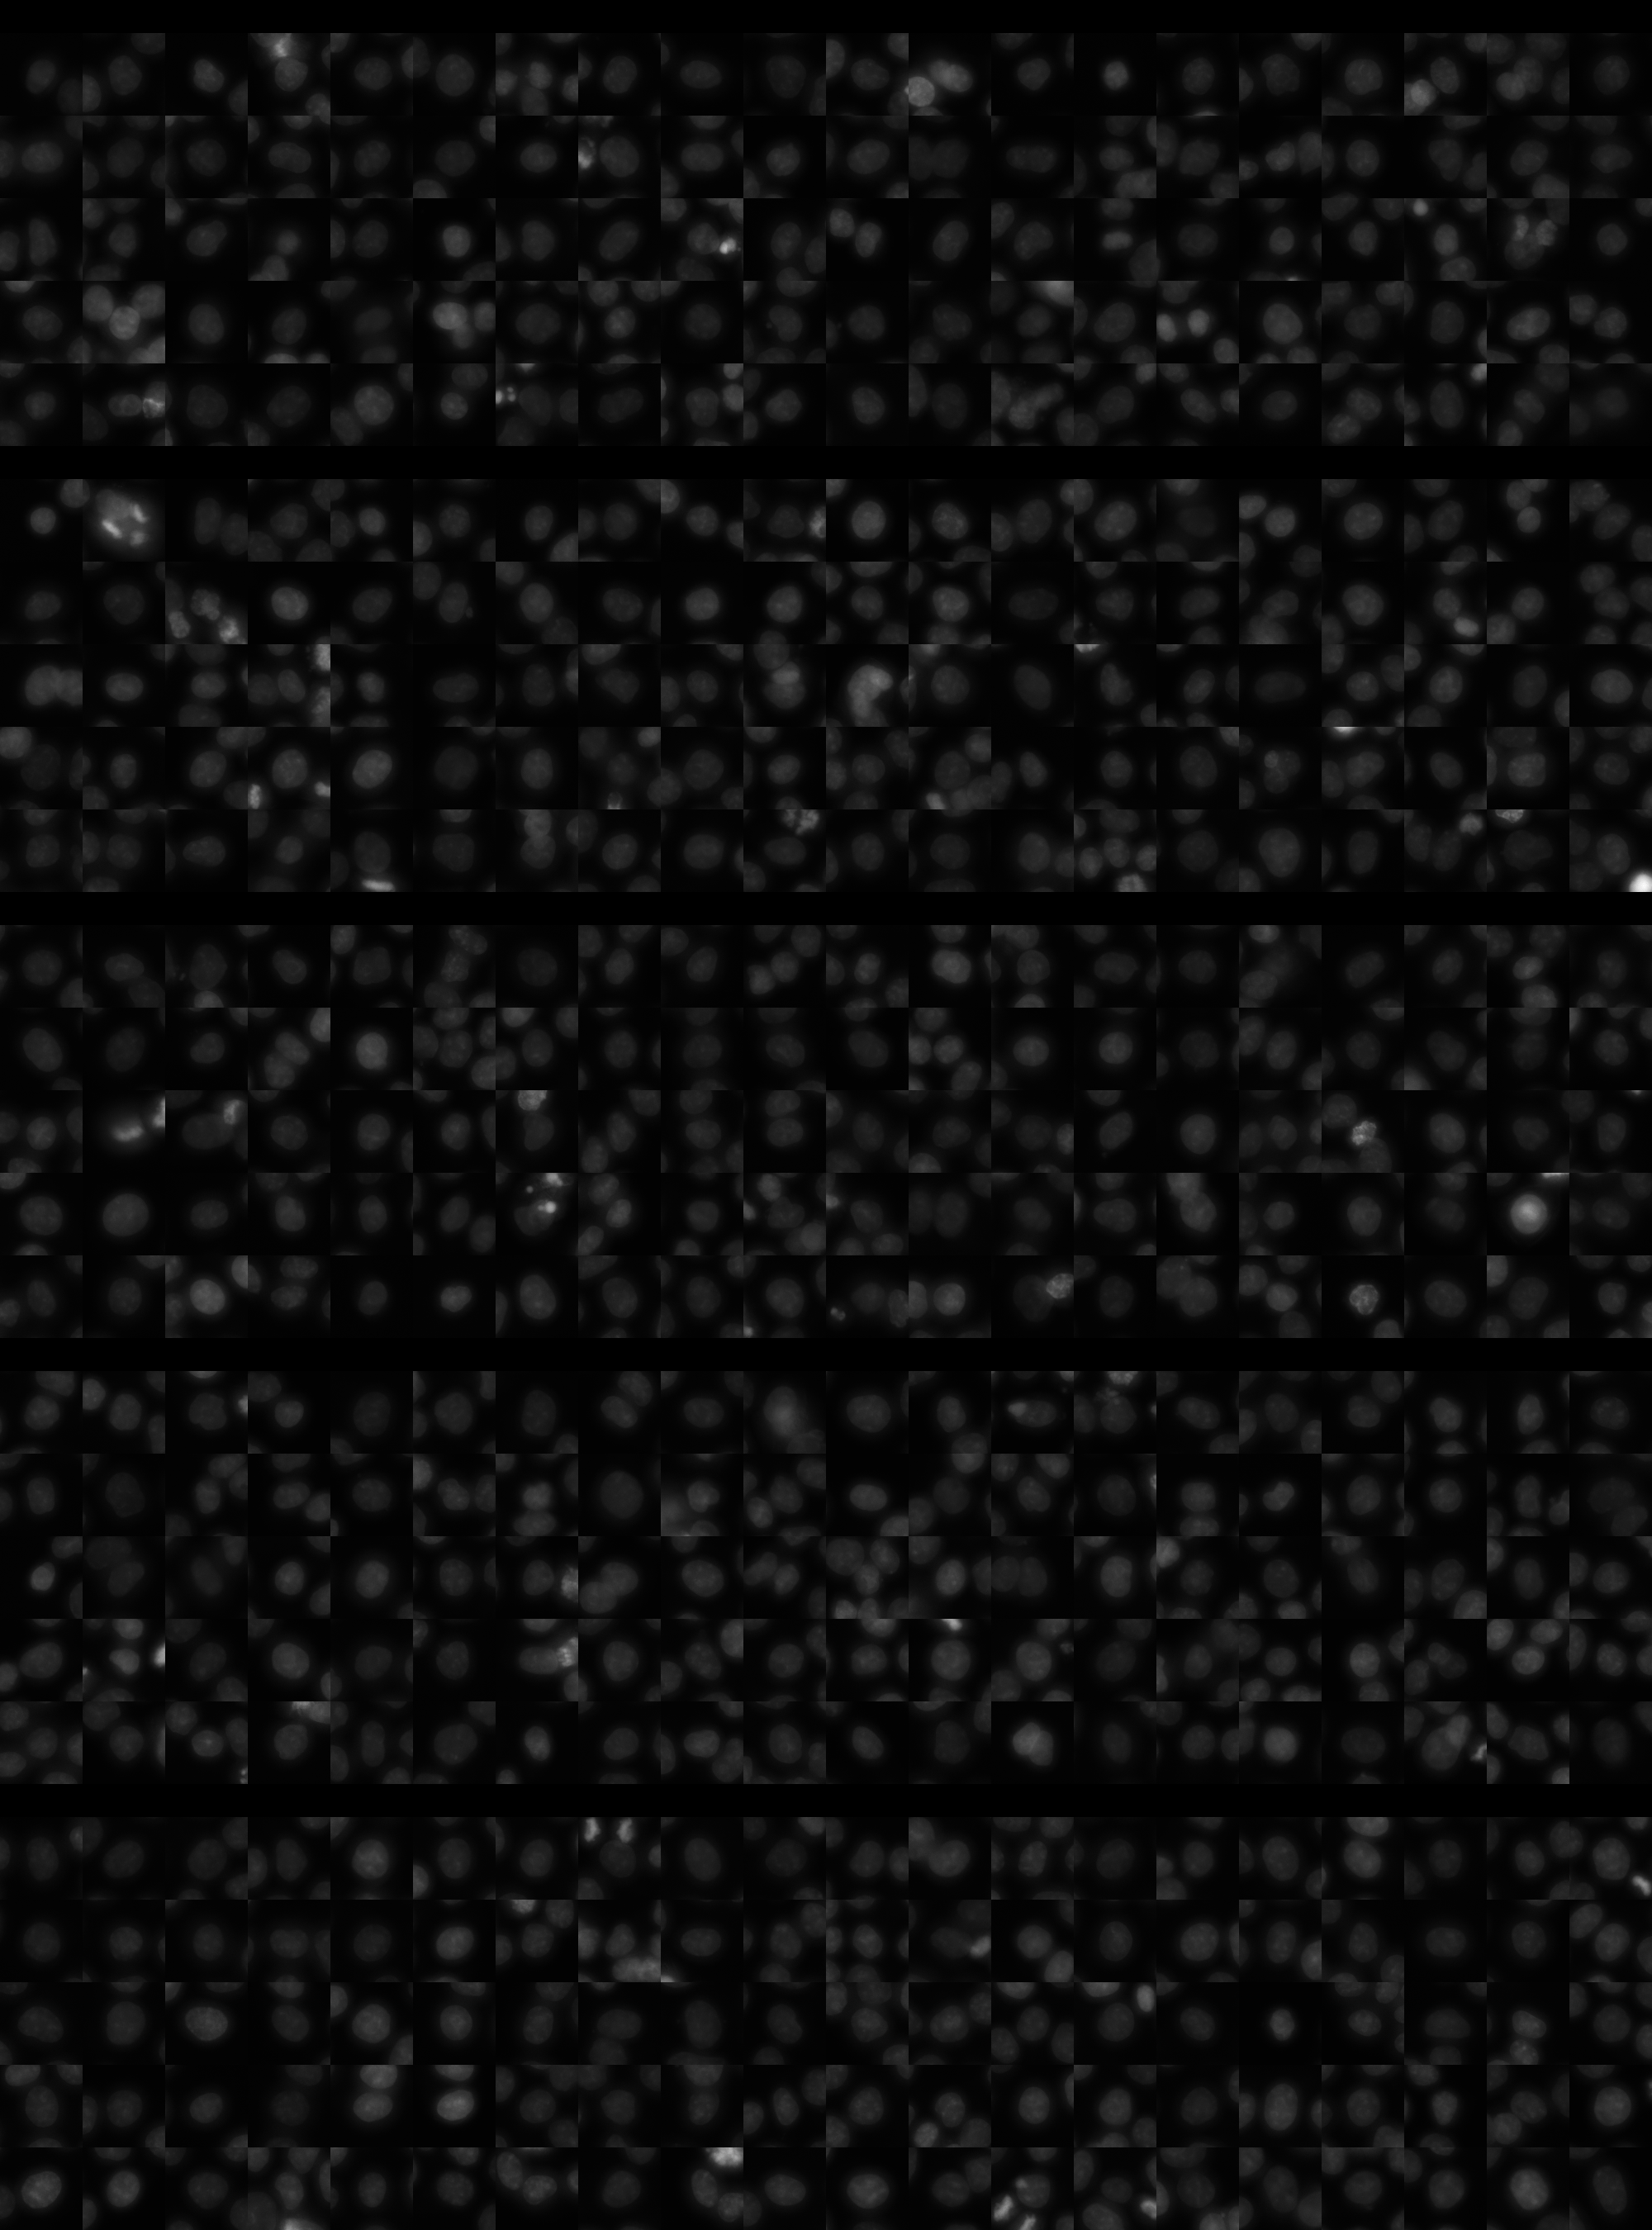
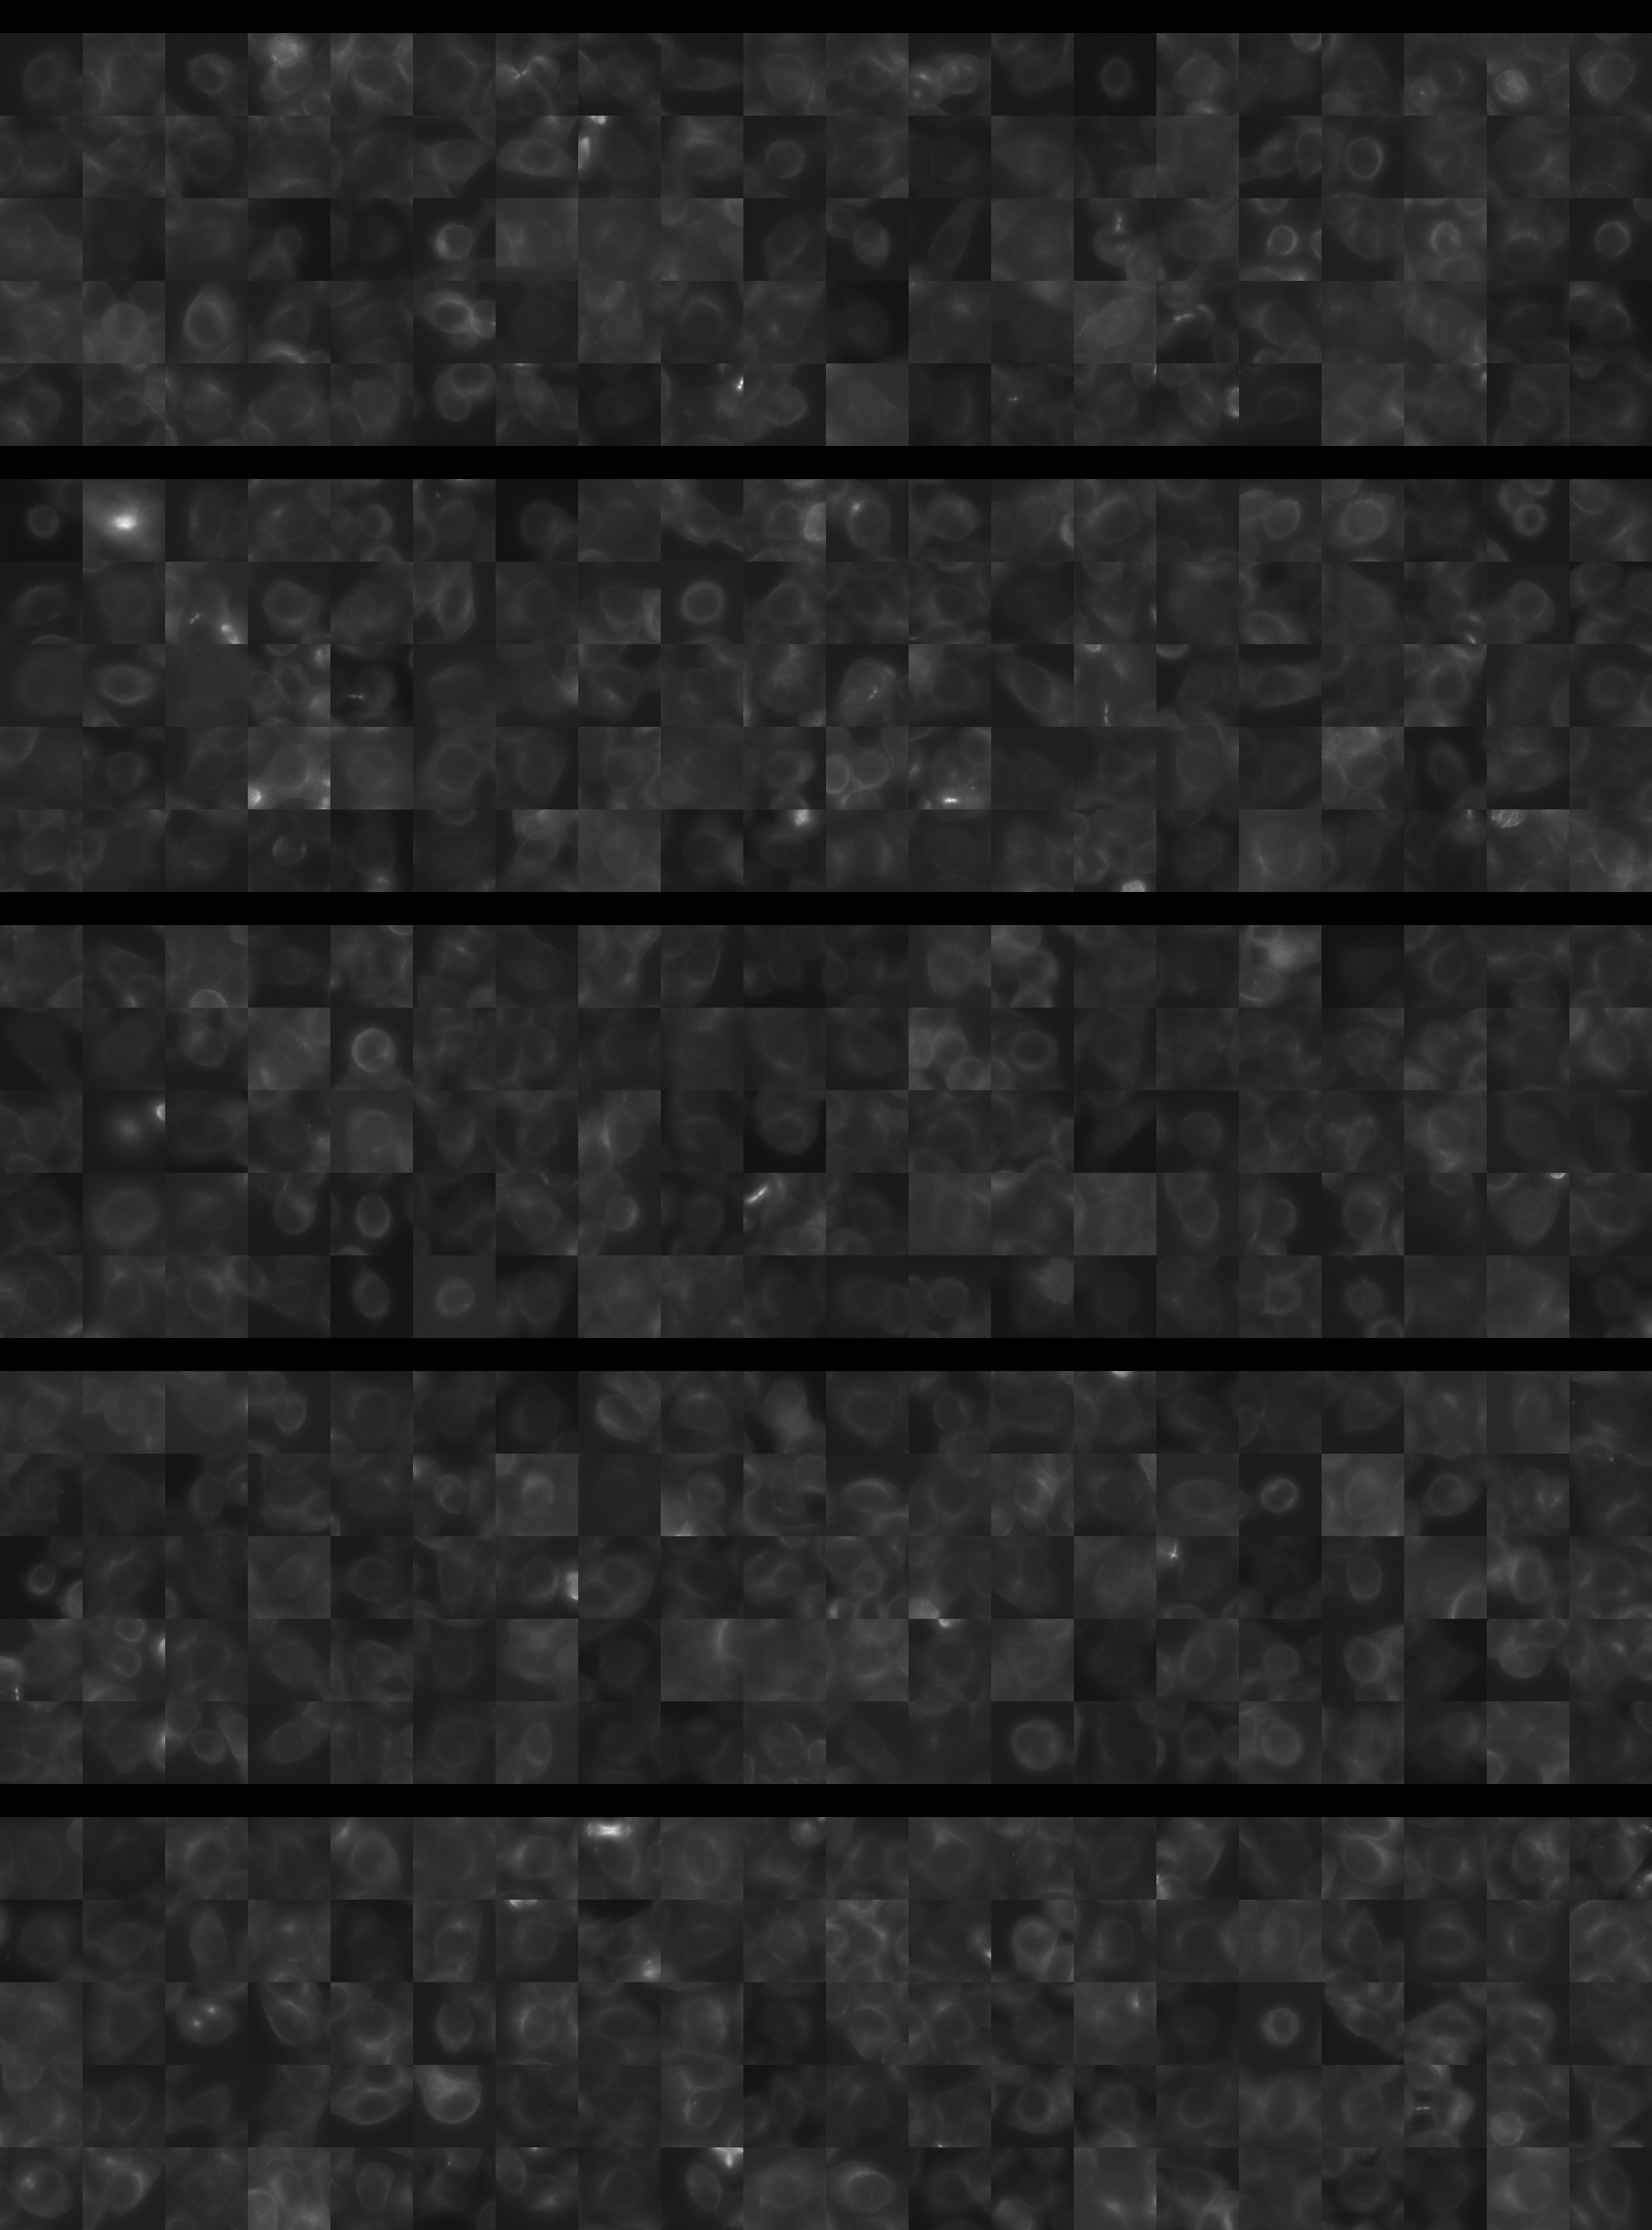
Each montage below shows randomly selected individual cell images for the same target gene separated by sgRNA, along with an example montage of cells expressing a non-targeting negative control sgRNA at the bottom. sgRNA labels in the montages correspond to the numbered sgRNA sequences in the gene info table above. The DNA (blue) and tubulin (green) channels are displayed by default, with gH2AX (grayscale) and actin (yellow) available using the check boxes. Channel brightness, contrast, and opacity are adjustable by clicking the arrow next to the channel name. When only one channel is selected, the display defaults to grayscale. Click the “Zoom” checkbox above the channel controls to enable image zooming (via scrolling) and panning (via click-and-drag).

The cell boxes displayed for this gene are square, 30.36 μm per side for the interphase montage and 30.36 μm per side for the mitotic montage.
Features

Interphase Score Rank FDR q-value
Nucleus DNA Integrated -4.898e-02 4859 of 5322 0.355
Nucleus DNA Mean 0.104 483 of 5322 0.009
Nucleus gH2AX Mean -1.040e-01 5220 of 5322 0.005
Nucleus DNA - gH2AX Correlation 0.102 173 of 5322 0.005
Nucleus Shape Area -1.489e-01 4964 of 5322 1.633e-04
Nucleus Shape Eccentricity 0.011 2741 of 5322 0.828
Nucleus Shape Form Factor -1.471e-01 4966 of 5322 7.309e-04
Nucleus Shape Solidity -2.566e-01 5250 of 5322 1.903e-04
Cell DNA Mass Displacement 0.038 1737 of 5322 0.565
Cell Tubulin Mean -5.971e-01 5320 of 5322 2.141e-04
Cell Tubulin Mass Displacement -3.111e-01 5318 of 5322 3.984e-04
Cell Actin Mean -1.682e-01 5164 of 5322 1.723e-04
Cell Tubulin - Actin Correlation 0.076 843 of 5322 0.074
Cell DNA - Tubulin Correlation 0.462 61 of 5322 1.948e-04
Cell Shape Area -2.689e-01 5103 of 5322 1.651e-04
Cell Shape Eccentricity -4.311e-02 5141 of 5322 0.568
Mitotic Score Rank FDR q-value
Nucleus DNA Integrated 0.480 152 of 5322 0.134
Nucleus DNA Mean 0.614 19 of 5322 0.304
Nucleus DNA Mass Displacement 0.231 546 of 5322 0.999
Nucleus DNA Mean Frac 3 -3.210e-01 5256 of 5322 1.000
Nucleus gH2AX Mean -3.565e-01 5238 of 5322 0.251
Nucleus gH2AX Mean Frac 0 0.358 62 of 5322 1.000
Nucleus Tubulin Mean Frac 0 0.317 279 of 5322 0.783
Nucleus Tubulin Mean Edge -1.351e+00 5319 of 5322 0.005
Nucleus Tubulin Std Edge -1.064e+00 5316 of 5322 0.002
Nucleus Shape Area 0.481 285 of 5322 0.073
Nucleus Shape Eccentricity -2.105e-01 4592 of 5322 1.000
Nucleus Shape Form Factor -6.713e-02 2368 of 5322 0.998
Cell Tubulin Mean -9.928e-01 5319 of 5322 0.004
Cell Tubulin Mean Frac 3 0.138 493 of 5322 0.999
Cell Actin Mean -2.694e-01 5184 of 5322 0.785
Cell Shape Area 0.246 997 of 5322 0.956
( Reset Zoom )
Brightness
Contrast
Opacity
Brightness
Contrast
Opacity
Brightness
Contrast
Opacity
Brightness
Contrast
Opacity
Brightness
Contrast
Opacity

( Reset Zoom )
Brightness
Contrast
Opacity
Brightness
Contrast
Opacity
Brightness
Contrast
Opacity
Brightness
Contrast
Opacity
Brightness
Contrast
Opacity

Day 3

Day 4

MIT Central Accessability