STUB1

Gene symbol: STUB1
Gene: 10273
Uniprot Function: E3 ubiquitin-protein ligase which targets misfolded chaperone substrates towards proteasomal degradation. Collaborates with ATXN3 in the degradation of misfolded chaperone substrates: ATXN3 restricting the length of ubiquitin chain attached to STUB1/CHIP substrates and preventing further chain extension. Ubiquitinates NOS1 in concert with Hsp70 and Hsp40. Modulates the activity of several chaperone complexes, including Hsp70, Hsc70 and Hsp90. Mediates transfer of non-canonical short ubiquitin chains to HSPA8 that have no effect on HSPA8 degradation. Mediates polyubiquitination of DNA polymerase beta (POLB) at 'Lys-41', 'Lys-61' and 'Lys-81', thereby playing a role in base-excision repair: catalyzes polyubiquitination by amplifying the HUWE1/ARF-BP1-dependent monoubiquitination and leading to POLB-degradation by the proteasome. Mediates polyubiquitination of CYP3A4. Ubiquitinates EPHA2 and may regulate the receptor stability and activity through proteasomal degradation. Acts as a co-chaperone for HSPA1A and HSPA1B chaperone proteins and promotes ubiquitin-mediated protein degradation (PubMed:27708256). Negatively regulates the suppressive function of regulatory T-cells (Treg) during inflammation by mediating the ubiquitination and degradation of FOXP3 in a HSPA1A/B-dependent manner (PubMed:23973223). Likely mediates polyubiquitination and downregulates plasma membrane expression of PD-L1/CD274, an immune inhibitory ligand critical for immune tolerance to self and antitumor immunity. Negatively regulates TGF-beta signaling by modulating the basal level of SMAD3 via ubiquitin-mediated degradation (PubMed:24613385). May regulate myosin assembly in striated muscles together with UBE4B and VCP/p97 by targeting myosin chaperone UNC45B for proteasomal degradation (PubMed:17369820). Mediates ubiquitination of RIPK3 leading to its subsequent proteasome-dependent degradation (PubMed:29883609).
Mitotic Index 0.0233
Interphase Cluster: #89 (25 genes)
Mitotic Cluster: #78 (26 genes)
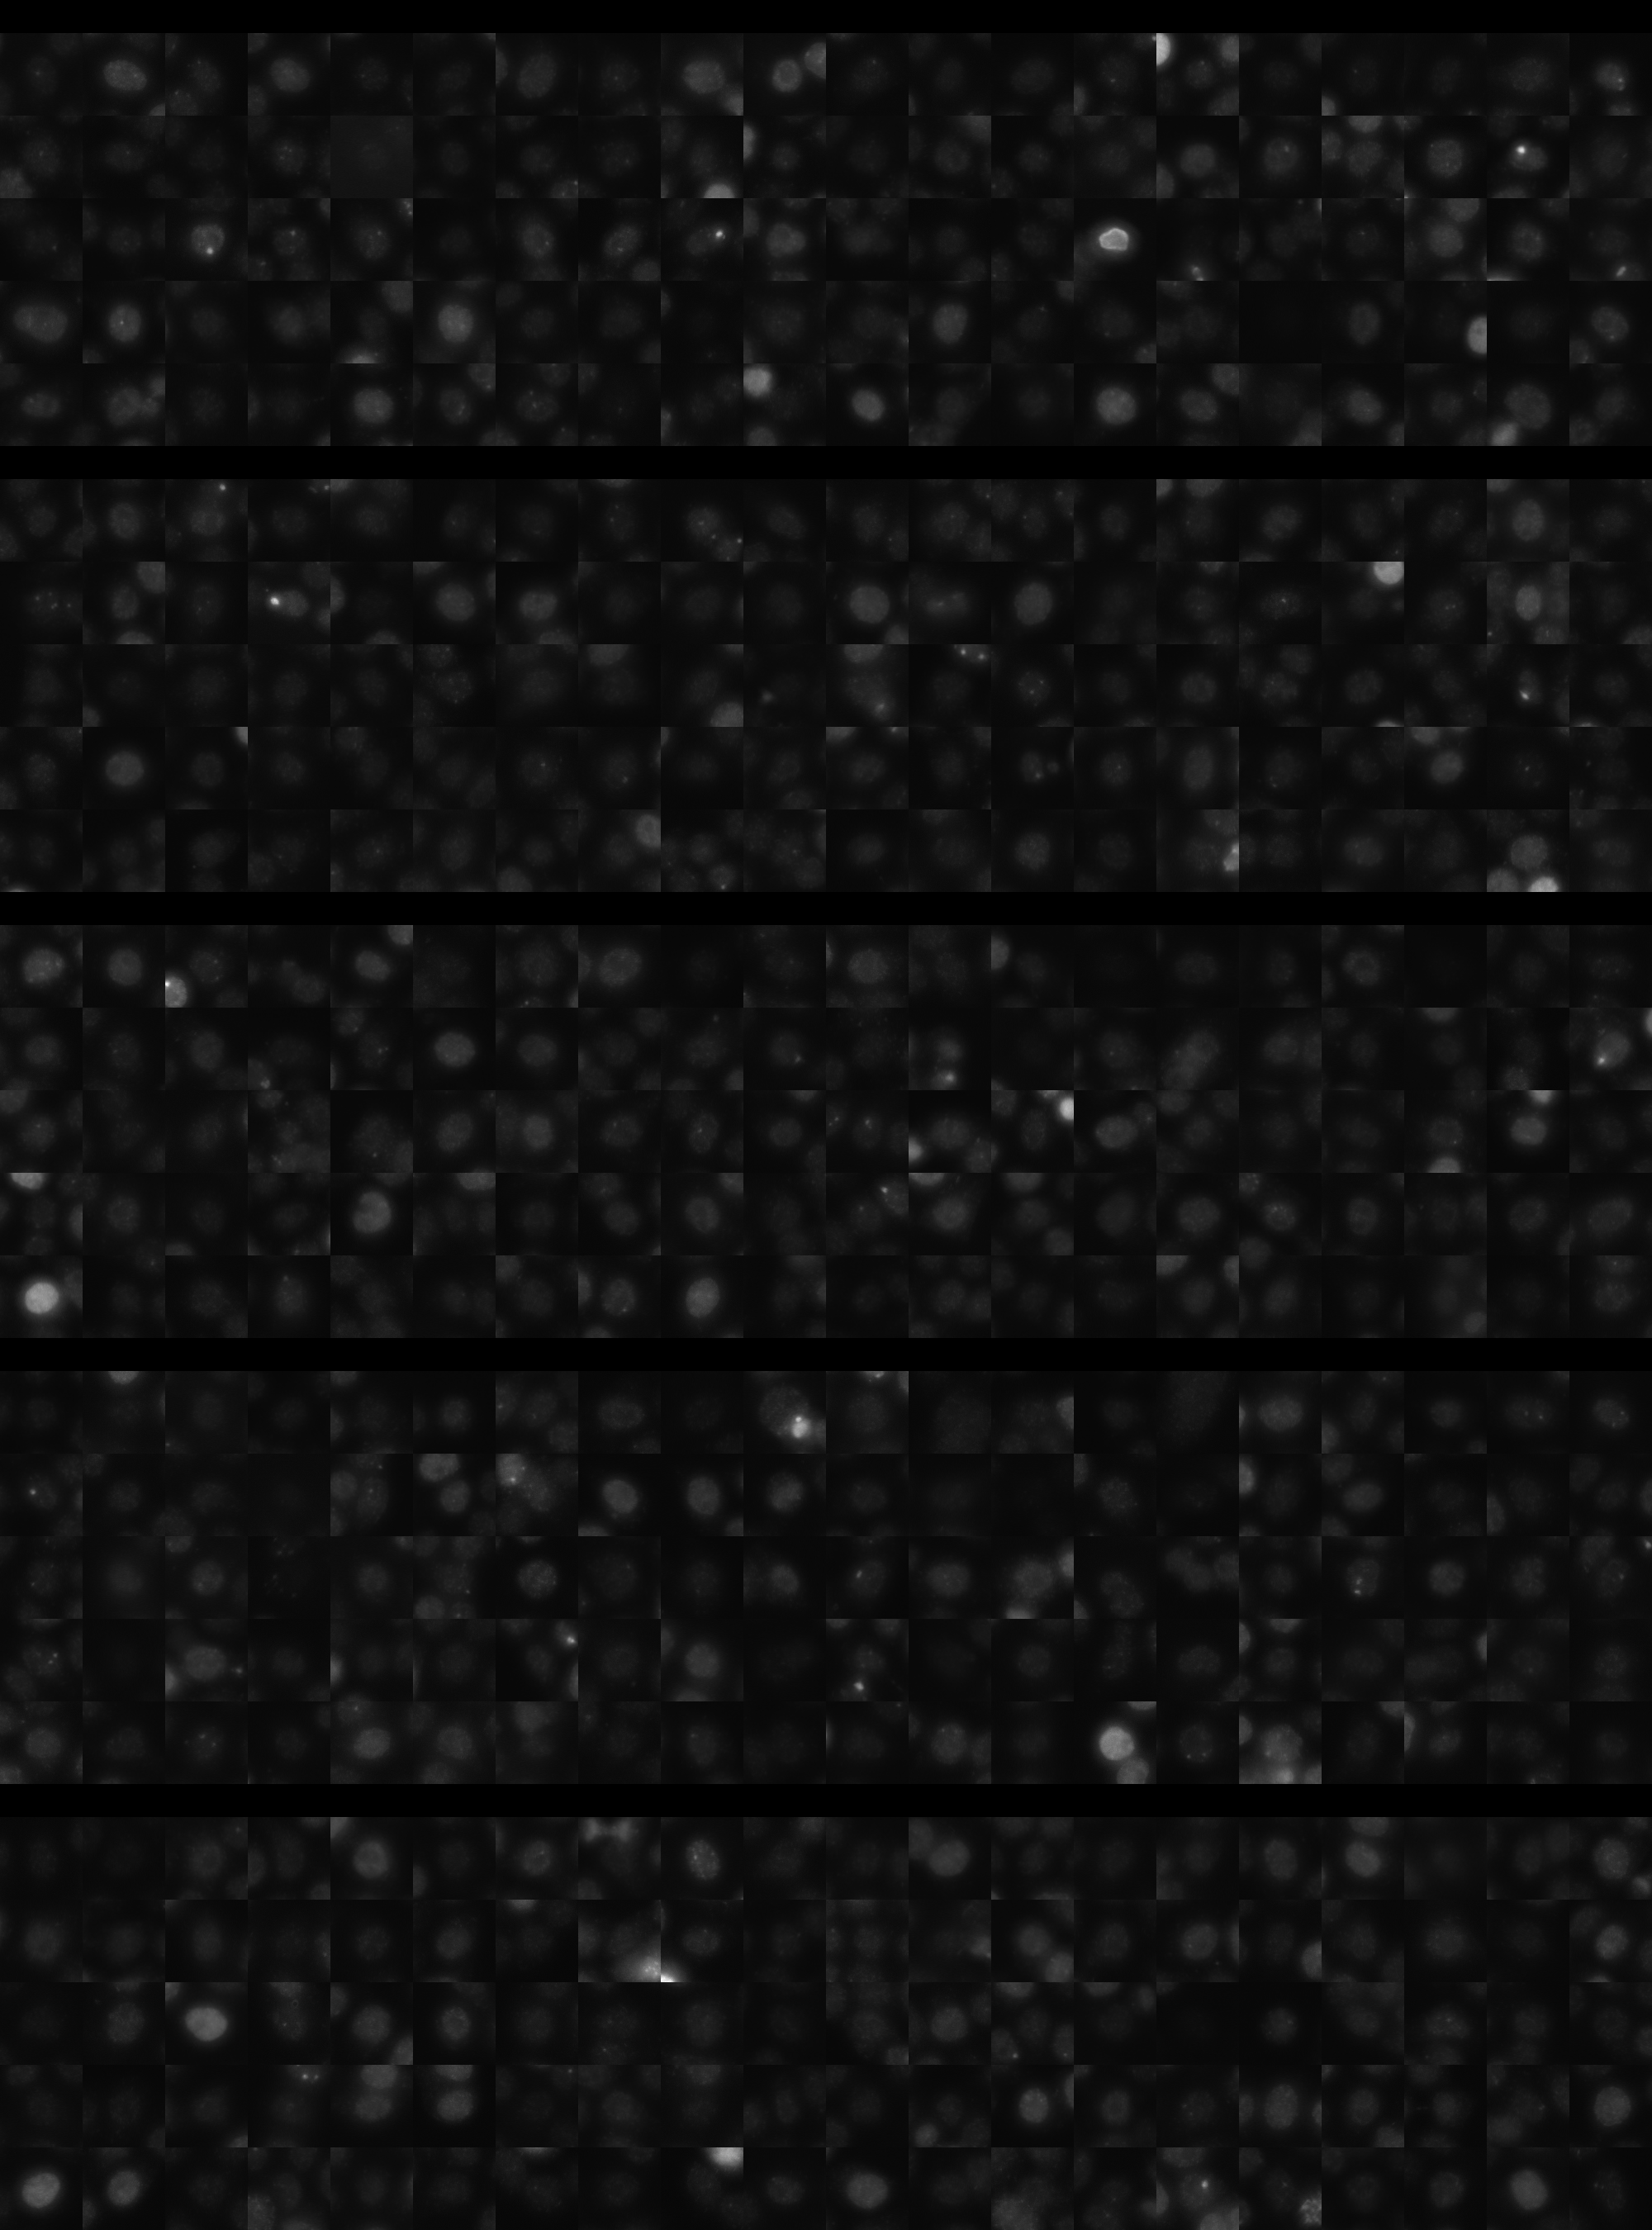
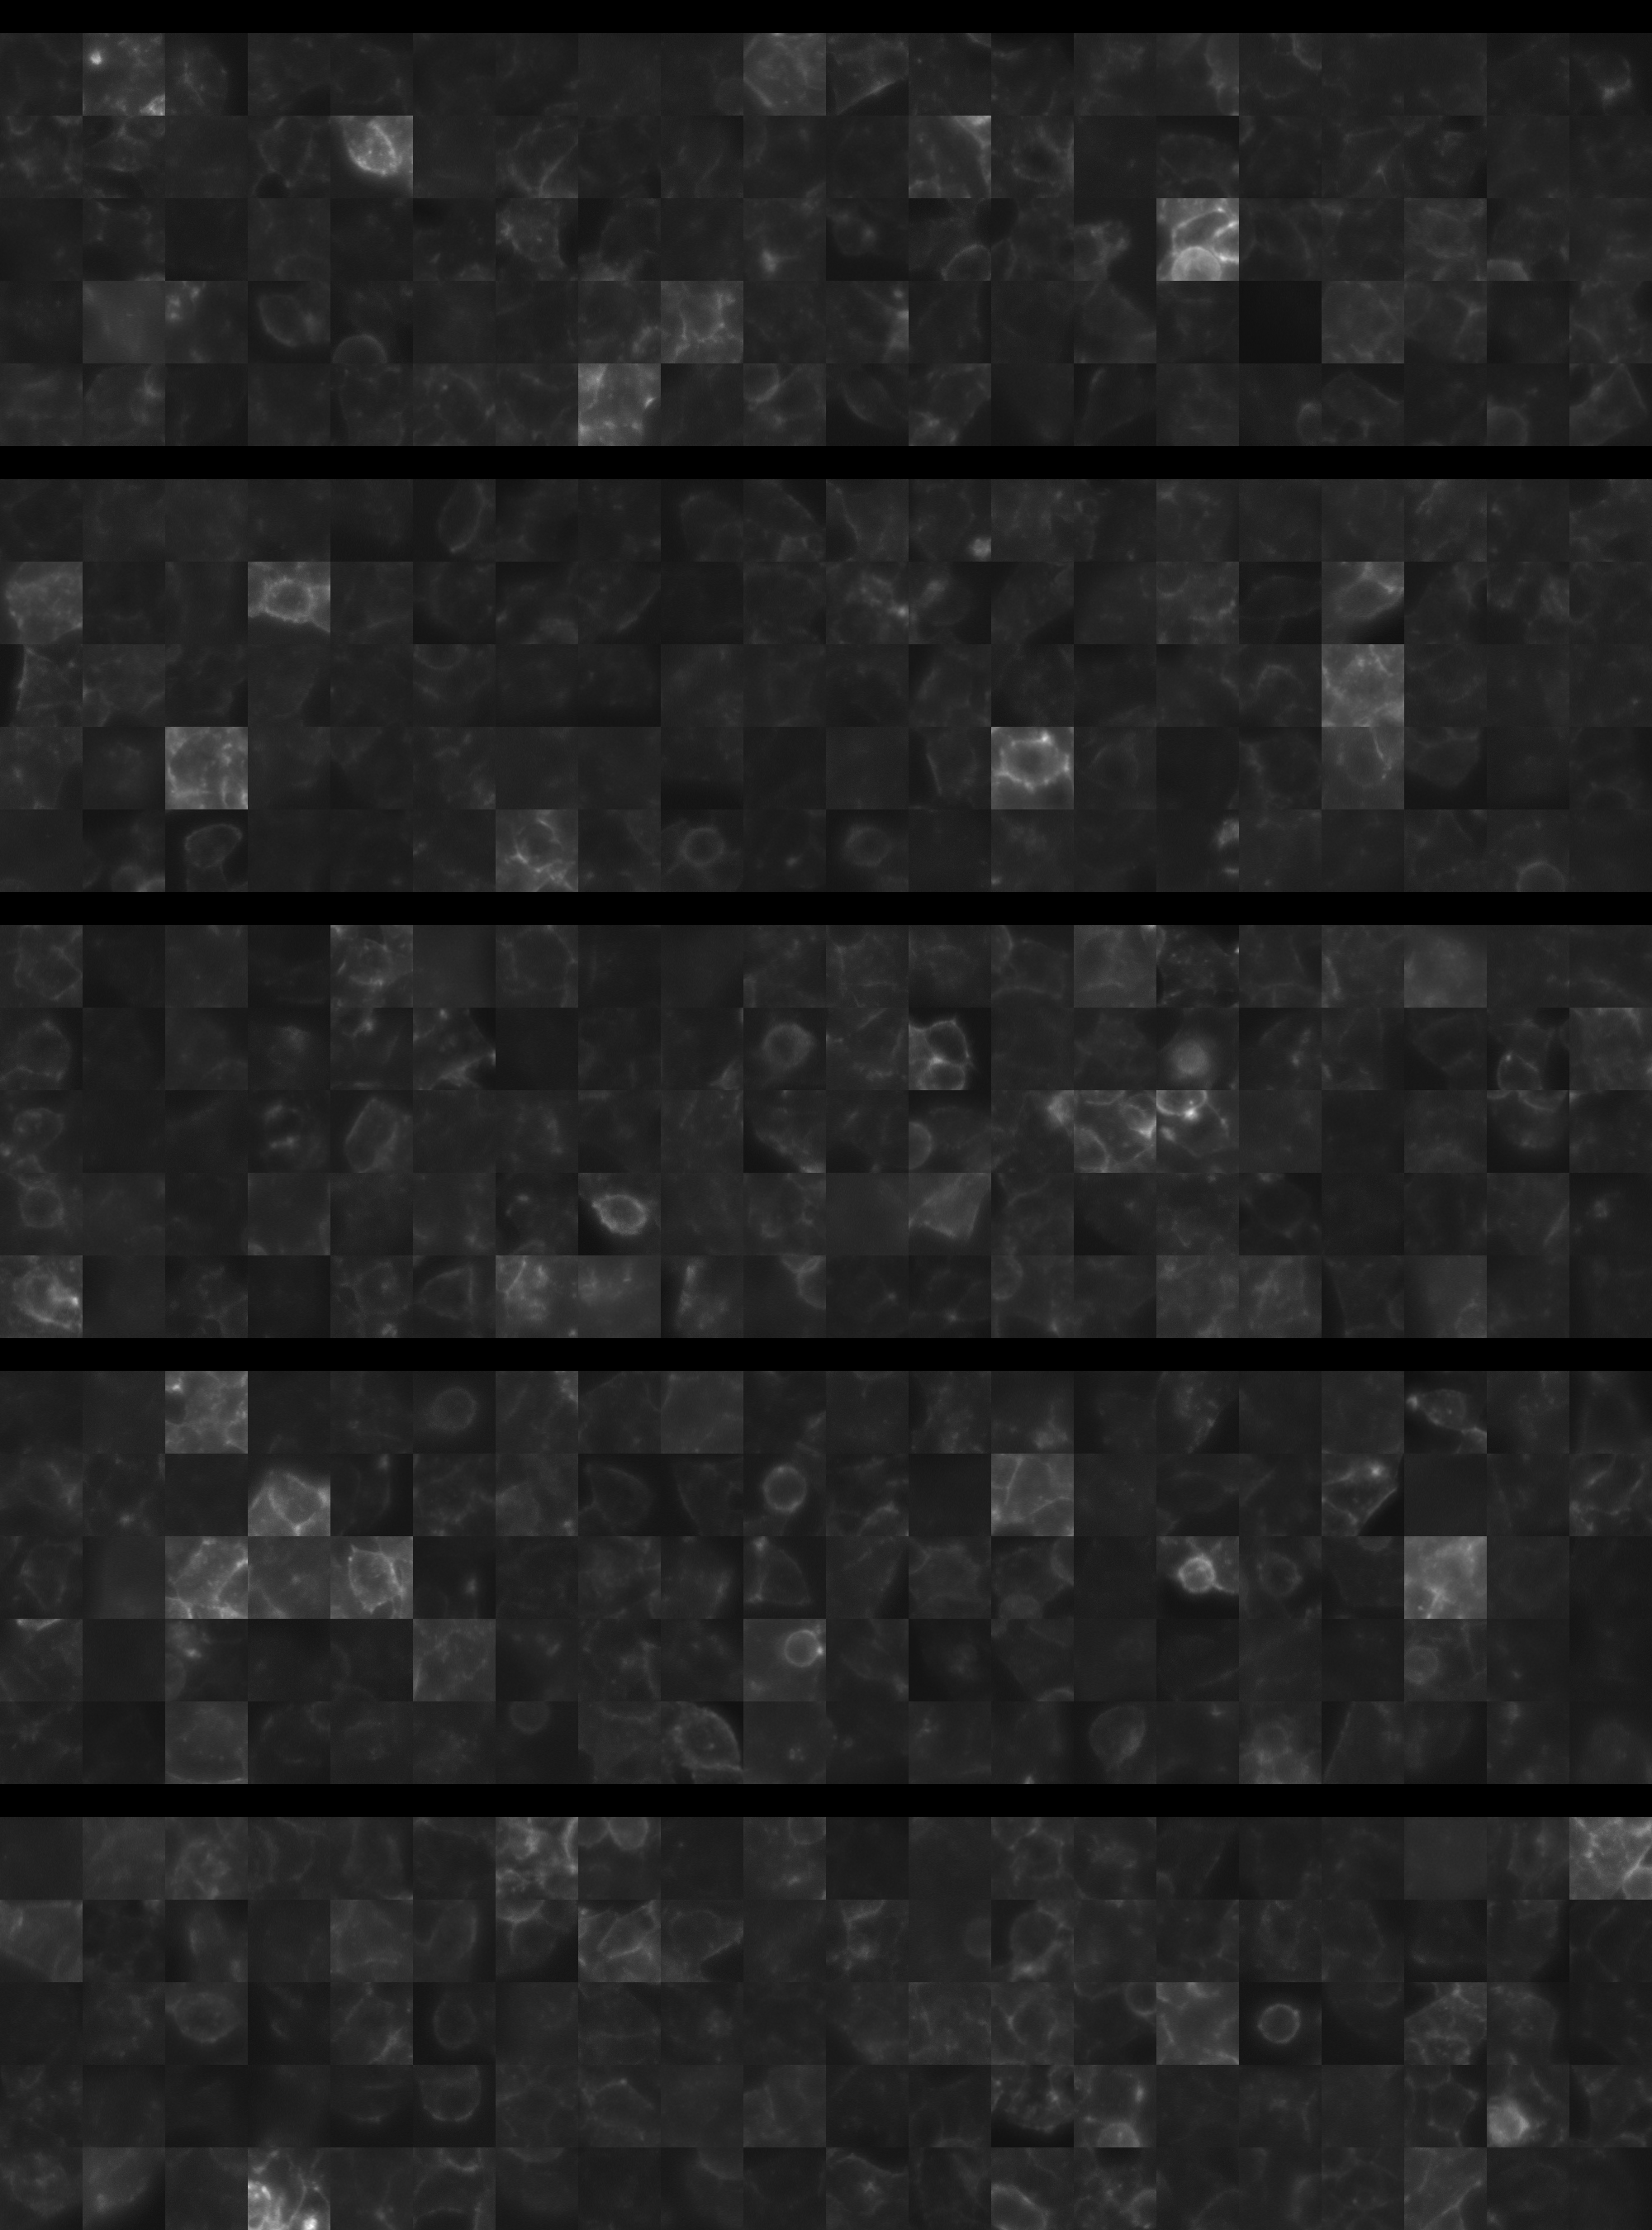
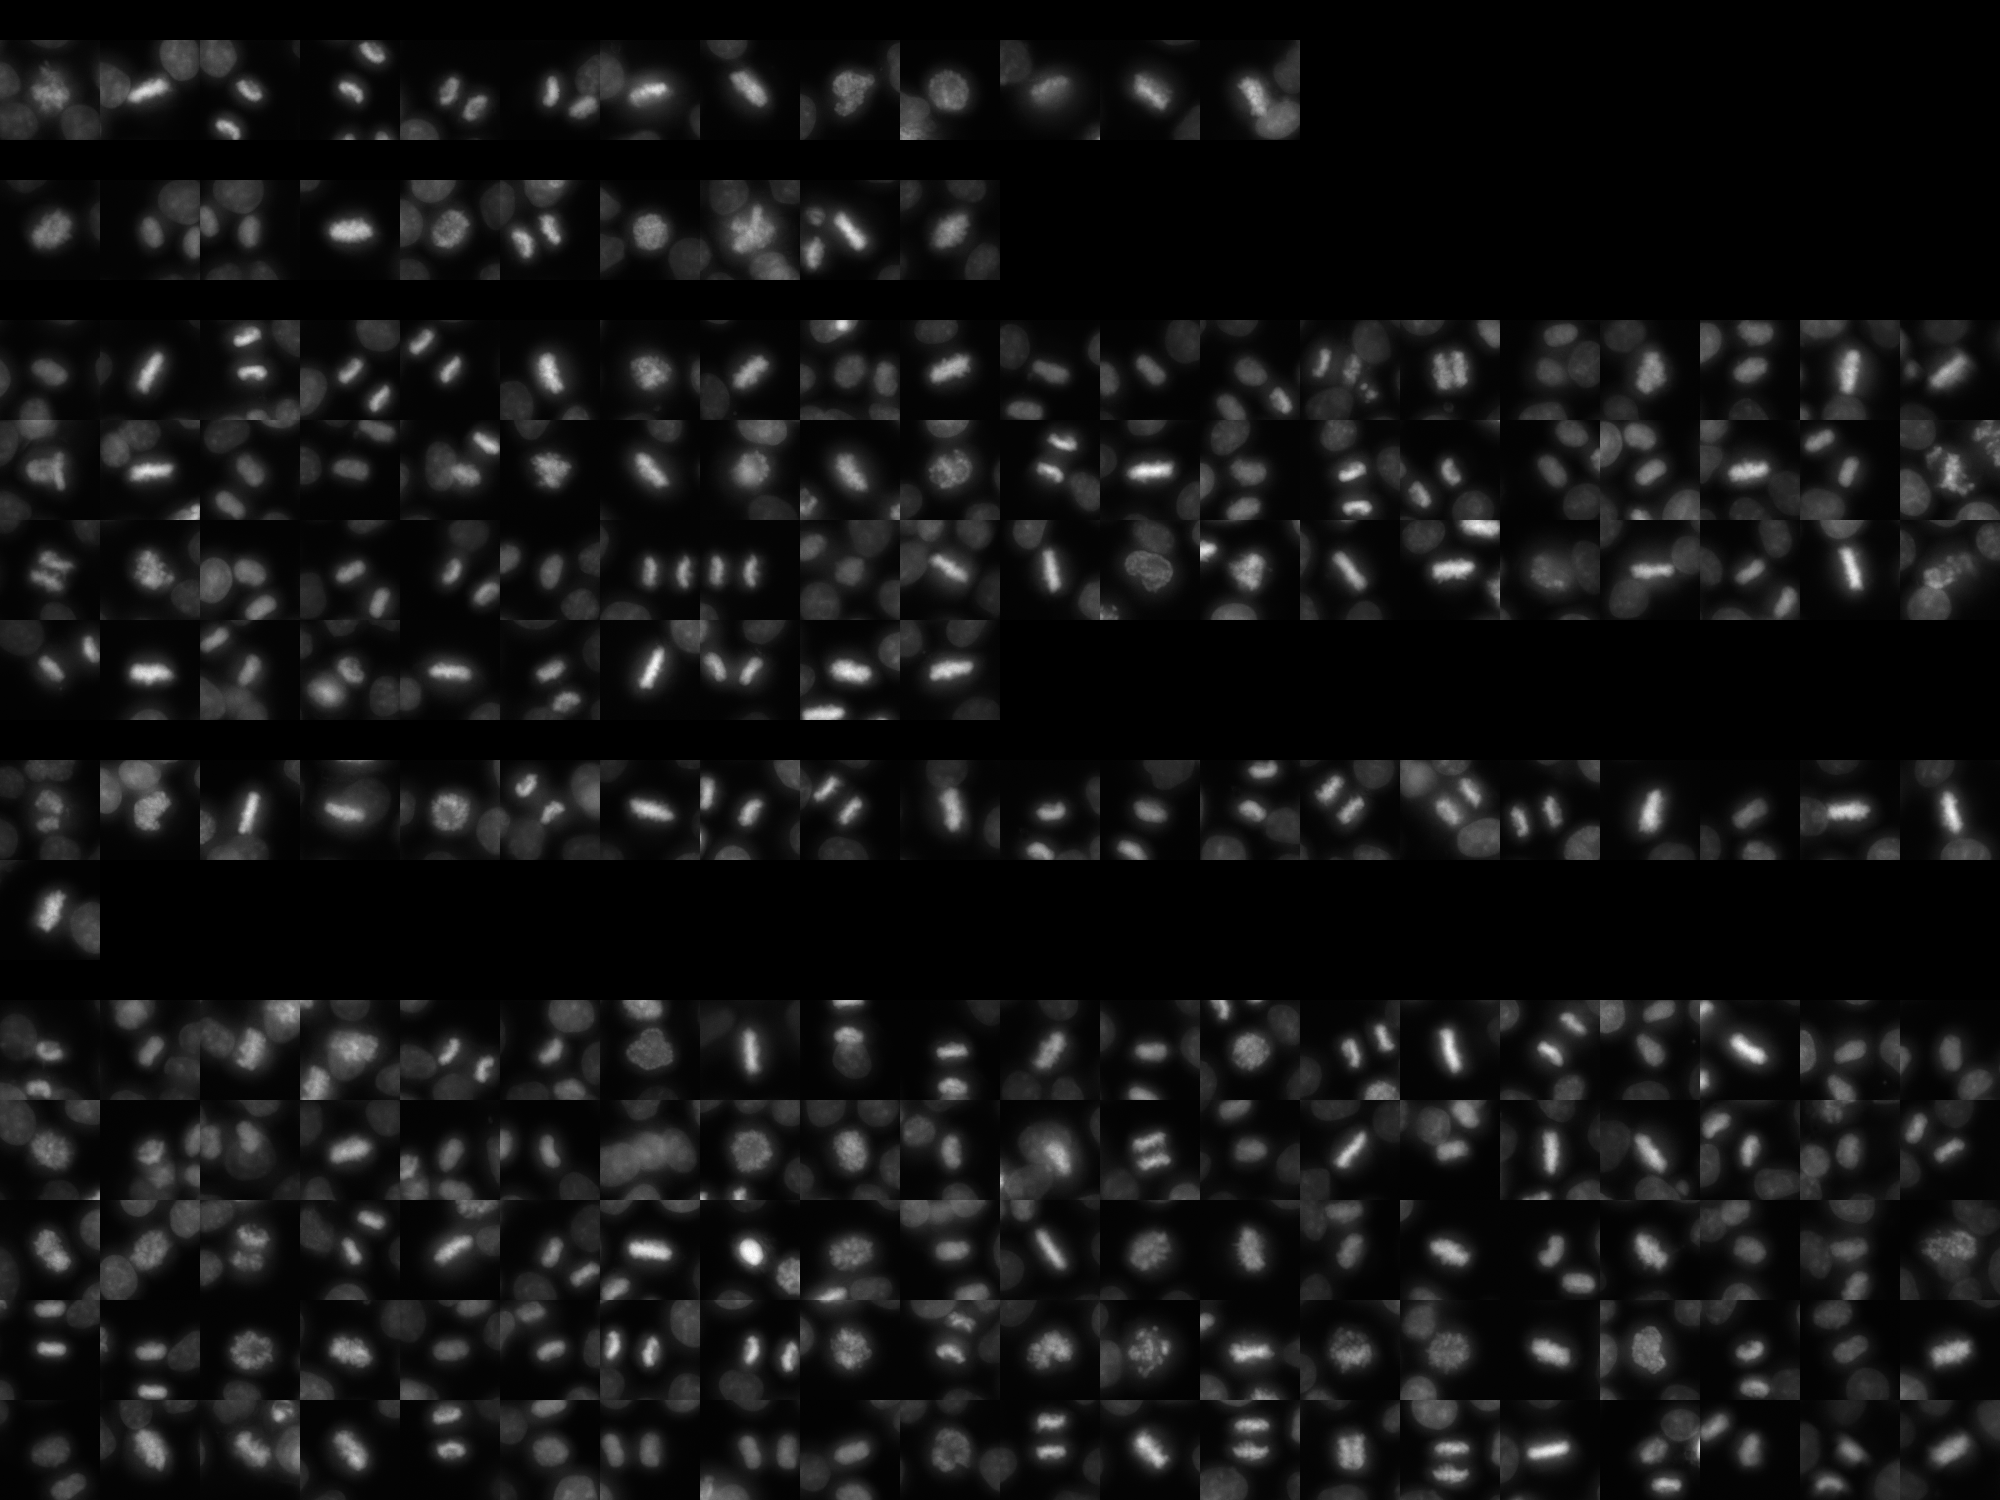
sgRNA 1: CCGAAAGTACCCGGAGGCGG (interphase cells: 911, mitotic cells: 13)
sgRNA 2: CGAGAAGAGCCCGAGCGCGC (interphase cells: 473, mitotic cells: 10)
sgRNA 3: GTCCCACCTCTCACGCTCCG (interphase cells: 2398, mitotic cells: 70)
sgRNA 4: TCGCGATTCGAAGAGCGCTG (interphase cells: 989, mitotic cells: 21)

Interphase Cluster

Mitotic Cluster

Overview

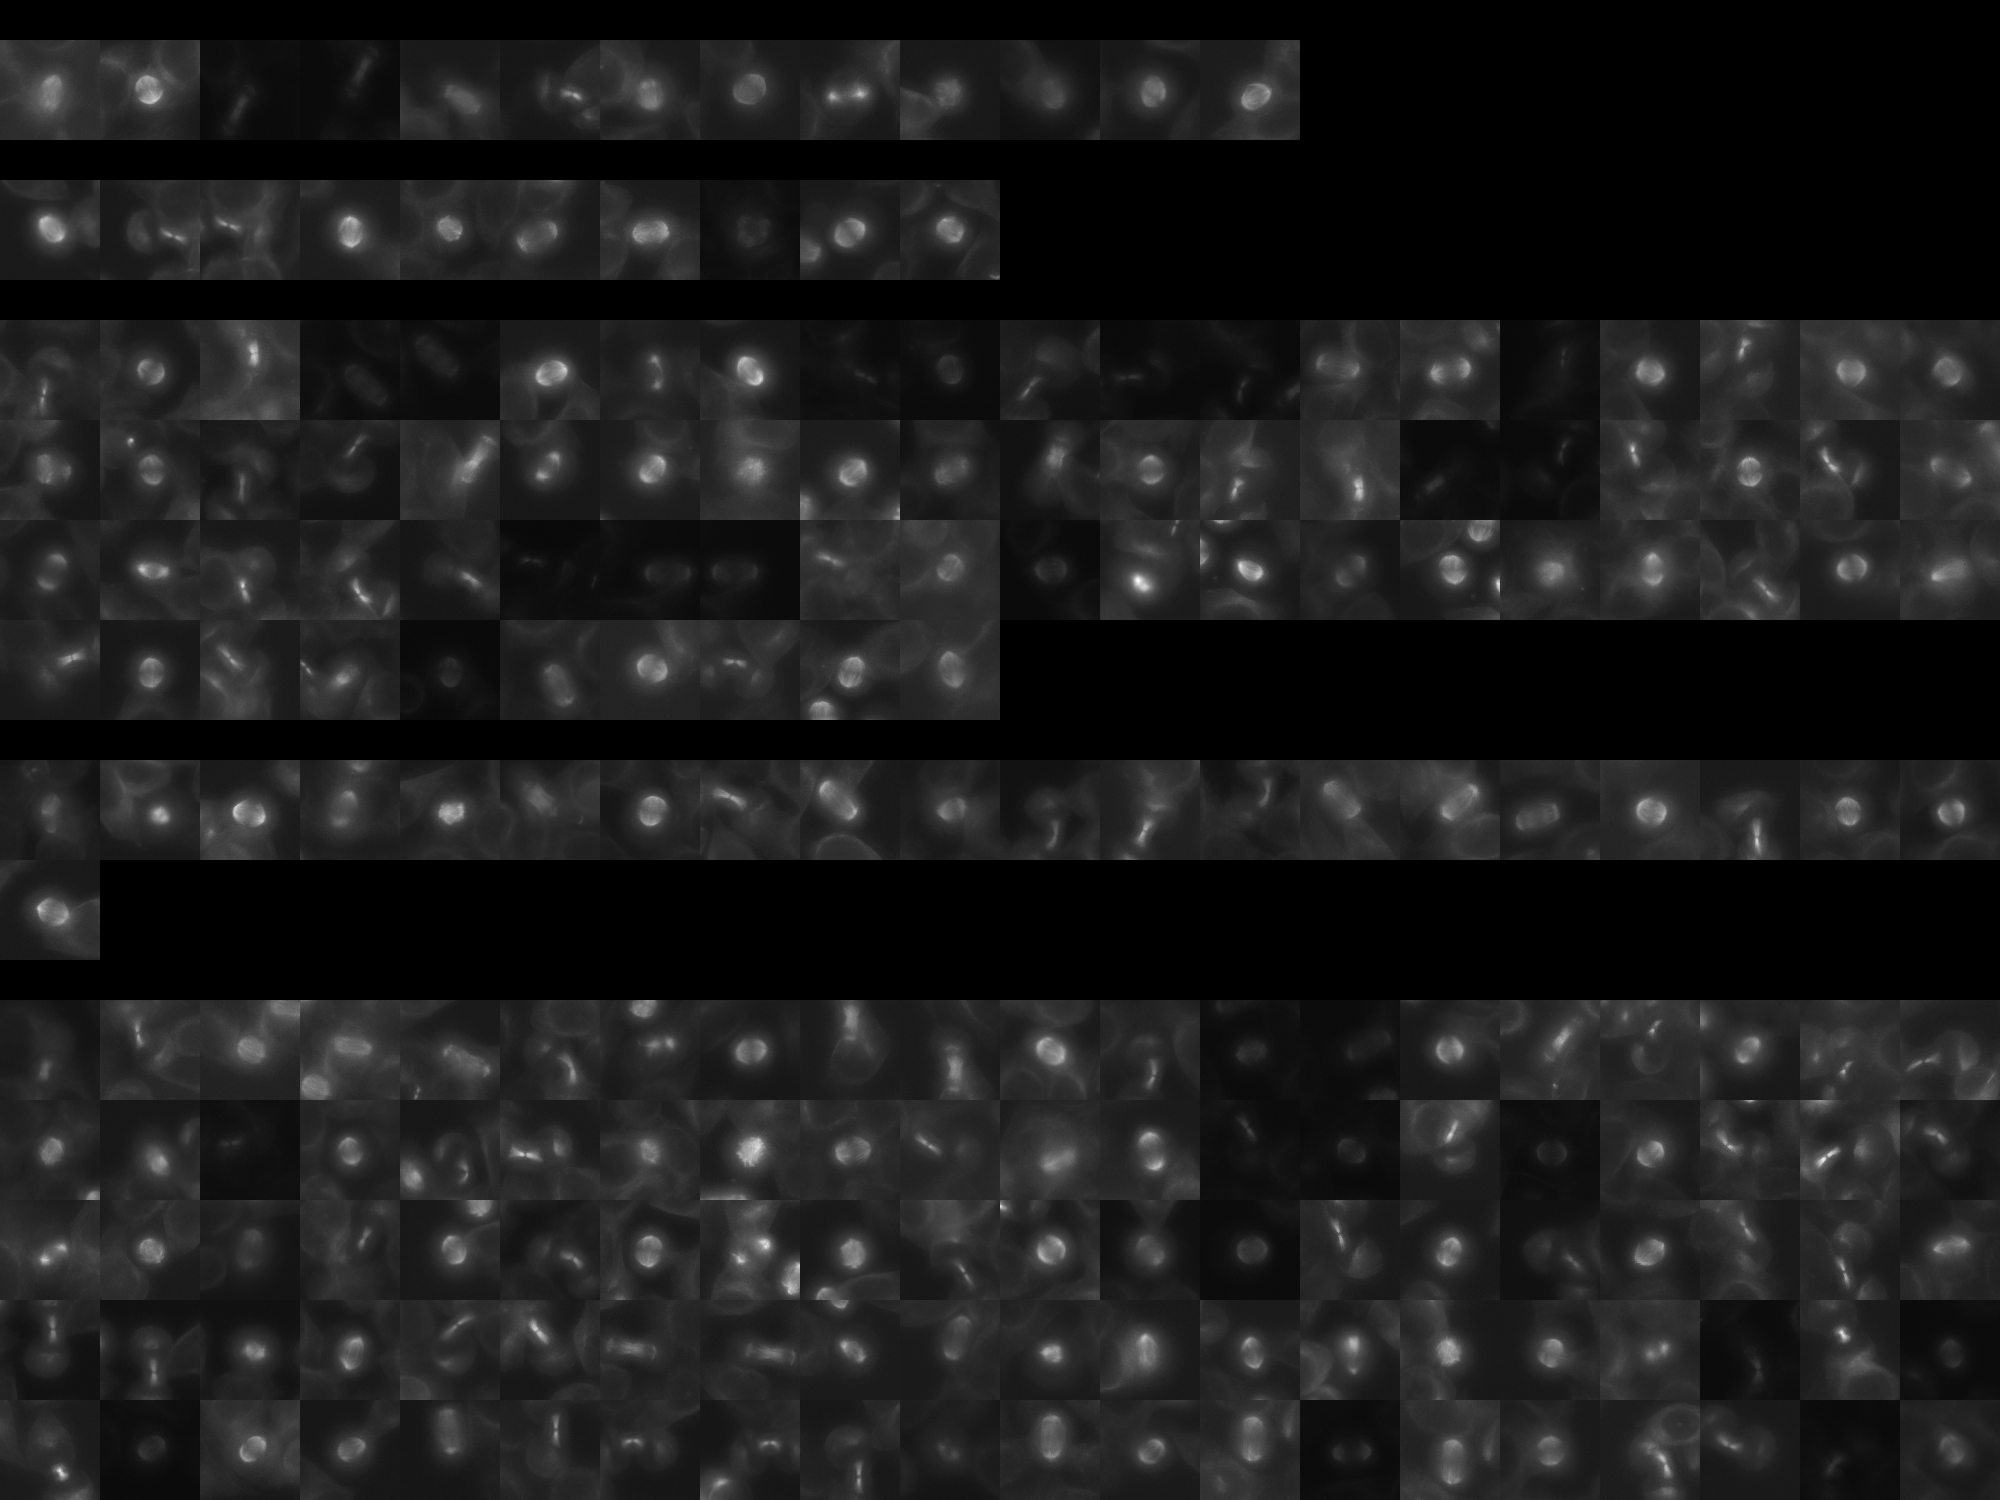
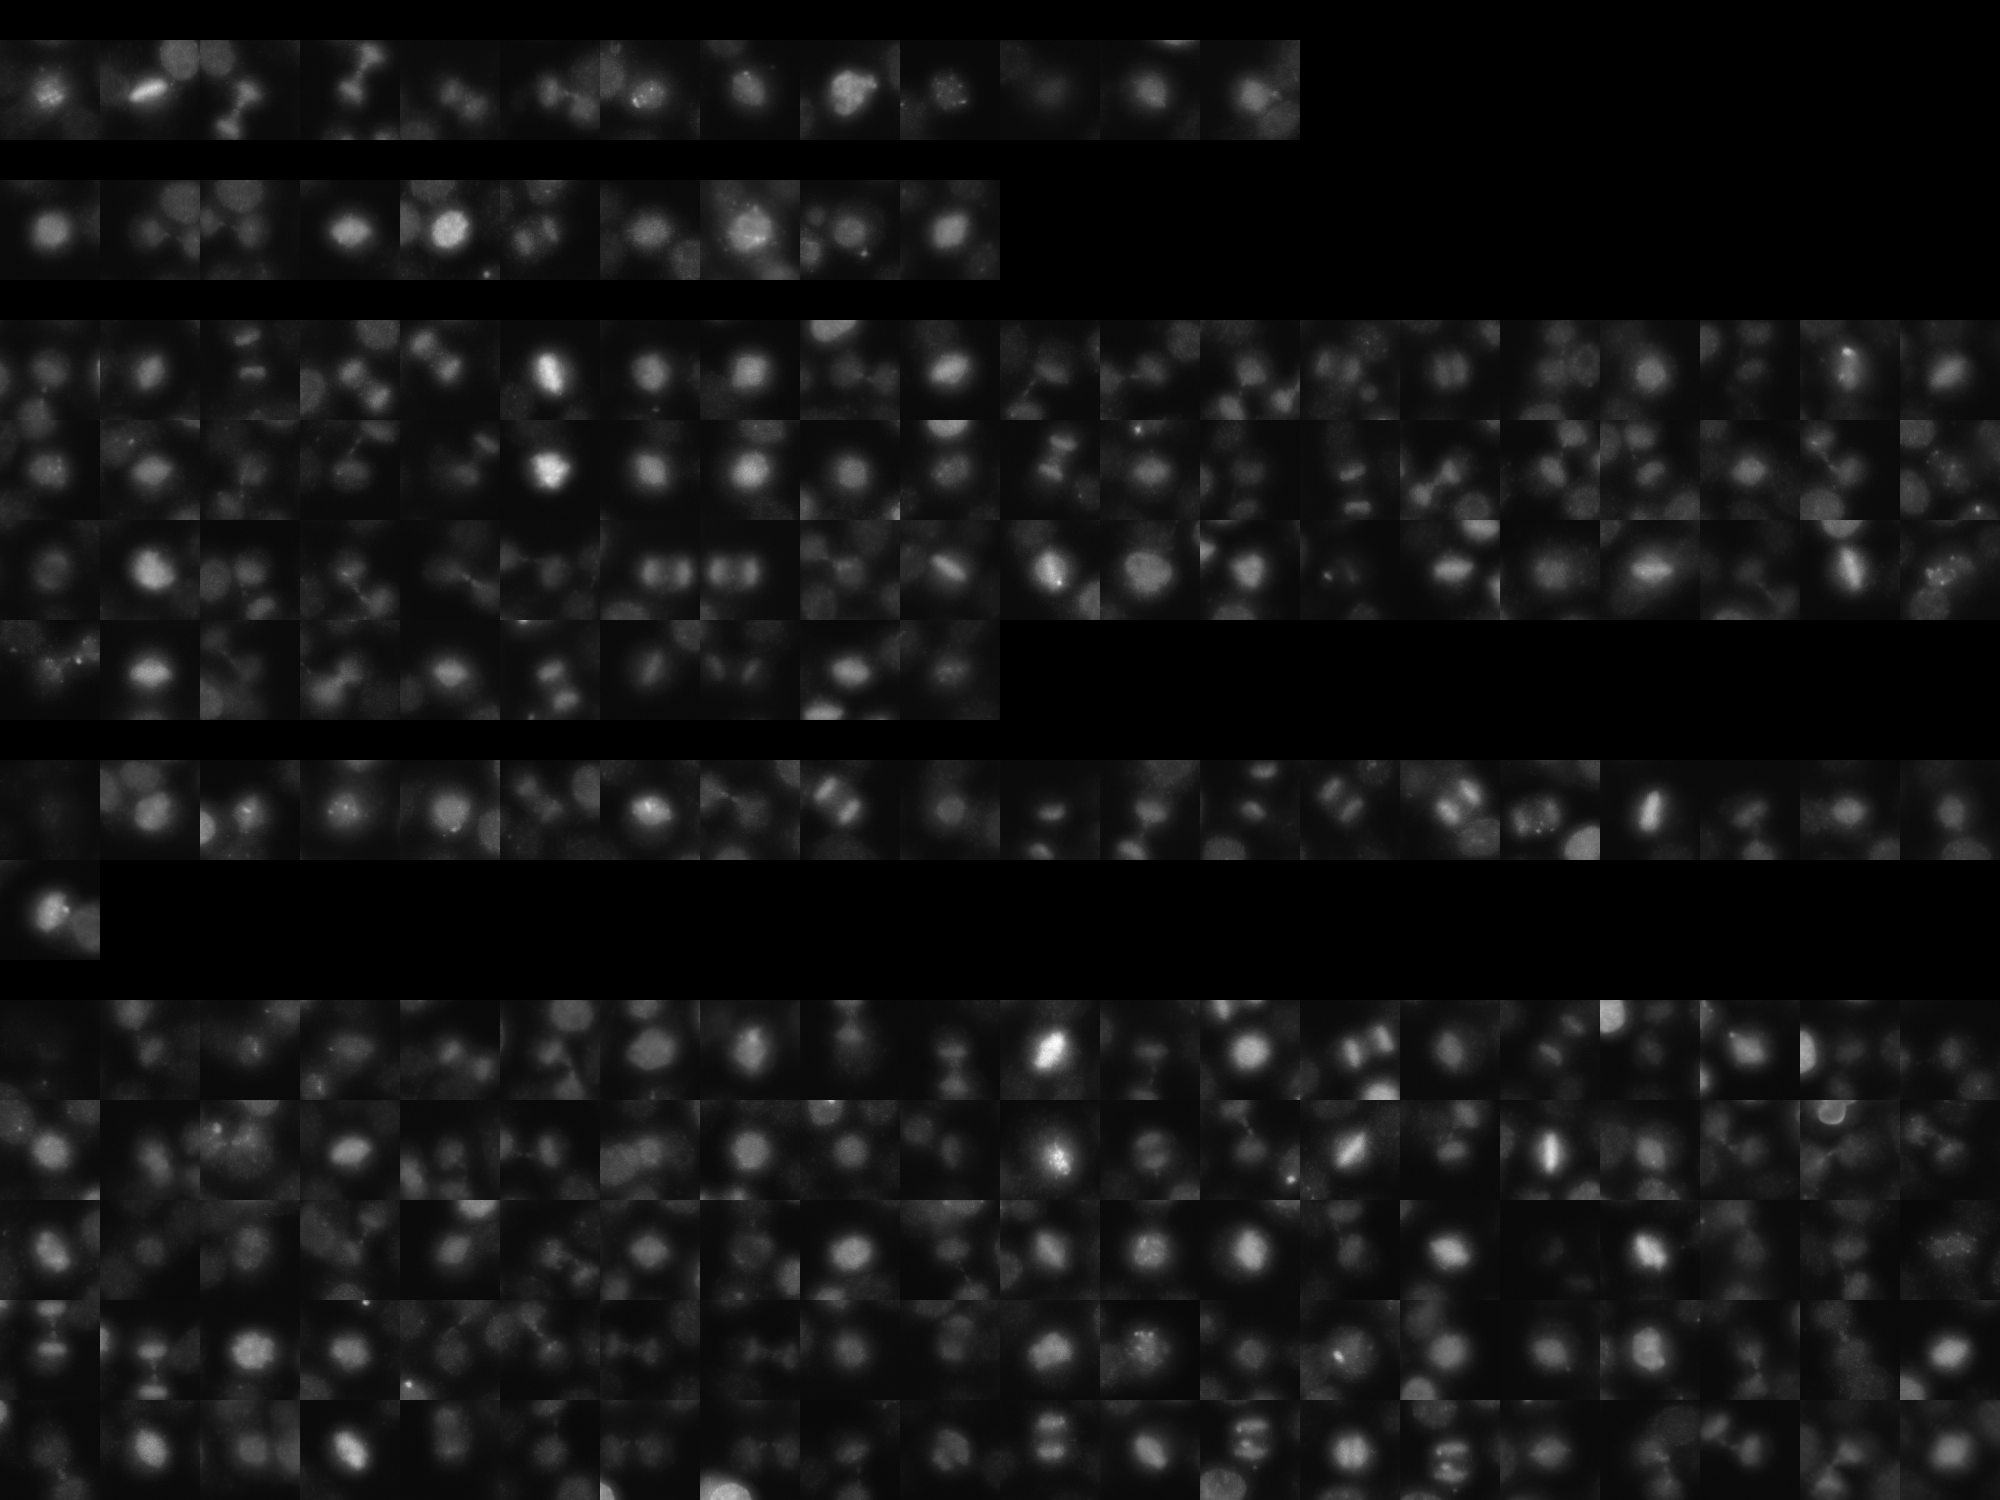
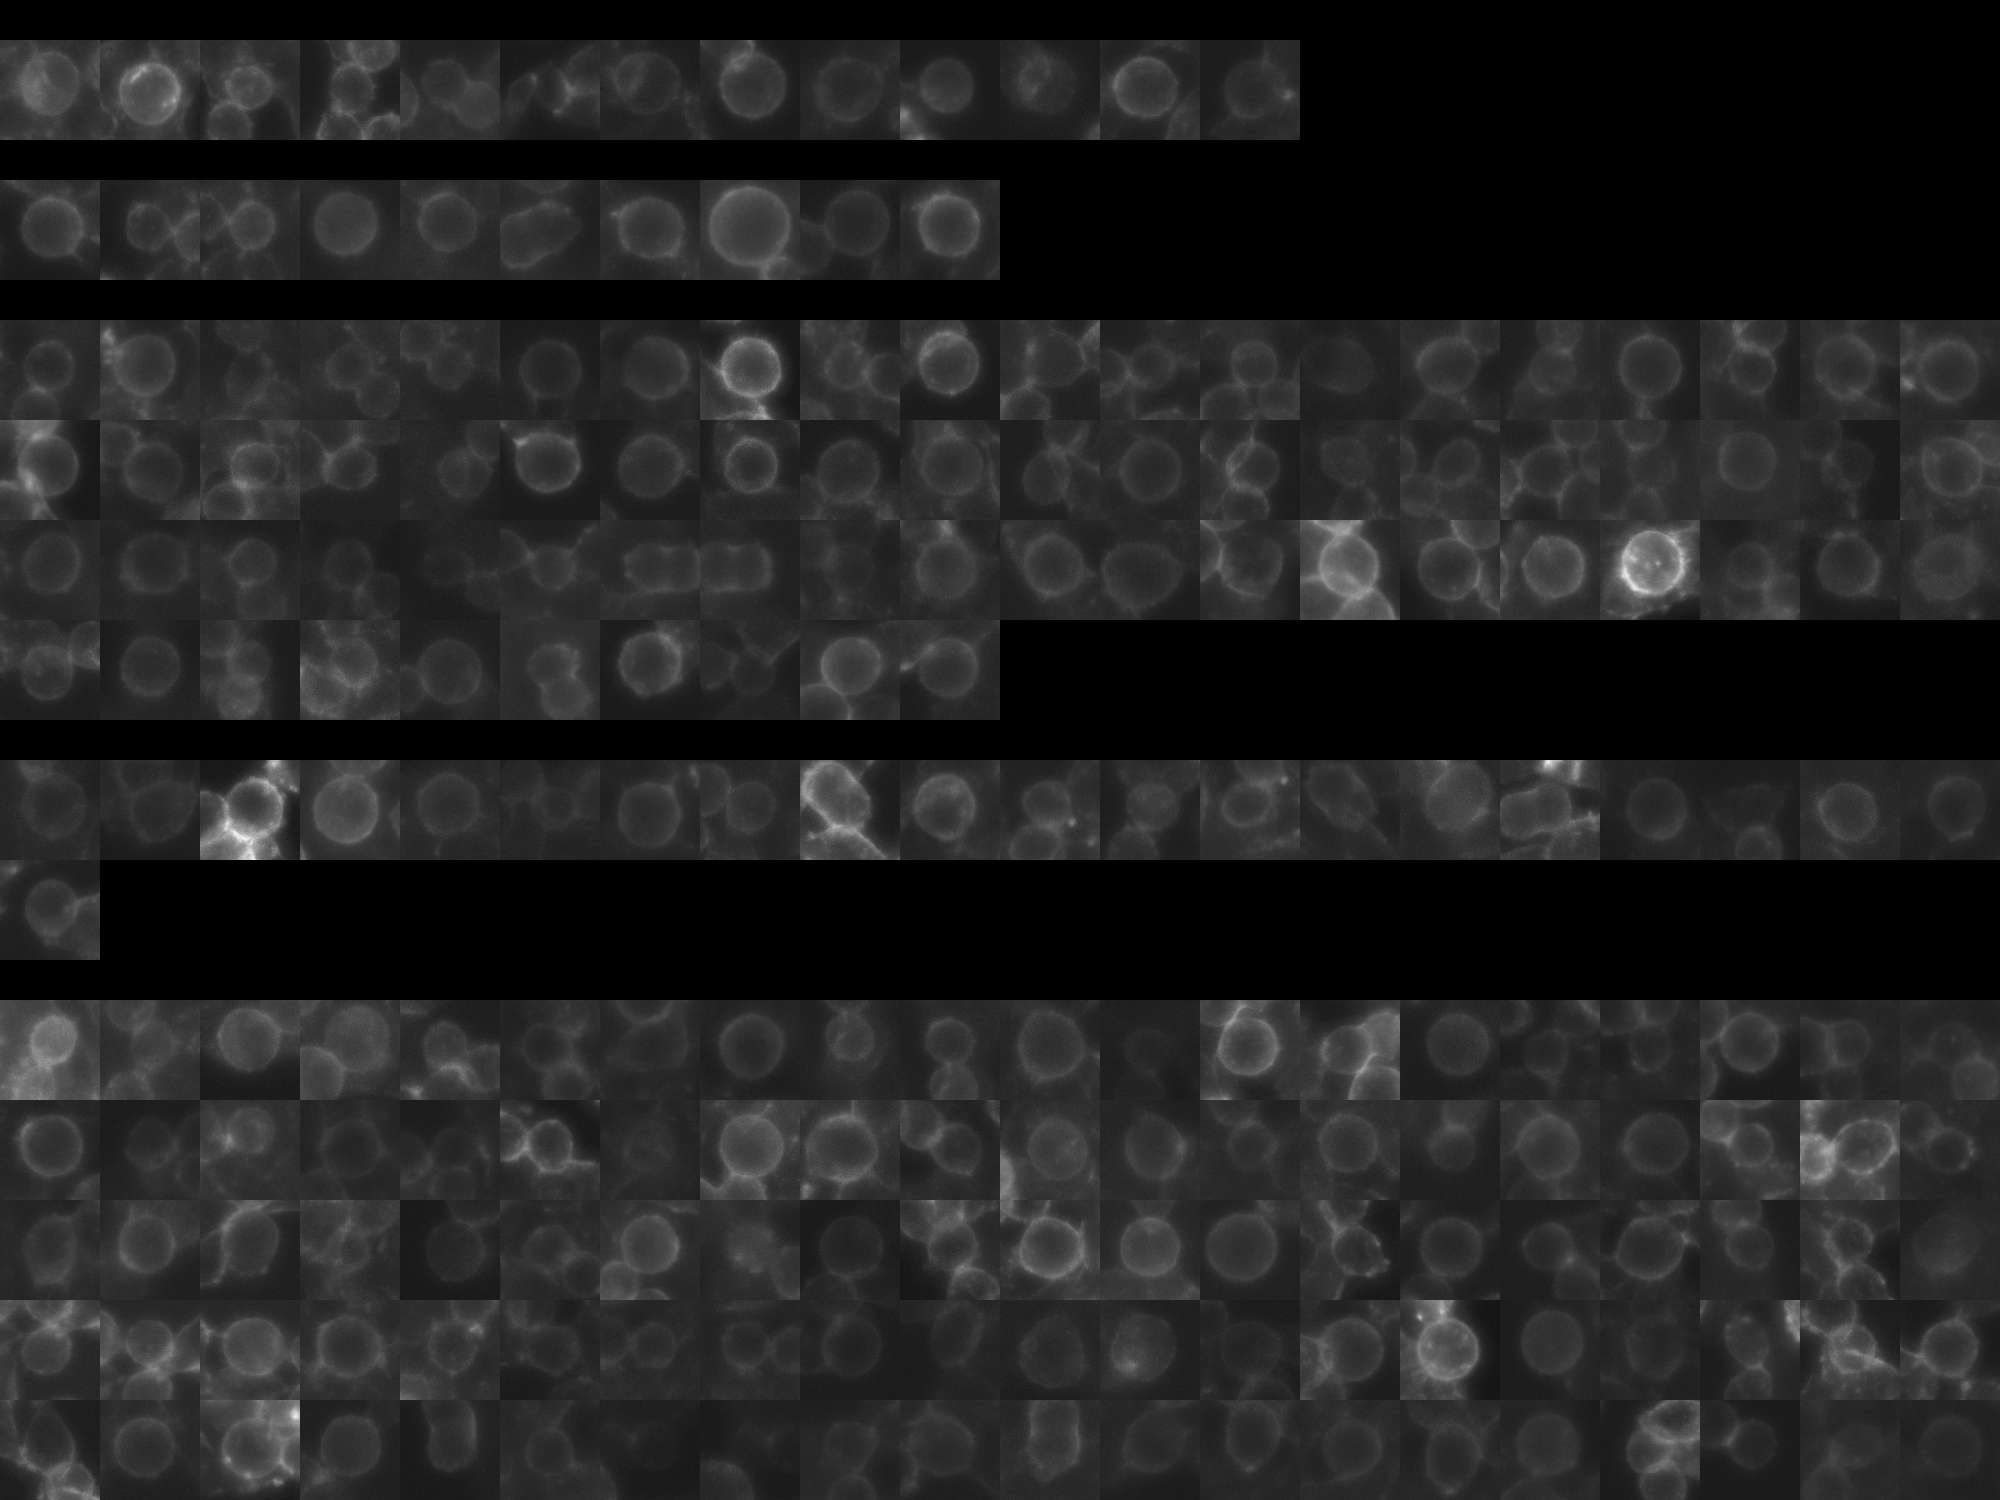
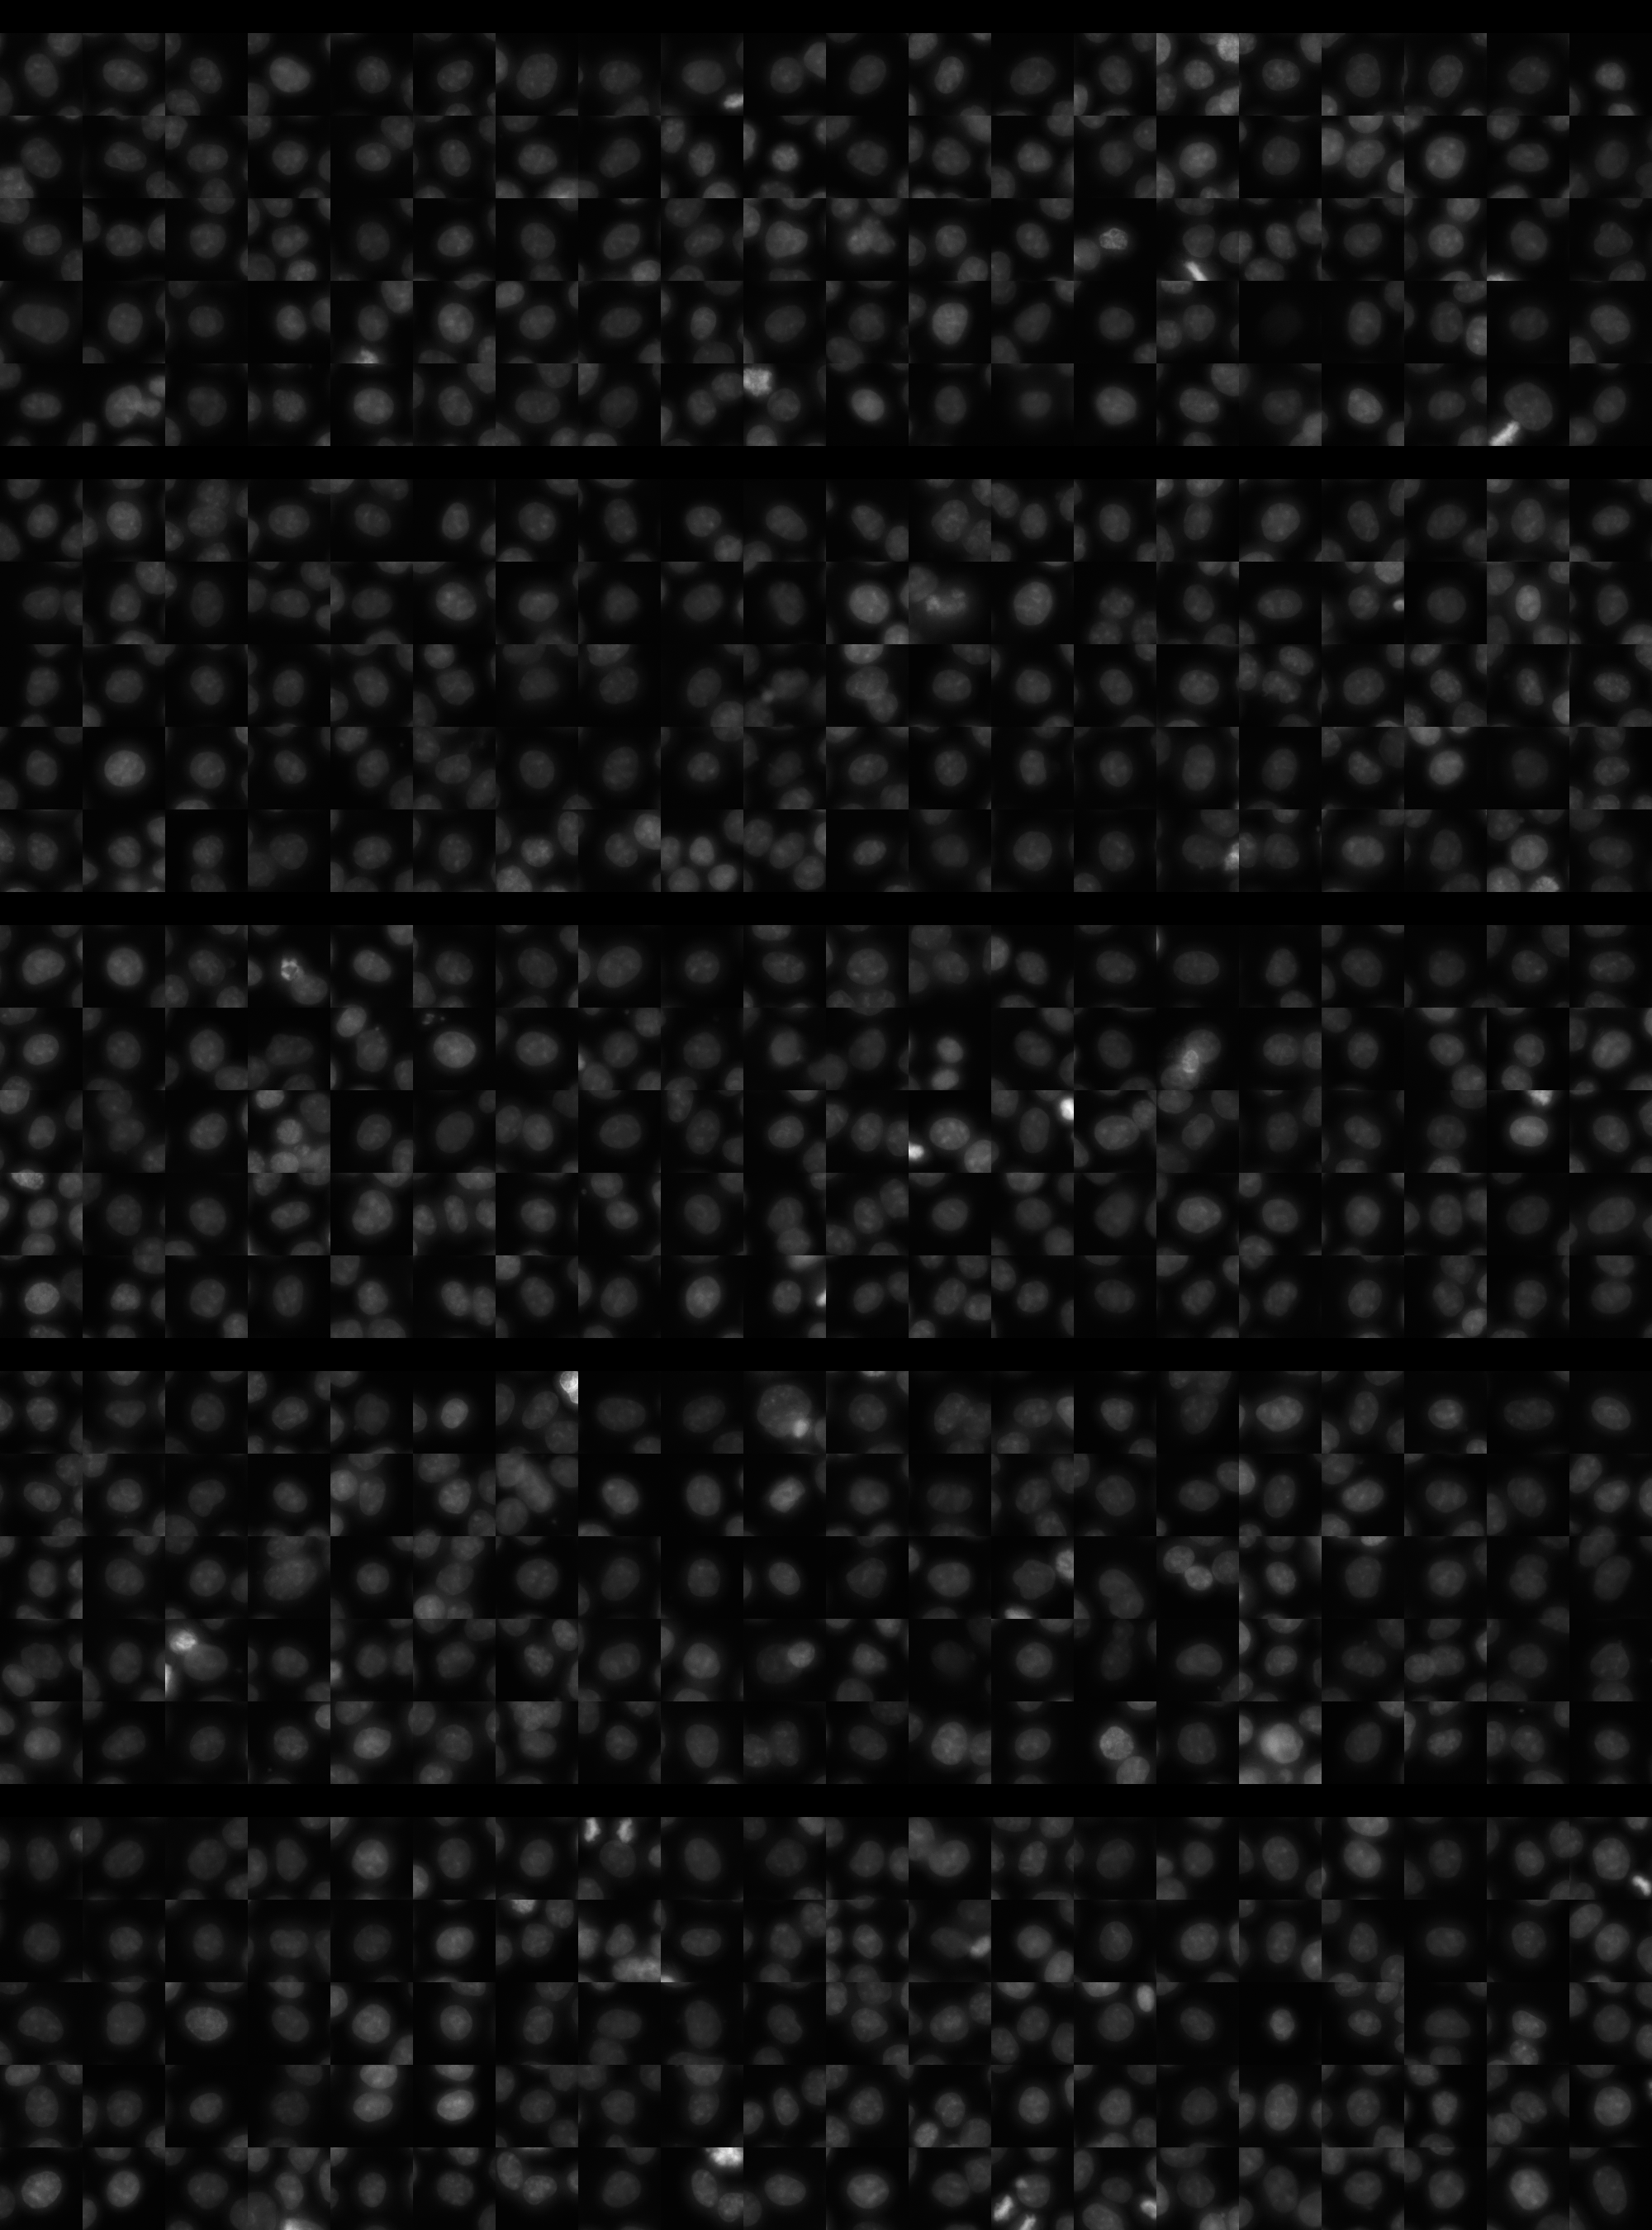
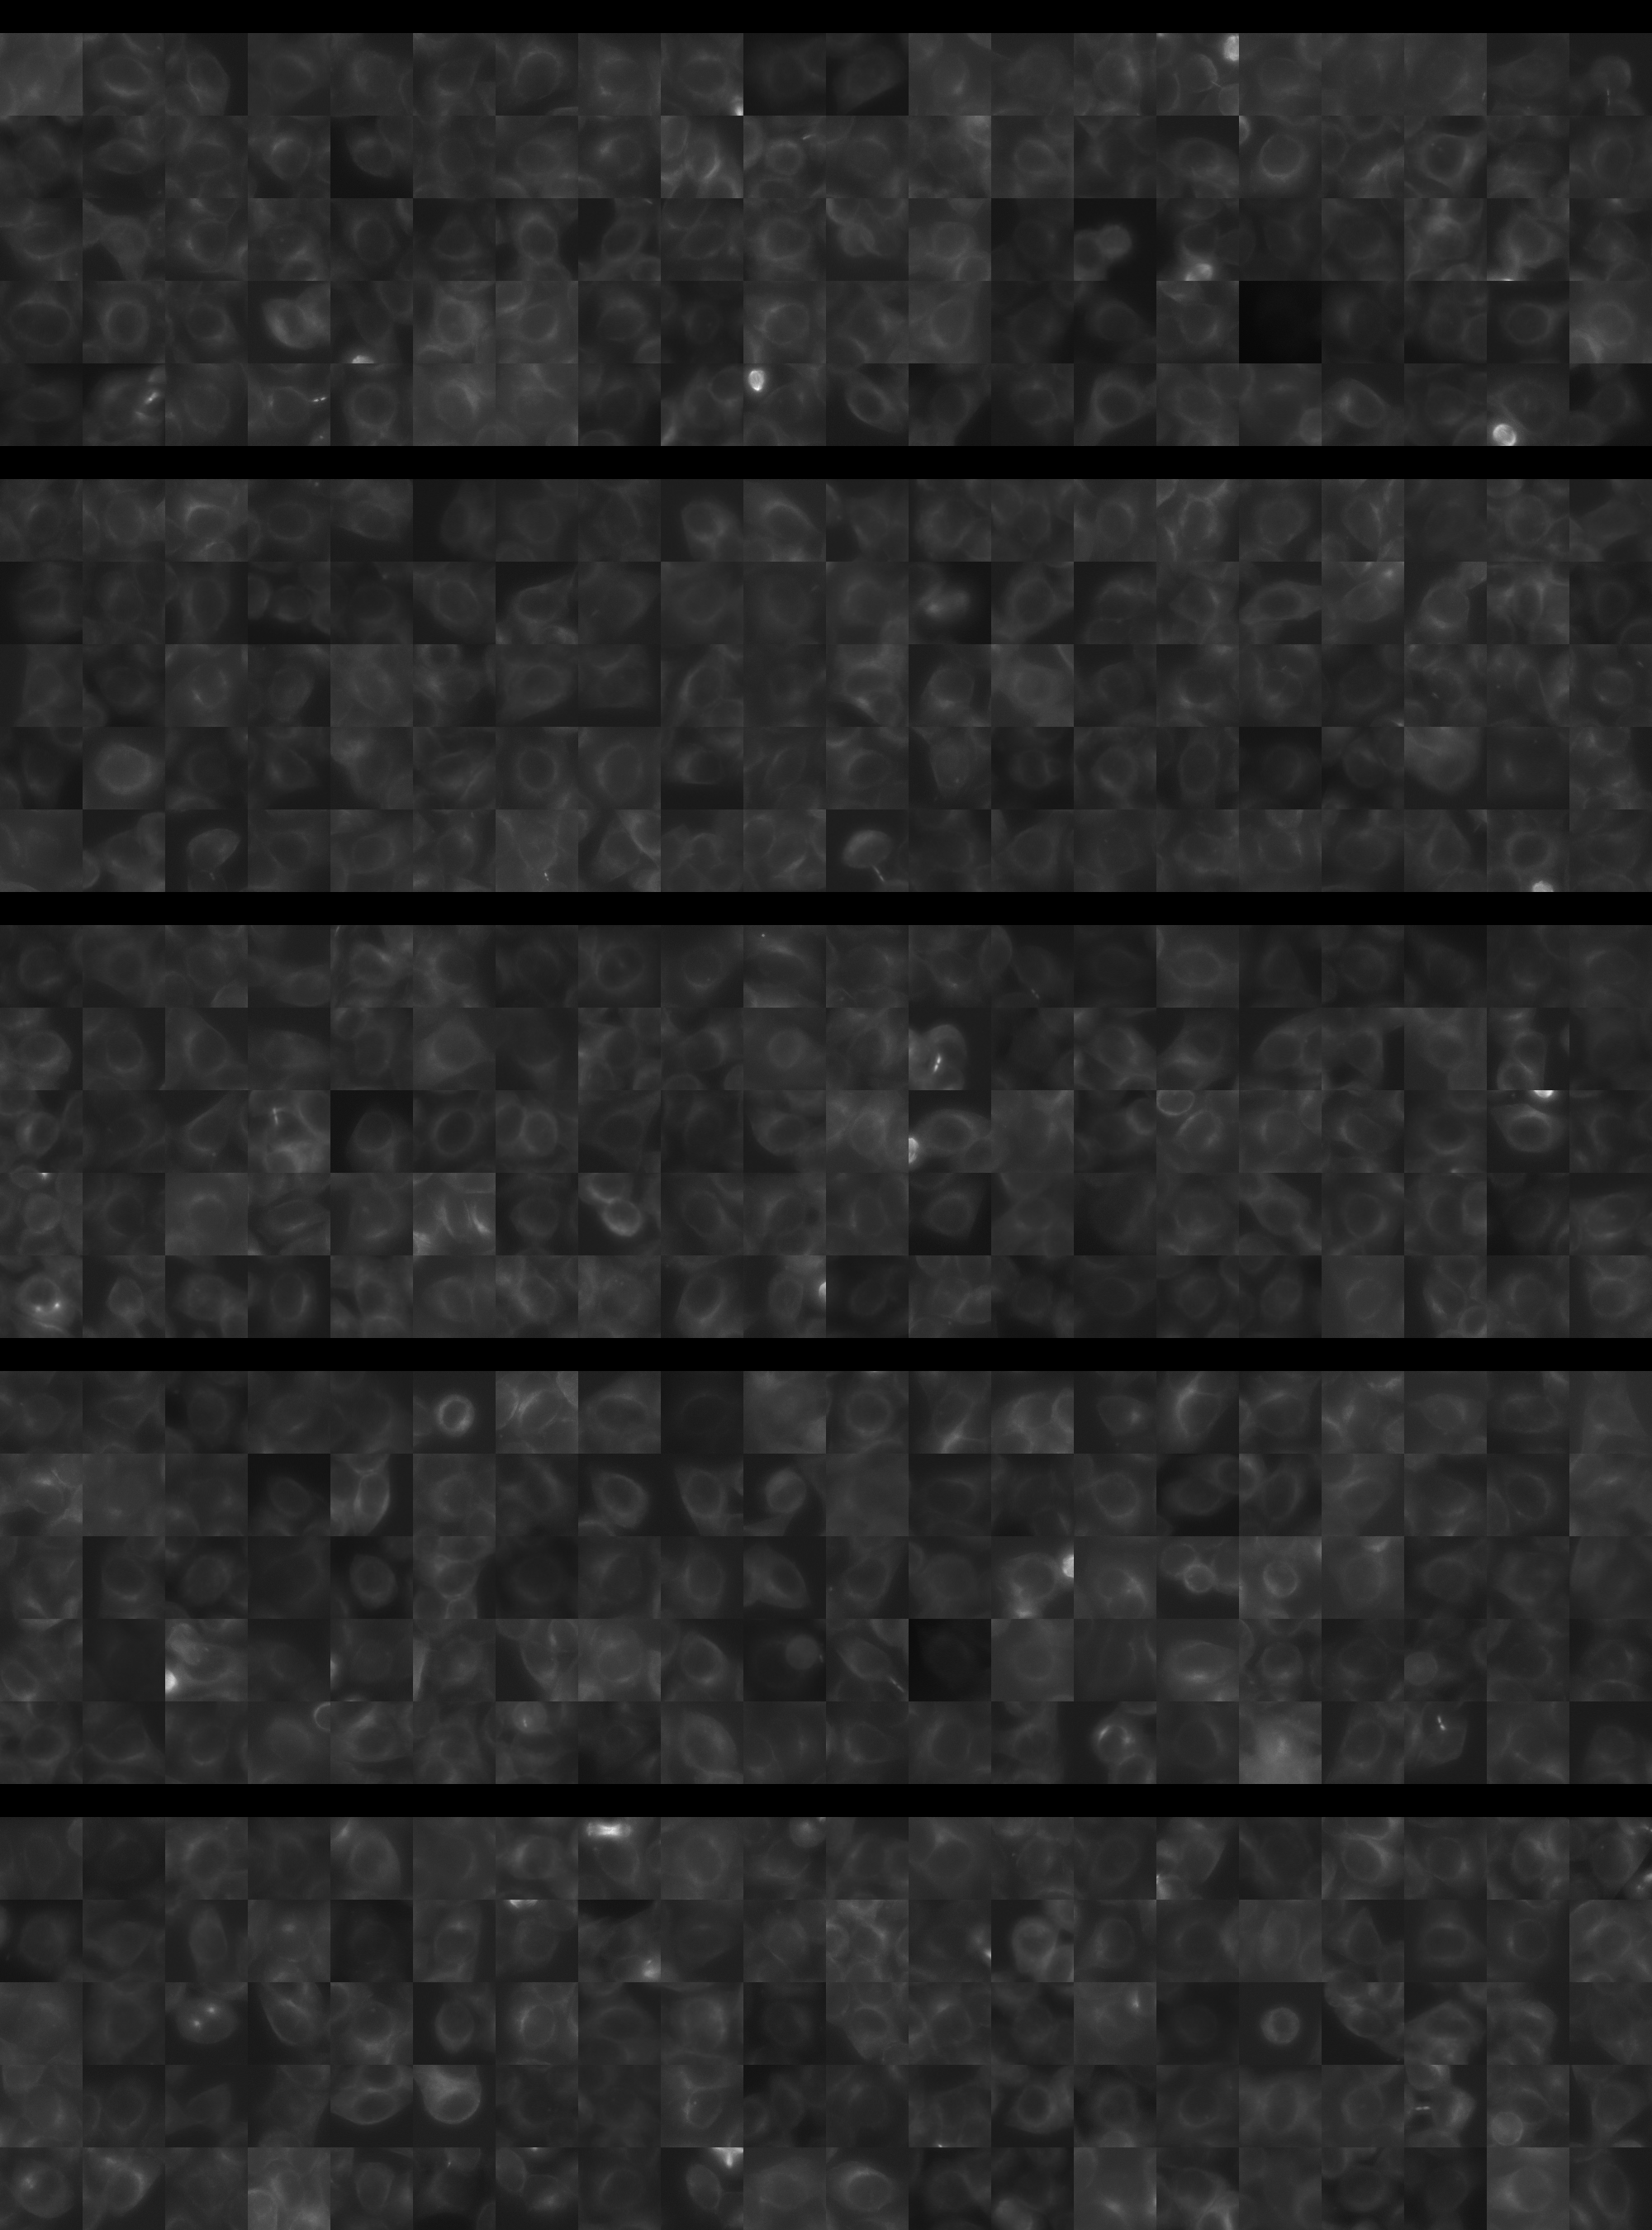
Each montage below shows randomly selected individual cell images for the same target gene separated by sgRNA, along with an example montage of cells expressing a non-targeting negative control sgRNA at the bottom. sgRNA labels in the montages correspond to the numbered sgRNA sequences in the gene info table above. The DNA (blue) and tubulin (green) channels are displayed by default, with gH2AX (grayscale) and actin (yellow) available using the check boxes. Channel brightness, contrast, and opacity are adjustable by clicking the arrow next to the channel name. When only one channel is selected, the display defaults to grayscale. Click the “Zoom” checkbox above the channel controls to enable image zooming (via scrolling) and panning (via click-and-drag).

The cell boxes displayed for this gene are square, 30.36 μm per side for the interphase montage and 30.36 μm per side for the mitotic montage.
Features

Interphase Score Rank FDR q-value
Nucleus DNA Integrated -6.794e-02 5089 of 5322 0.158
Nucleus DNA Mean -4.546e-02 3459 of 5322 0.366
Nucleus gH2AX Mean 0.032 3993 of 5322 0.453
Nucleus DNA - gH2AX Correlation -6.030e-02 2788 of 5322 0.062
Nucleus Shape Area -1.003e-02 3615 of 5322 0.805
Nucleus Shape Eccentricity 0.043 1140 of 5322 0.334
Nucleus Shape Form Factor -3.662e-02 2024 of 5322 0.437
Nucleus Shape Solidity -5.483e-02 2935 of 5322 0.149
Cell DNA Mass Displacement 0.056 892 of 5322 0.346
Cell Tubulin Mean -1.256e-01 5014 of 5322 0.005
Cell Tubulin Mass Displacement 0.033 1139 of 5322 0.587
Cell Actin Mean -4.474e-02 4255 of 5322 0.445
Cell Tubulin - Actin Correlation -1.673e-02 4376 of 5322 0.785
Cell DNA - Tubulin Correlation -6.413e-02 5056 of 5322 0.097
Cell Shape Area 0.017 2625 of 5322 0.938
Cell Shape Eccentricity 0.027 1675 of 5322 0.764
Mitotic Score Rank FDR q-value
Nucleus DNA Integrated -8.270e-02 4674 of 5322 0.965
Nucleus DNA Mean 0.149 956 of 5322 1.000
Nucleus DNA Mass Displacement -8.134e-02 4529 of 5322 0.999
Nucleus DNA Mean Frac 3 -6.494e-02 4026 of 5322 1.000
Nucleus gH2AX Mean 0.245 531 of 5322 1.000
Nucleus gH2AX Mean Frac 0 0.293 124 of 5322 1.000
Nucleus Tubulin Mean Frac 0 0.098 2012 of 5322 0.999
Nucleus Tubulin Mean Edge 0.232 584 of 5322 0.996
Nucleus Tubulin Std Edge 0.178 586 of 5322 0.999
Nucleus Shape Area -1.127e-02 4064 of 5322 0.990
Nucleus Shape Eccentricity 0.038 1543 of 5322 1.000
Nucleus Shape Form Factor -2.119e-01 4228 of 5322 0.998
Cell Tubulin Mean 0.169 1230 of 5322 0.997
Cell Tubulin Mean Frac 3 -2.995e-02 2037 of 5322 0.999
Cell Actin Mean 0.300 371 of 5322 0.997
Cell Shape Area -5.593e-02 4474 of 5322 0.998
( Reset Zoom )
Brightness
Contrast
Opacity
Brightness
Contrast
Opacity
Brightness
Contrast
Opacity
Brightness
Contrast
Opacity
Brightness
Contrast
Opacity

( Reset Zoom )
Brightness
Contrast
Opacity
Brightness
Contrast
Opacity
Brightness
Contrast
Opacity
Brightness
Contrast
Opacity
Brightness
Contrast
Opacity

MIT Central Accessability