SPC25

Gene symbol: SPC25
Gene: 57405
Uniprot Function: Acts as a component of the essential kinetochore-associated NDC80 complex, which is required for chromosome segregation and spindle checkpoint activity (PubMed:14699129, PubMed:14738735). Required for kinetochore integrity and the organization of stable microtubule binding sites in the outer plate of the kinetochore (PubMed:14738735, PubMed:14699129). The NDC80 complex synergistically enhances the affinity of the SKA1 complex for microtubules and may allow the NDC80 complex to track depolymerizing microtubules (PubMed:23085020).
Mitotic Index 0.1069
Interphase Cluster: #9 (45 genes)
Mitotic Cluster: #11 (44 genes)
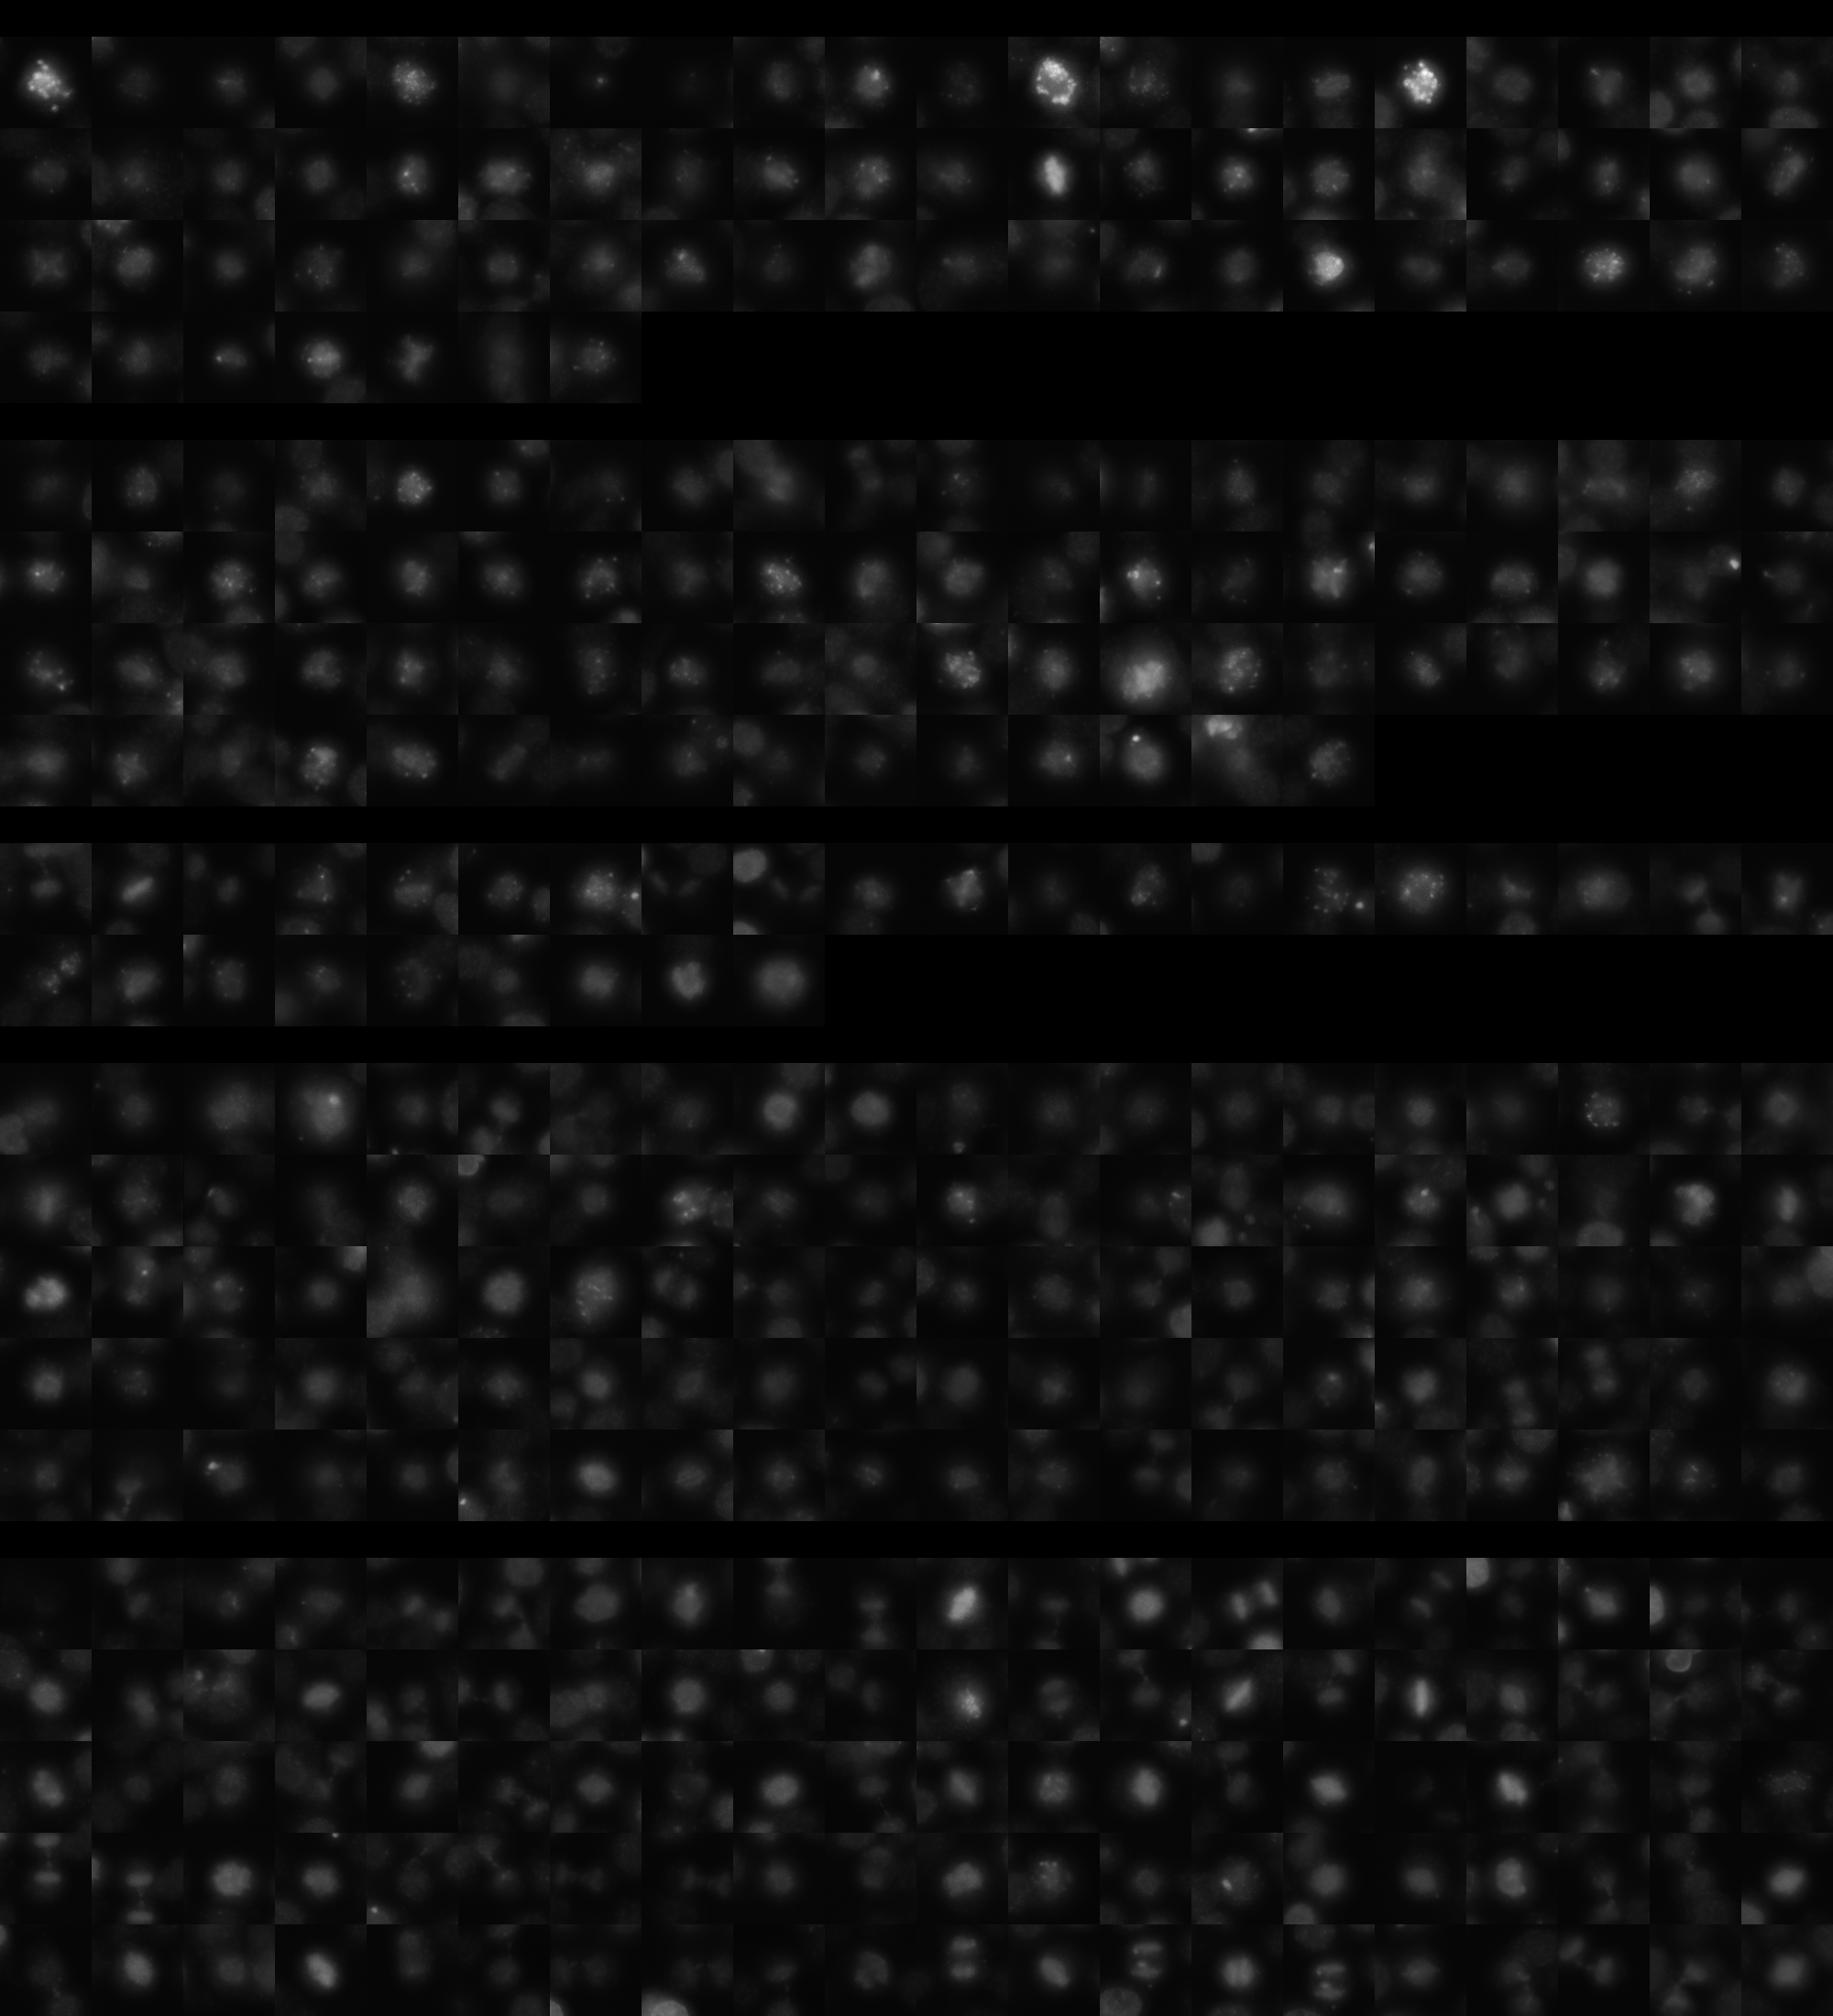
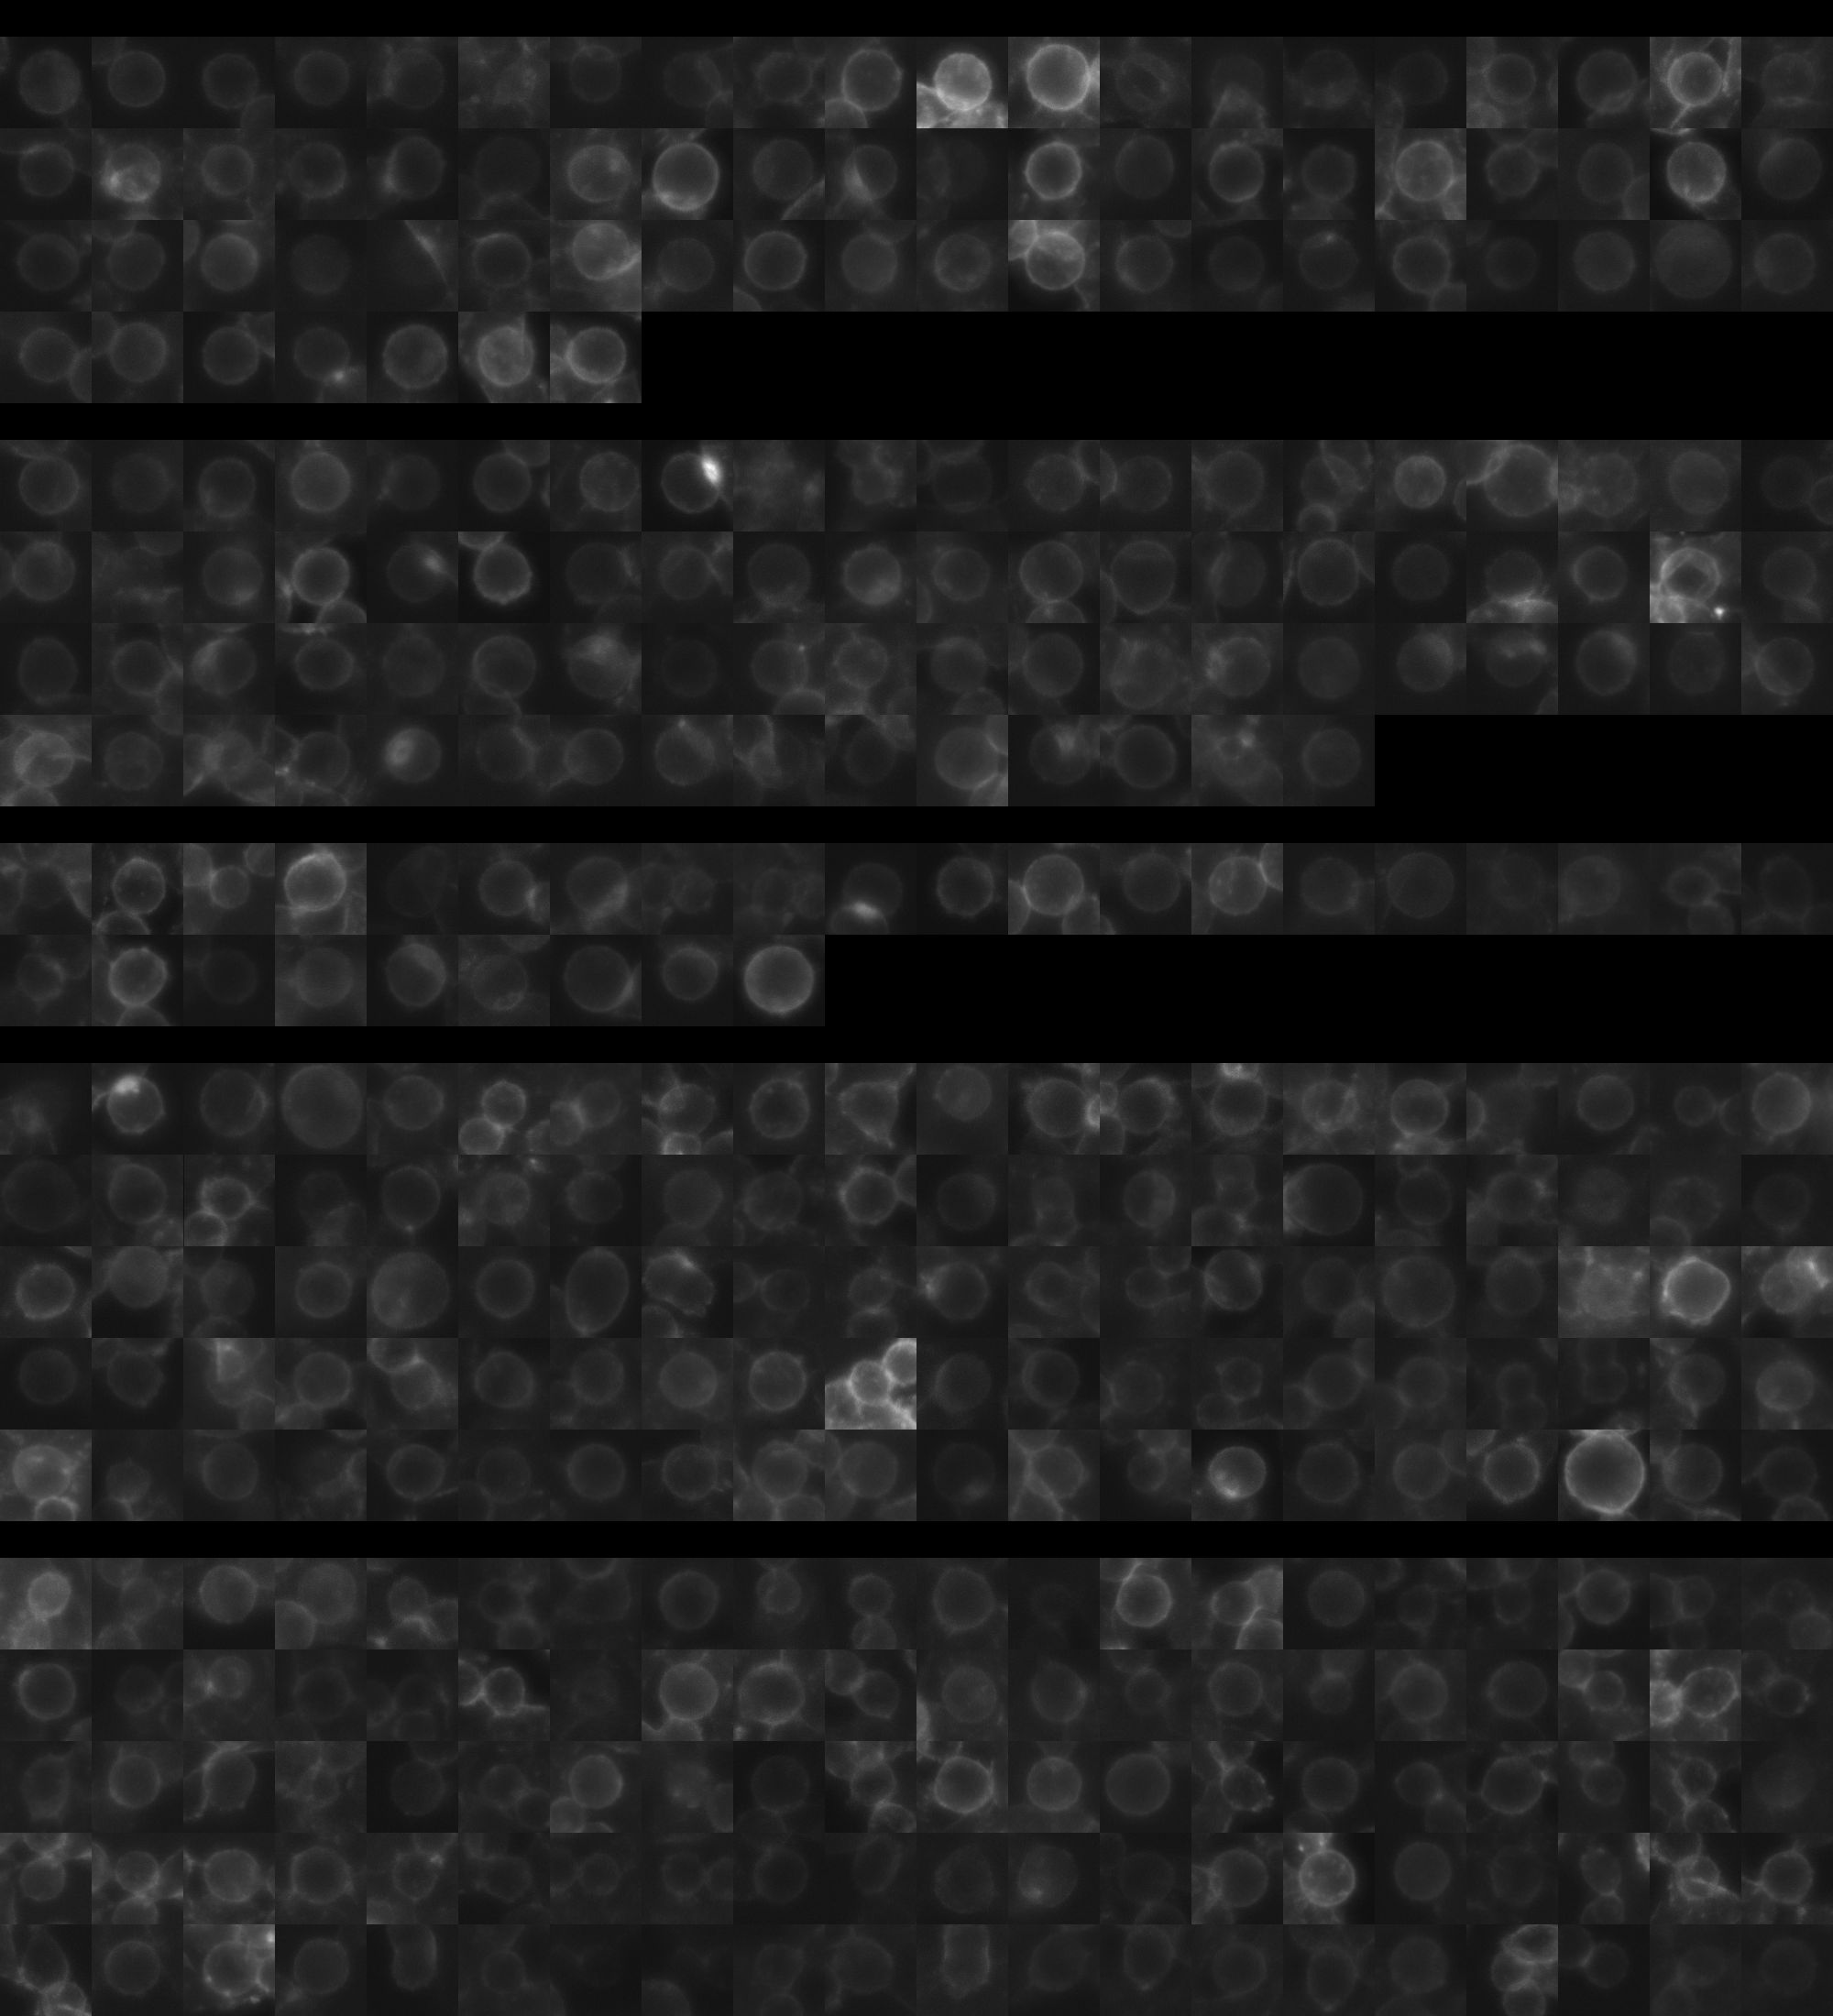
sgRNA 1: AGTACTGACTGCAAATATCC (interphase cells: 216, mitotic cells: 67)
sgRNA 2: GACTTGTATAAAGATCGACT (interphase cells: 171, mitotic cells: 75)
sgRNA 3: GGGACTAAGAGATACCTACA (interphase cells: 393, mitotic cells: 29)
sgRNA 4: TTGGAATAAATTCAAAAGTA (interphase cells: 1702, mitotic cells: 126)

Interphase Cluster

Mitotic Cluster

Overview

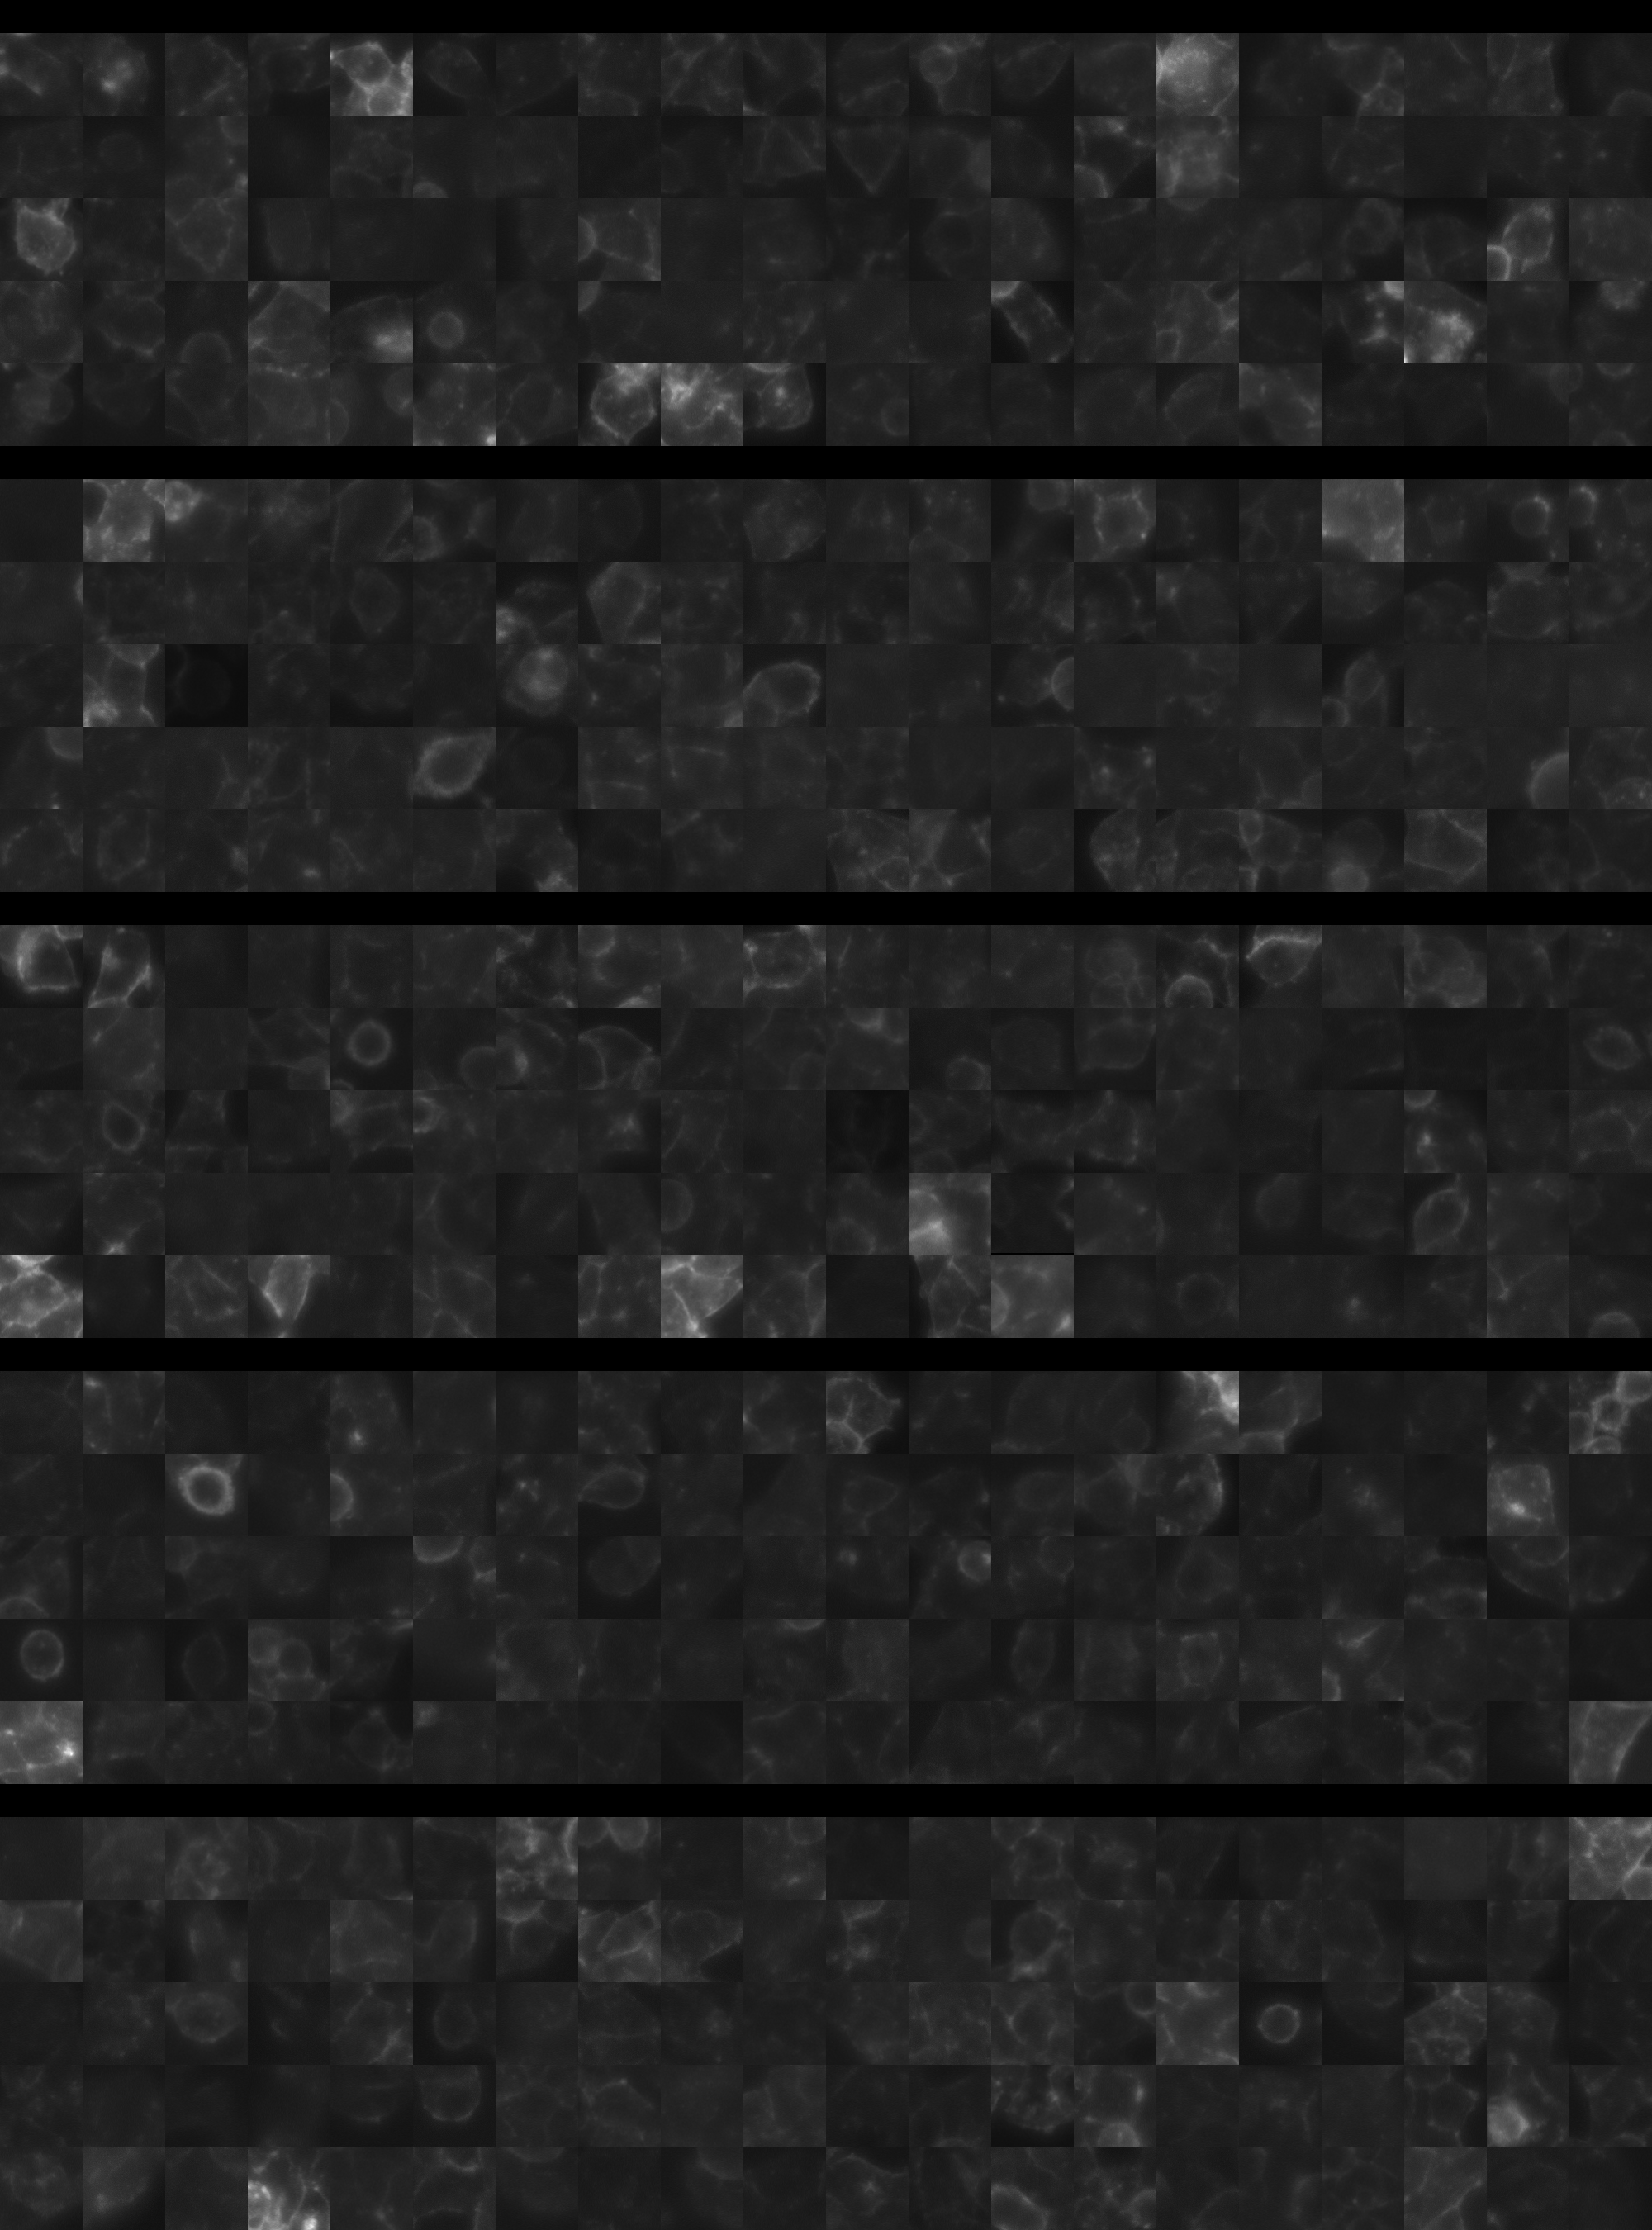
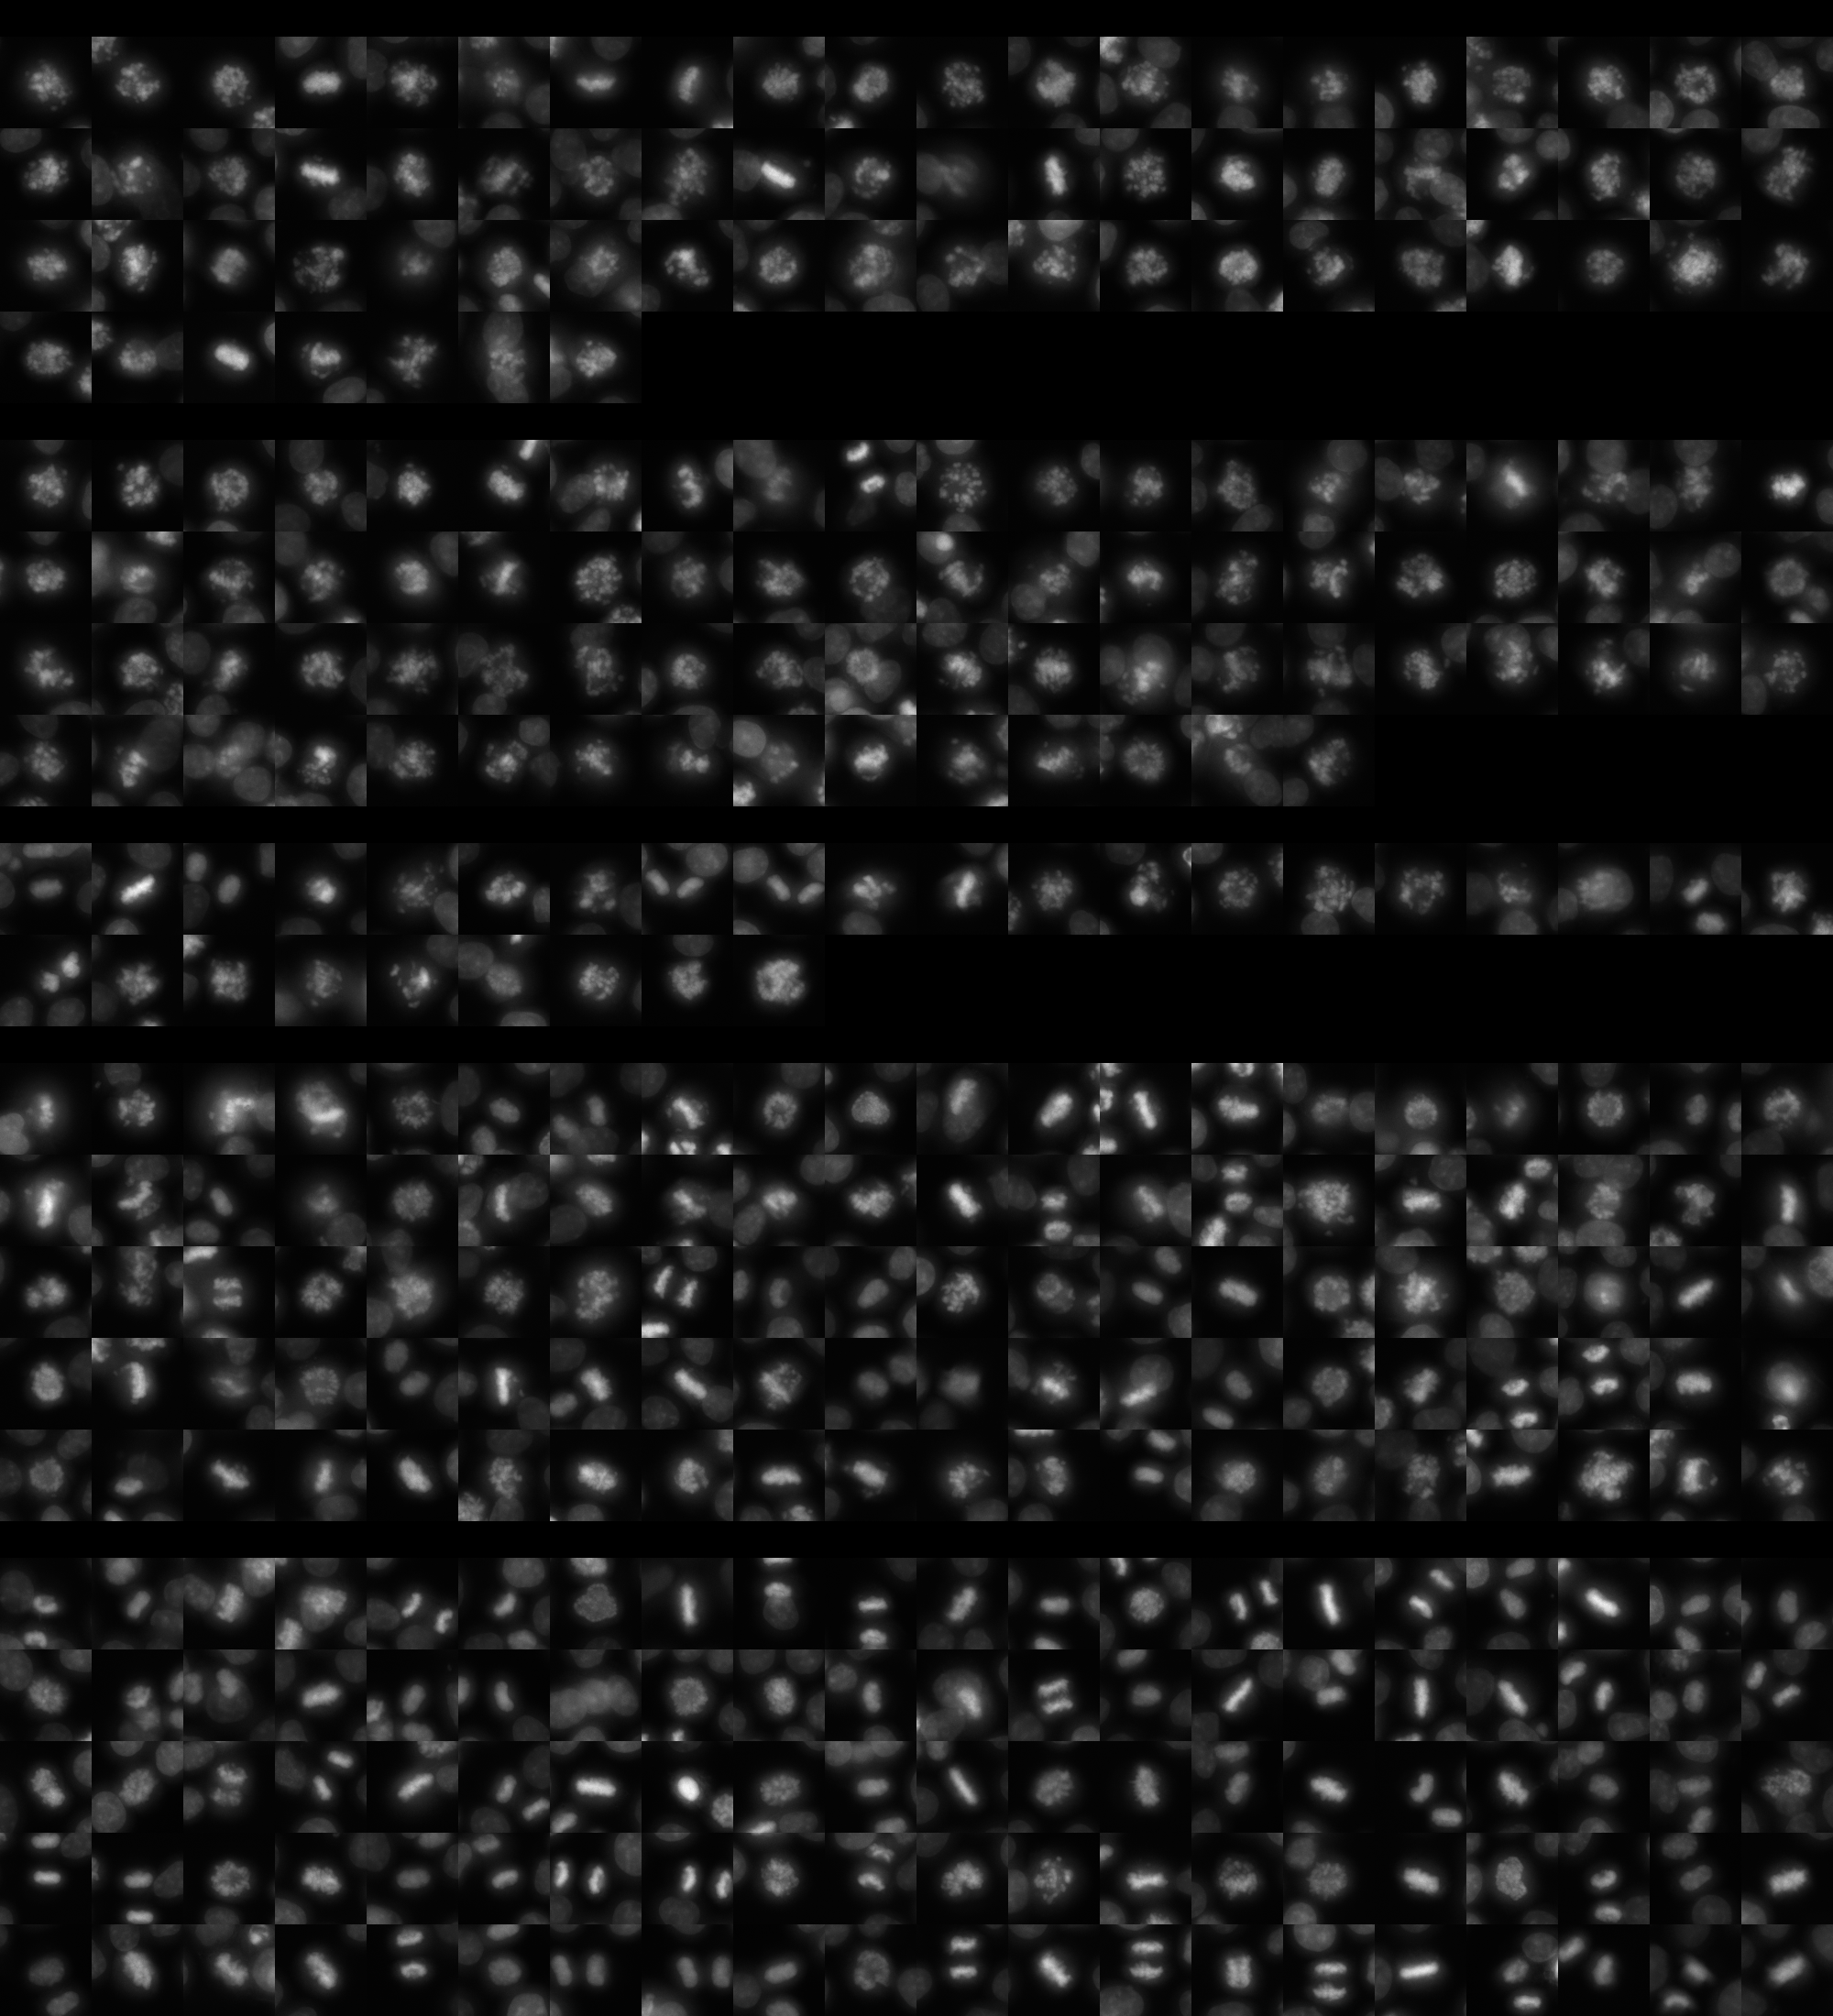
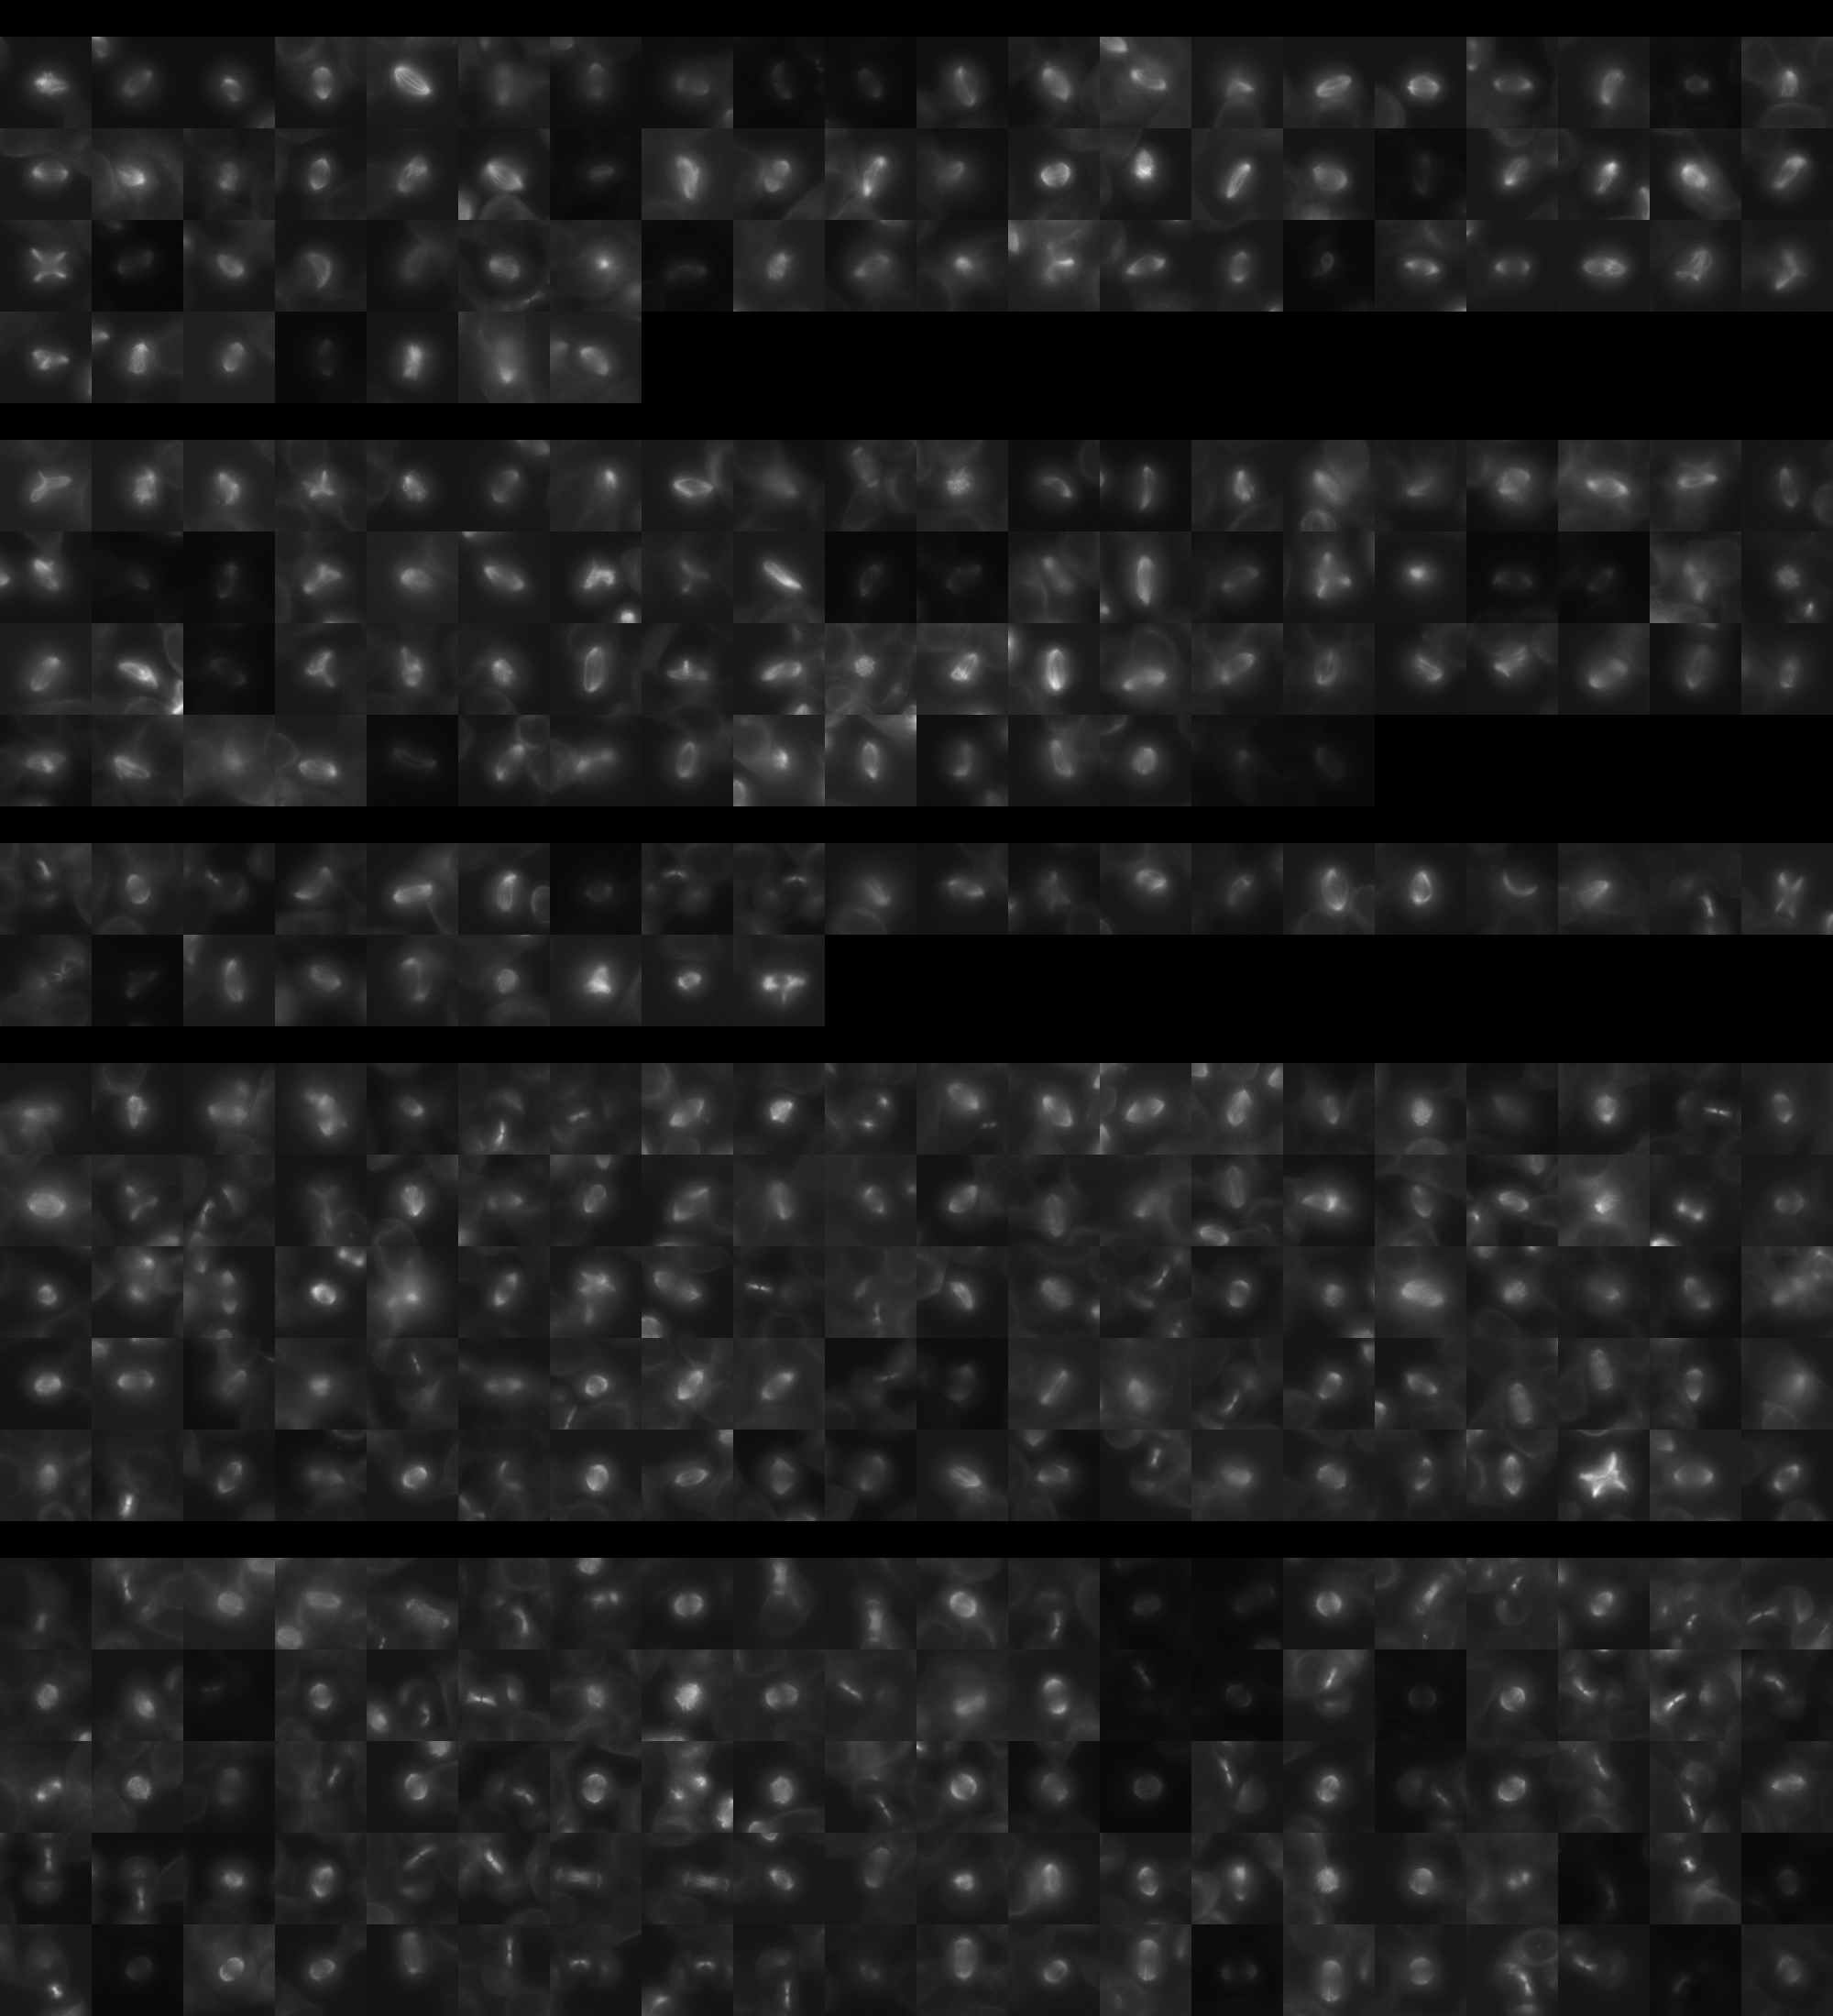
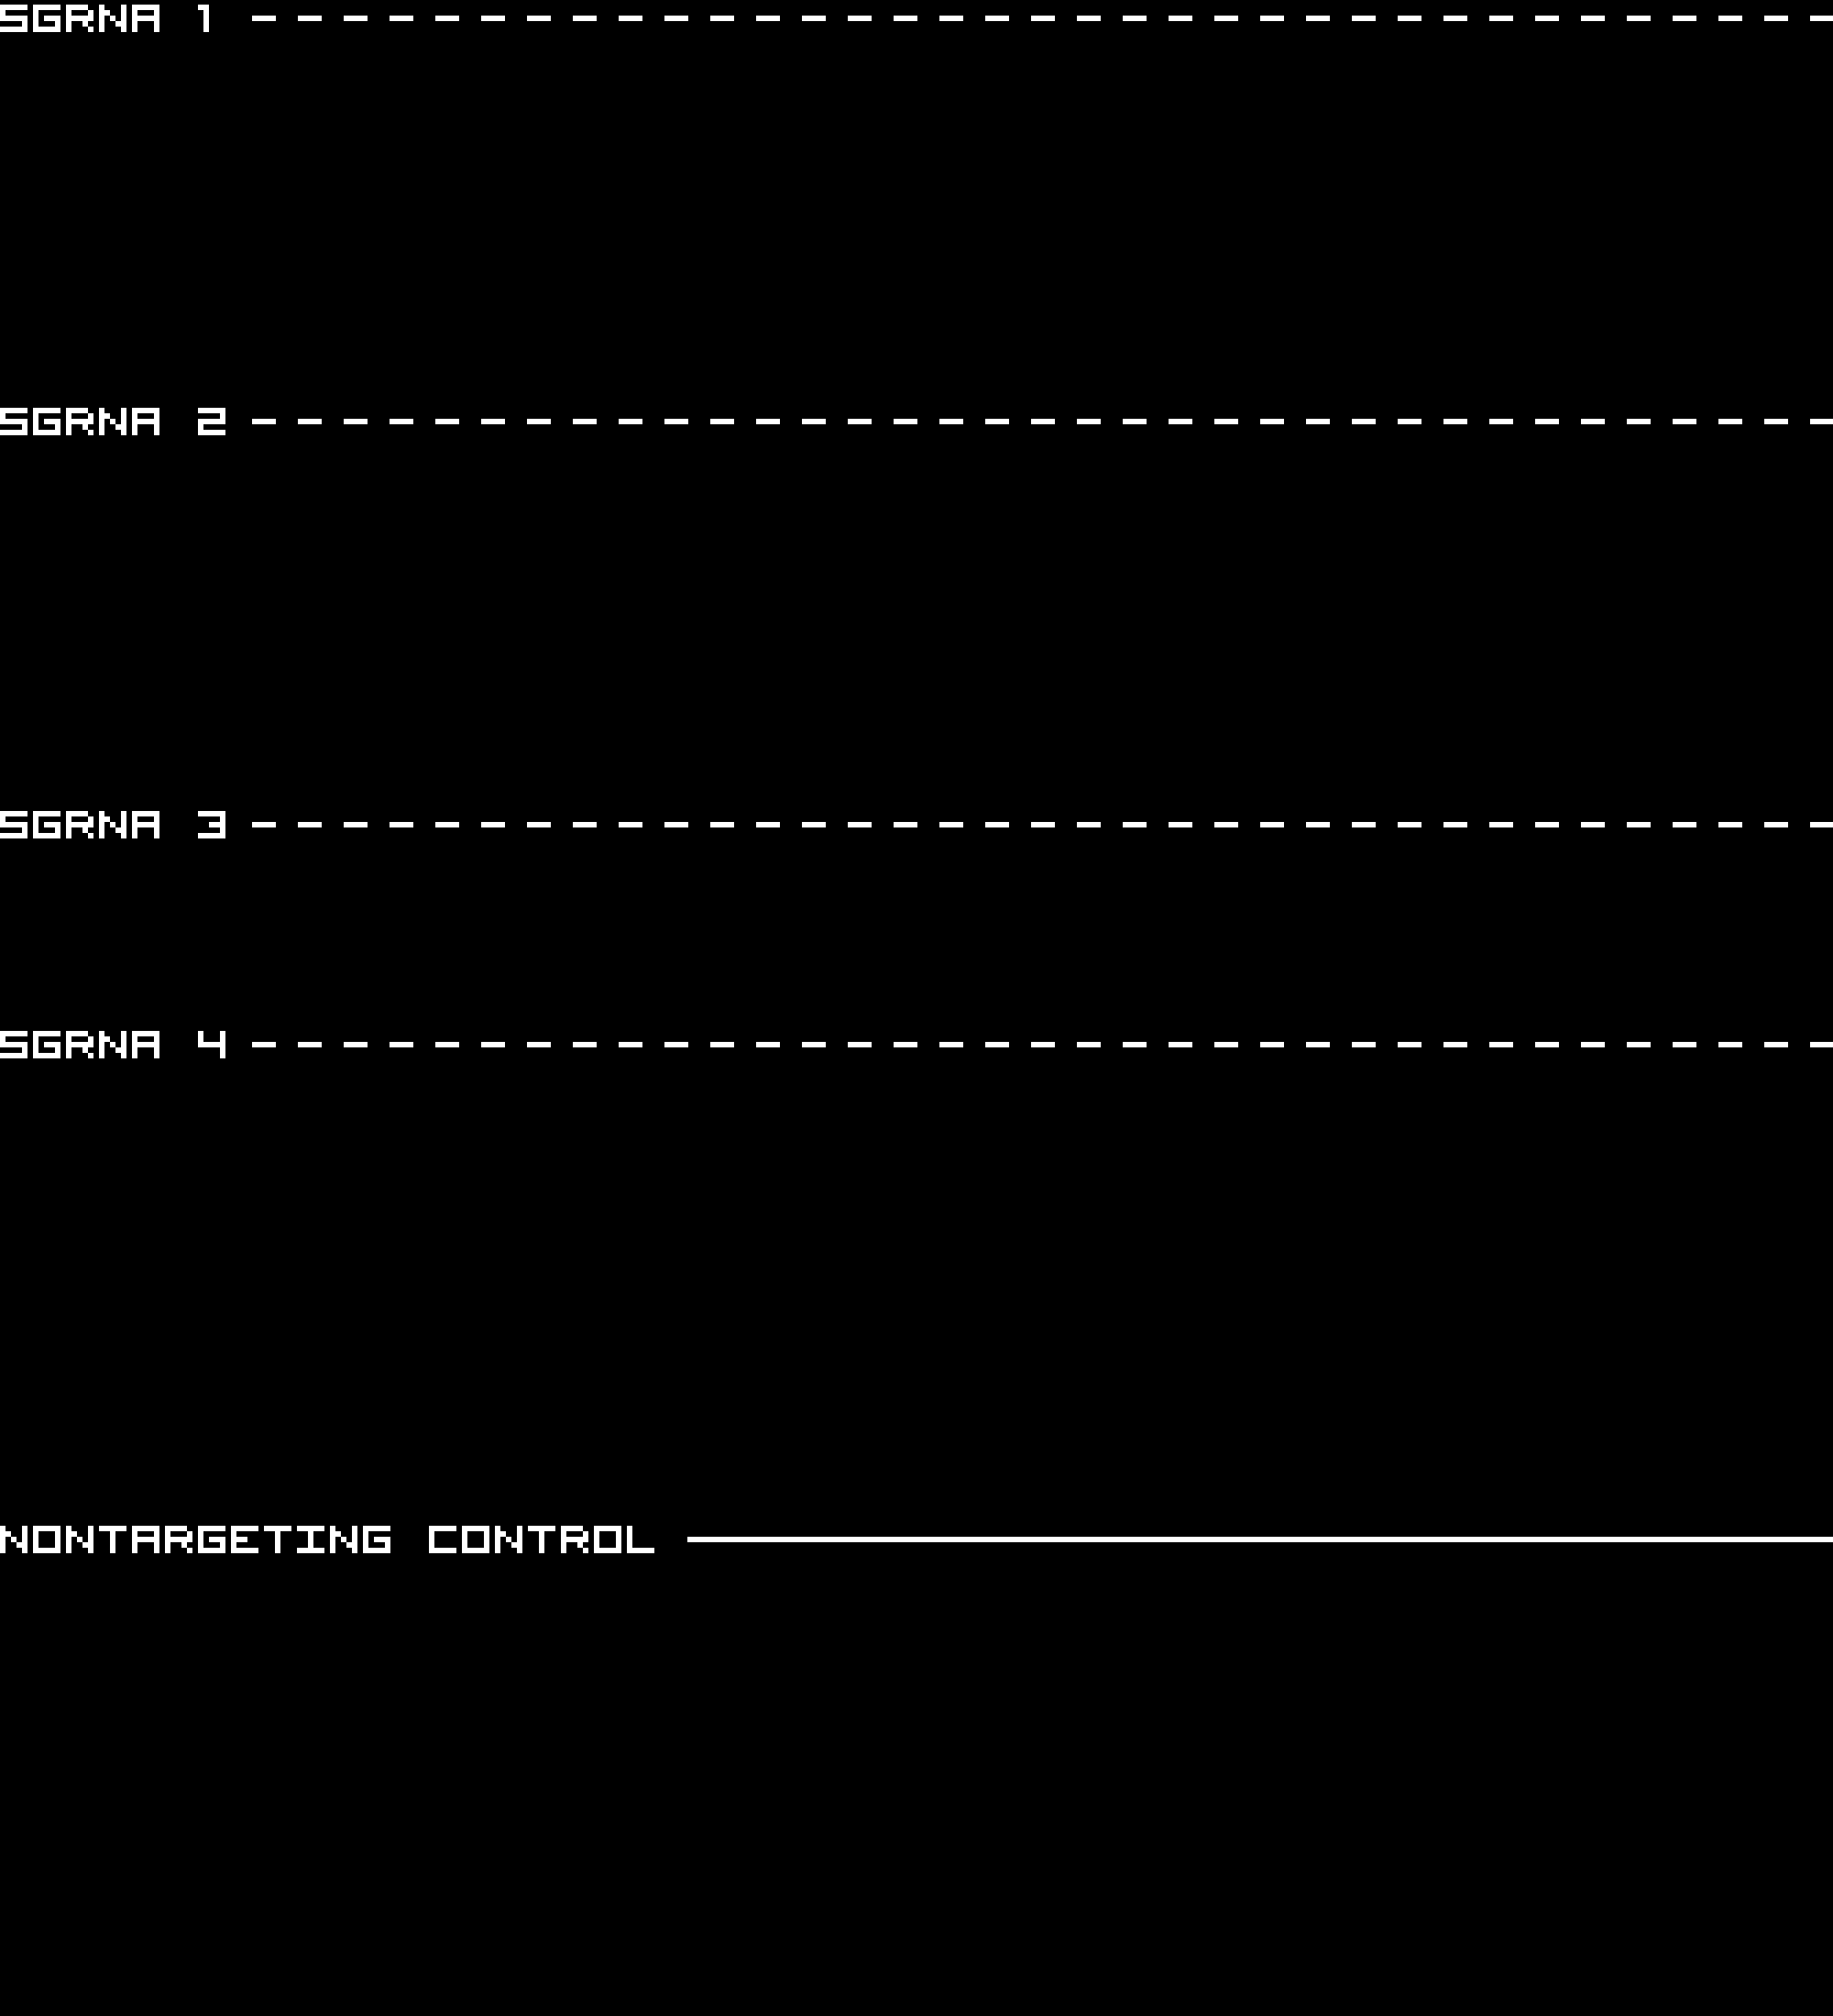
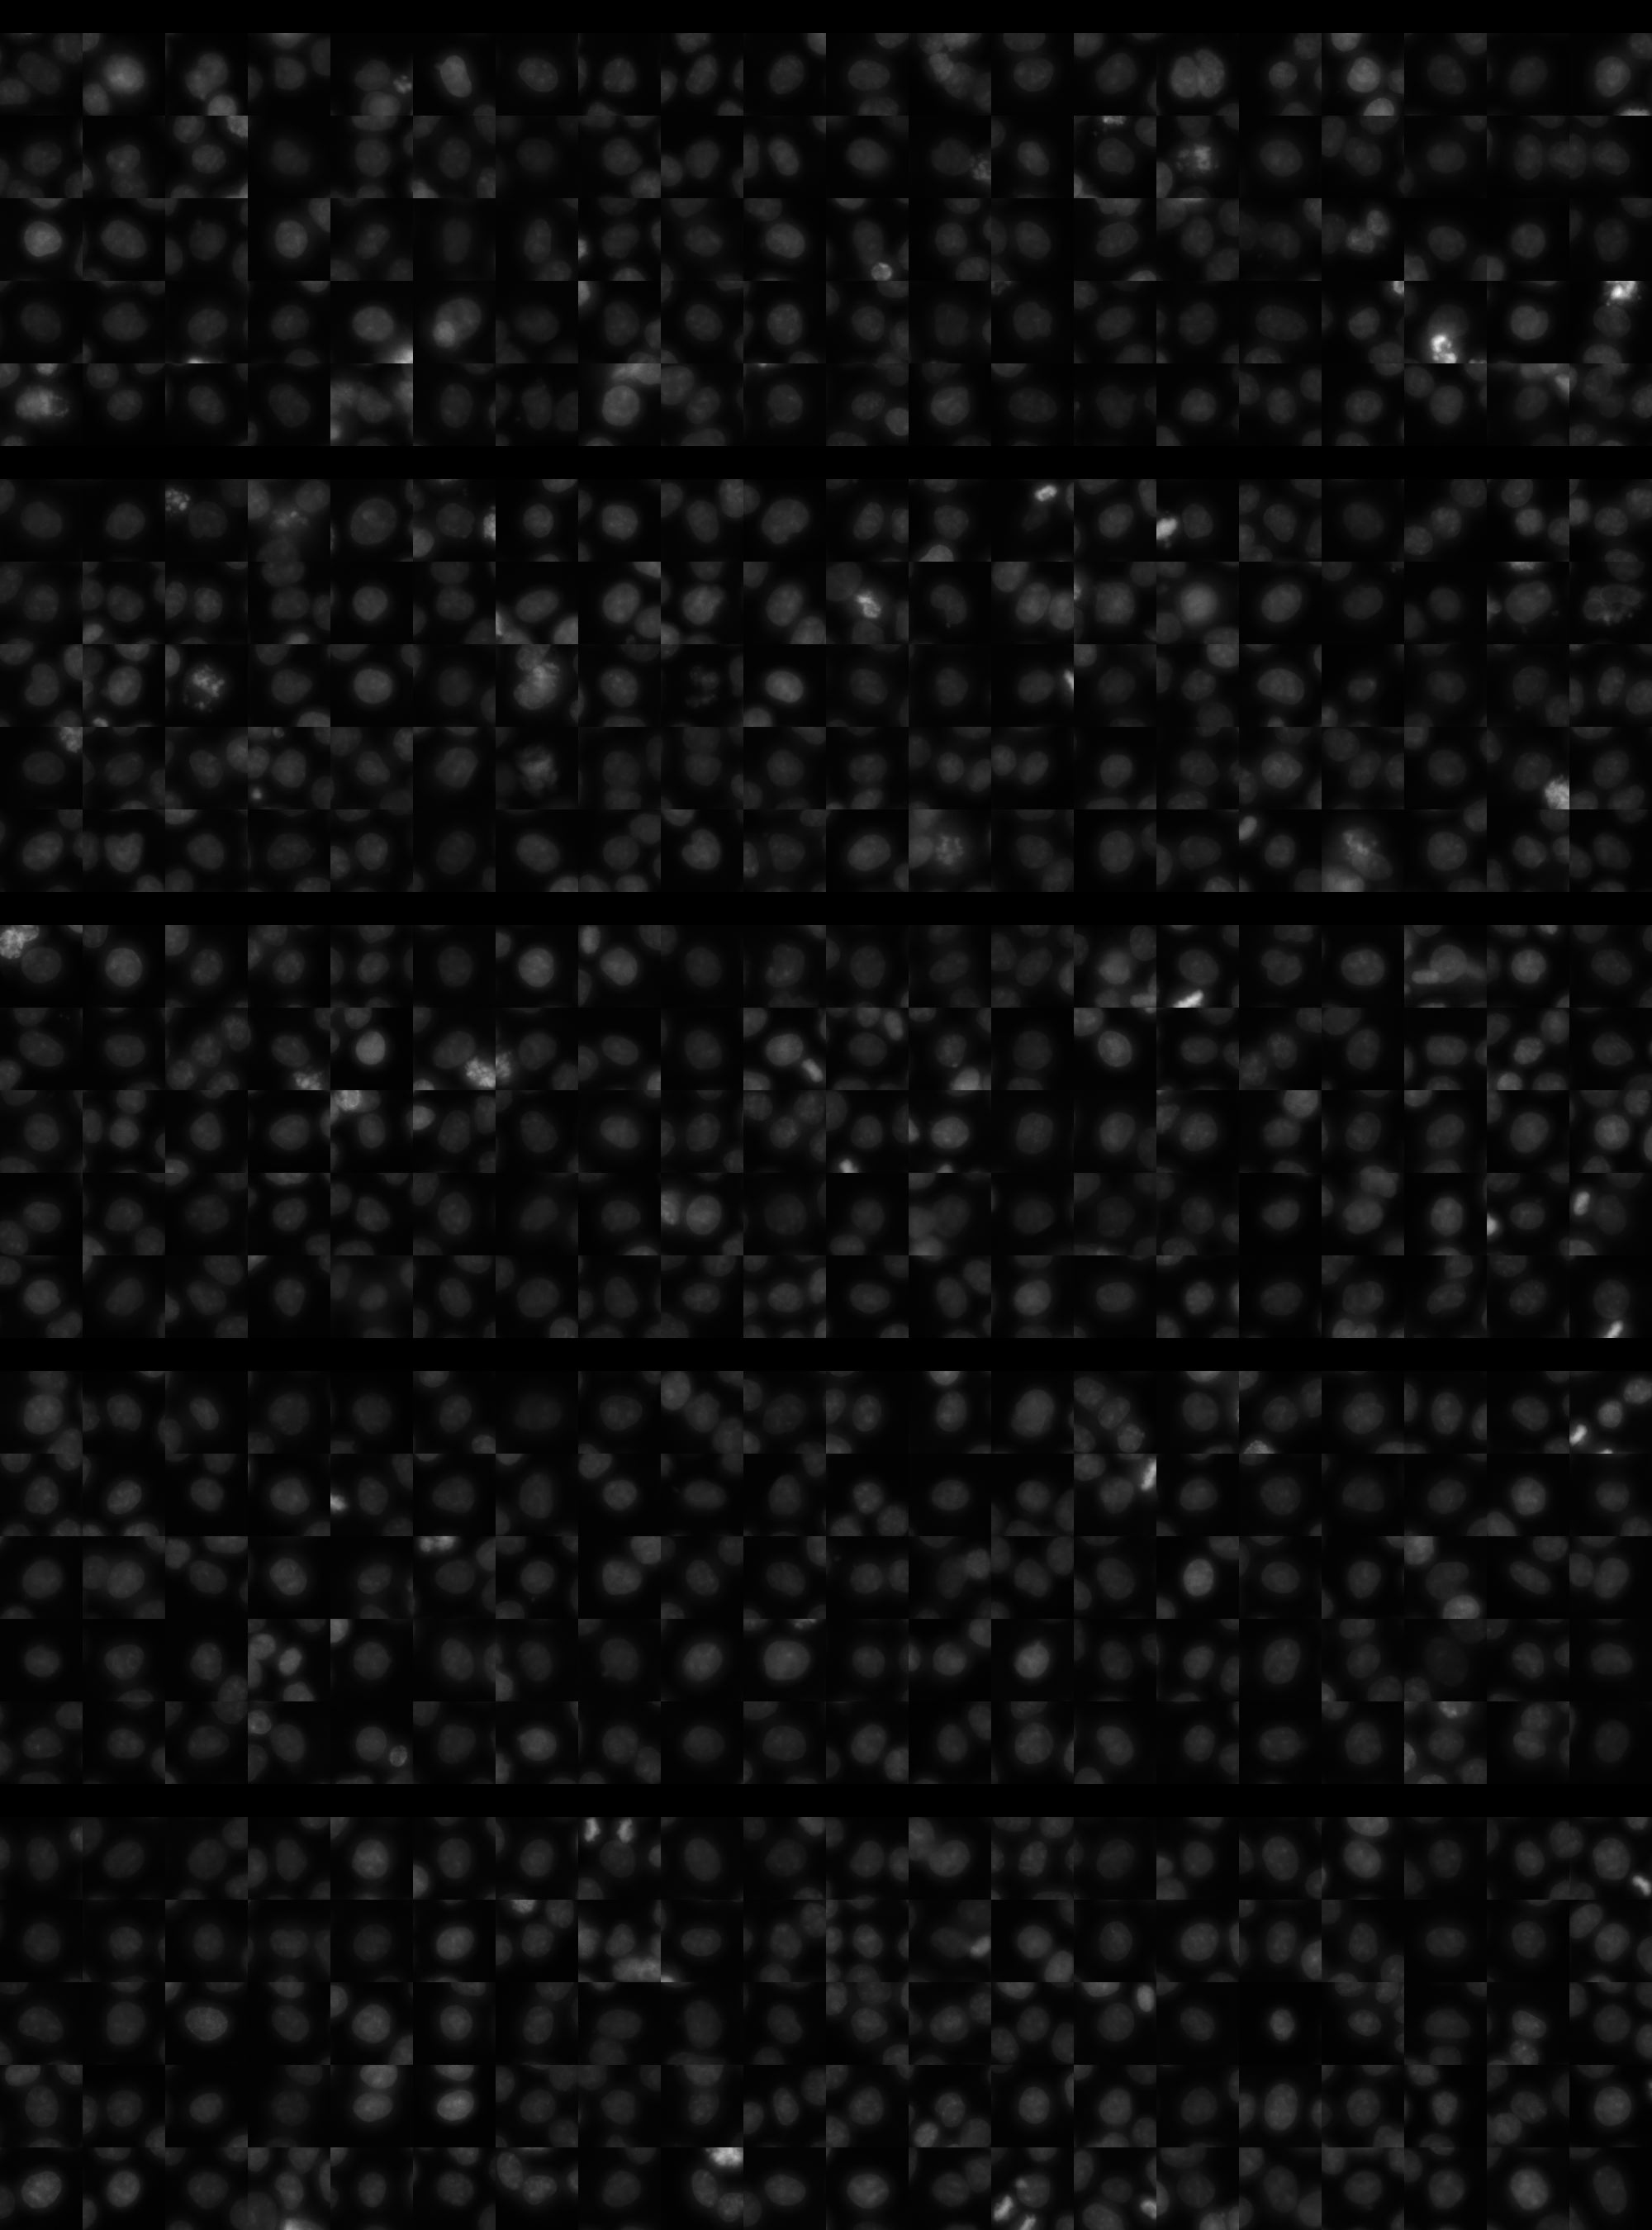
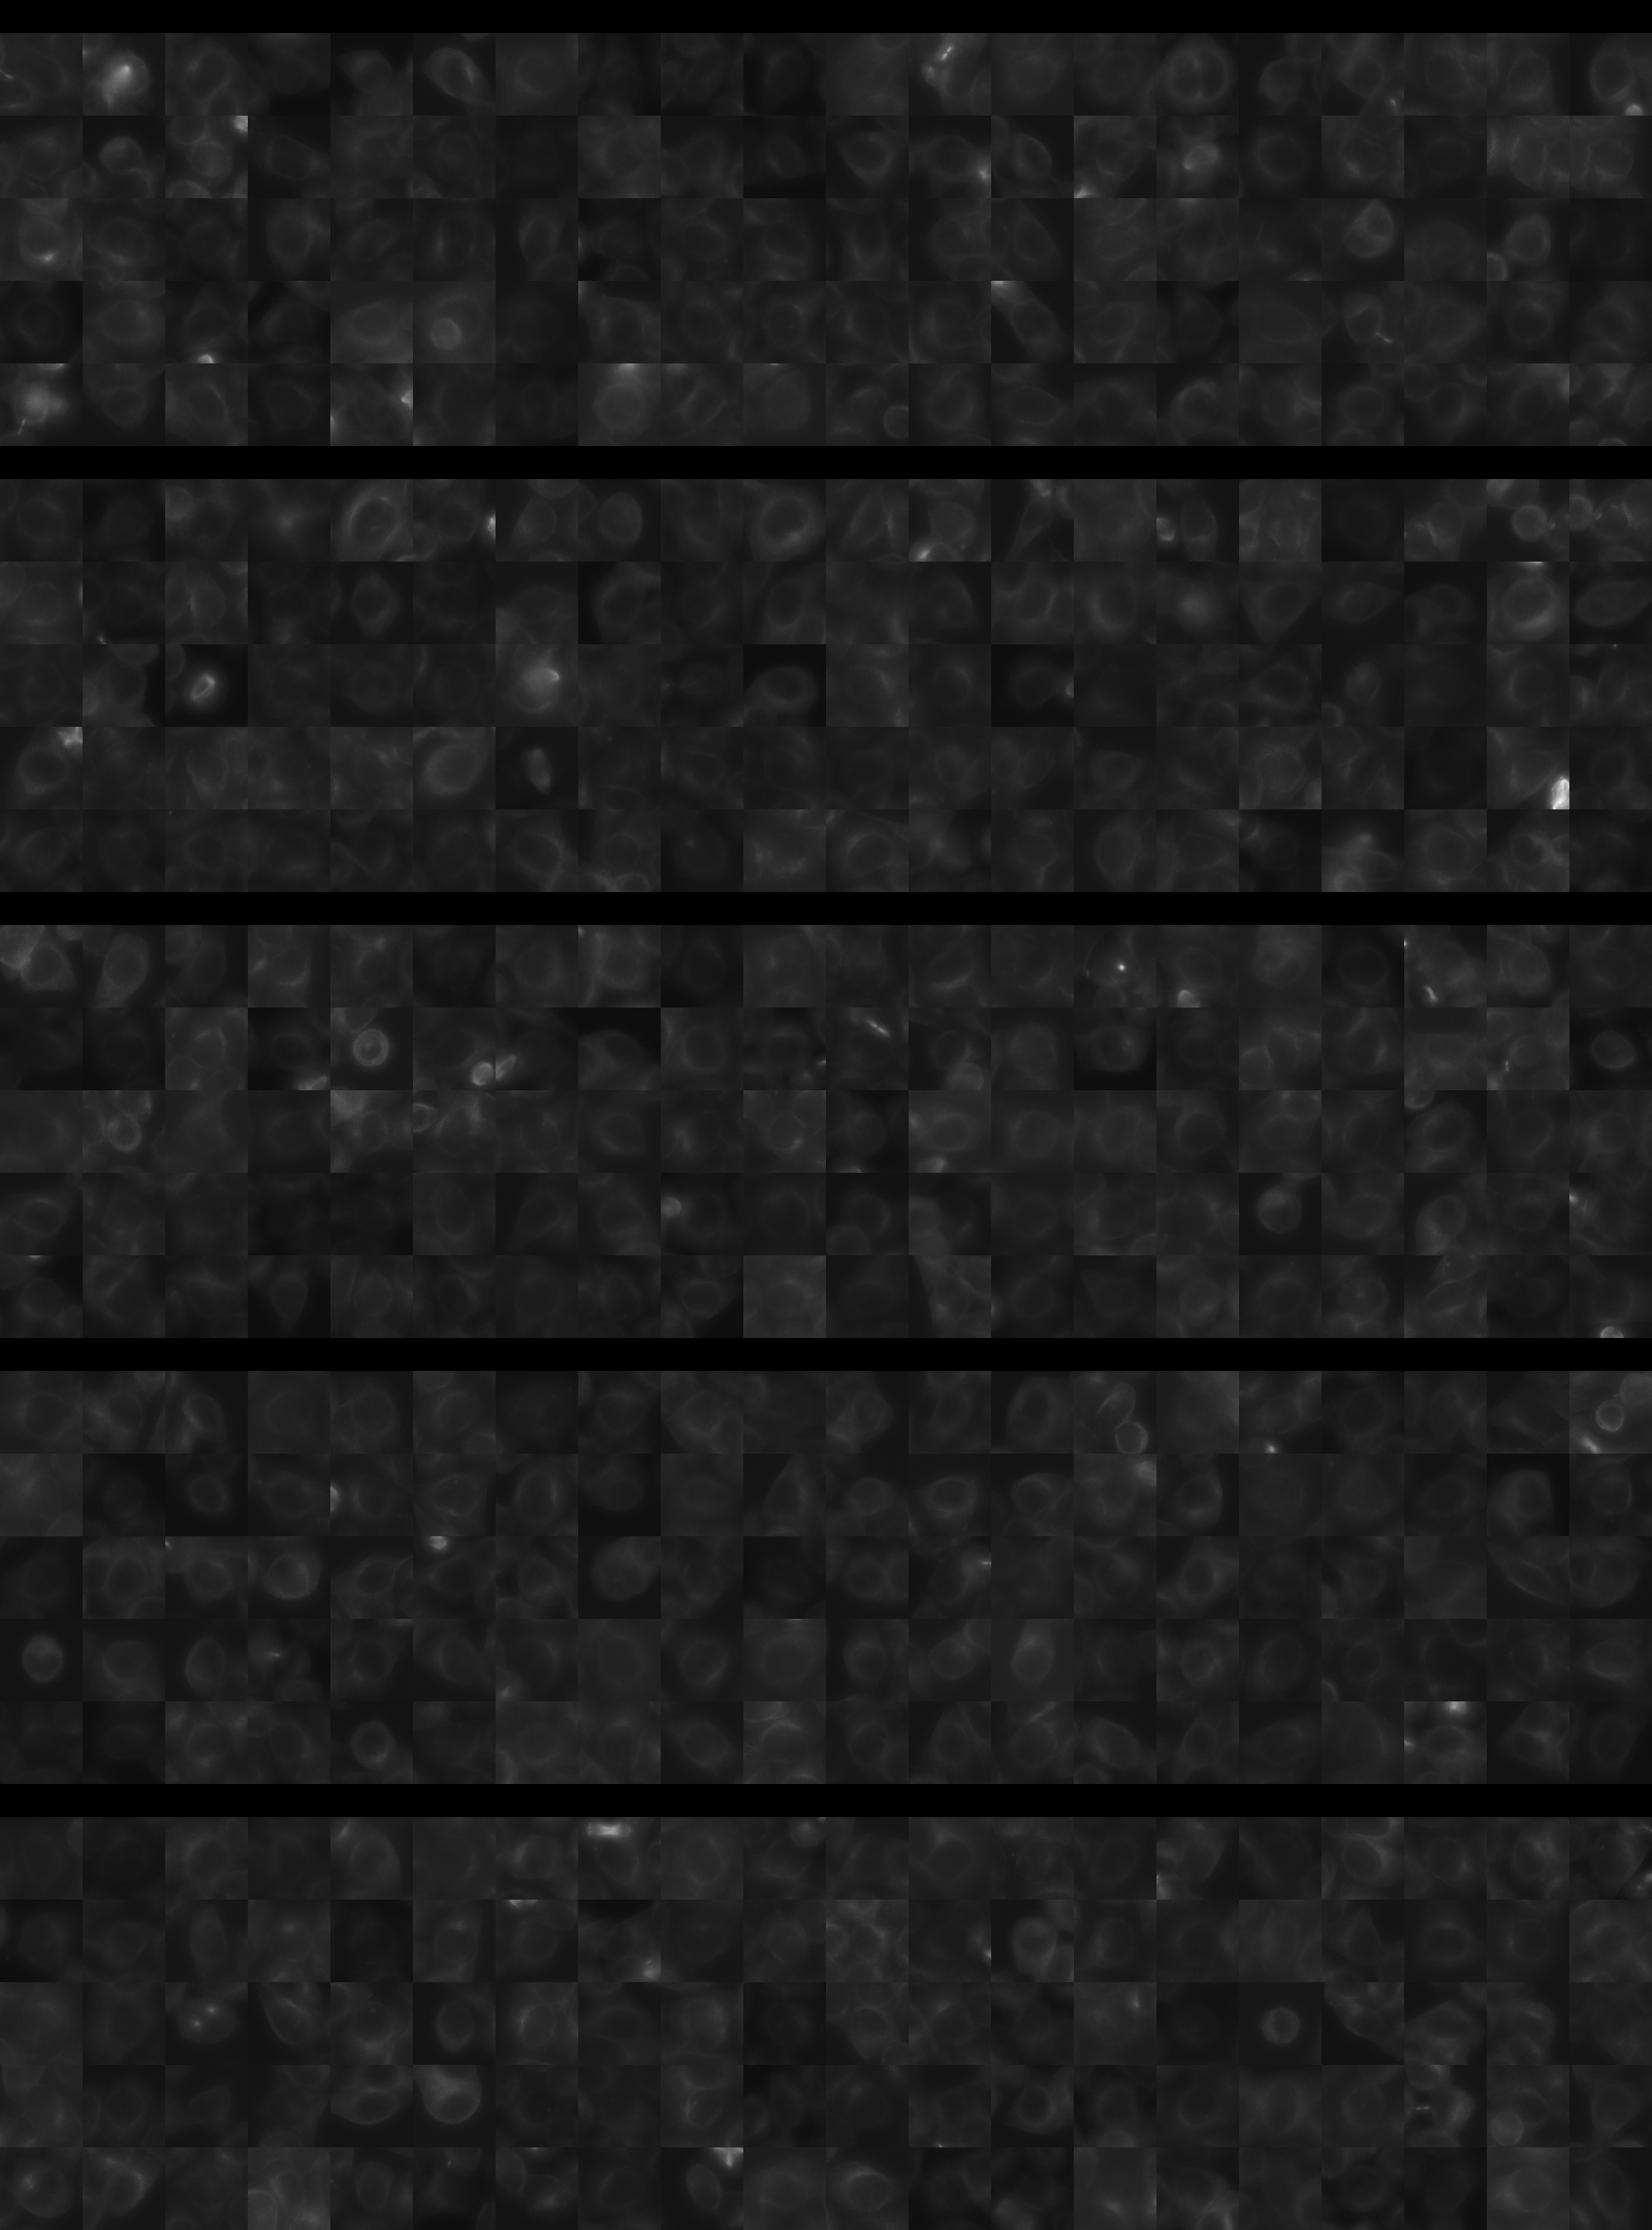
Each montage below shows randomly selected individual cell images for the same target gene separated by sgRNA, along with an example montage of cells expressing a non-targeting negative control sgRNA at the bottom. sgRNA labels in the montages correspond to the numbered sgRNA sequences in the gene info table above. The DNA (blue) and tubulin (green) channels are displayed by default, with gH2AX (grayscale) and actin (yellow) available using the check boxes. Channel brightness, contrast, and opacity are adjustable by clicking the arrow next to the channel name. When only one channel is selected, the display defaults to grayscale. Click the “Zoom” checkbox above the channel controls to enable image zooming (via scrolling) and panning (via click-and-drag).

The cell boxes displayed for this gene are square, 30.36 μm per side for the interphase montage and 30.36 μm per side for the mitotic montage.
Features

Interphase Score Rank FDR q-value
Nucleus DNA Integrated 0.131 279 of 5322 0.096
Nucleus DNA Mean -6.624e-02 4006 of 5322 0.291
Nucleus gH2AX Mean 0.100 1961 of 5322 0.082
Nucleus DNA - gH2AX Correlation -8.260e-03 1122 of 5322 0.832
Nucleus Shape Area 0.091 816 of 5322 0.224
Nucleus Shape Eccentricity 0.047 1027 of 5322 0.484
Nucleus Shape Form Factor -9.703e-02 4313 of 5322 0.095
Nucleus Shape Solidity -1.346e-01 4768 of 5322 0.011
Cell DNA Mass Displacement 0.038 1728 of 5322 0.716
Cell Tubulin Mean 0.123 356 of 5322 0.032
Cell Tubulin Mass Displacement 0.081 272 of 5322 0.243
Cell Actin Mean 0.091 915 of 5322 0.172
Cell Tubulin - Actin Correlation 0.125 402 of 5322 0.028
Cell DNA - Tubulin Correlation 0.069 1447 of 5322 0.231
Cell Shape Area 0.117 475 of 5322 0.103
Cell Shape Eccentricity -9.355e-03 4302 of 5322 0.974
Mitotic Score Rank FDR q-value
Nucleus DNA Integrated 0.584 70 of 5322 0.048
Nucleus DNA Mean -2.341e-01 5113 of 5322 1.000
Nucleus DNA Mass Displacement 0.416 67 of 5322 0.999
Nucleus DNA Mean Frac 3 0.751 6 of 5322 0.018
Nucleus gH2AX Mean -9.075e-02 4144 of 5322 1.000
Nucleus gH2AX Mean Frac 0 0.147 599 of 5322 1.000
Nucleus Tubulin Mean Frac 0 0.498 84 of 5322 0.099
Nucleus Tubulin Mean Edge 0.038 2652 of 5322 0.999
Nucleus Tubulin Std Edge -8.657e-02 3742 of 5322 0.999
Nucleus Shape Area 1.179 13 of 5322 0.001
Nucleus Shape Eccentricity -9.415e-01 5304 of 5322 0.006
Nucleus Shape Form Factor -6.844e-01 5280 of 5322 0.073
Cell Tubulin Mean 0.612 53 of 5322 0.019
Cell Tubulin Mean Frac 3 -5.517e-01 5232 of 5322 0.037
Cell Actin Mean -6.033e-04 3206 of 5322 1.000
Cell Shape Area 0.523 183 of 5322 0.167
( Reset Zoom )
Brightness
Contrast
Opacity
Brightness
Contrast
Opacity
Brightness
Contrast
Opacity
Brightness
Contrast
Opacity
Brightness
Contrast
Opacity

( Reset Zoom )
Brightness
Contrast
Opacity
Brightness
Contrast
Opacity
Brightness
Contrast
Opacity
Brightness
Contrast
Opacity
Brightness
Contrast
Opacity

Day 3

Day 4

MIT Central Accessability