SPC24

Gene symbol: SPC24
Gene: 147841
Uniprot Function: Acts as a component of the essential kinetochore-associated NDC80 complex, which is required for chromosome segregation and spindle checkpoint activity (PubMed:14738735). Required for kinetochore integrity and the organization of stable microtubule binding sites in the outer plate of the kinetochore (PubMed:14738735). The NDC80 complex synergistically enhances the affinity of the SKA1 complex for microtubules and may allow the NDC80 complex to track depolymerizing microtubules (PubMed:23085020).
Mitotic Index 0.1222
Interphase Cluster: #20 (39 genes)
Mitotic Cluster: #11 (44 genes)
sgRNA 1: ACATAGAGGAGGTGAGCCAG (interphase cells: 225, mitotic cells: 5)
sgRNA 2: CCAGAGCCTTCTCAATGCGA (interphase cells: 865, mitotic cells: 137)
sgRNA 3: GGAGGAGGACACCCGTCTGA (interphase cells: 106, mitotic cells: 11)
sgRNA 4: GGTGCCGAGAAGCAGCTGCG (interphase cells: 205, mitotic cells: 42)

Interphase Cluster

Mitotic Cluster

Overview

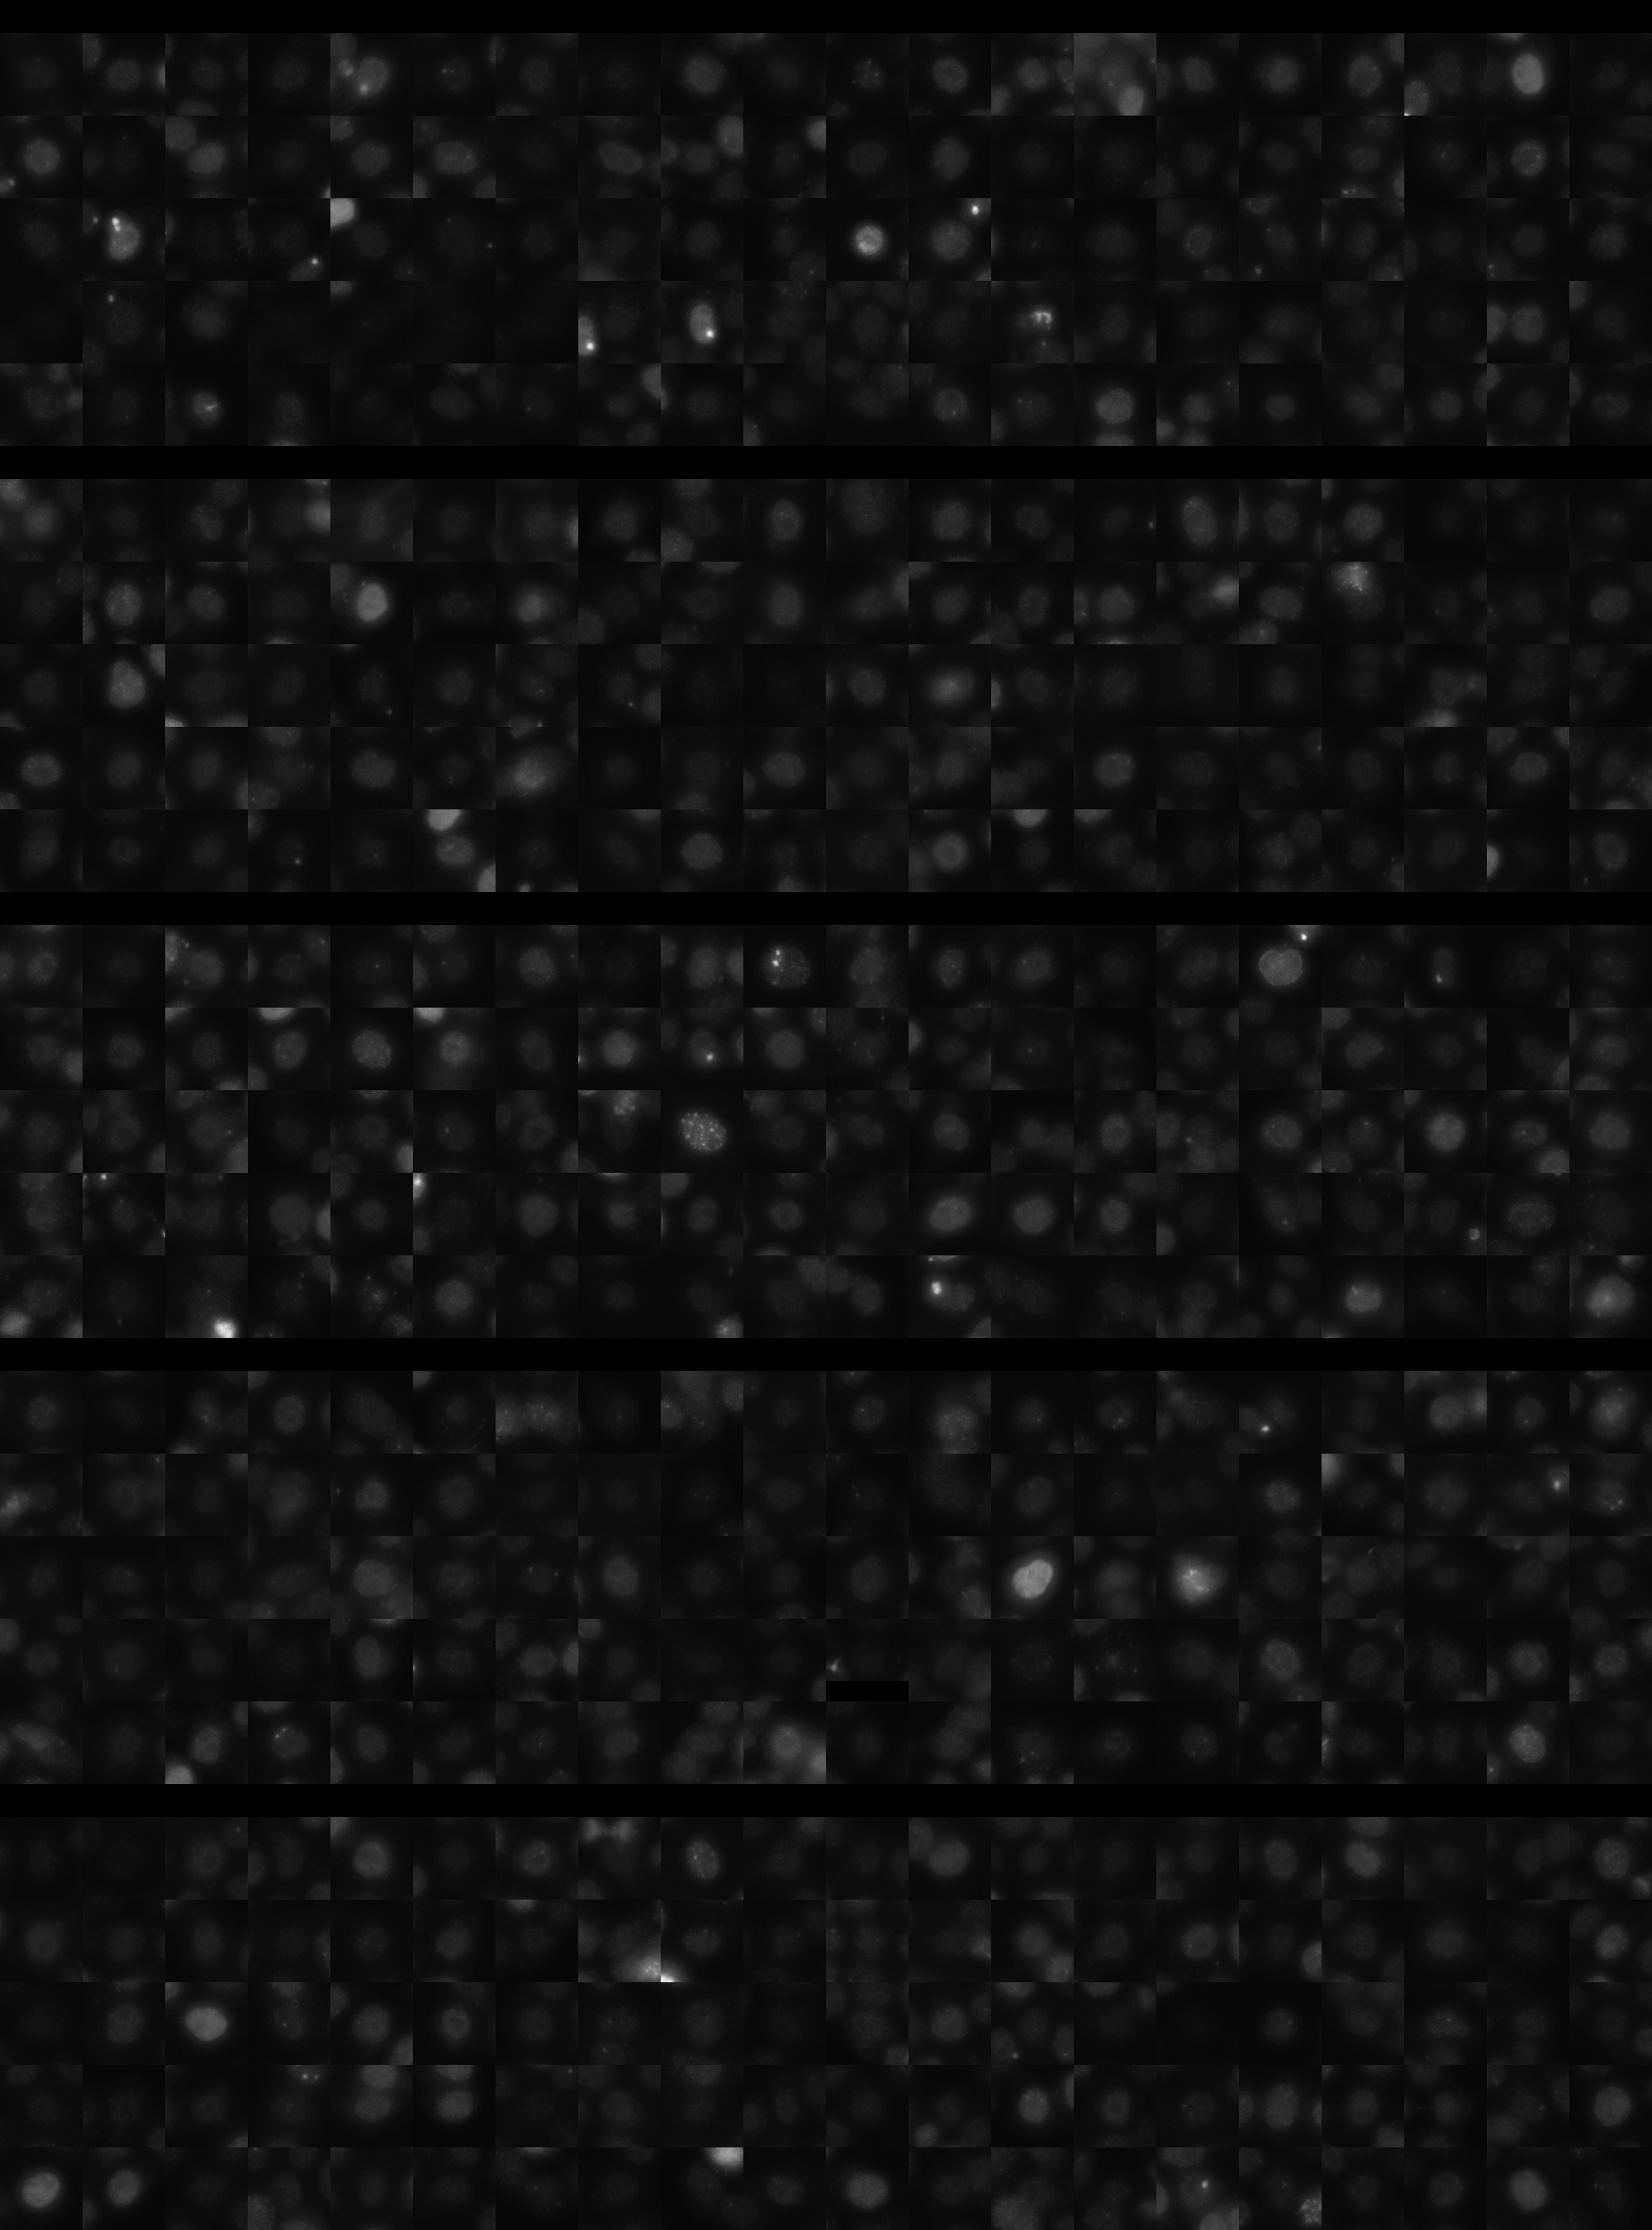
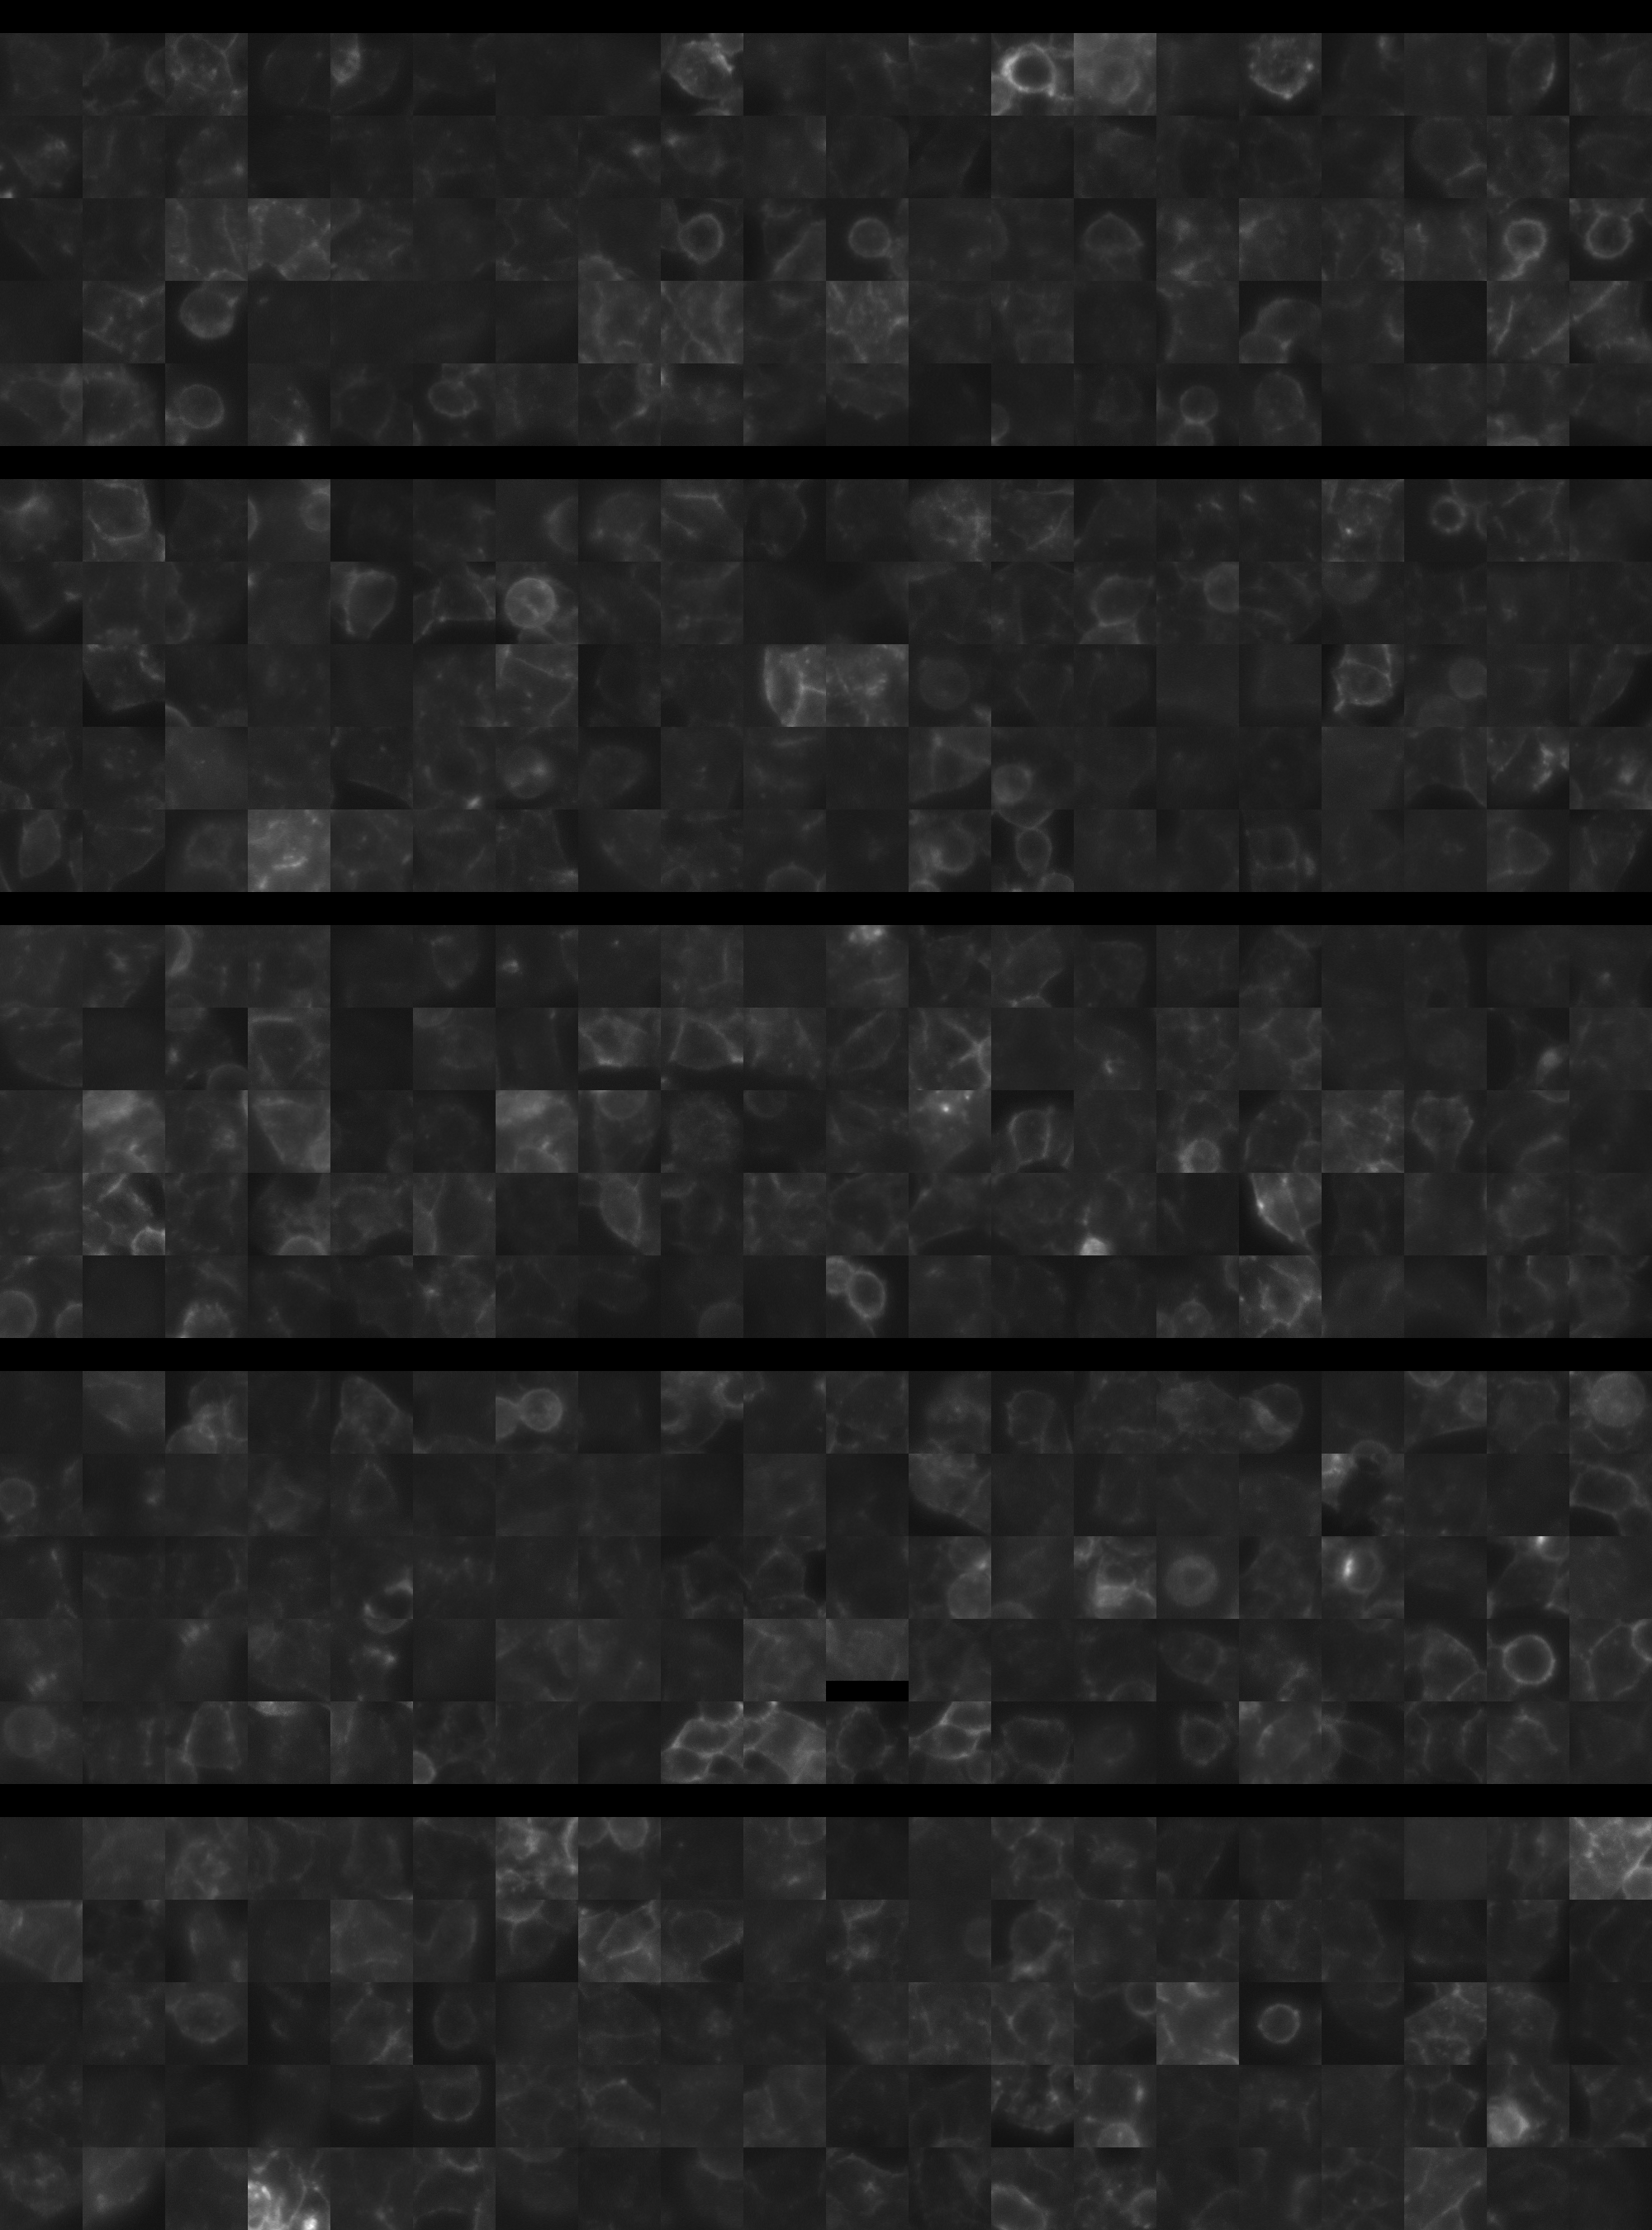
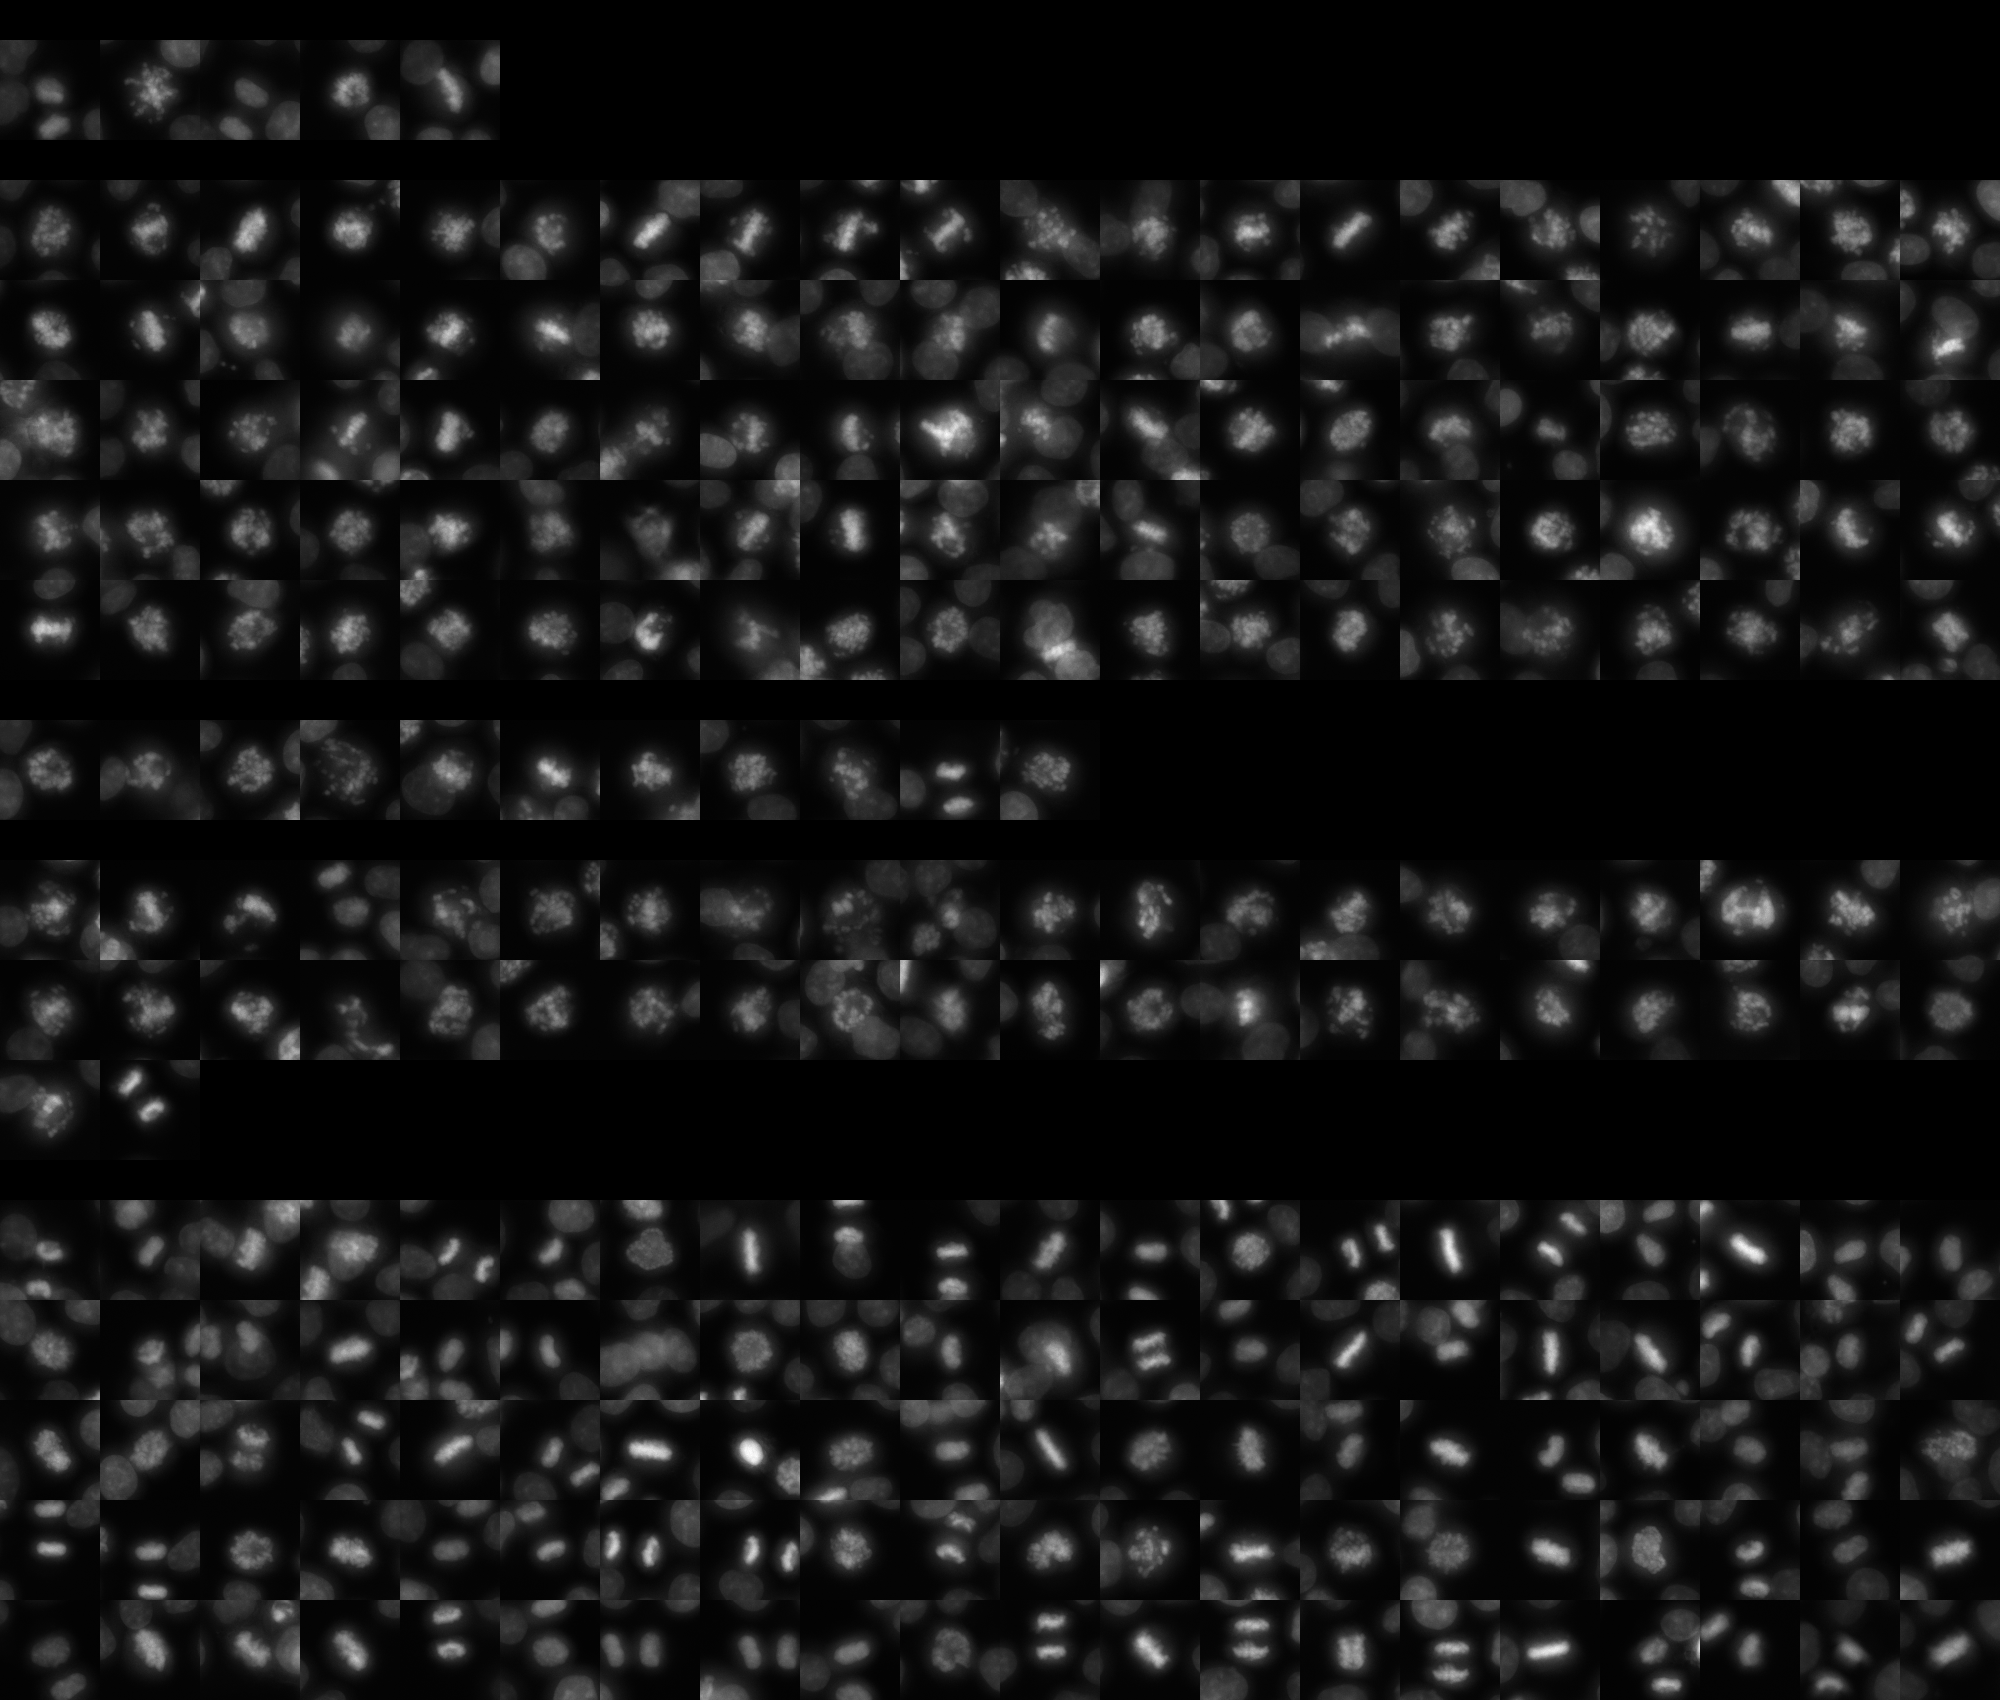
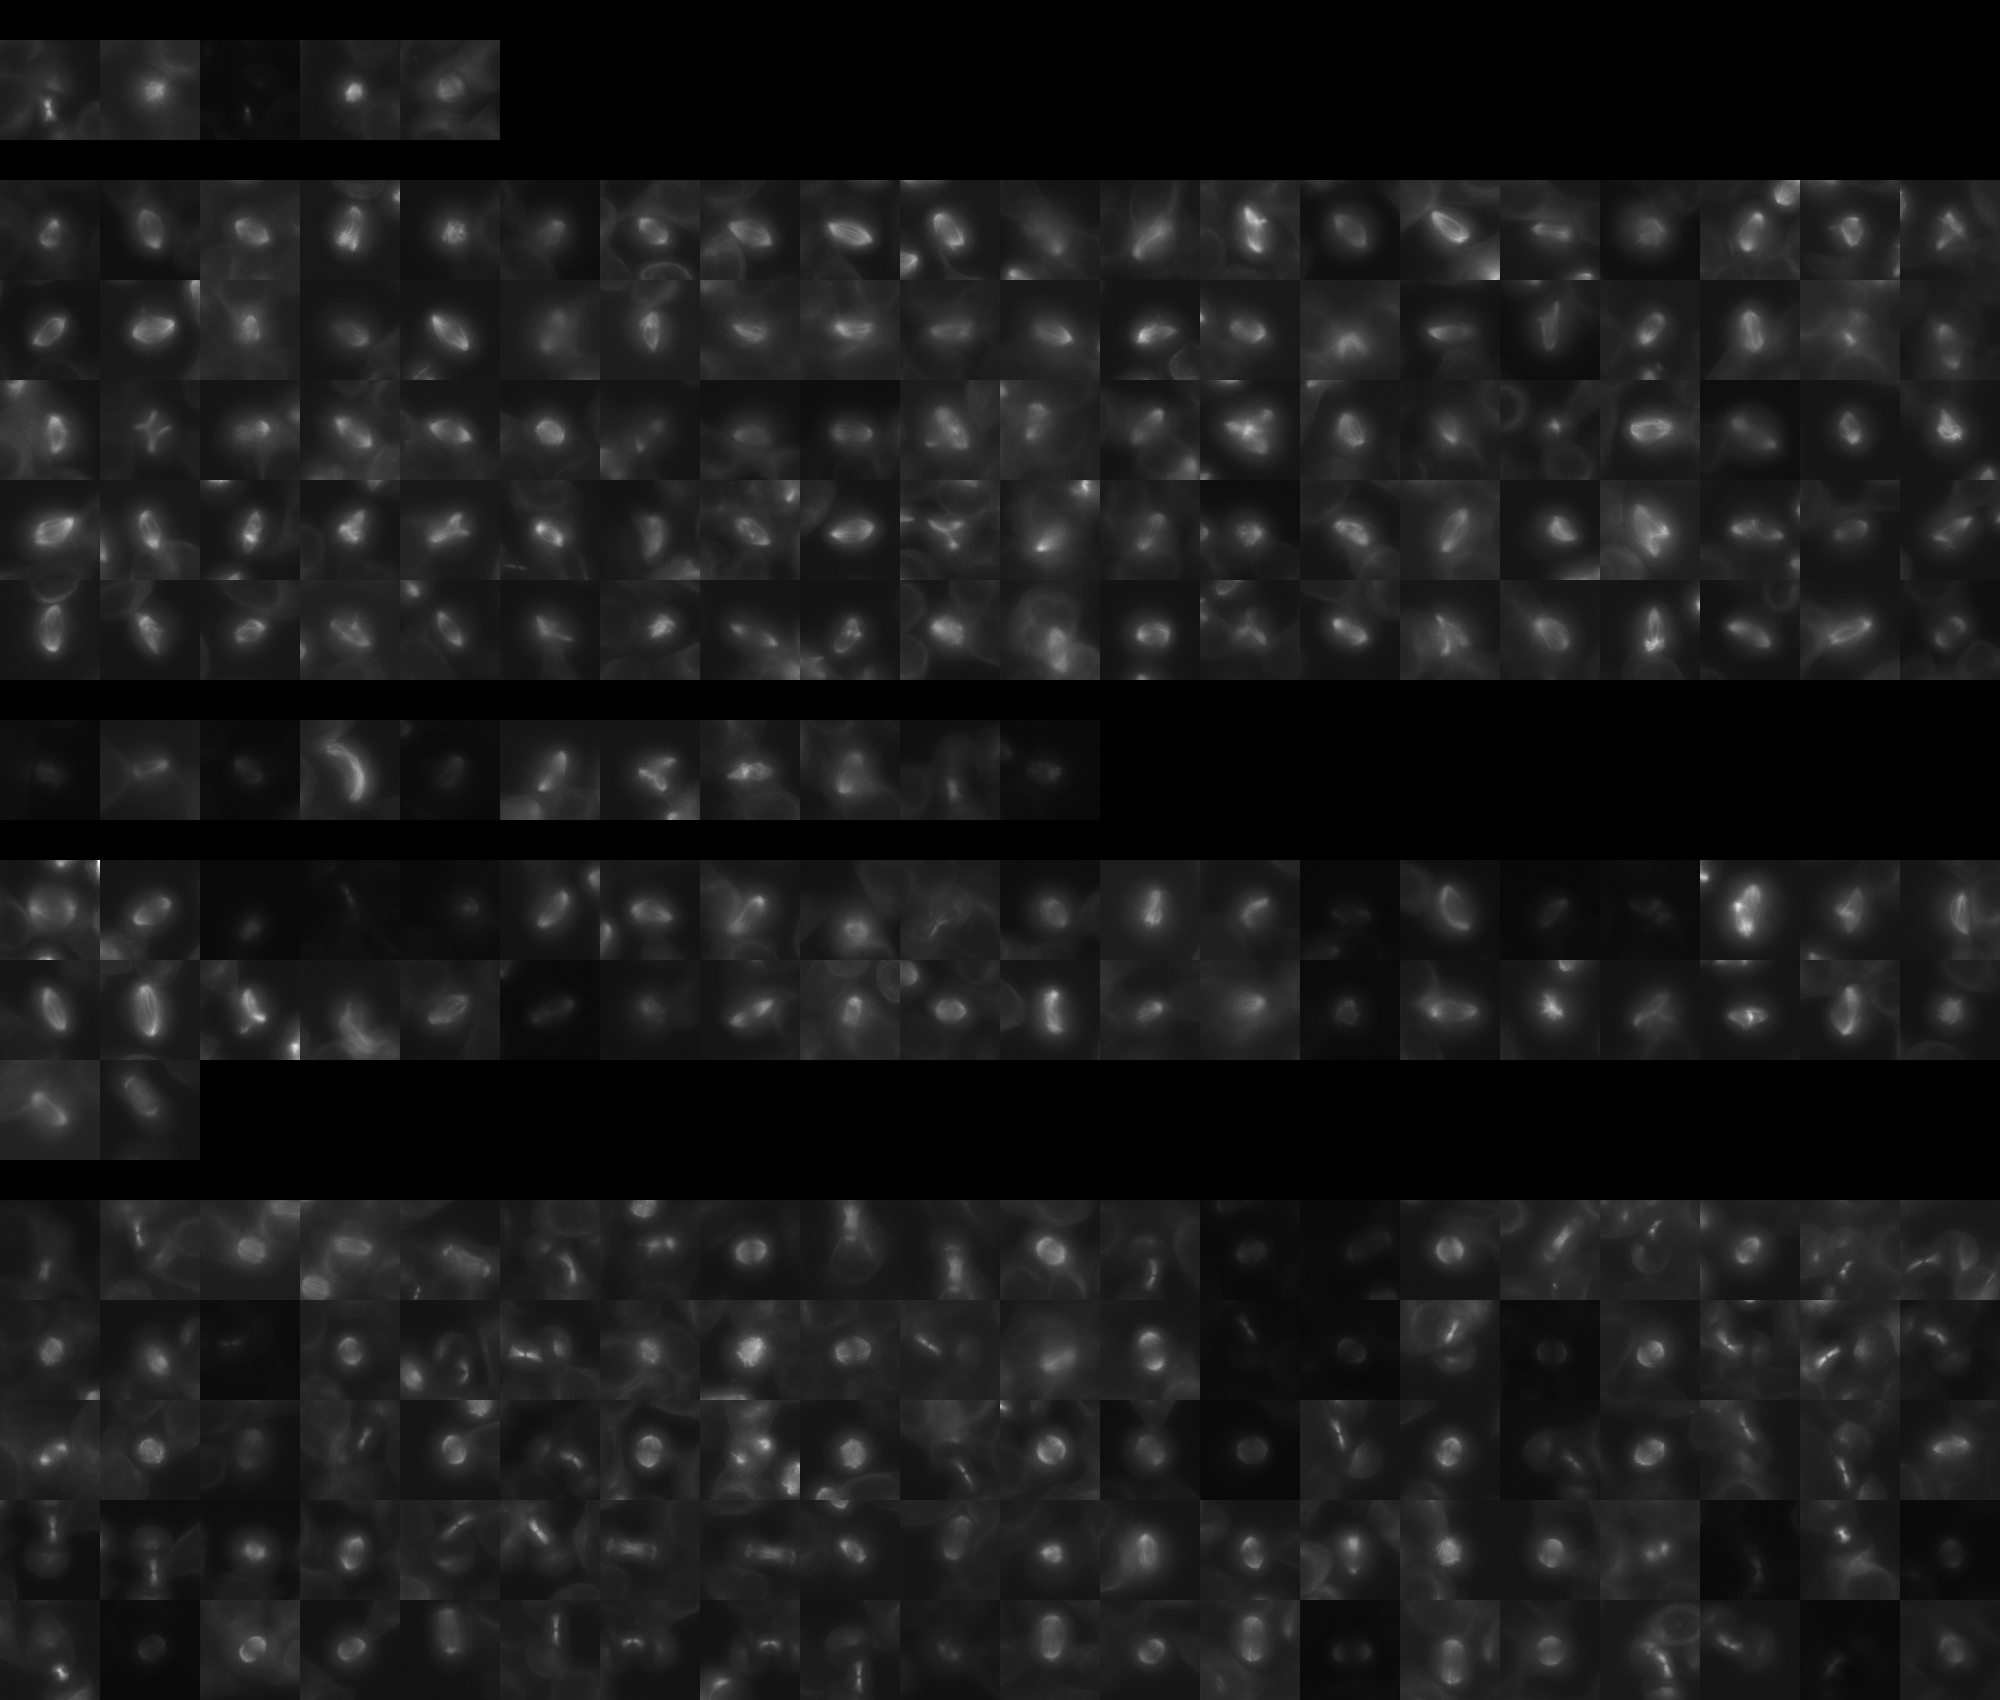
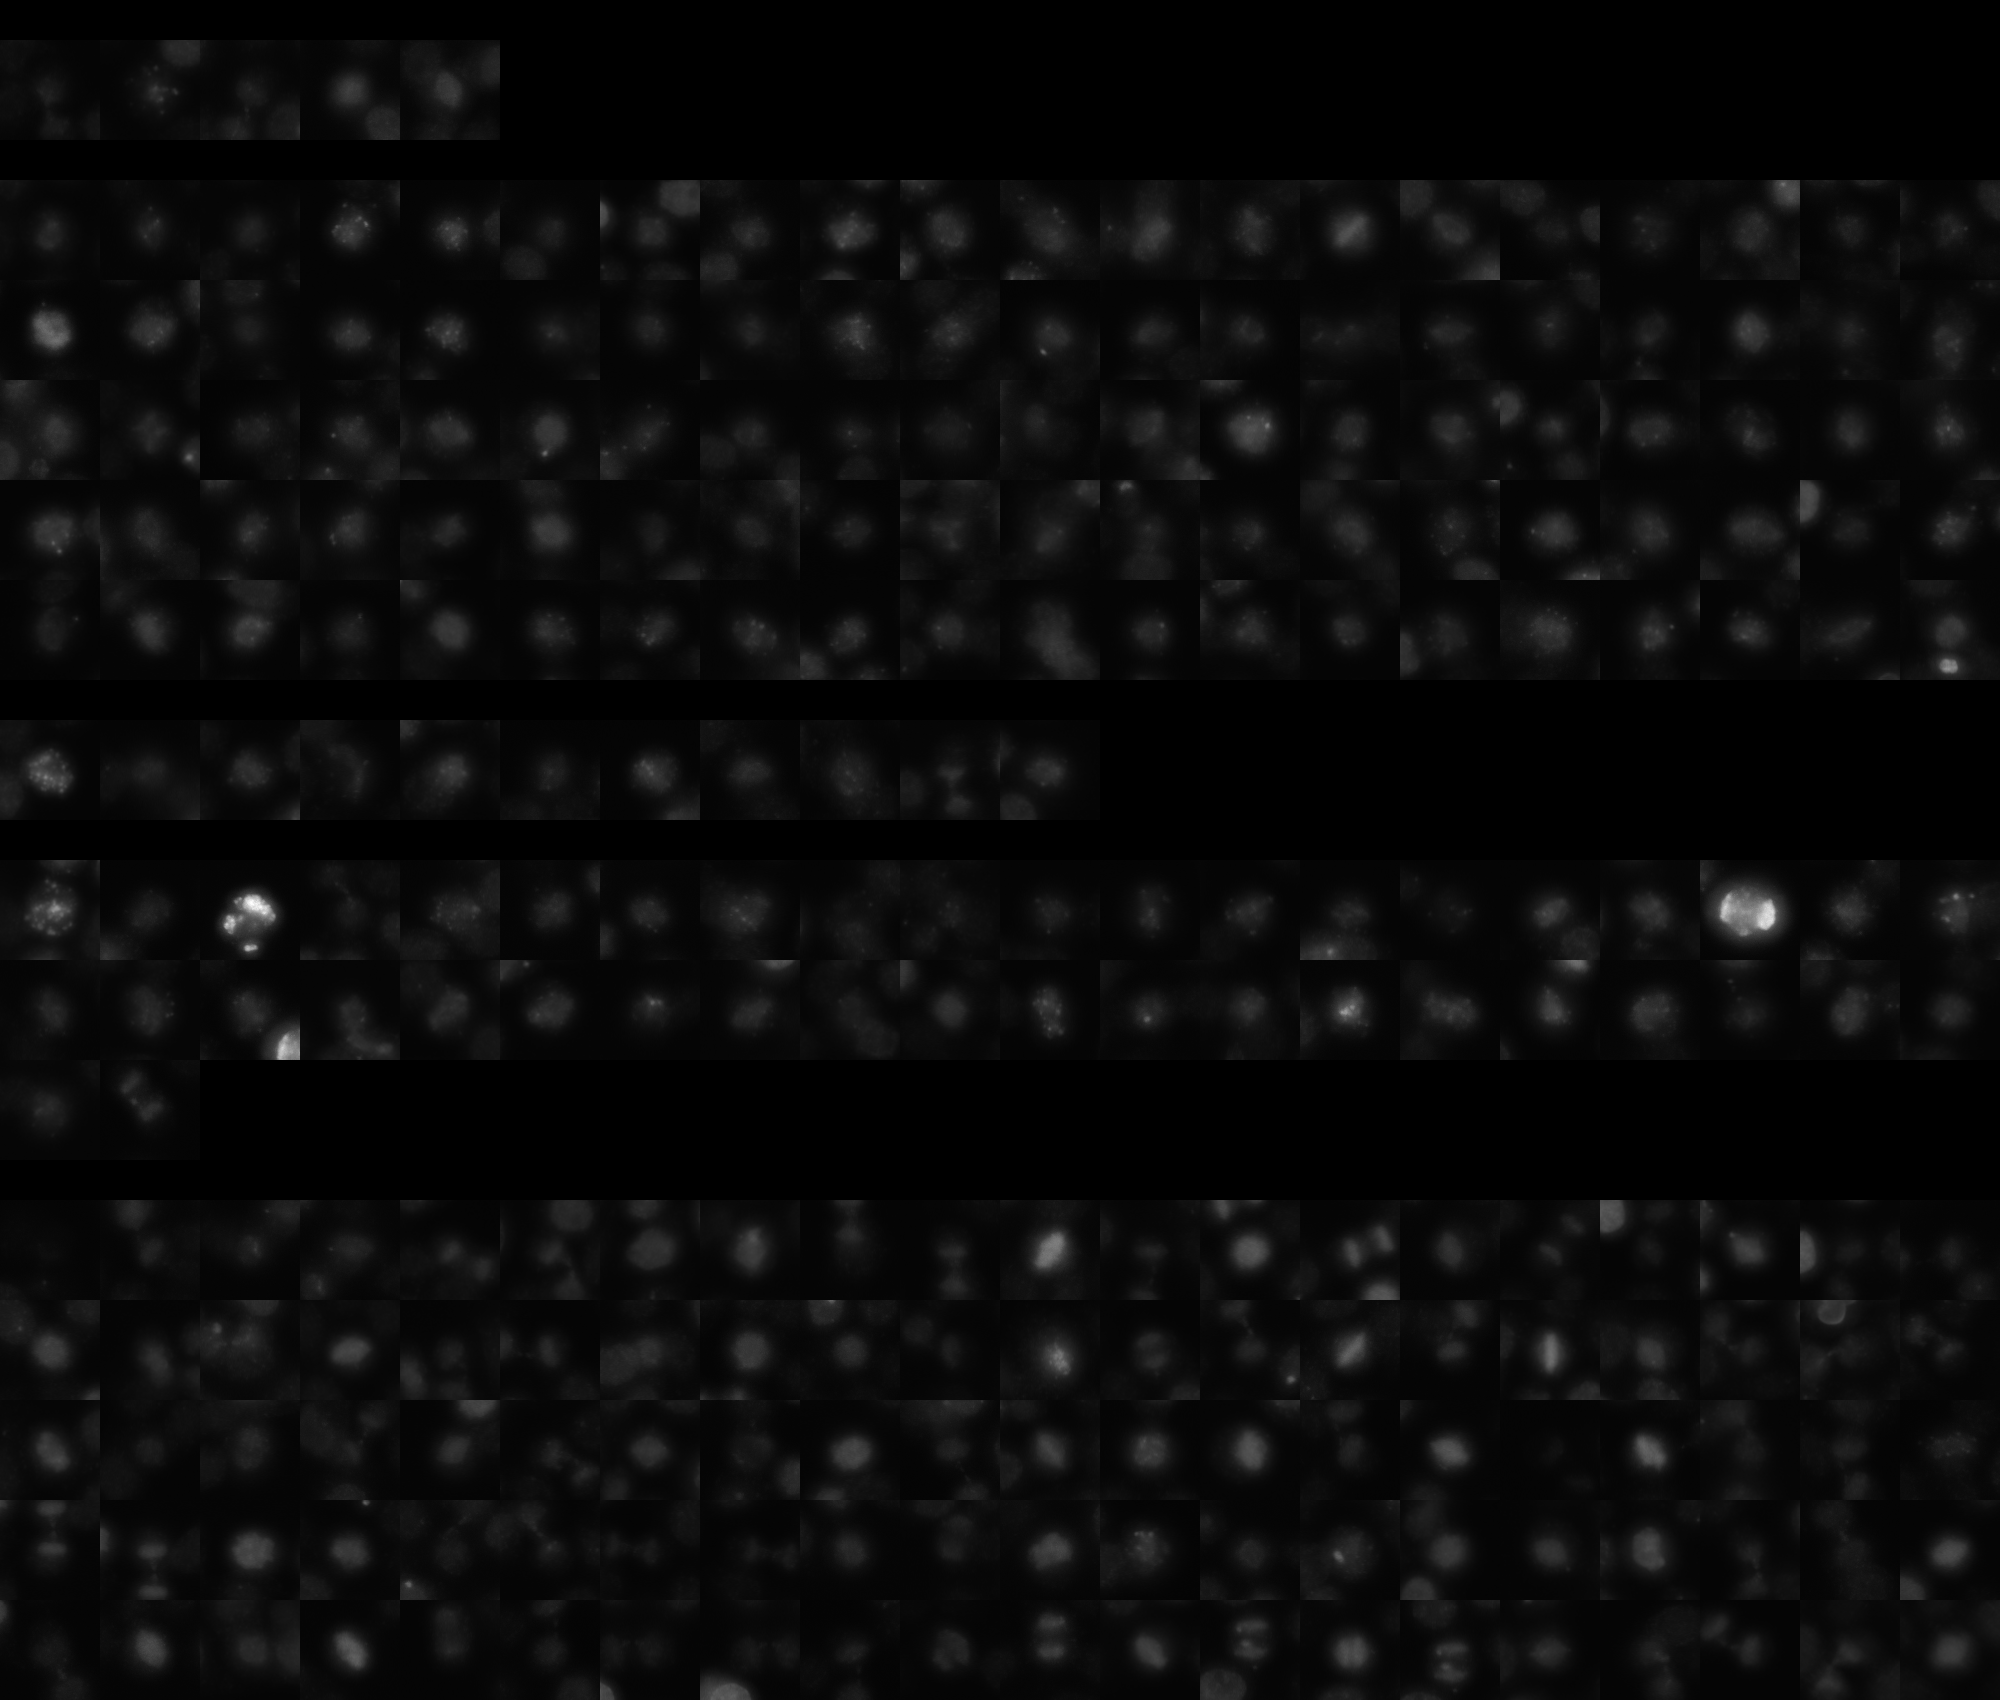
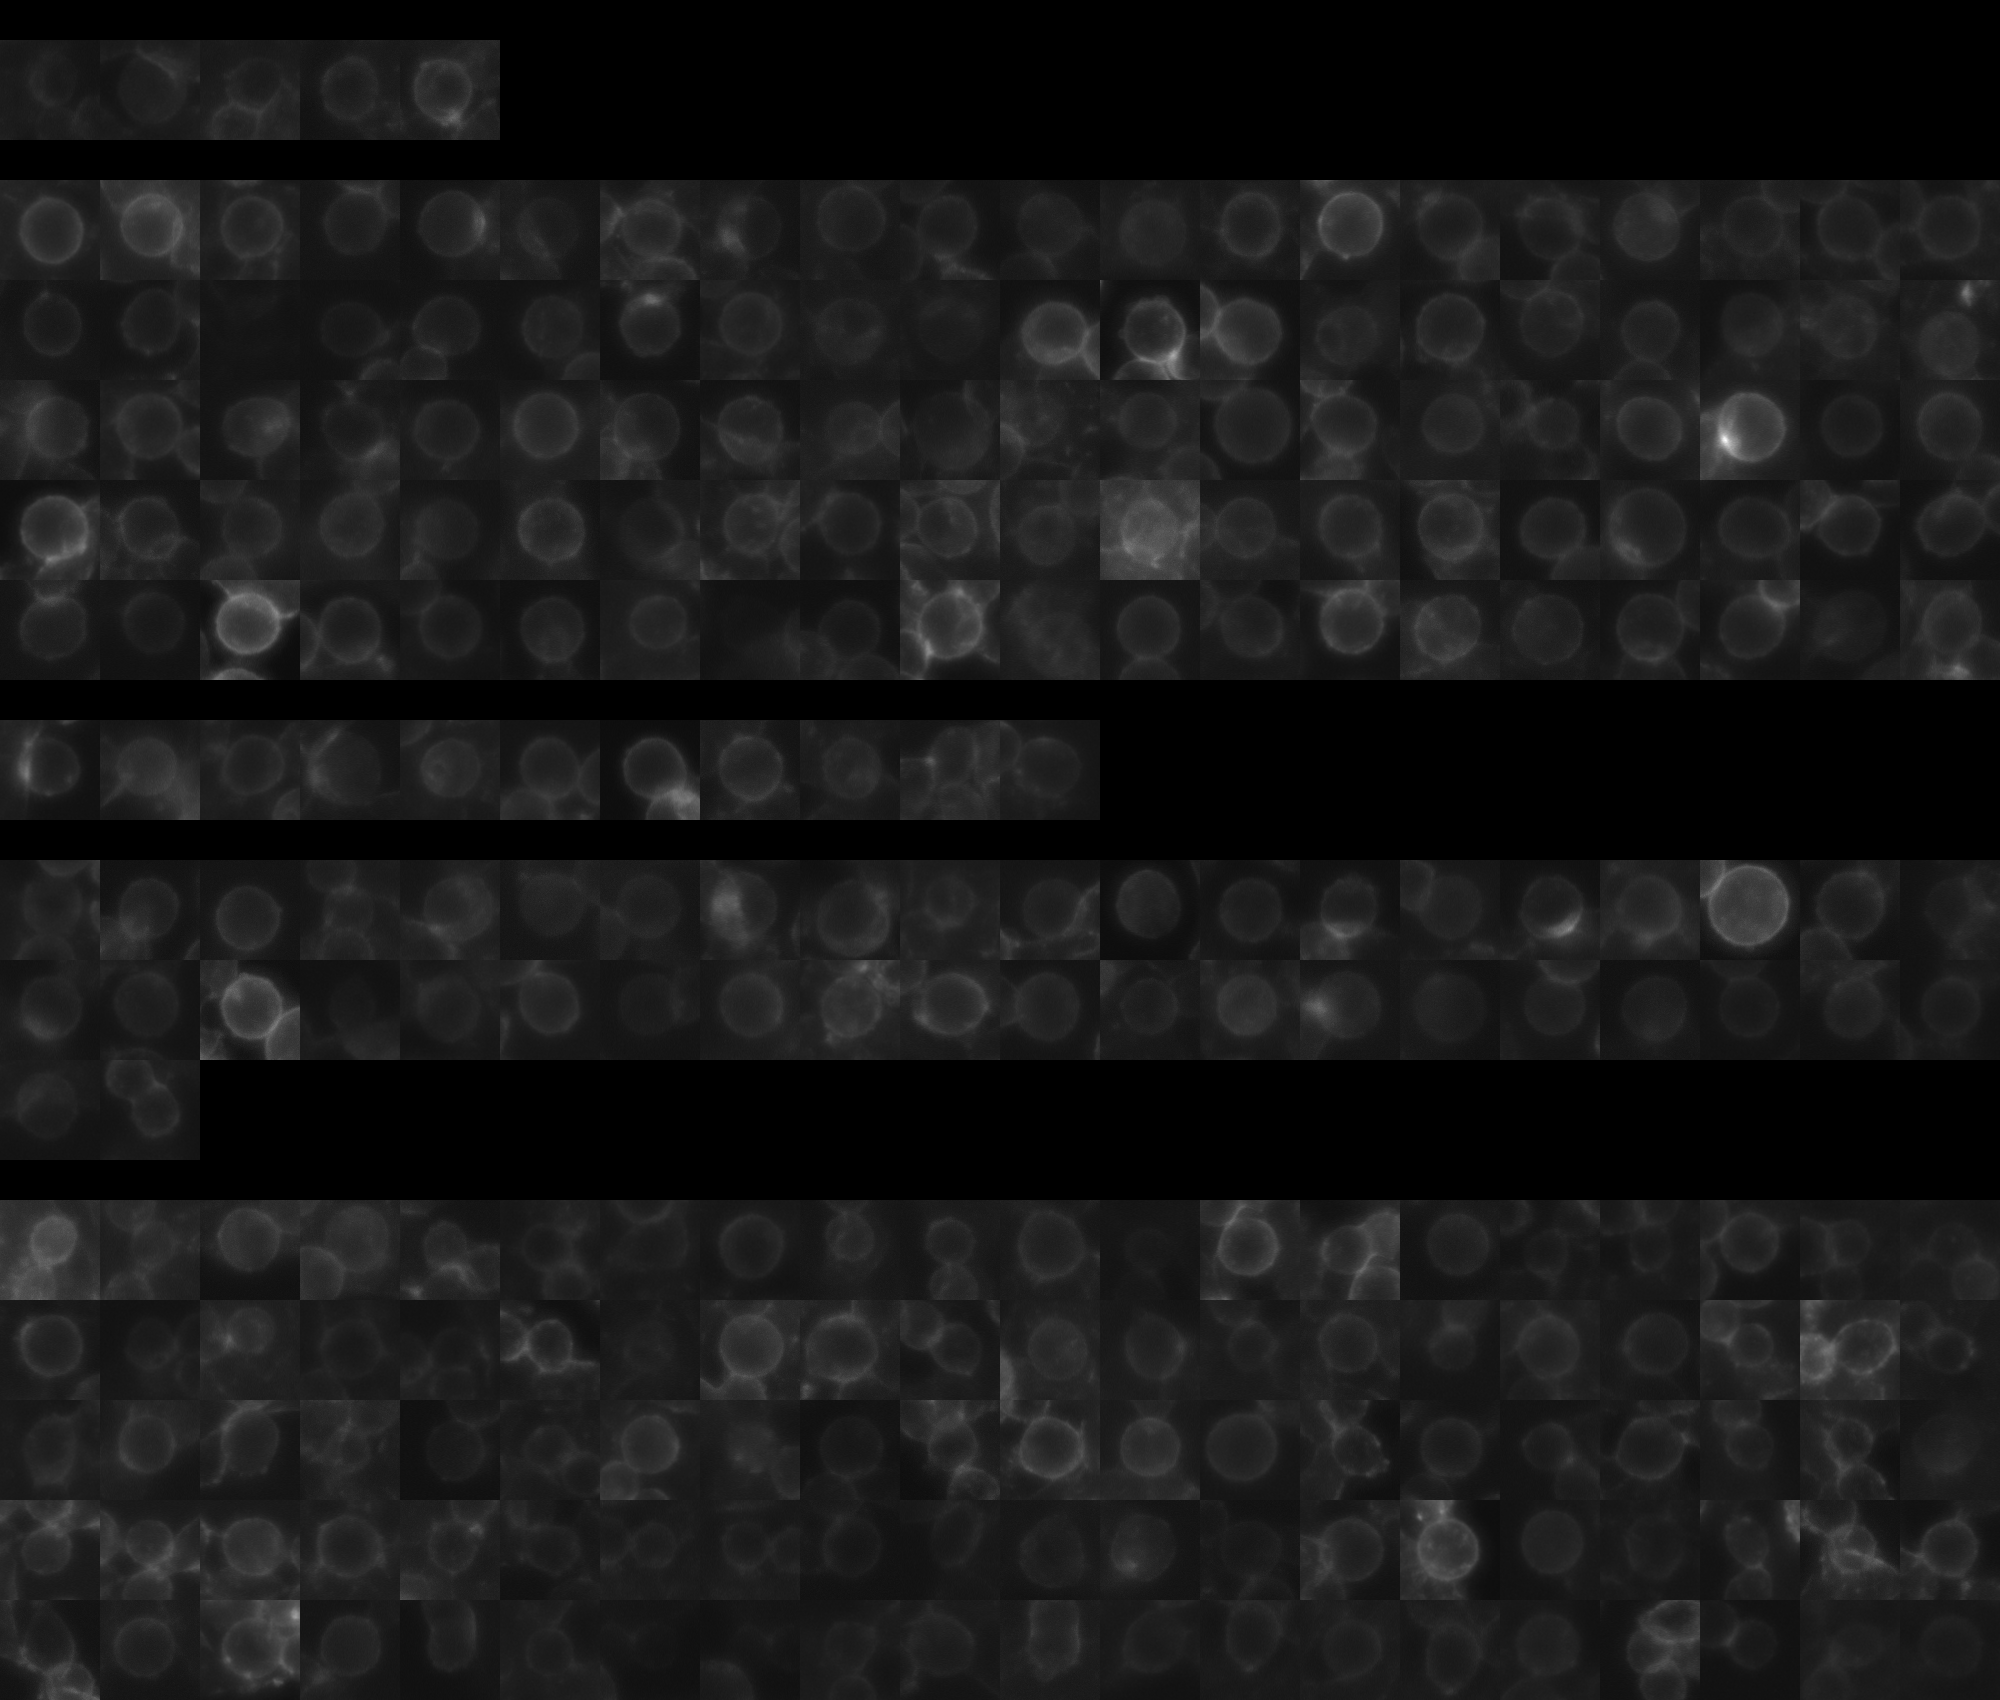
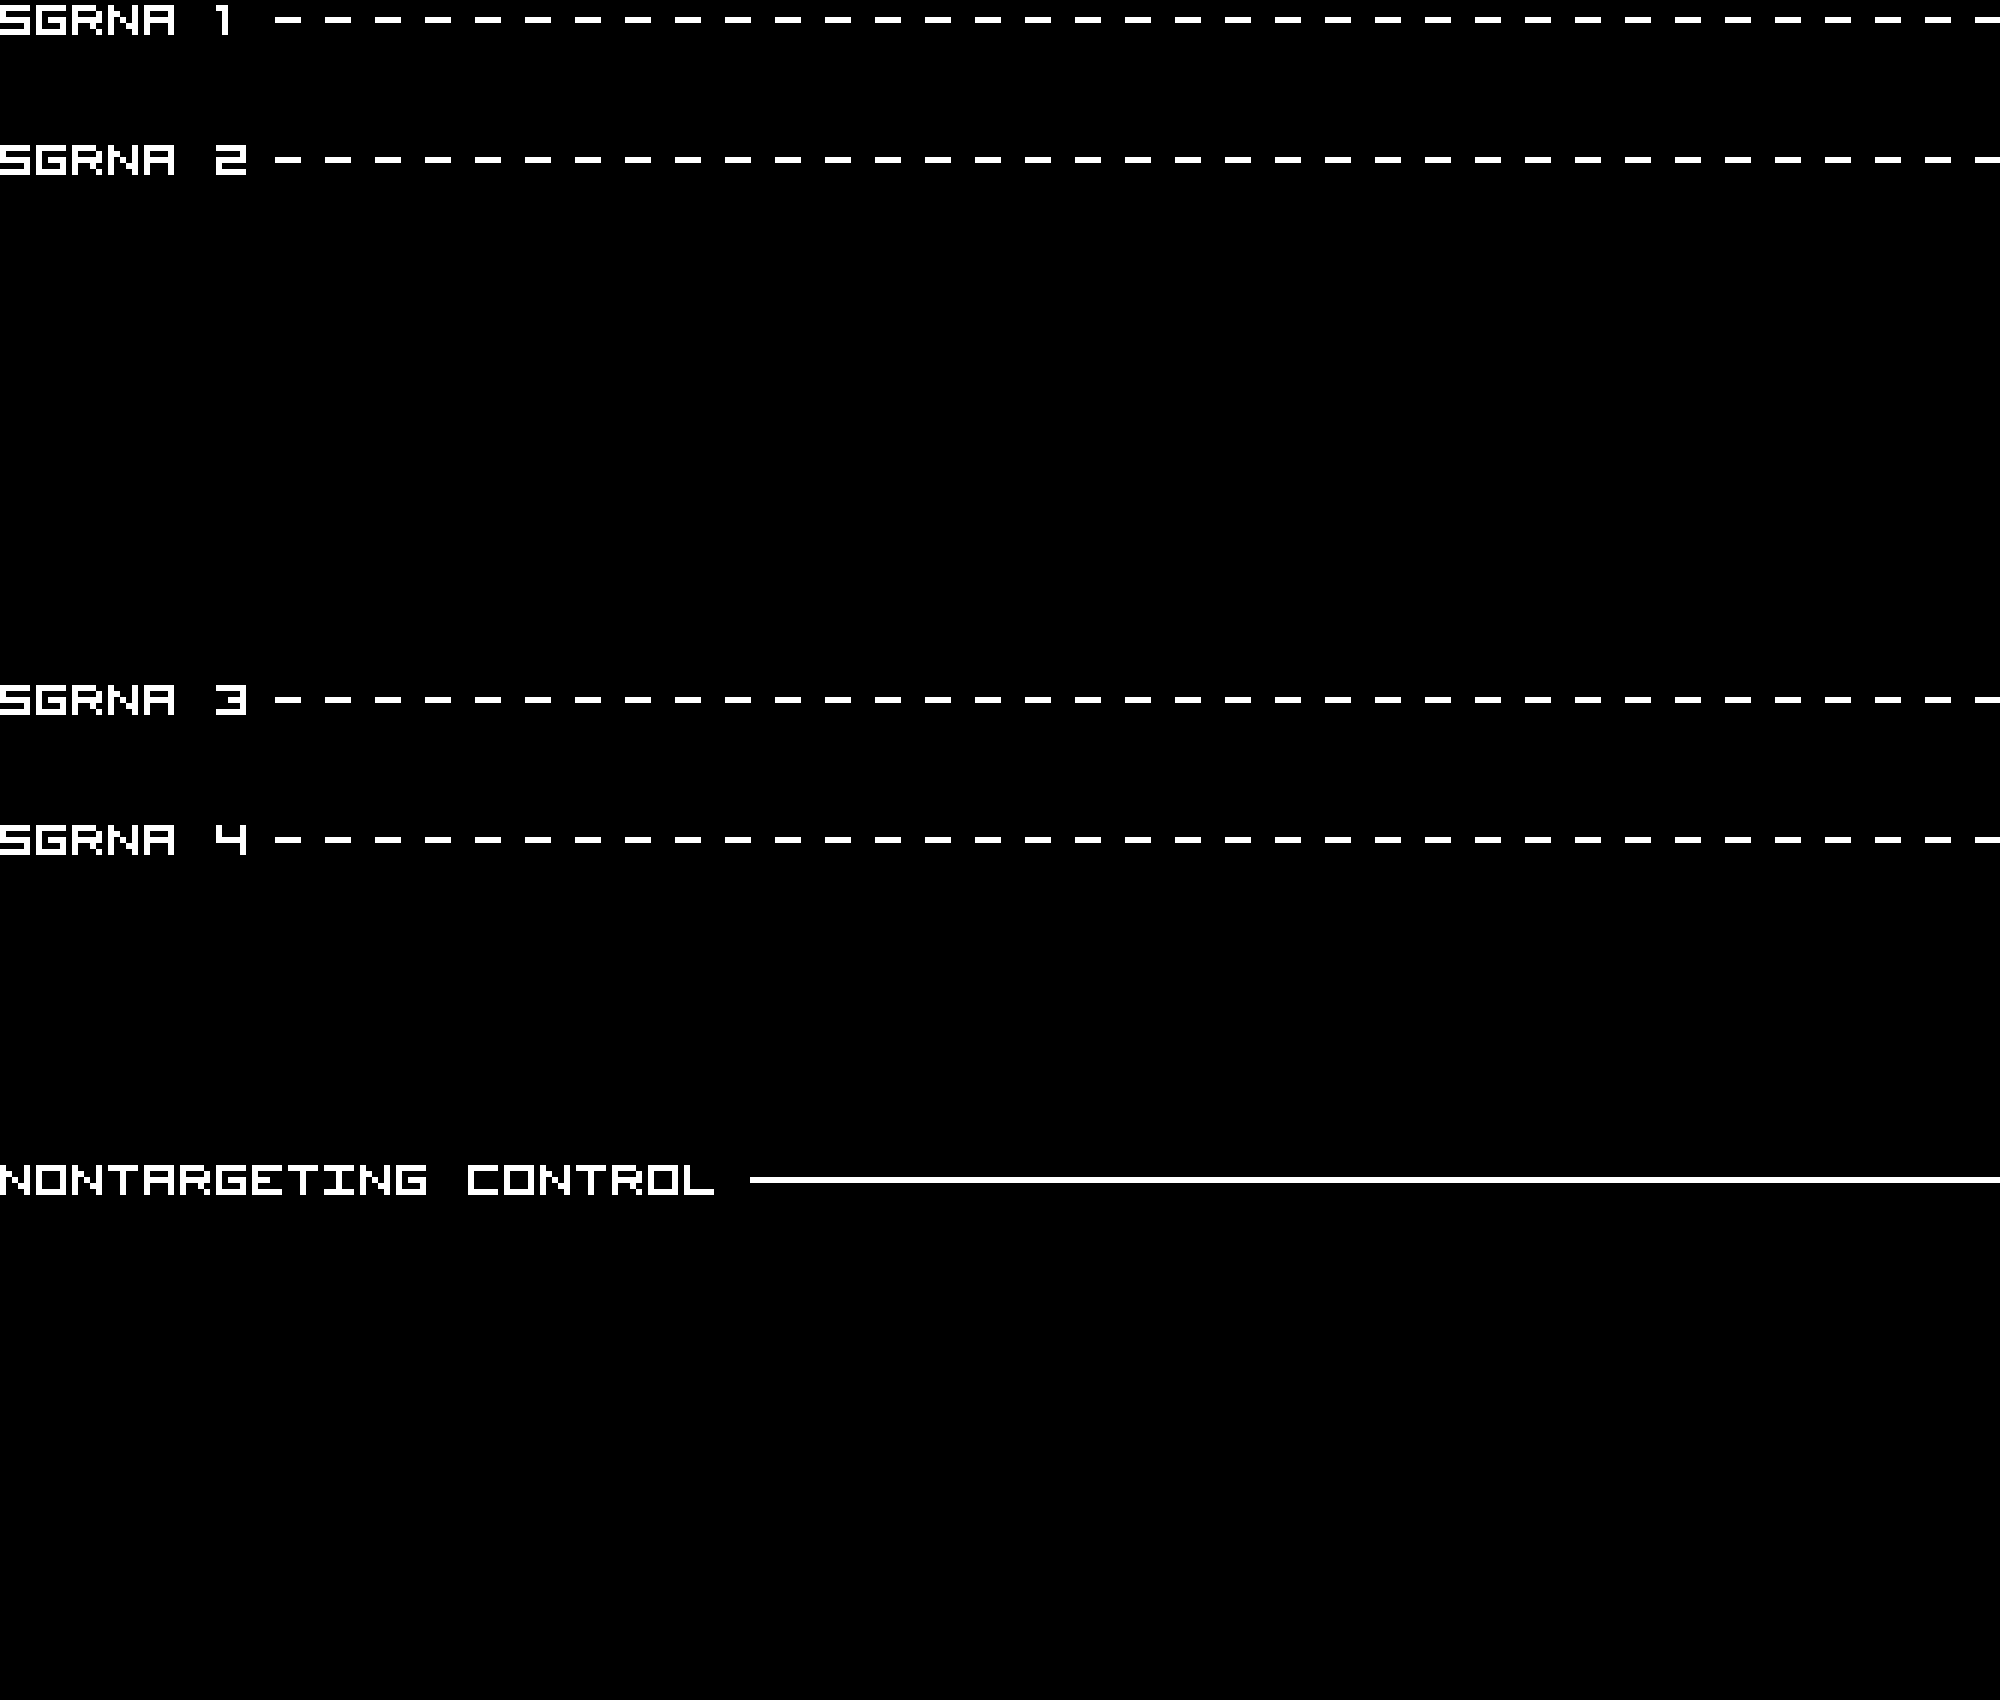
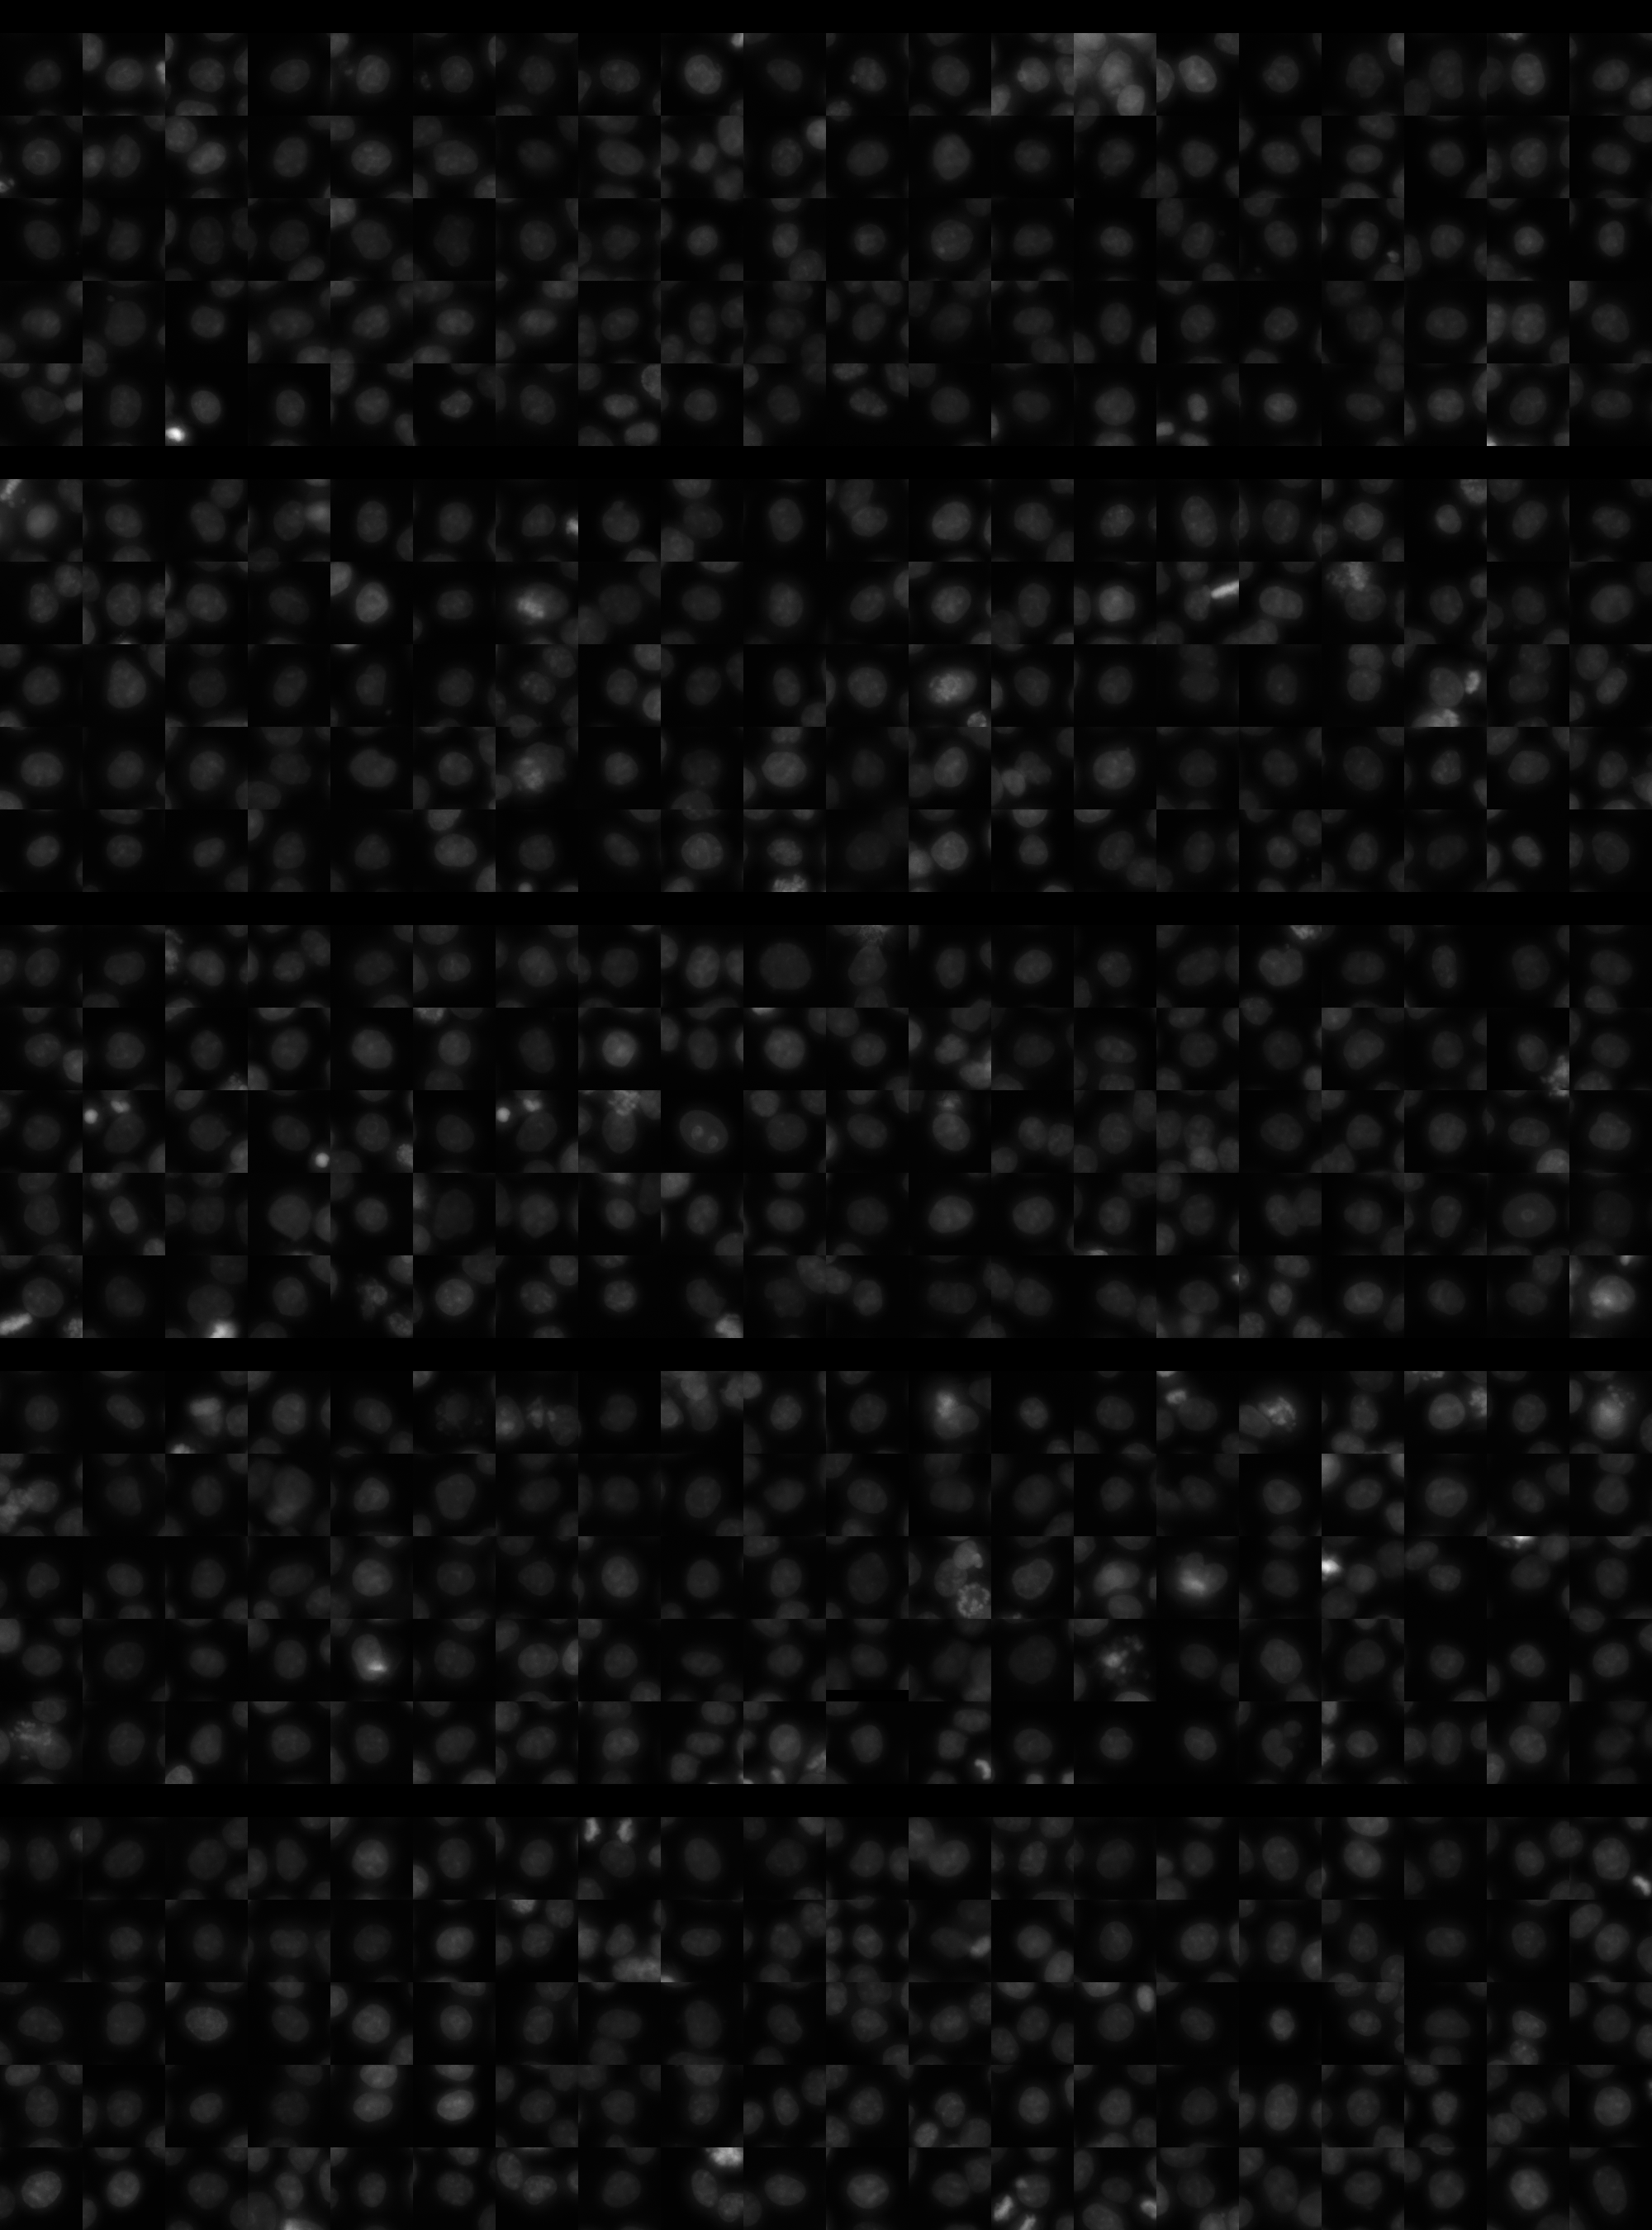
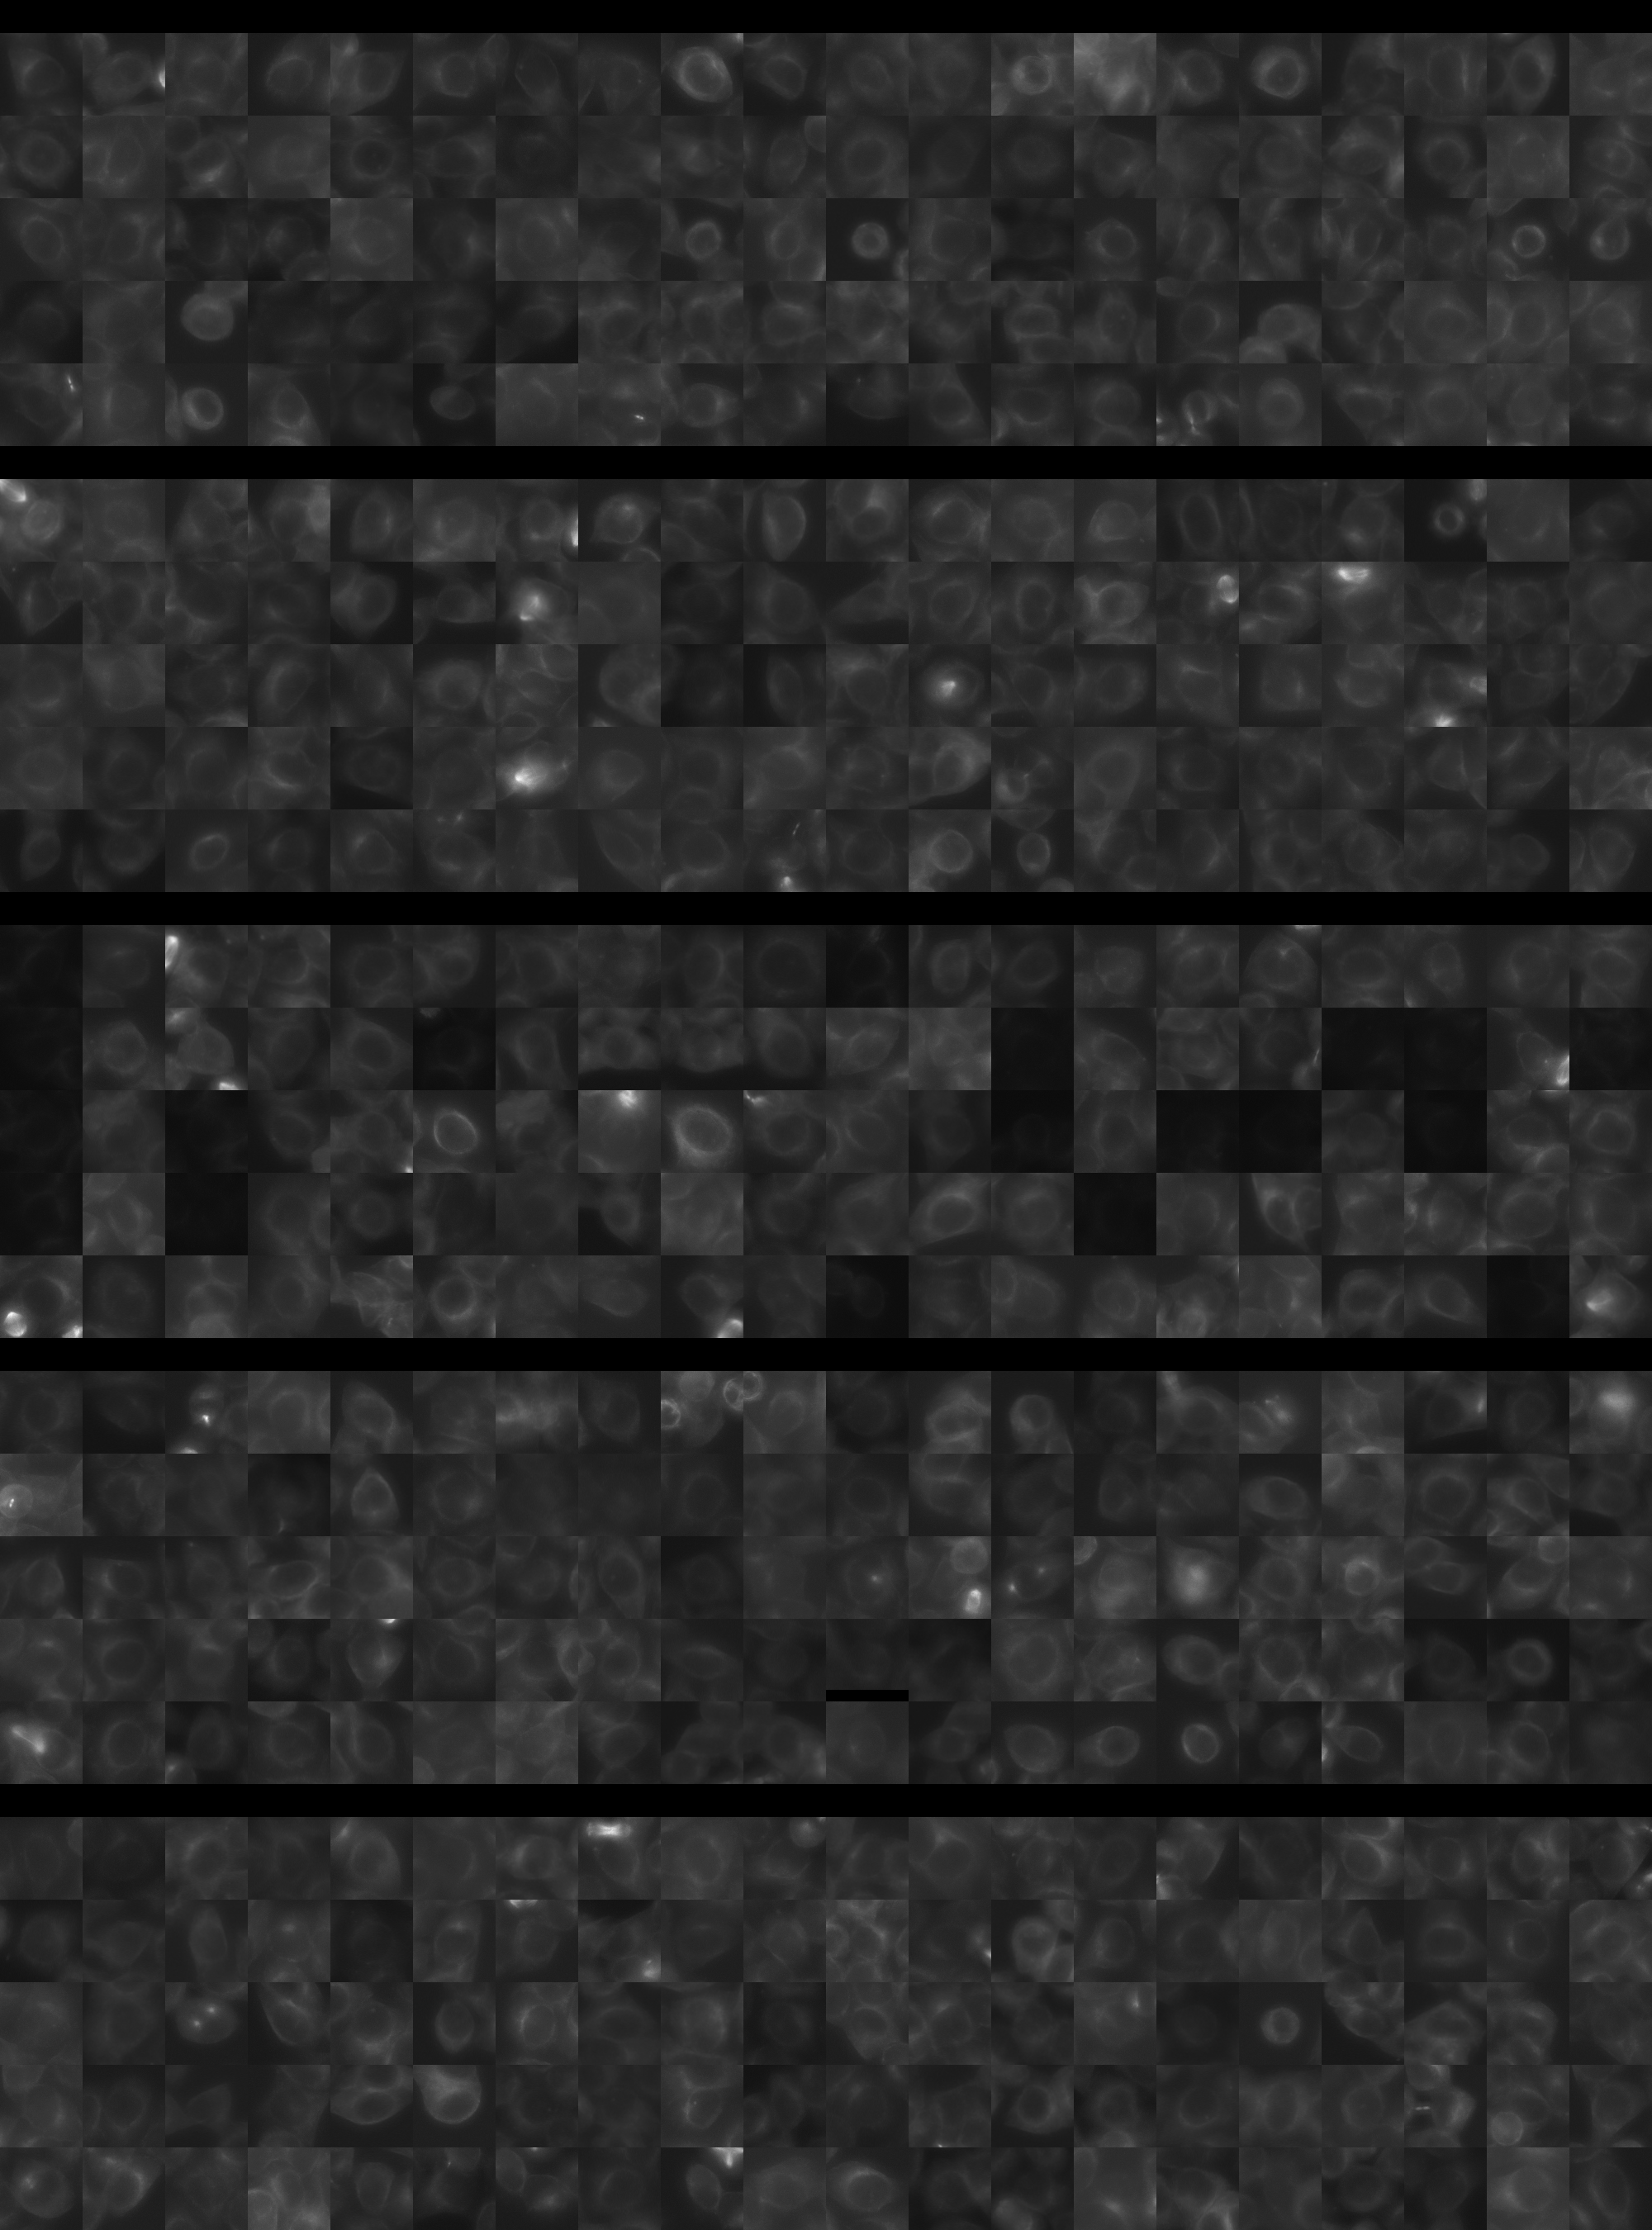
Each montage below shows randomly selected individual cell images for the same target gene separated by sgRNA, along with an example montage of cells expressing a non-targeting negative control sgRNA at the bottom. sgRNA labels in the montages correspond to the numbered sgRNA sequences in the gene info table above. The DNA (blue) and tubulin (green) channels are displayed by default, with gH2AX (grayscale) and actin (yellow) available using the check boxes. Channel brightness, contrast, and opacity are adjustable by clicking the arrow next to the channel name. When only one channel is selected, the display defaults to grayscale. Click the “Zoom” checkbox above the channel controls to enable image zooming (via scrolling) and panning (via click-and-drag).

The cell boxes displayed for this gene are square, 30.36 μm per side for the interphase montage and 30.36 μm per side for the mitotic montage.
Features

Interphase Score Rank FDR q-value
Nucleus DNA Integrated 0.138 263 of 5322 0.132
Nucleus DNA Mean -1.041e-01 4631 of 5322 0.121
Nucleus gH2AX Mean 0.082 2473 of 5322 0.211
Nucleus DNA - gH2AX Correlation -1.033e-01 4054 of 5322 0.055
Nucleus Shape Area 0.131 470 of 5322 0.097
Nucleus Shape Eccentricity 0.034 1571 of 5322 0.708
Nucleus Shape Form Factor -2.361e-01 5249 of 5322 2.872e-04
Nucleus Shape Solidity -1.600e-01 4942 of 5322 0.010
Cell DNA Mass Displacement 0.032 2114 of 5322 0.817
Cell Tubulin Mean 0.049 1158 of 5322 0.528
Cell Tubulin Mass Displacement 0.029 1331 of 5322 0.826
Cell Actin Mean -7.701e-03 3263 of 5322 0.957
Cell Tubulin - Actin Correlation 0.061 1136 of 5322 0.456
Cell DNA - Tubulin Correlation 0.029 2637 of 5322 0.730
Cell Shape Area 0.064 1152 of 5322 0.552
Cell Shape Eccentricity 0.034 1191 of 5322 0.846
Mitotic Score Rank FDR q-value
Nucleus DNA Integrated 0.359 357 of 5322 0.648
Nucleus DNA Mean -4.971e-01 5308 of 5322 0.782
Nucleus DNA Mass Displacement 0.258 427 of 5322 0.999
Nucleus DNA Mean Frac 3 0.917 2 of 5322 0.064
Nucleus gH2AX Mean -1.243e-01 4445 of 5322 1.000
Nucleus gH2AX Mean Frac 0 0.096 1009 of 5322 1.000
Nucleus Tubulin Mean Frac 0 0.464 101 of 5322 0.652
Nucleus Tubulin Mean Edge -9.707e-02 4319 of 5322 0.999
Nucleus Tubulin Std Edge -3.641e-01 5059 of 5322 0.688
Nucleus Shape Area 1.091 19 of 5322 0.001
Nucleus Shape Eccentricity -9.791e-01 5307 of 5322 0.063
Nucleus Shape Form Factor -9.581e-01 5314 of 5322 0.061
Cell Tubulin Mean 0.656 38 of 5322 0.146
Cell Tubulin Mean Frac 3 -6.788e-01 5291 of 5322 0.066
Cell Actin Mean 0.148 1321 of 5322 0.997
Cell Shape Area 0.618 110 of 5322 0.271
( Reset Zoom )
Brightness
Contrast
Opacity
Brightness
Contrast
Opacity
Brightness
Contrast
Opacity
Brightness
Contrast
Opacity
Brightness
Contrast
Opacity

( Reset Zoom )
Brightness
Contrast
Opacity
Brightness
Contrast
Opacity
Brightness
Contrast
Opacity
Brightness
Contrast
Opacity
Brightness
Contrast
Opacity

MIT Central Accessability