SPACA7

Due to sgRNA sequence design constraints two or more of the sgRNAs used to target this gene have multiple genomic target sites, potentially impacting the observed phenotype through increased DNA damage.
Gene symbol: SPACA7
Gene: 122258
Uniprot Function: Involved in fertilization. Seems not to play a direct role in sperm-egg binding or gamete fusion.
Mitotic Index 0.0281
Interphase Cluster: #59 (30 genes)
Mitotic Cluster: #36 (32 genes)
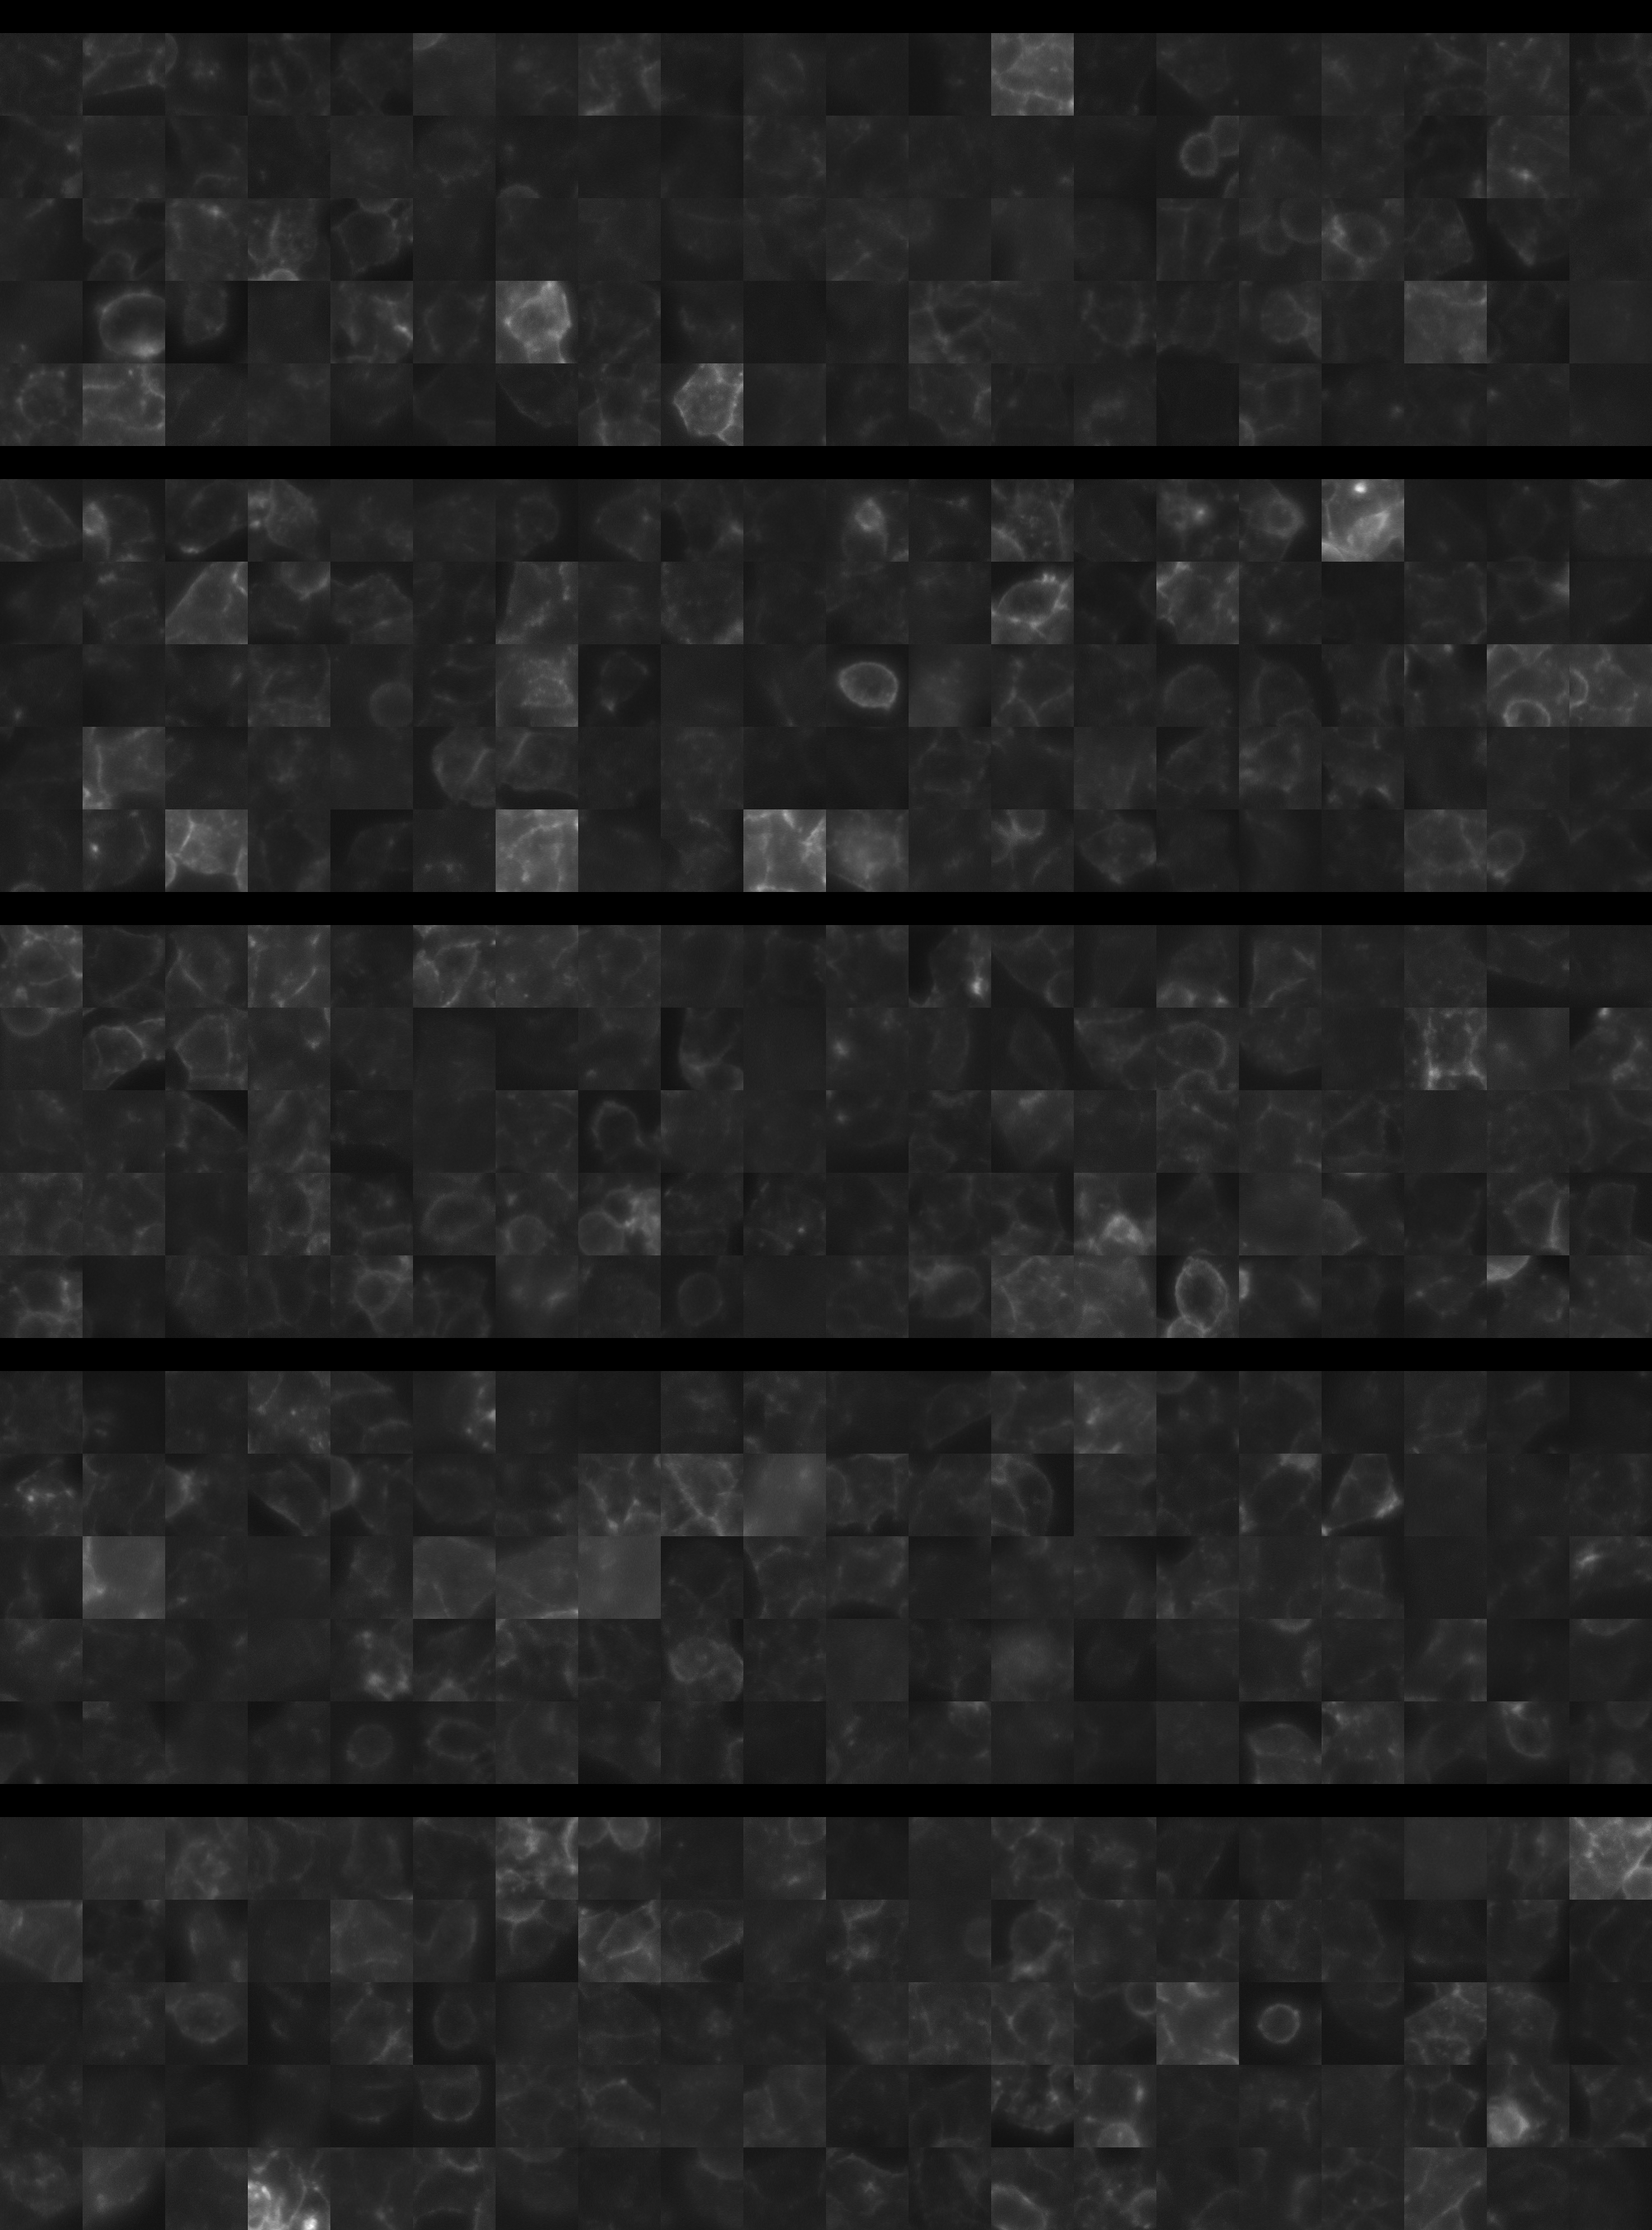
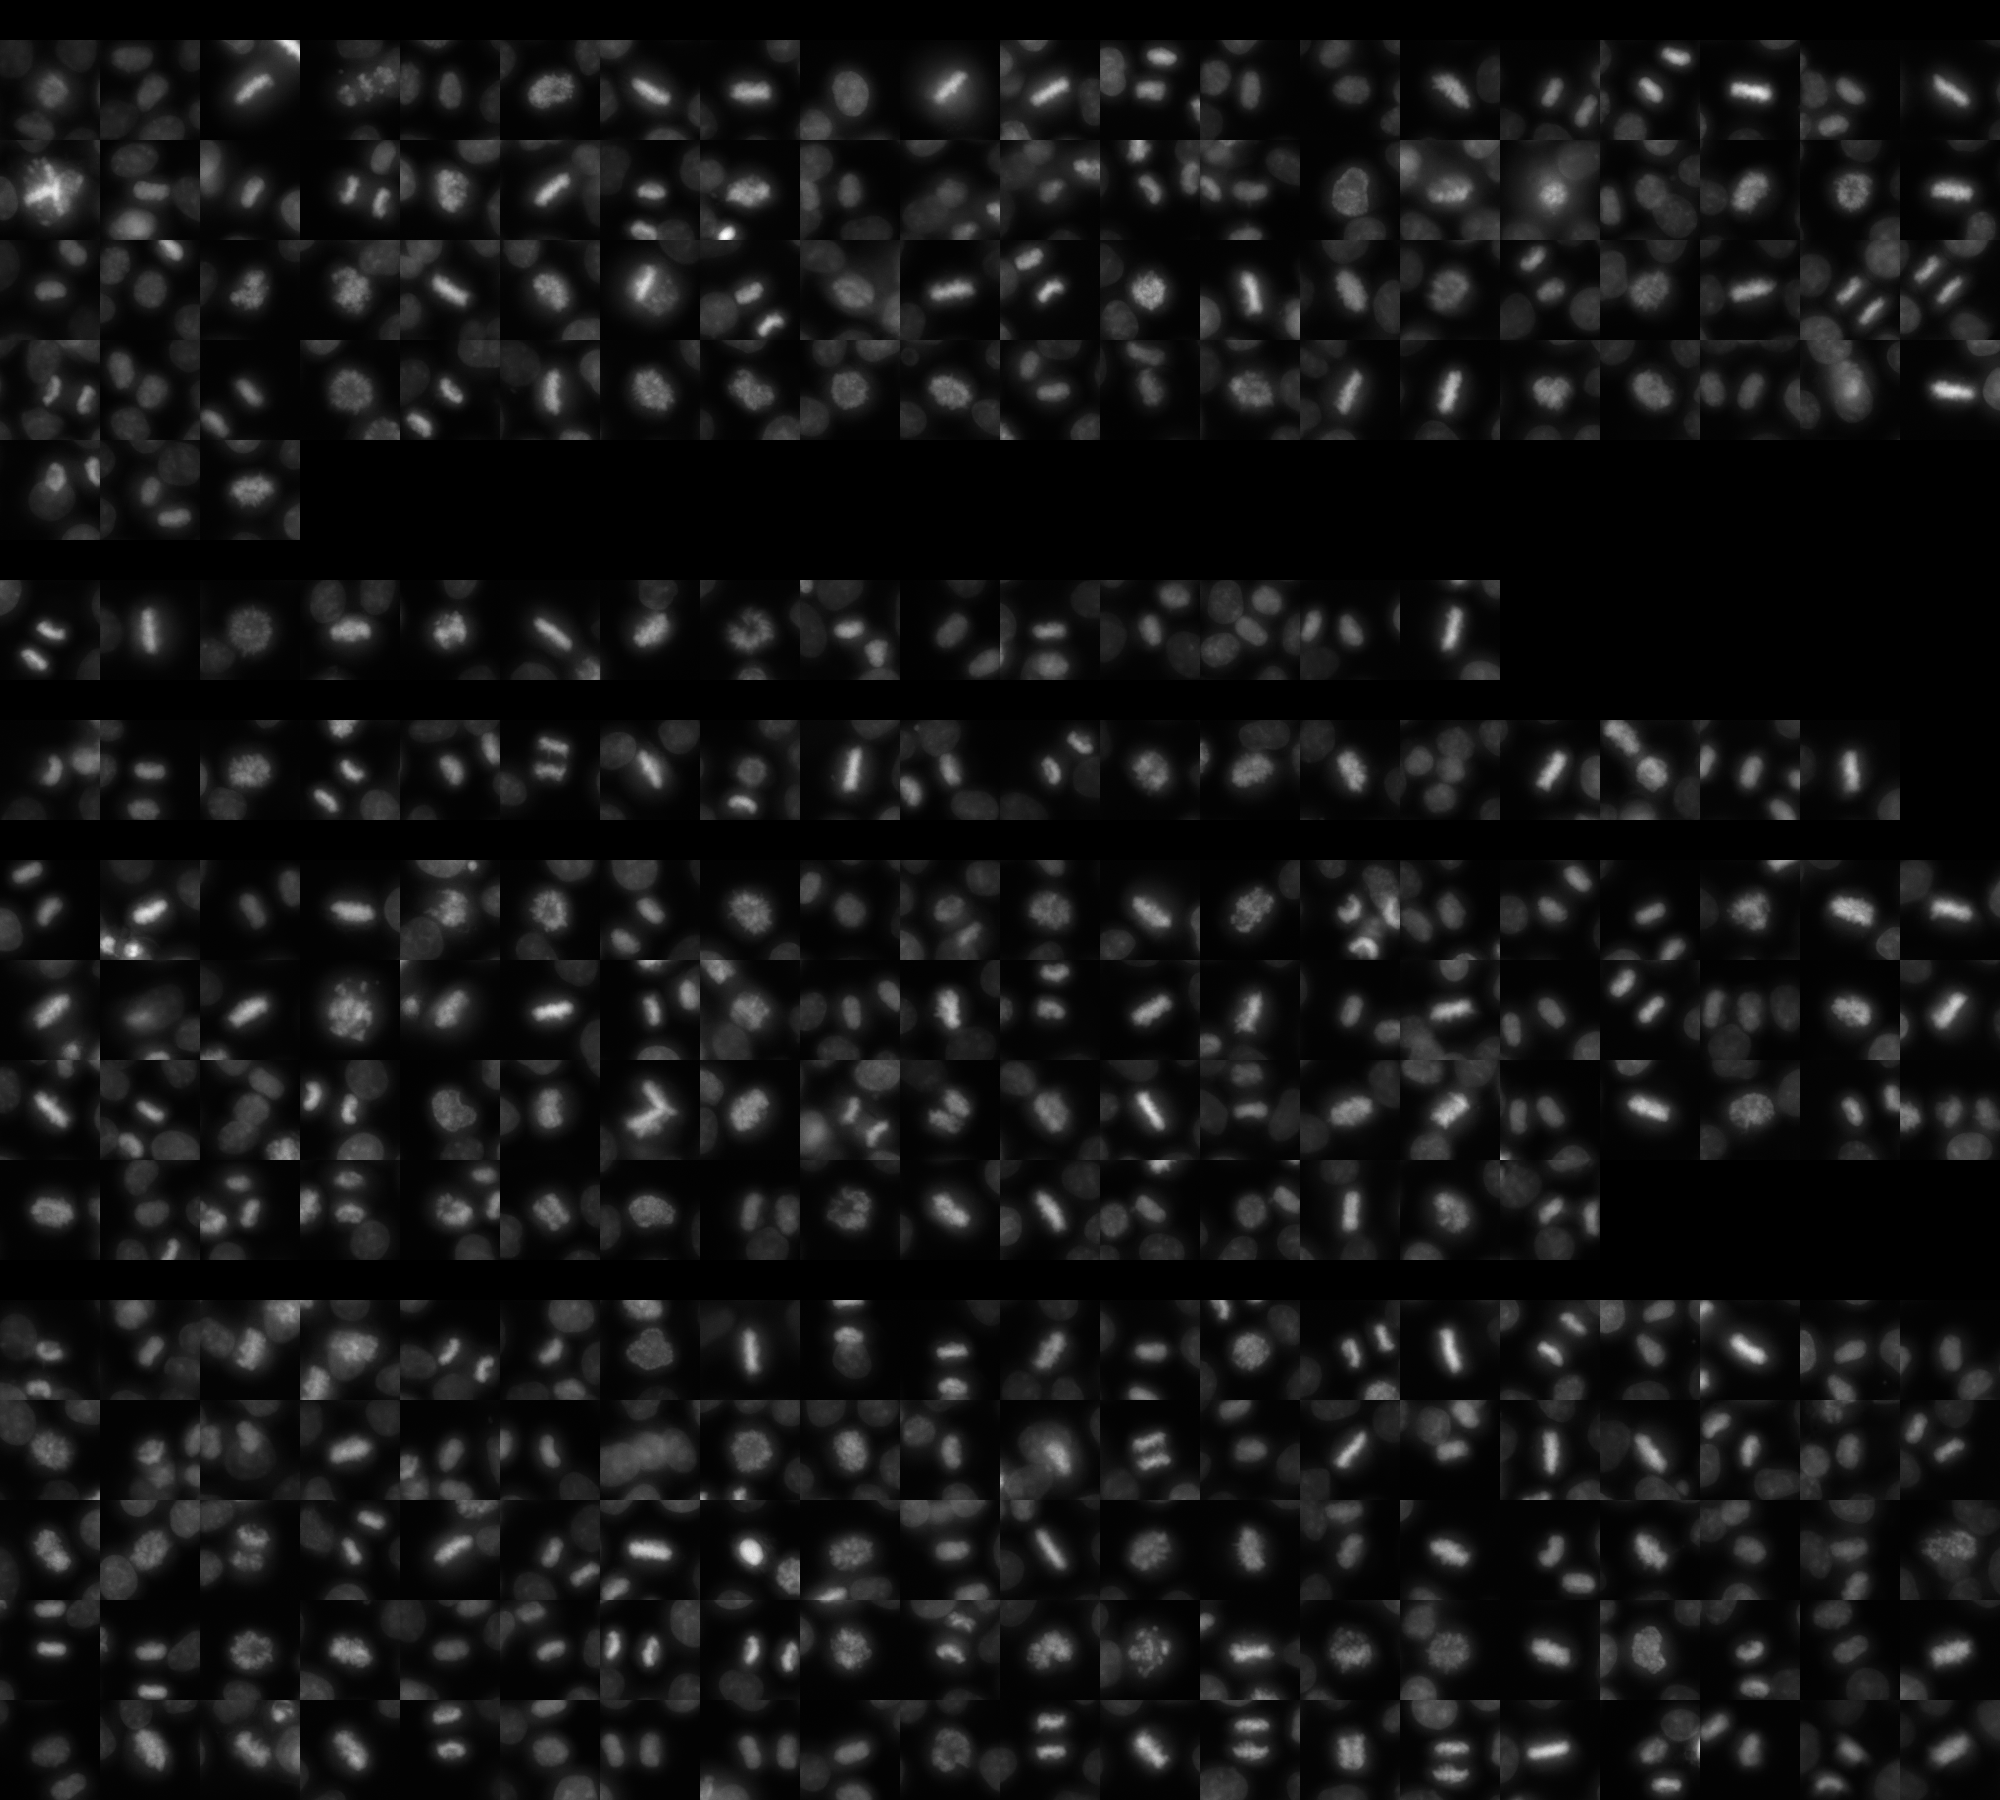
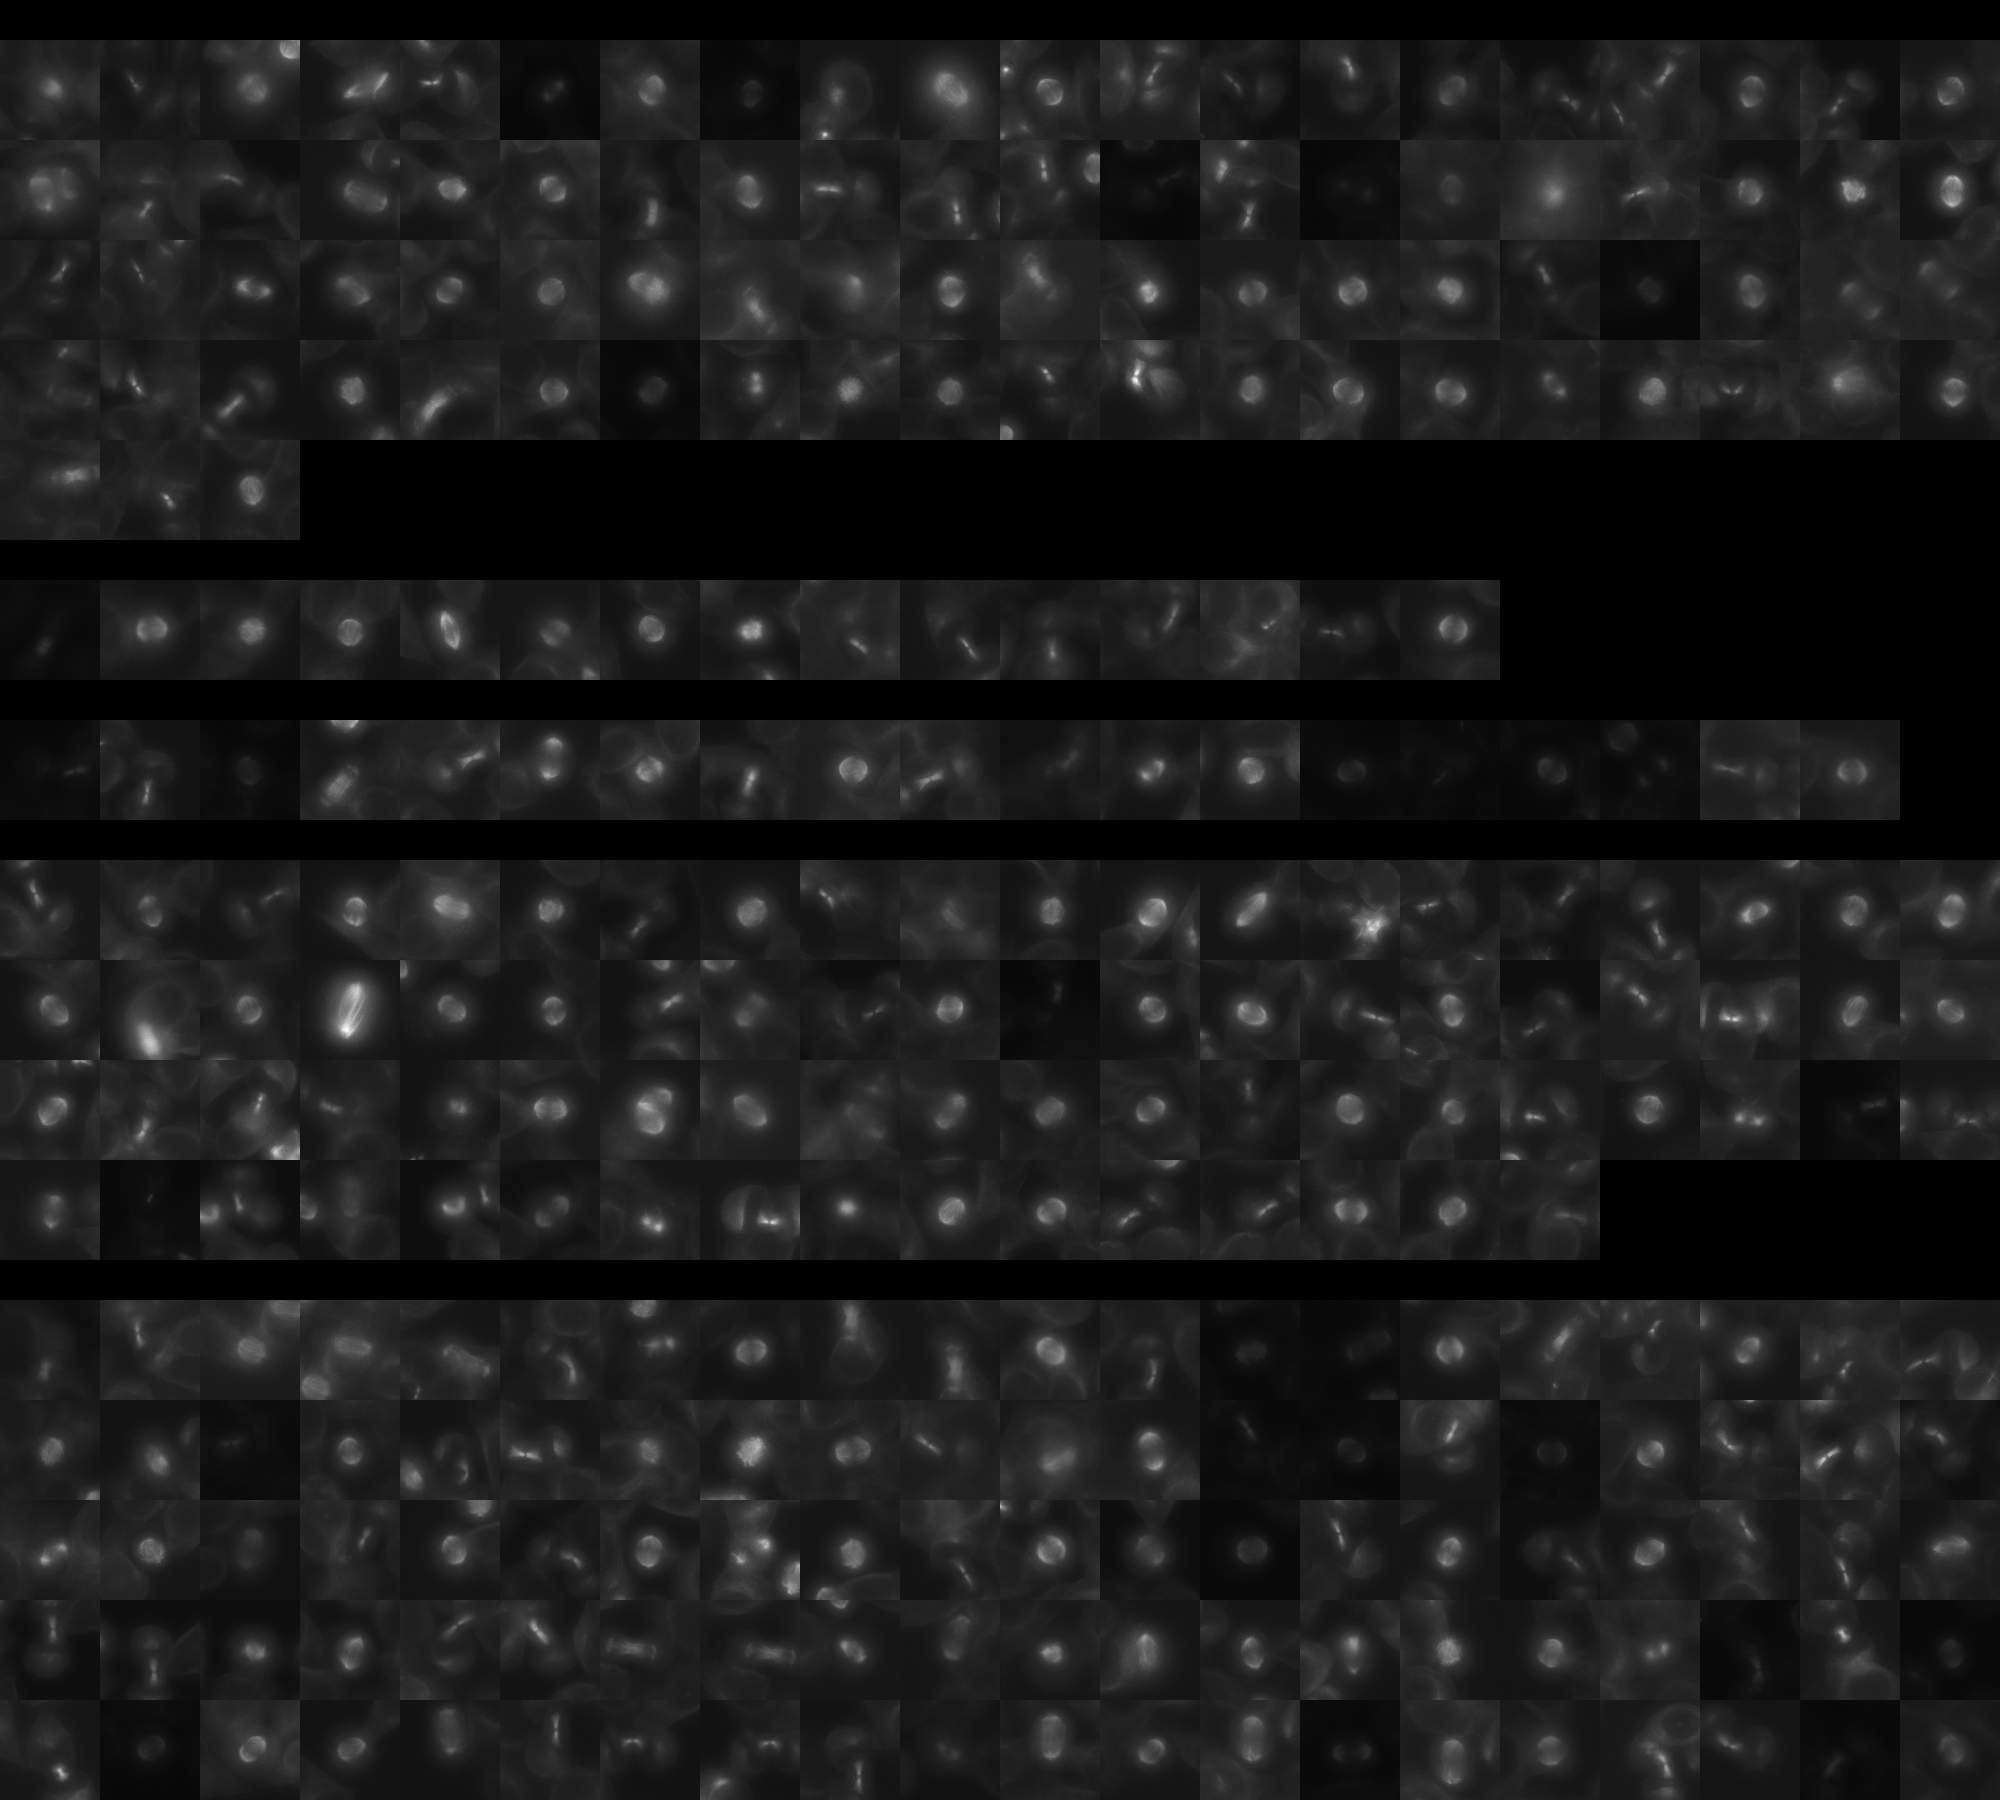
sgRNA 1: AATTCTCAGAAGGATCGCCA (interphase cells: 2688, mitotic cells: 83)
sgRNA 2: ATTGATGAGAATTATCAAGC (interphase cells: 456, mitotic cells: 15)
sgRNA 3: CTTGCCAACAGCACAGCAGG (interphase cells: 909, mitotic cells: 19)
sgRNA 4: TGGGGCCCTACCTGGAATCA (interphase cells: 2617, mitotic cells: 76)

Interphase Cluster

Mitotic Cluster

Overview

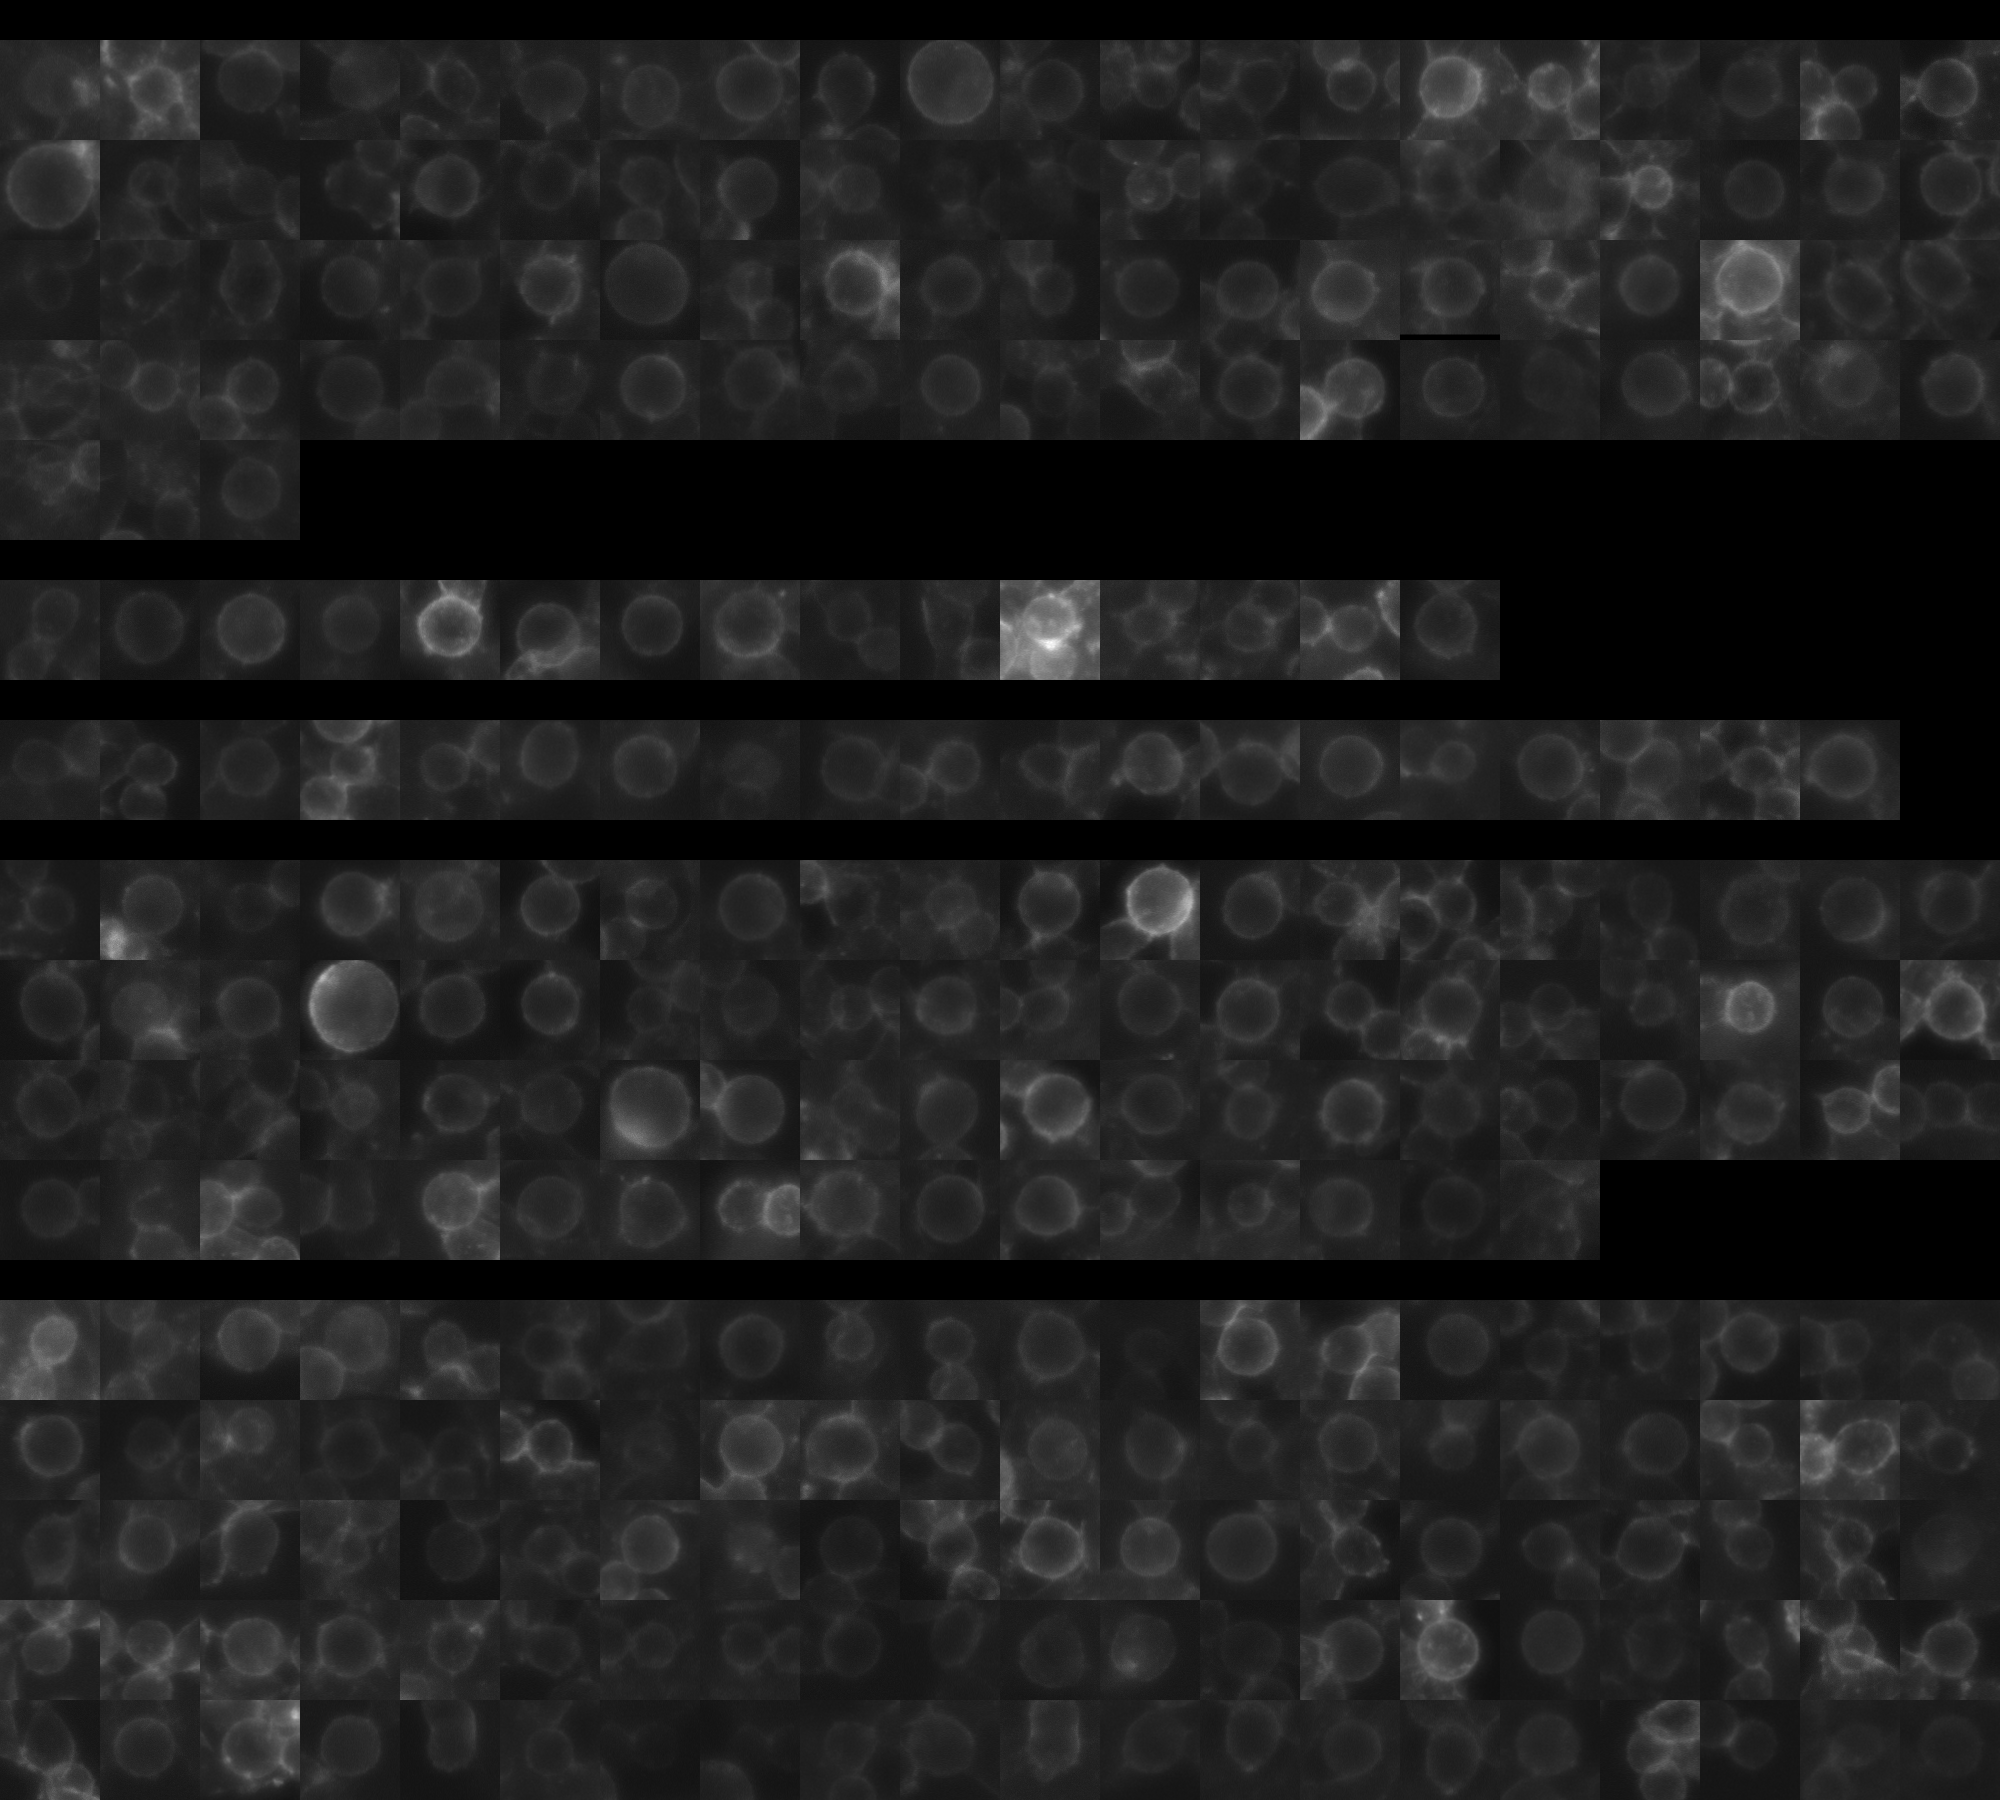
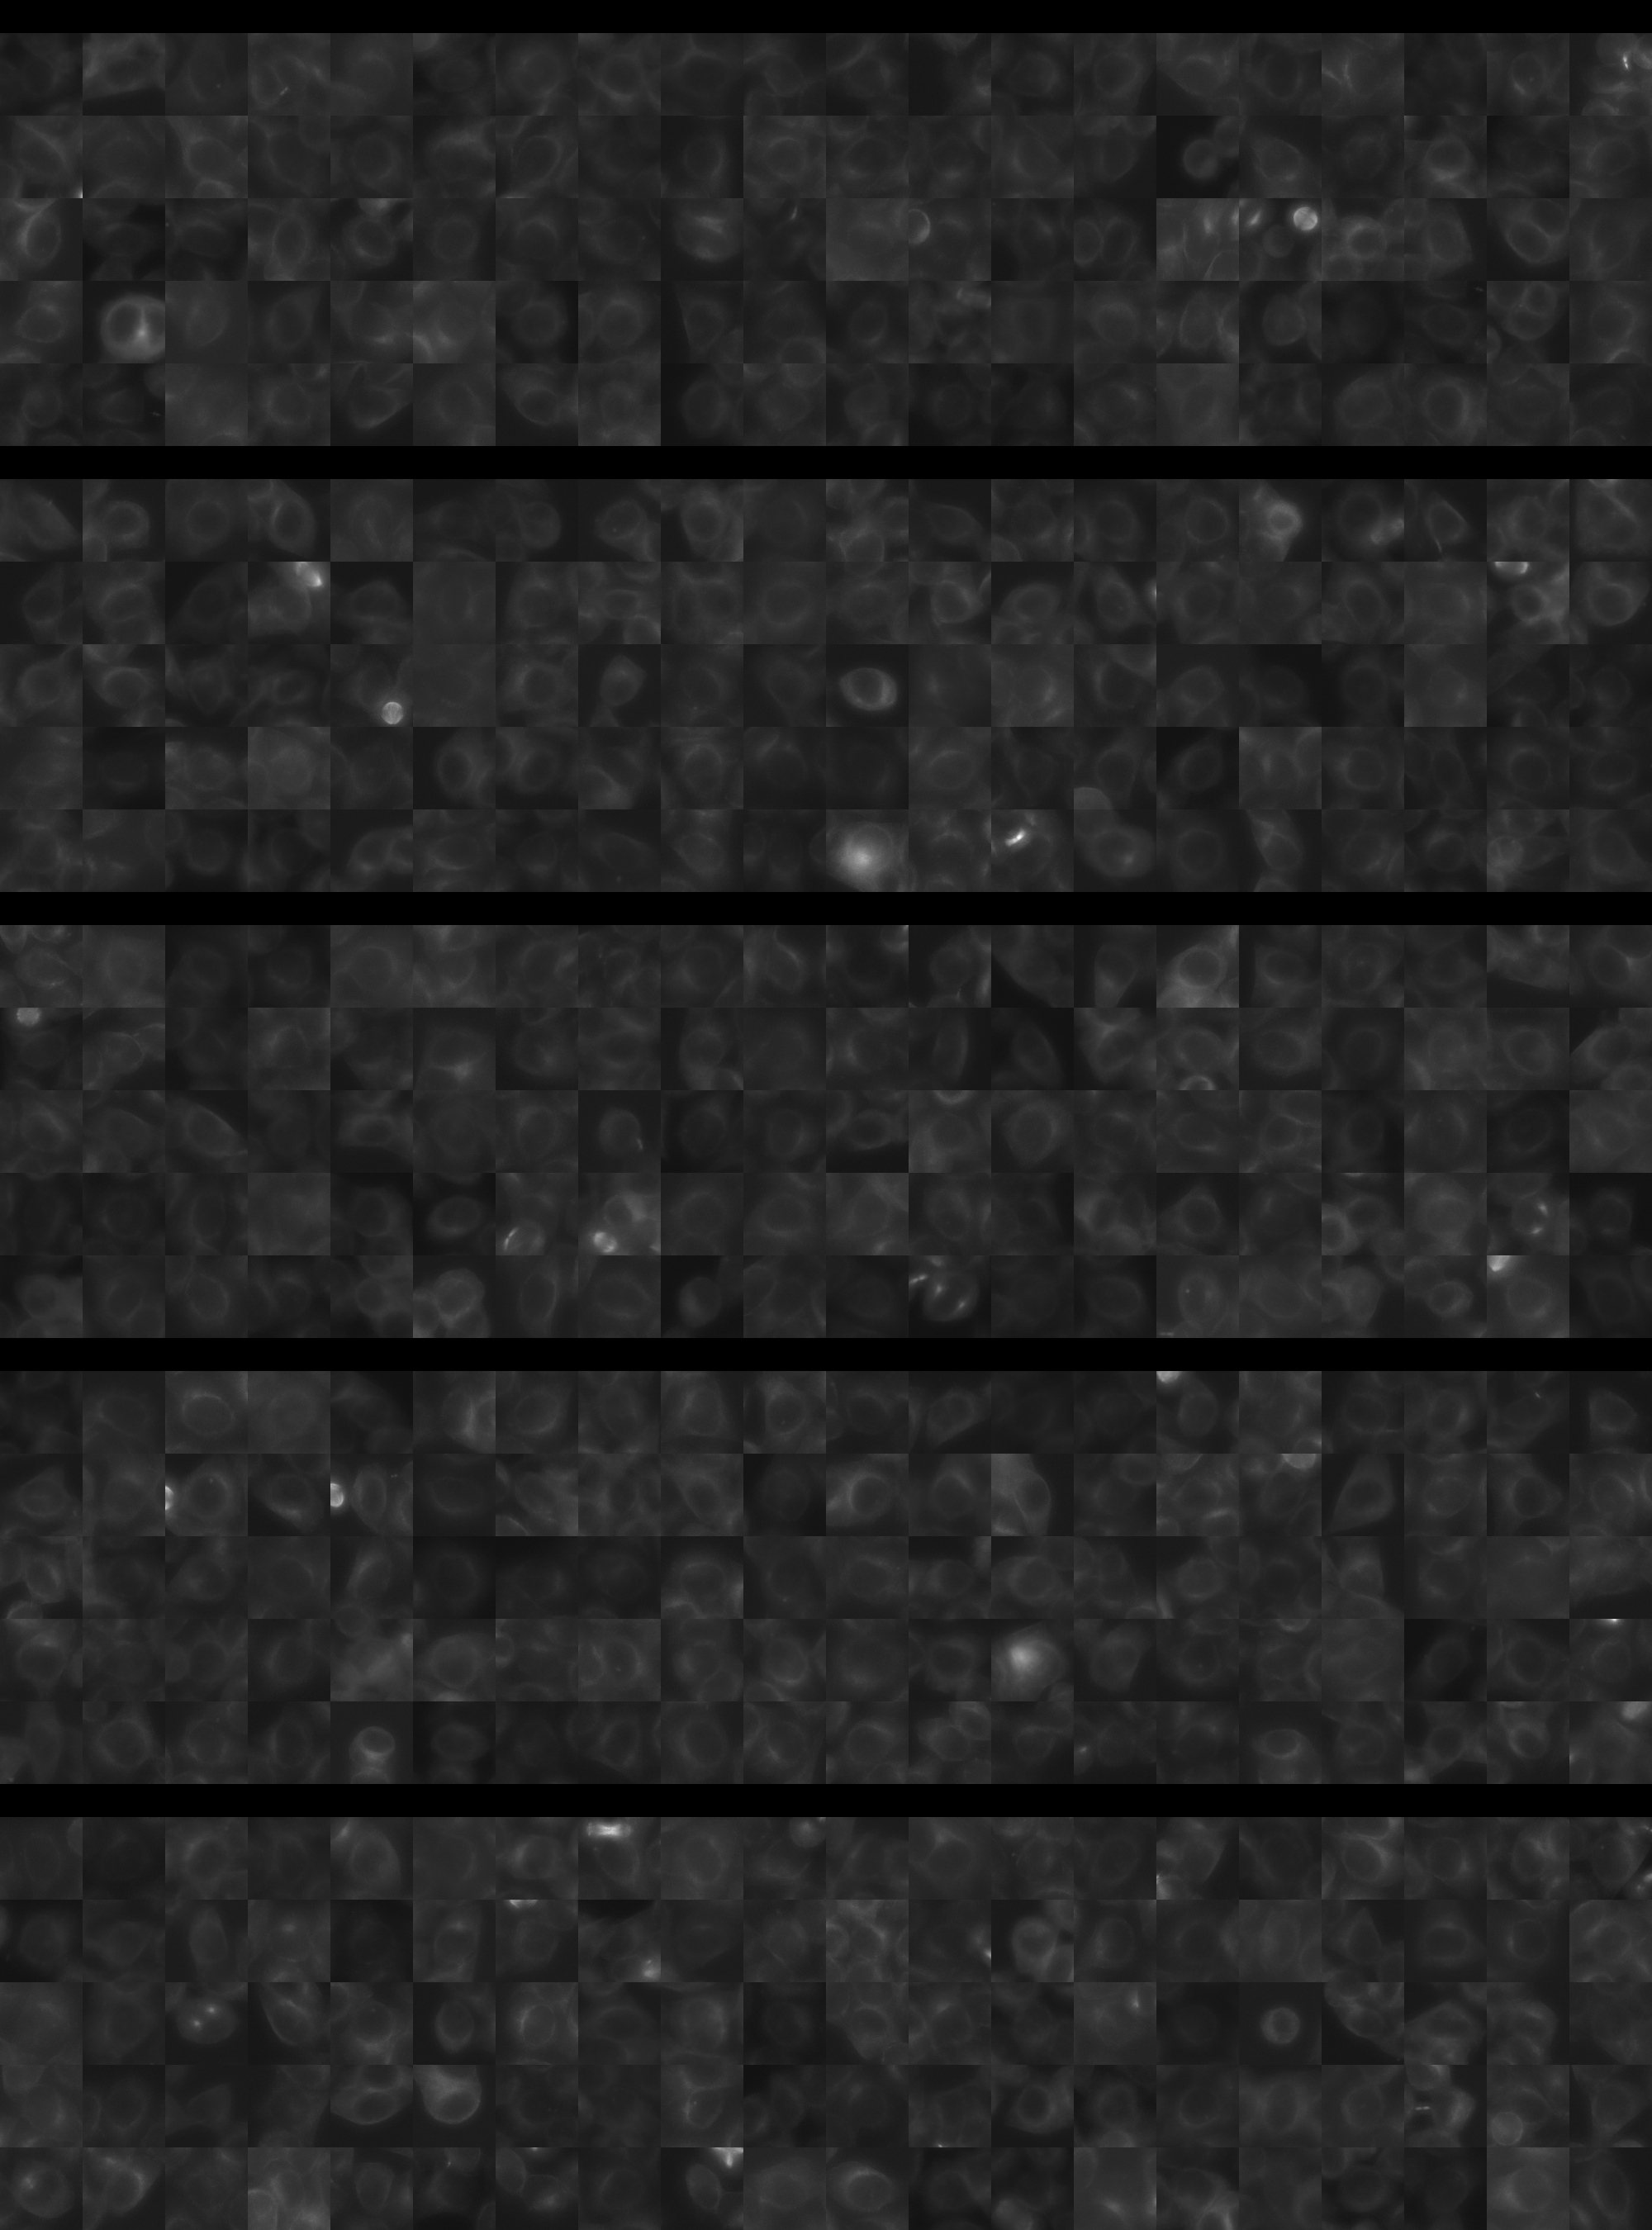
Each montage below shows randomly selected individual cell images for the same target gene separated by sgRNA, along with an example montage of cells expressing a non-targeting negative control sgRNA at the bottom. sgRNA labels in the montages correspond to the numbered sgRNA sequences in the gene info table above. The DNA (blue) and tubulin (green) channels are displayed by default, with gH2AX (grayscale) and actin (yellow) available using the check boxes. Channel brightness, contrast, and opacity are adjustable by clicking the arrow next to the channel name. When only one channel is selected, the display defaults to grayscale. Click the “Zoom” checkbox above the channel controls to enable image zooming (via scrolling) and panning (via click-and-drag).

The cell boxes displayed for this gene are square, 30.36 μm per side for the interphase montage and 30.36 μm per side for the mitotic montage.

Features

Interphase Score Rank FDR q-value
Nucleus DNA Integrated 0.012 2539 of 5322 0.930
Nucleus DNA Mean -1.322e-01 4859 of 5322 0.001
Nucleus gH2AX Mean 0.090 2213 of 5322 0.030
Nucleus DNA - gH2AX Correlation -9.407e-02 3824 of 5322 0.002
Nucleus Shape Area 0.137 446 of 5322 0.006
Nucleus Shape Eccentricity 0.011 2738 of 5322 0.819
Nucleus Shape Form Factor -7.049e-02 3573 of 5322 0.084
Nucleus Shape Solidity -3.962e-02 2224 of 5322 0.270
Cell DNA Mass Displacement 0.030 2320 of 5322 0.659
Cell Tubulin Mean -7.064e-02 4656 of 5322 0.129
Cell Tubulin Mass Displacement 0.020 1797 of 5322 0.776
Cell Actin Mean 0.013 2568 of 5322 0.827
Cell Tubulin - Actin Correlation -9.035e-02 5231 of 5322 0.021
Cell DNA - Tubulin Correlation -2.117e-02 4488 of 5322 0.633
Cell Shape Area 0.131 391 of 5322 0.010
Cell Shape Eccentricity -7.139e-03 4181 of 5322 0.972
Mitotic Score Rank FDR q-value
Nucleus DNA Integrated -2.669e-02 4239 of 5322 0.992
Nucleus DNA Mean -1.245e-01 4522 of 5322 1.000
Nucleus DNA Mass Displacement -4.588e-02 4172 of 5322 0.999
Nucleus DNA Mean Frac 3 -6.267e-02 4001 of 5322 1.000
Nucleus gH2AX Mean -2.524e-02 3280 of 5322 1.000
Nucleus gH2AX Mean Frac 0 0.149 585 of 5322 1.000
Nucleus Tubulin Mean Frac 0 -1.166e-01 4788 of 5322 0.999
Nucleus Tubulin Mean Edge 0.032 2736 of 5322 0.999
Nucleus Tubulin Std Edge -7.019e-02 3534 of 5322 0.999
Nucleus Shape Area -1.258e-01 4925 of 5322 0.968
Nucleus Shape Eccentricity 0.039 1527 of 5322 1.000
Nucleus Shape Form Factor 0.029 1036 of 5322 0.998
Cell Tubulin Mean 0.005 3431 of 5322 1.000
Cell Tubulin Mean Frac 3 0.019 1466 of 5322 0.999
Cell Actin Mean 0.010 3070 of 5322 1.000
Cell Shape Area 0.090 2751 of 5322 0.998
( Reset Zoom )
Brightness
Contrast
Opacity
Brightness
Contrast
Opacity
Brightness
Contrast
Opacity
Brightness
Contrast
Opacity
Brightness
Contrast
Opacity

( Reset Zoom )
Brightness
Contrast
Opacity
Brightness
Contrast
Opacity
Brightness
Contrast
Opacity
Brightness
Contrast
Opacity
Brightness
Contrast
Opacity

MIT Central Accessability