SP3

Gene symbol: SP3
Gene: 6670
Uniprot Function: Transcriptional factor that can act as an activator or repressor depending on isoform and/or post-translational modifications. Binds to GT and GC boxes promoter elements. Competes with SP1 for the GC-box promoters. Weak activator of transcription but can activate a number of genes involved in different processes such as cell-cycle regulation, hormone-induction and house-keeping.
Mitotic Index 0.0234
Interphase Cluster: #104 (23 genes)
Mitotic Cluster: #111 (23 genes)
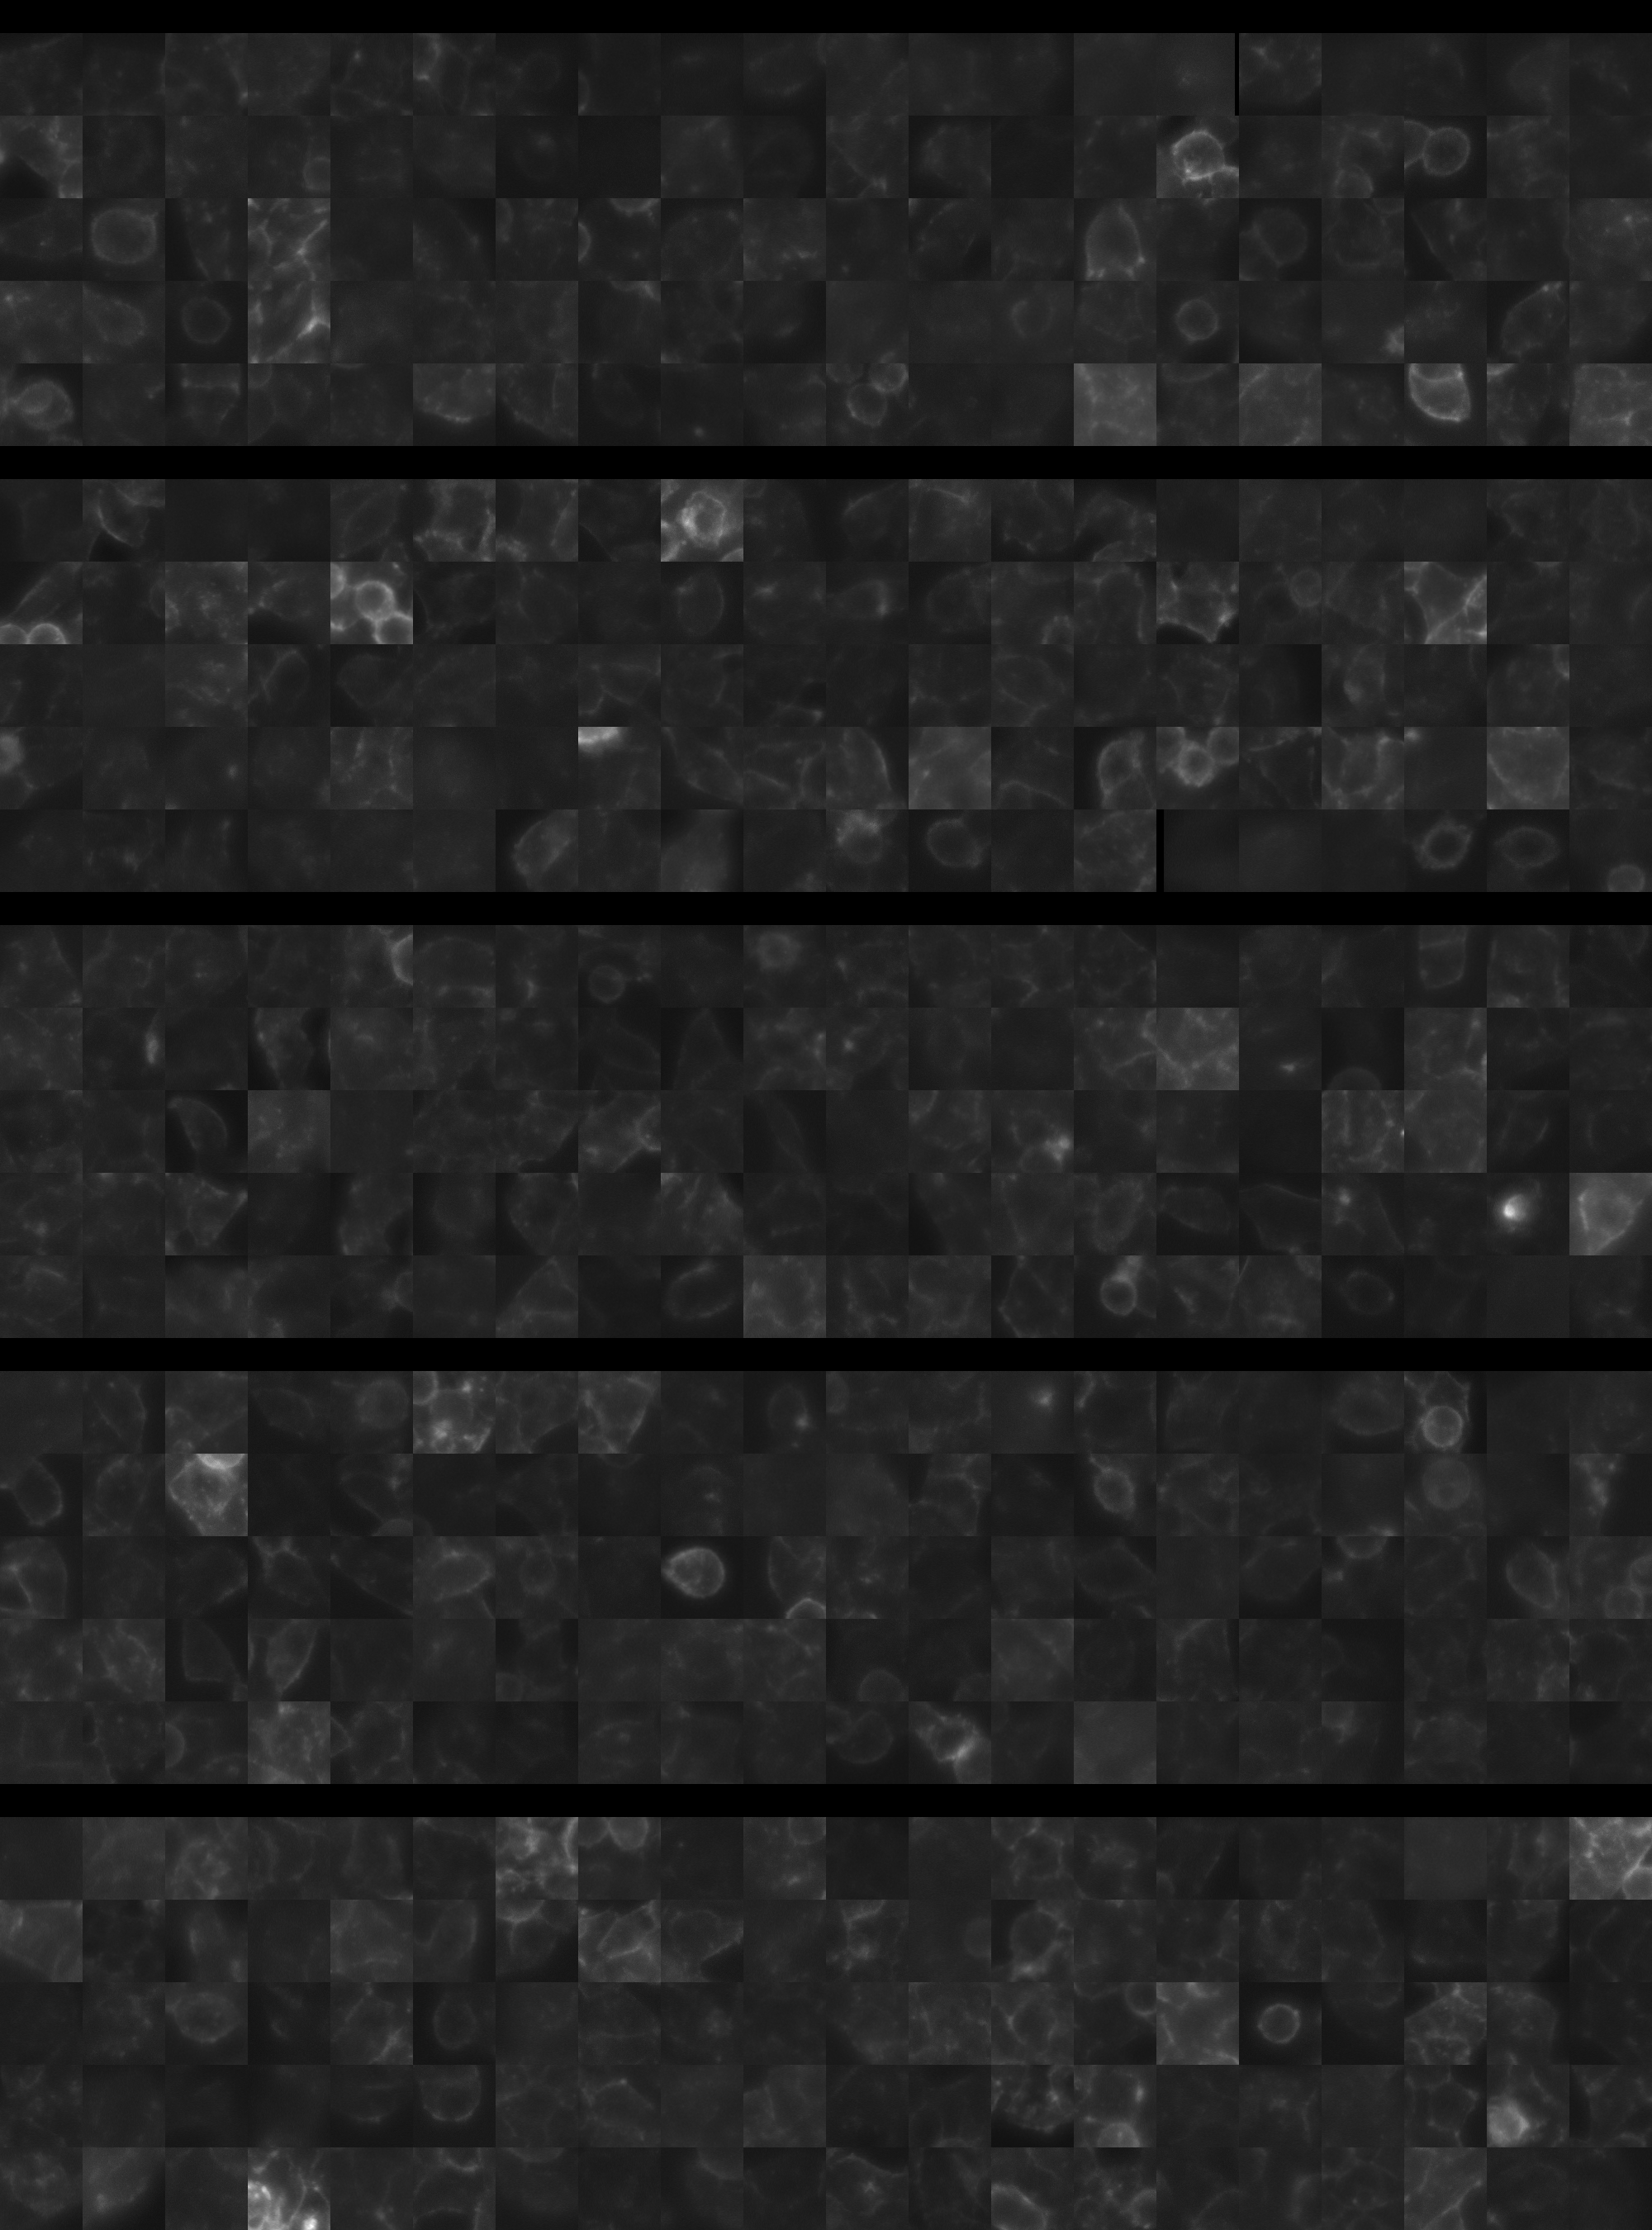
sgRNA 1: ACTGCAGGCATTAATGCCGA (interphase cells: 802, mitotic cells: 19)
sgRNA 2: ATAGCTTGACTACATCTAGT (interphase cells: 1404, mitotic cells: 32)
sgRNA 3: TAGGAGGAGCACCAAACCGA (interphase cells: 1767, mitotic cells: 36)
sgRNA 4: TATCACTTGATATTGAACAC (interphase cells: 1497, mitotic cells: 44)

Interphase Cluster

Mitotic Cluster

Overview

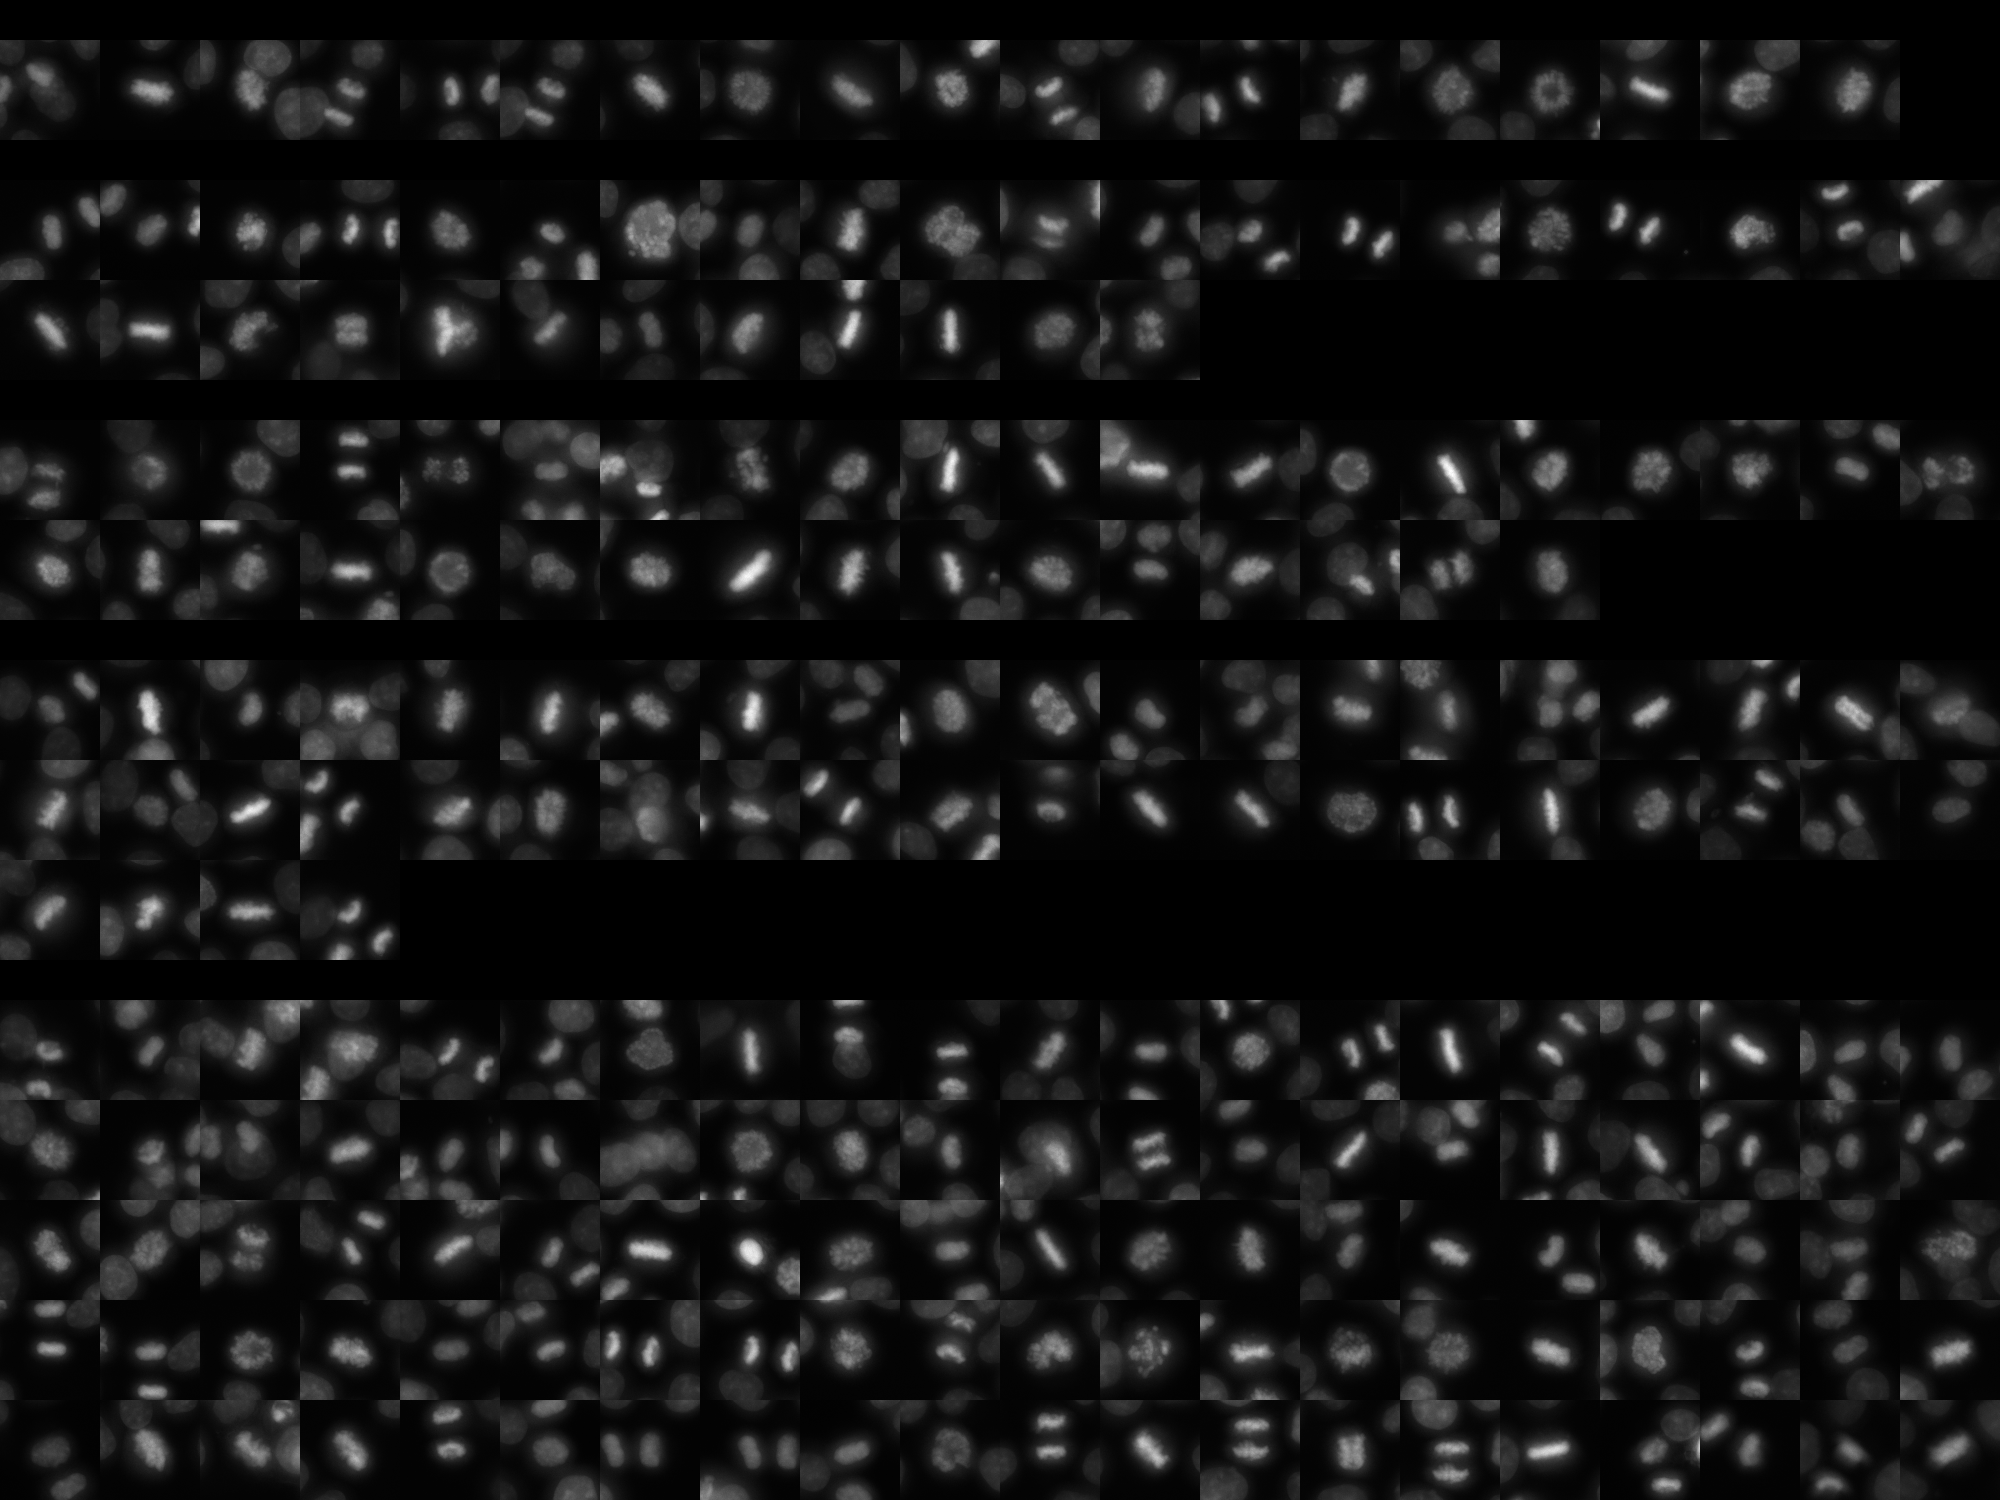
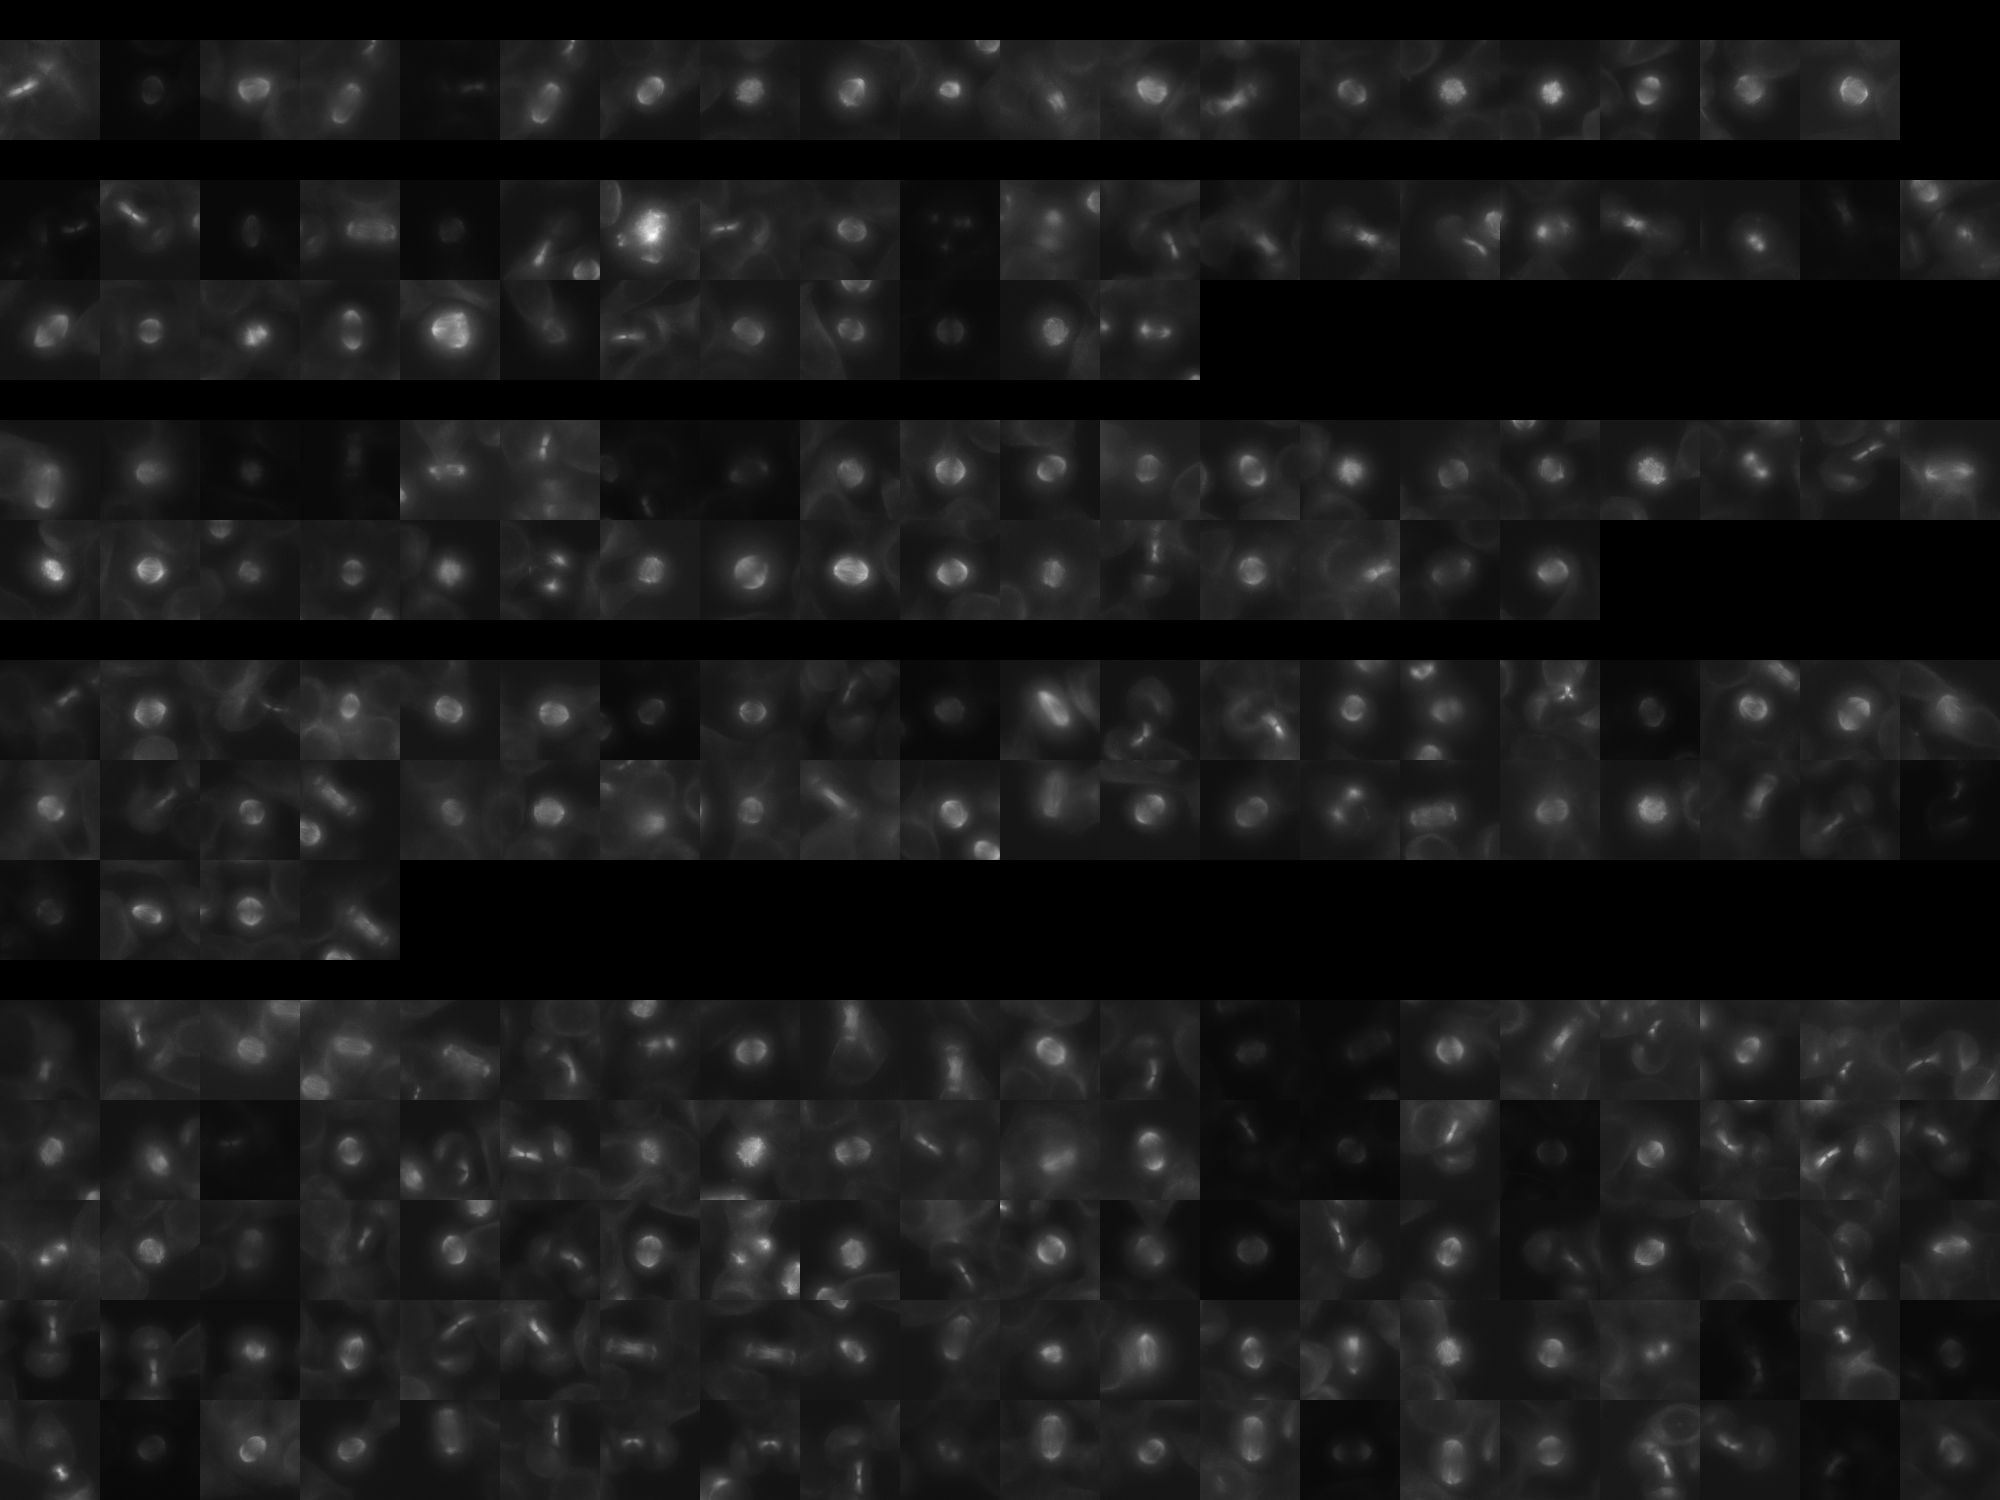
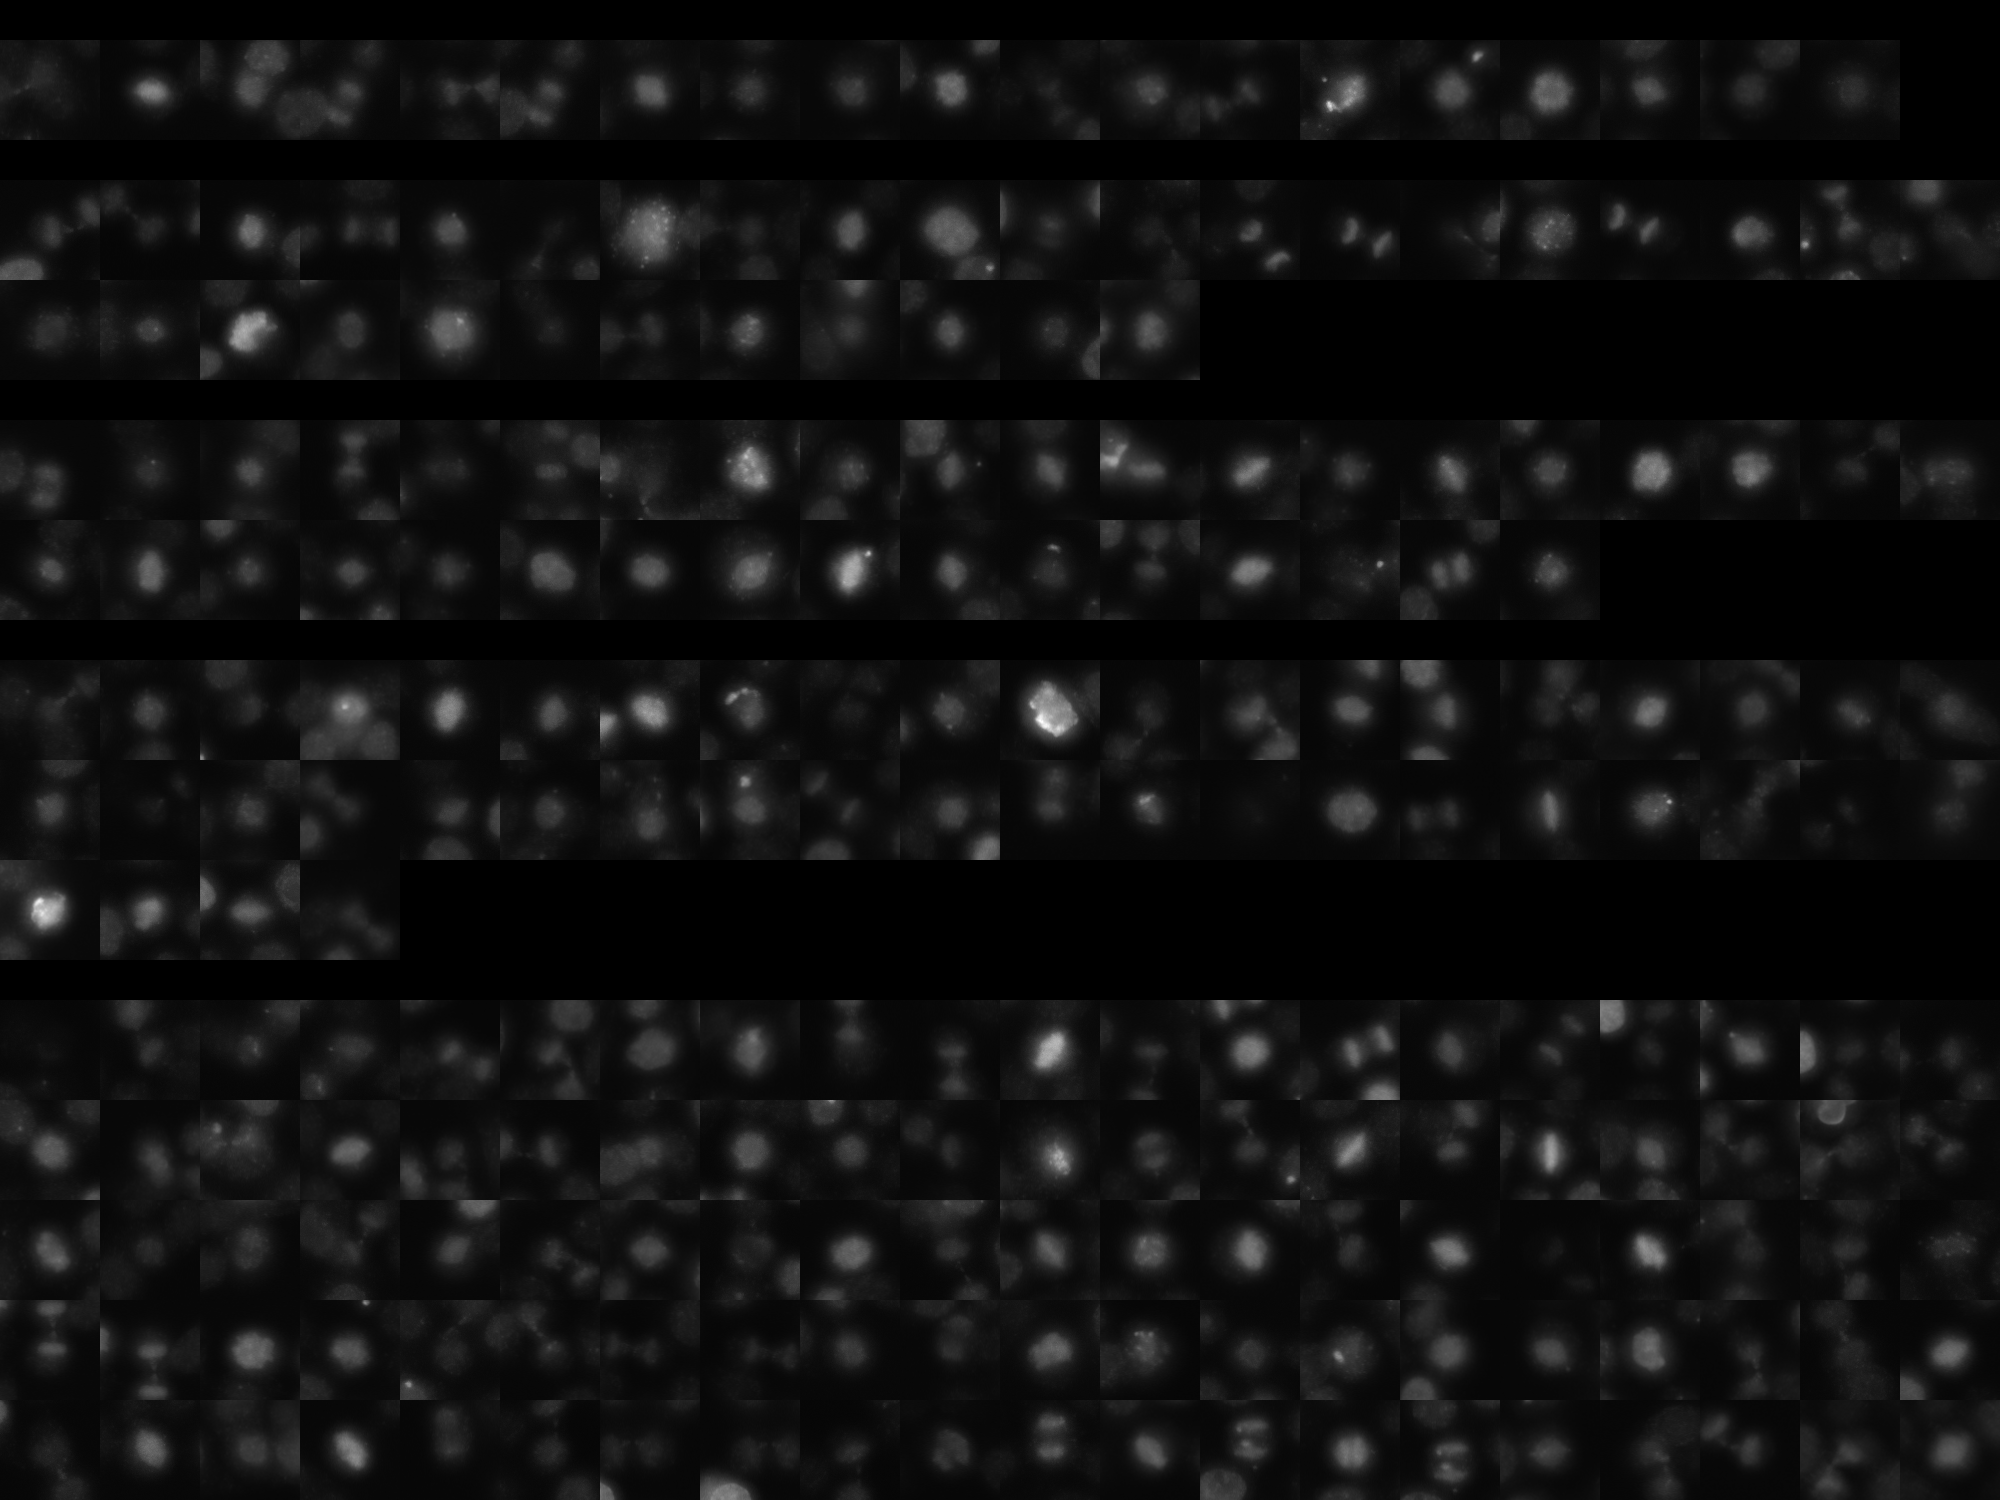
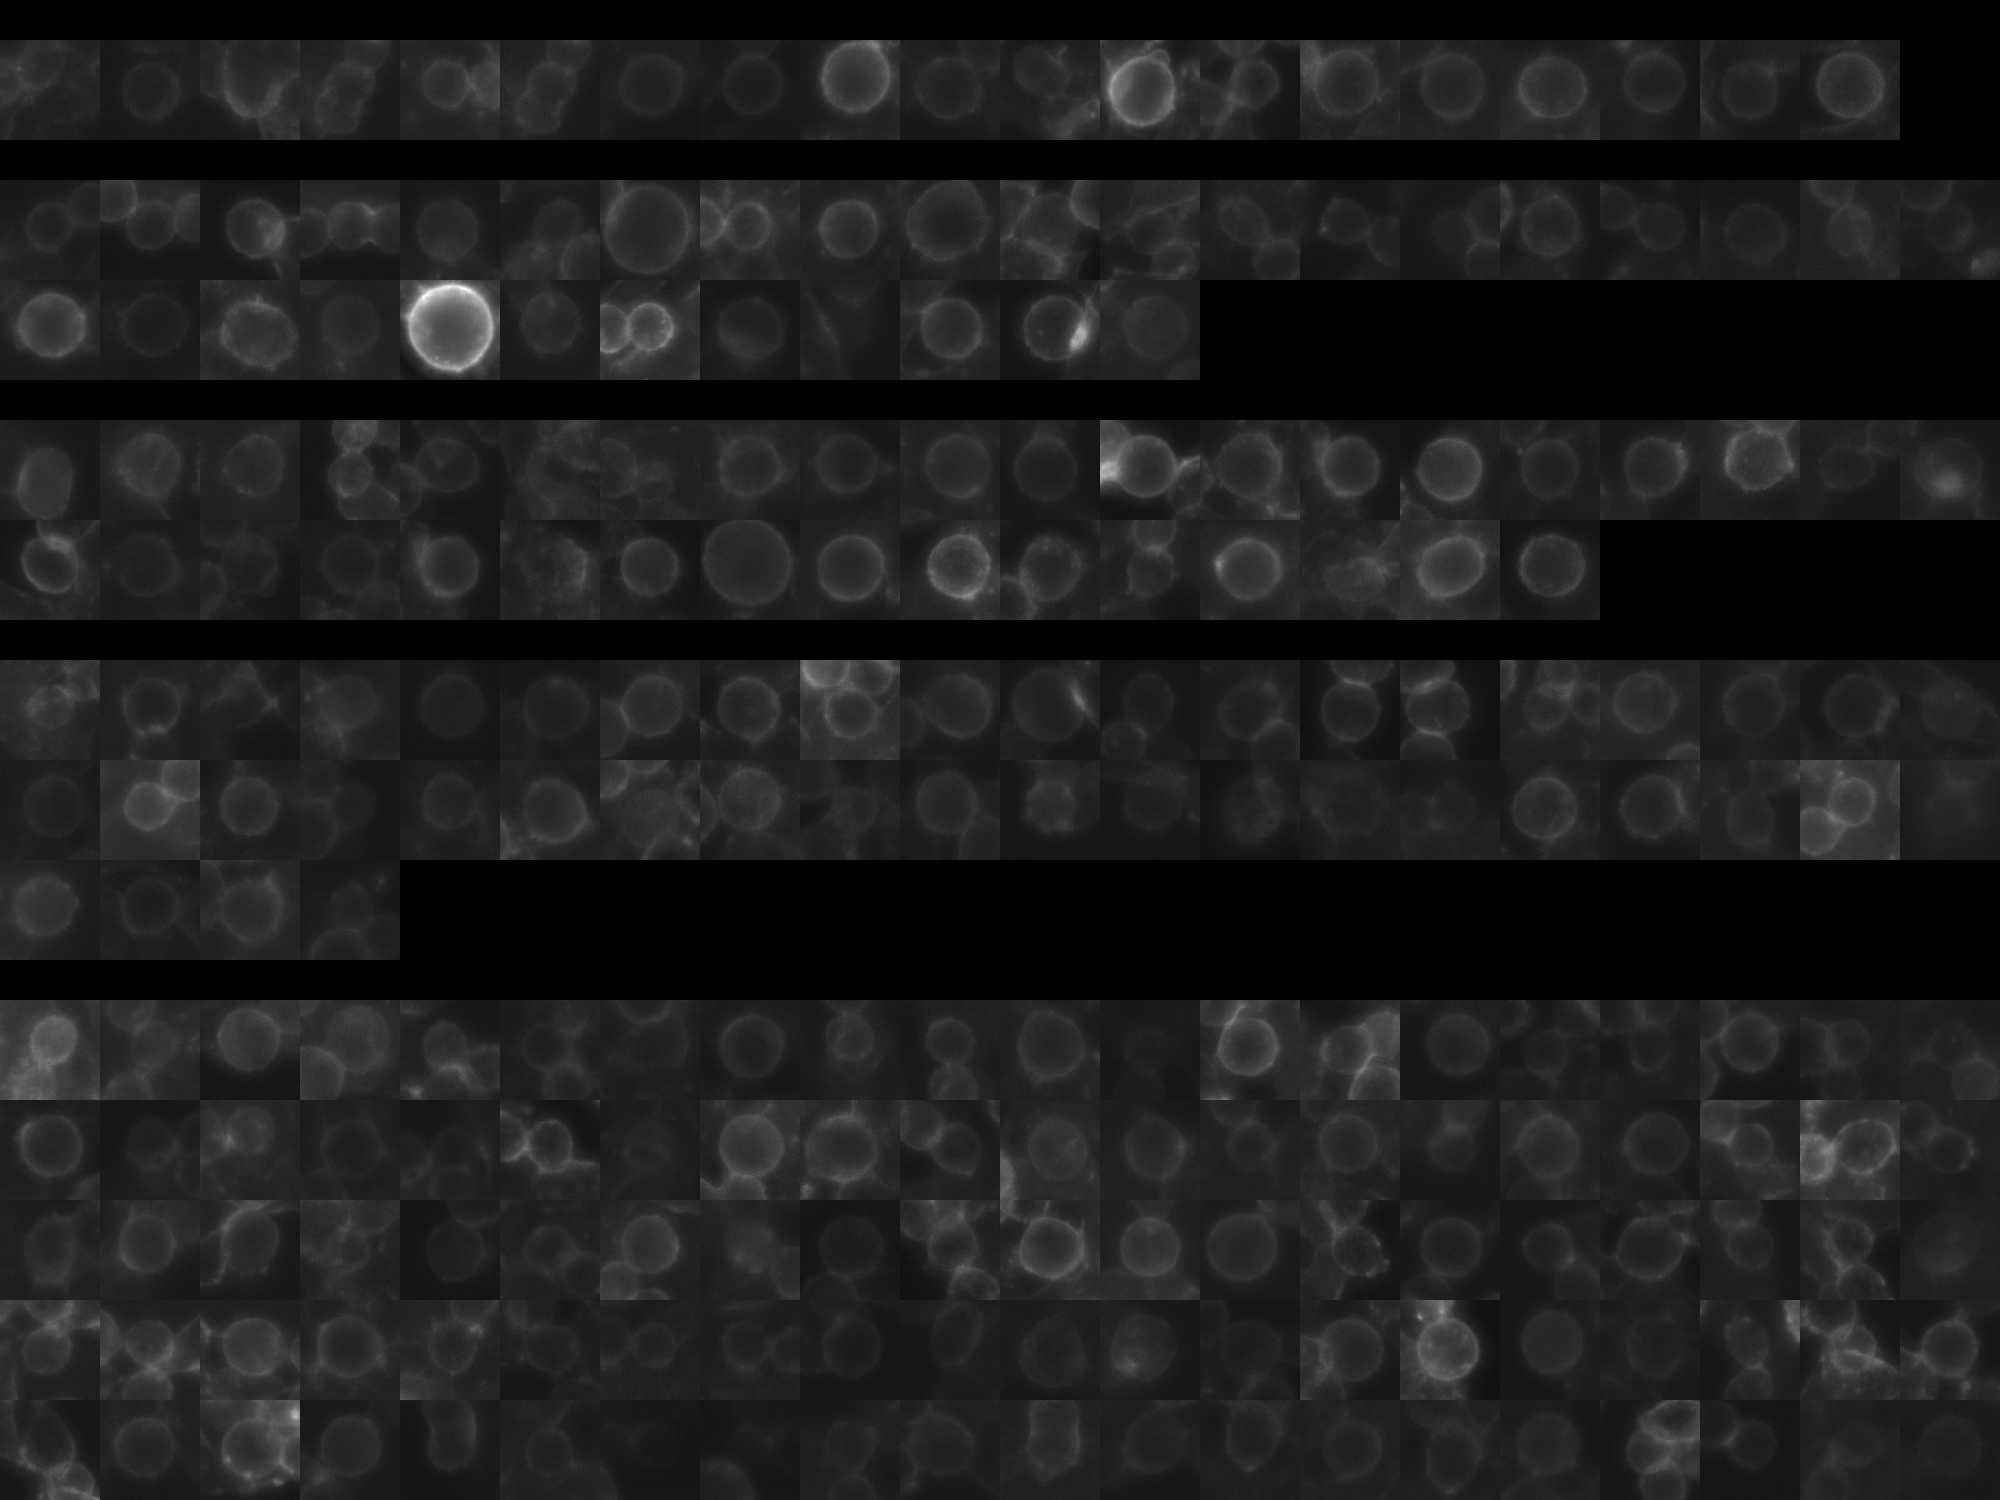
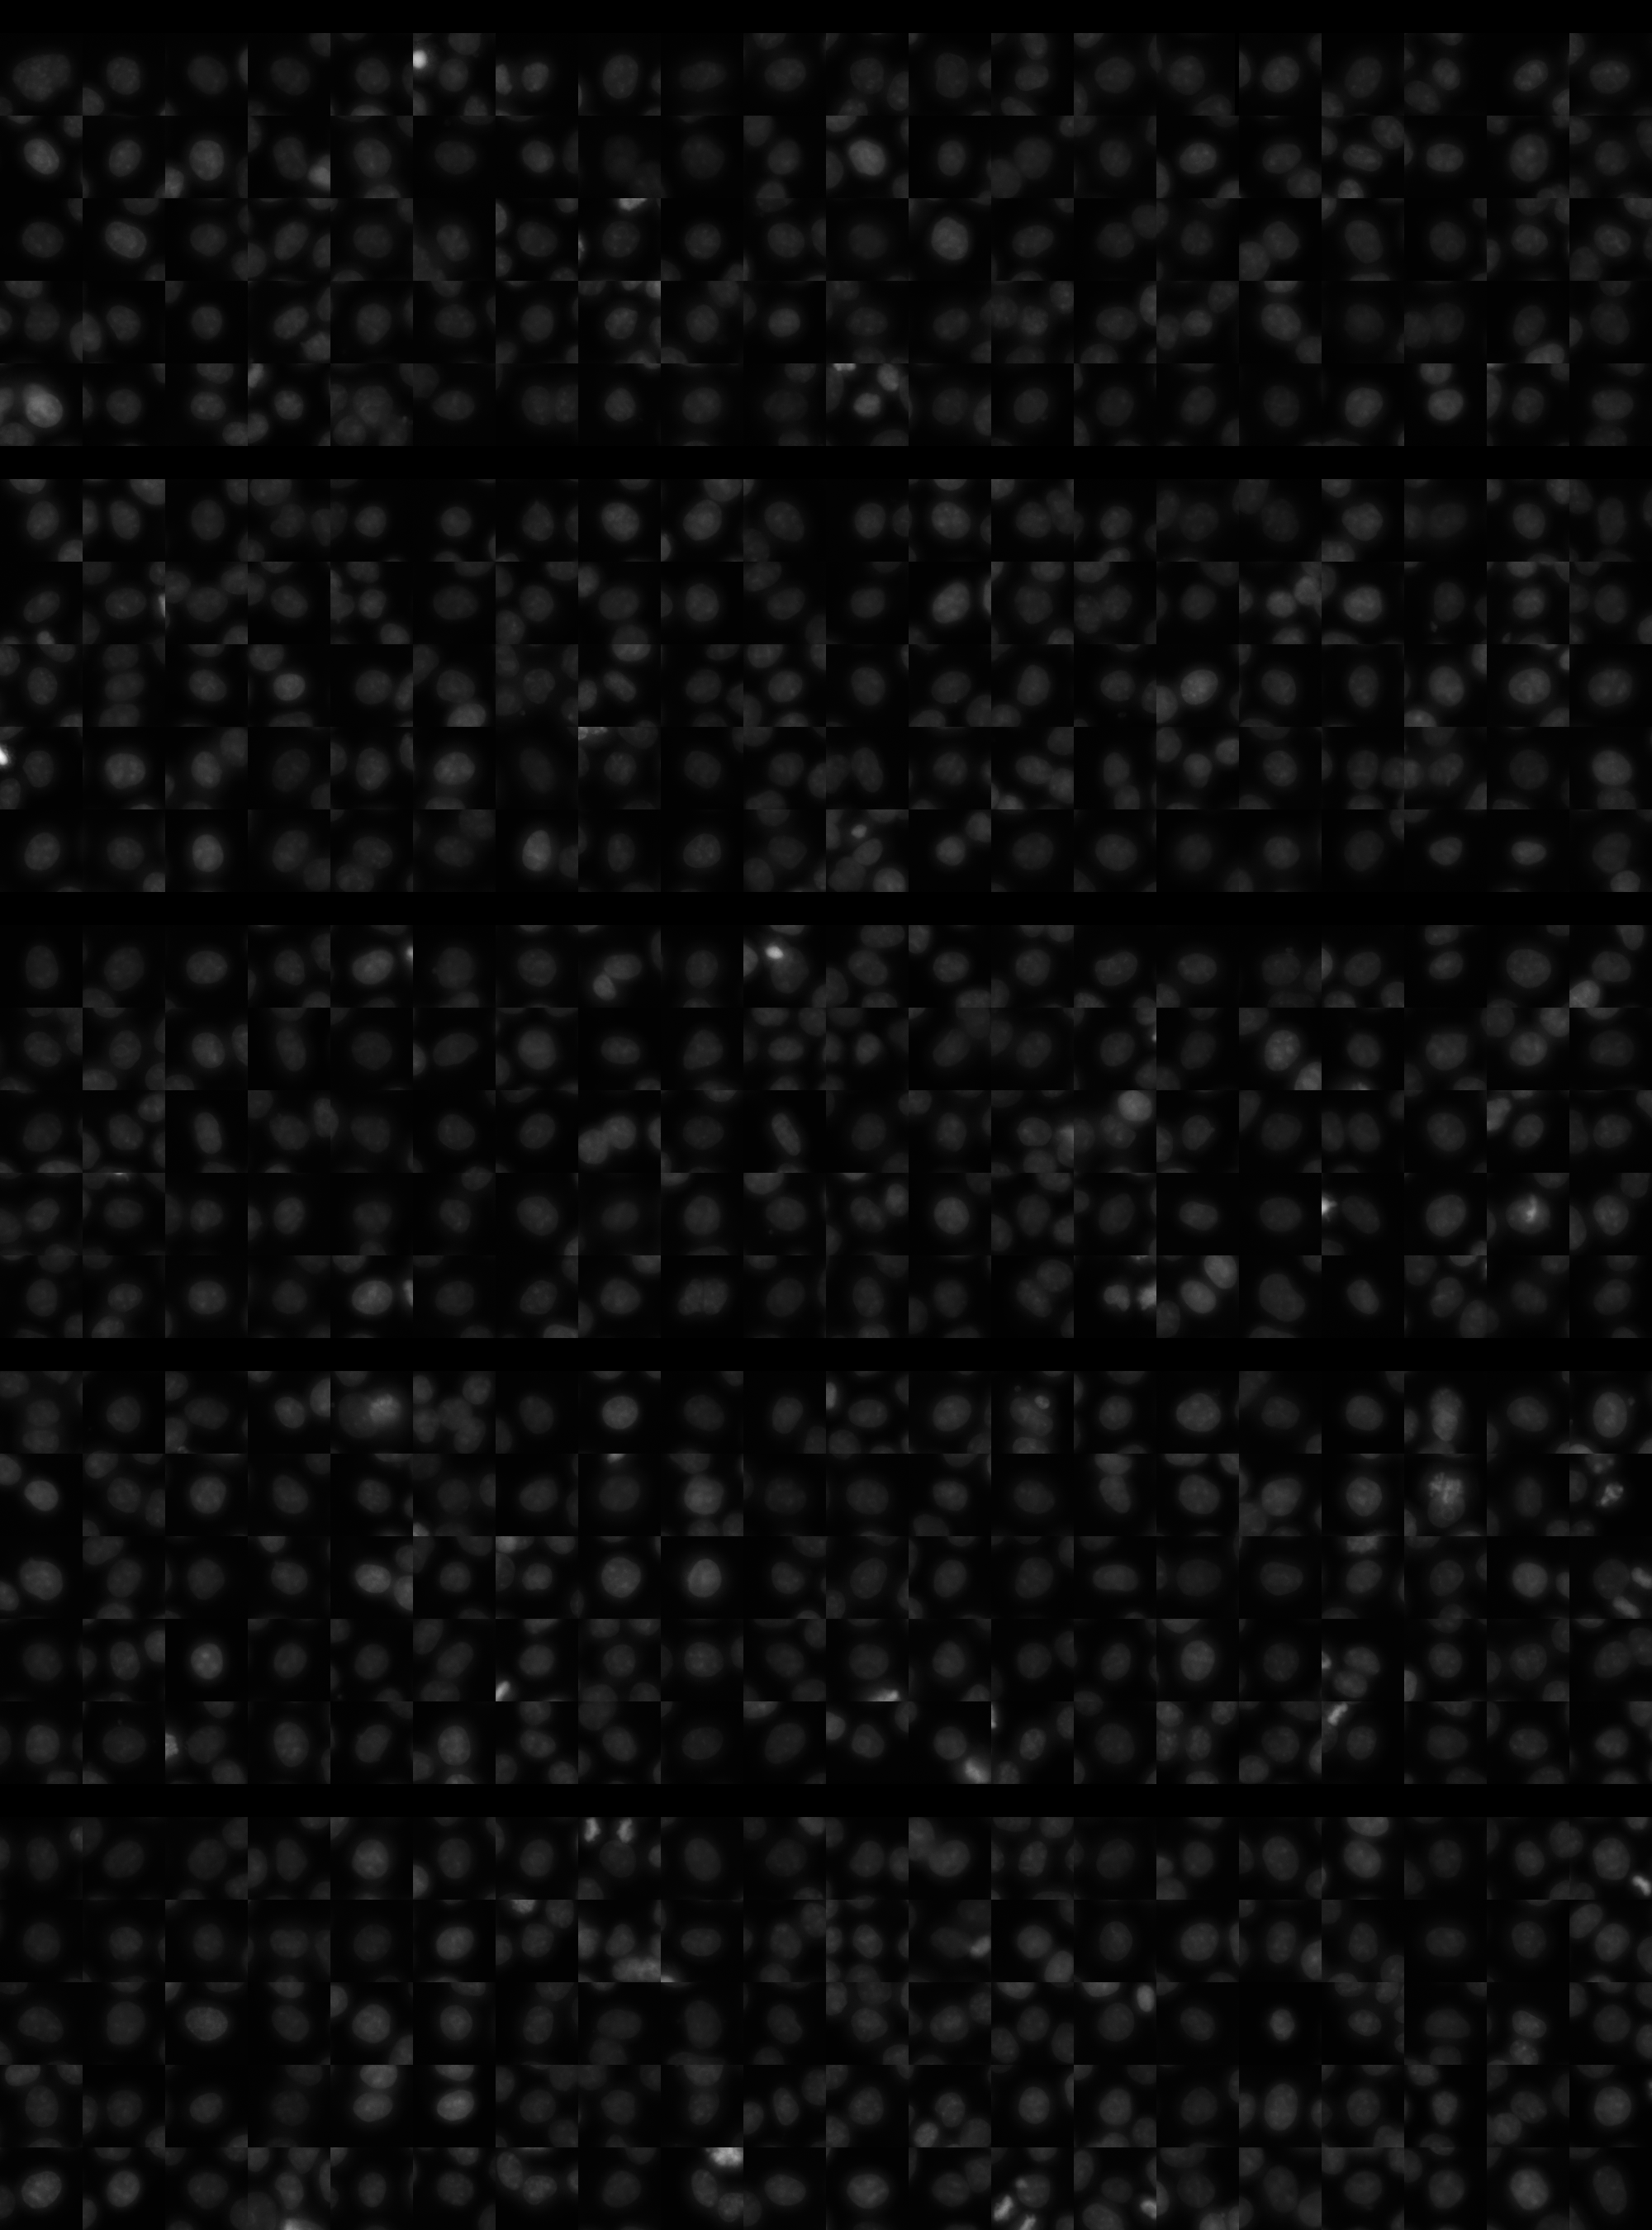
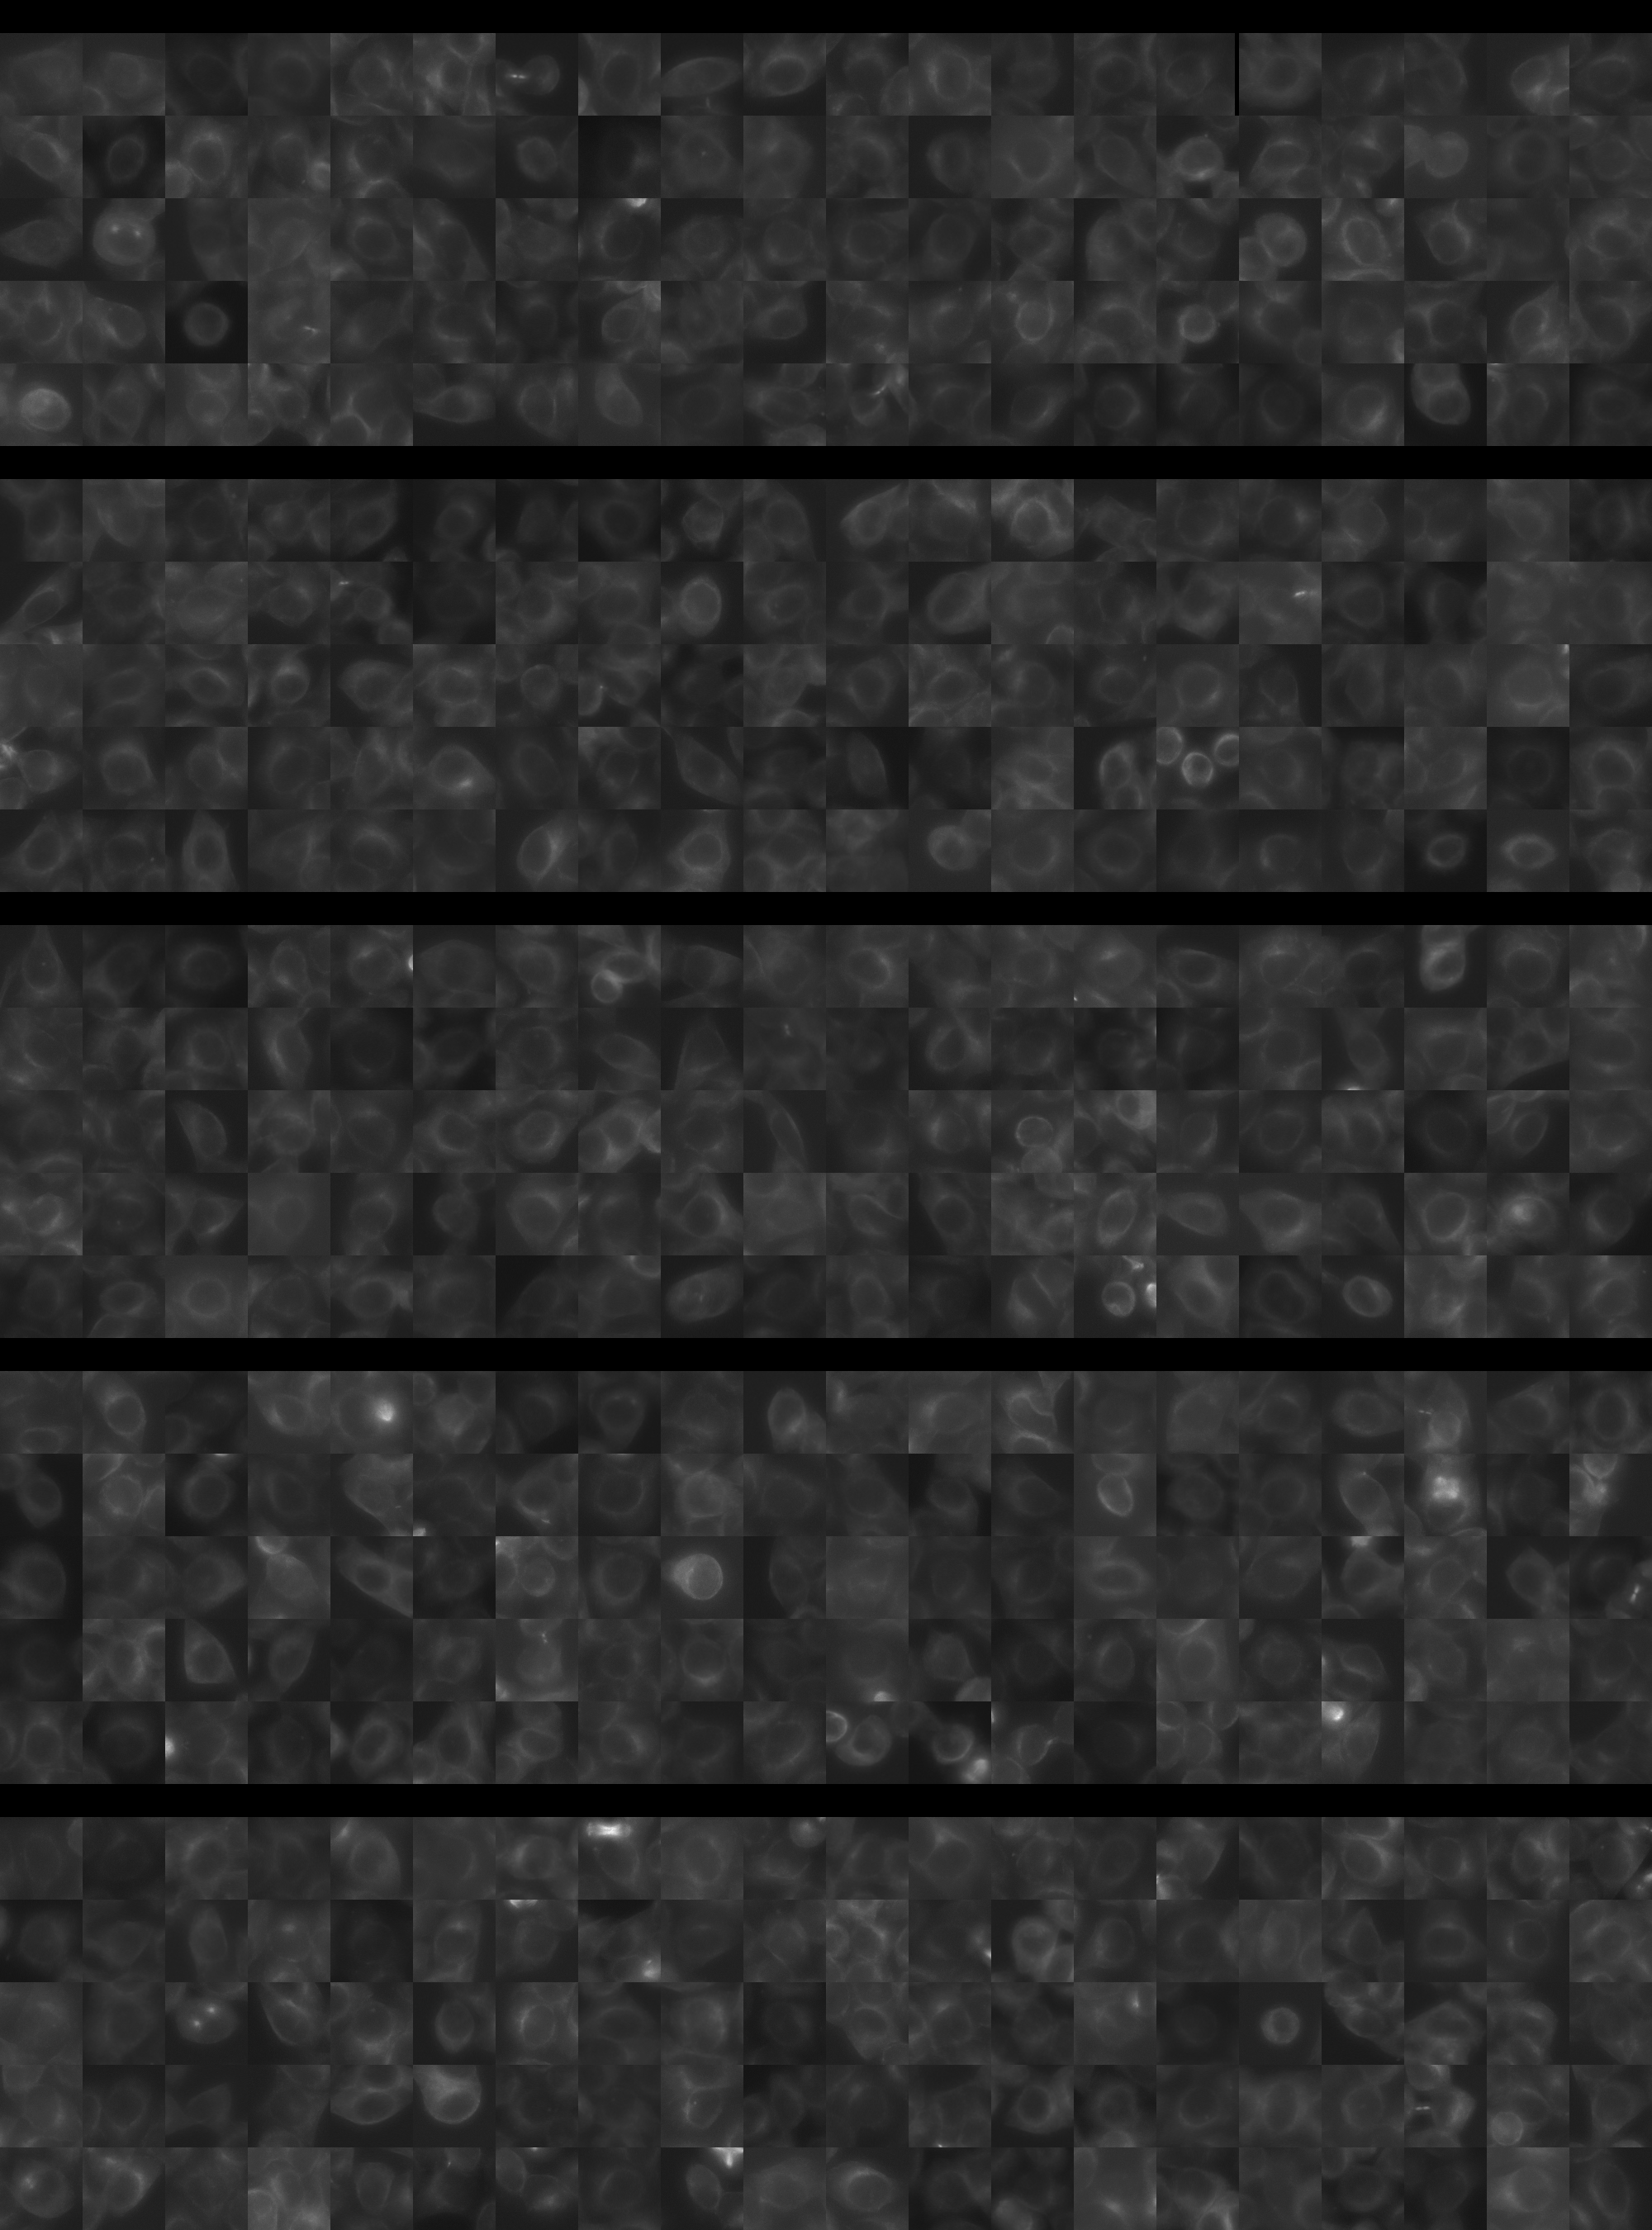
Each montage below shows randomly selected individual cell images for the same target gene separated by sgRNA, along with an example montage of cells expressing a non-targeting negative control sgRNA at the bottom. sgRNA labels in the montages correspond to the numbered sgRNA sequences in the gene info table above. The DNA (blue) and tubulin (green) channels are displayed by default, with gH2AX (grayscale) and actin (yellow) available using the check boxes. Channel brightness, contrast, and opacity are adjustable by clicking the arrow next to the channel name. When only one channel is selected, the display defaults to grayscale. Click the “Zoom” checkbox above the channel controls to enable image zooming (via scrolling) and panning (via click-and-drag).

The cell boxes displayed for this gene are square, 30.36 μm per side for the interphase montage and 30.36 μm per side for the mitotic montage.
Features

Interphase Score Rank FDR q-value
Nucleus DNA Integrated 0.093 427 of 5322 0.075
Nucleus DNA Mean -2.740e-02 2886 of 5322 0.600
Nucleus gH2AX Mean 0.025 4148 of 5322 0.533
Nucleus DNA - gH2AX Correlation 0.041 408 of 5322 0.228
Nucleus Shape Area 0.087 877 of 5322 0.095
Nucleus Shape Eccentricity 0.009 2850 of 5322 0.854
Nucleus Shape Form Factor -7.664e-02 3804 of 5322 0.050
Nucleus Shape Solidity -5.142e-02 2774 of 5322 0.139
Cell DNA Mass Displacement 0.014 3493 of 5322 0.870
Cell Tubulin Mean -8.721e-02 4814 of 5322 0.047
Cell Tubulin Mass Displacement -3.984e-02 4625 of 5322 0.431
Cell Actin Mean -4.421e-02 4245 of 5322 0.409
Cell Tubulin - Actin Correlation -4.317e-02 4944 of 5322 0.313
Cell DNA - Tubulin Correlation -4.231e-02 4872 of 5322 0.271
Cell Shape Area 0.147 329 of 5322 0.002
Cell Shape Eccentricity 0.011 2882 of 5322 0.923
Mitotic Score Rank FDR q-value
Nucleus DNA Integrated 0.219 1089 of 5322 0.837
Nucleus DNA Mean 0.109 1359 of 5322 1.000
Nucleus DNA Mass Displacement 0.142 1340 of 5322 0.999
Nucleus DNA Mean Frac 3 -4.859e-02 3829 of 5322 1.000
Nucleus gH2AX Mean -1.464e-01 4613 of 5322 1.000
Nucleus gH2AX Mean Frac 0 0.031 1819 of 5322 1.000
Nucleus Tubulin Mean Frac 0 0.268 456 of 5322 0.999
Nucleus Tubulin Mean Edge -1.363e-01 4581 of 5322 0.999
Nucleus Tubulin Std Edge -1.983e-01 4618 of 5322 0.999
Nucleus Shape Area 0.371 527 of 5322 0.419
Nucleus Shape Eccentricity -1.920e-01 4476 of 5322 1.000
Nucleus Shape Form Factor -2.143e-01 4250 of 5322 0.998
Cell Tubulin Mean 0.150 1433 of 5322 0.997
Cell Tubulin Mean Frac 3 -3.015e-01 4720 of 5322 0.971
Cell Actin Mean 0.029 2817 of 5322 0.997
Cell Shape Area 0.272 814 of 5322 0.960
( Reset Zoom )
Brightness
Contrast
Opacity
Brightness
Contrast
Opacity
Brightness
Contrast
Opacity
Brightness
Contrast
Opacity
Brightness
Contrast
Opacity

( Reset Zoom )
Brightness
Contrast
Opacity
Brightness
Contrast
Opacity
Brightness
Contrast
Opacity
Brightness
Contrast
Opacity
Brightness
Contrast
Opacity

MIT Central Accessability