SOX10

Due to sgRNA sequence design constraints two or more of the sgRNAs used to target this gene have multiple genomic target sites, potentially impacting the observed phenotype through increased DNA damage.
Gene symbol: SOX10
Gene: 6663
Uniprot Function: Transcription factor that plays a central role in developing and mature glia (By similarity). Specifically activates expression of myelin genes, during oligodendrocyte (OL) maturation, such as DUSP15 and MYRF, thereby playing a central role in oligodendrocyte maturation and CNS myelination (By similarity). Once induced, MYRF cooperates with SOX10 to implement the myelination program (By similarity). Transcriptional activator of MITF, acting synergistically with PAX3 (PubMed:21965087). Transcriptional activator of MBP, via binding to the gene promoter (By similarity).
Mitotic Index 0.0253
Interphase Cluster: #221 (4 genes)
Mitotic Cluster: #91 (25 genes)
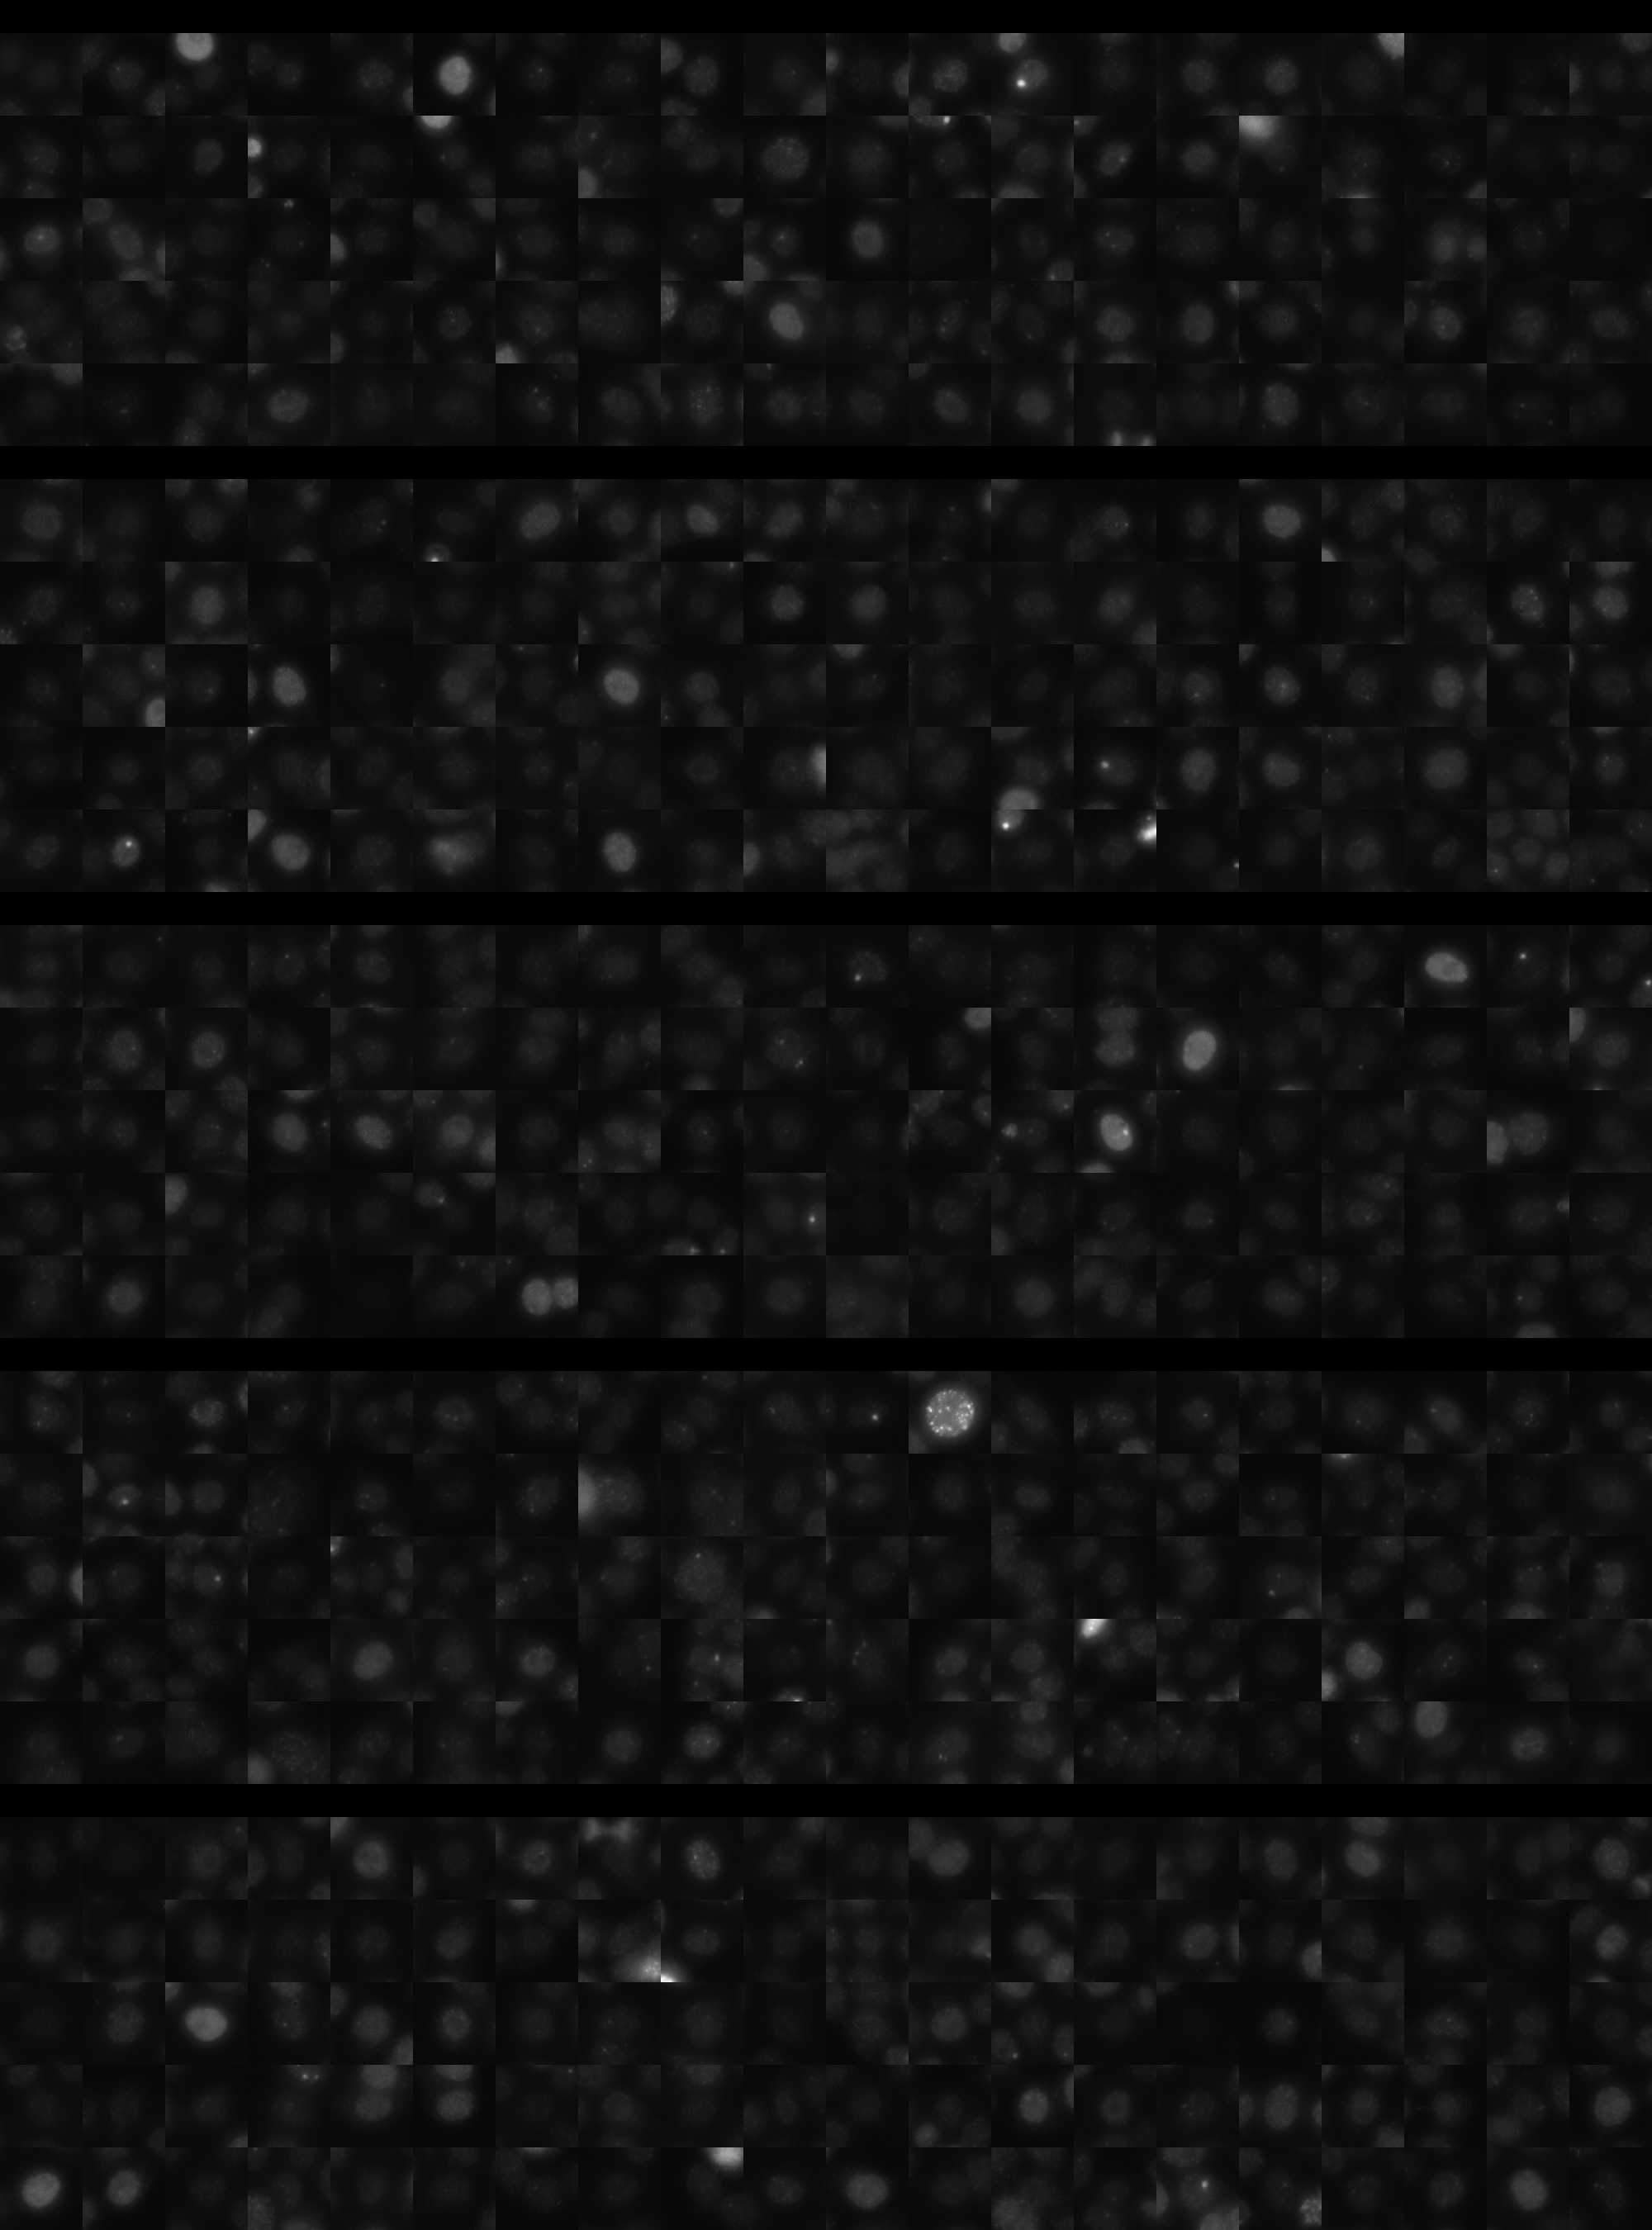
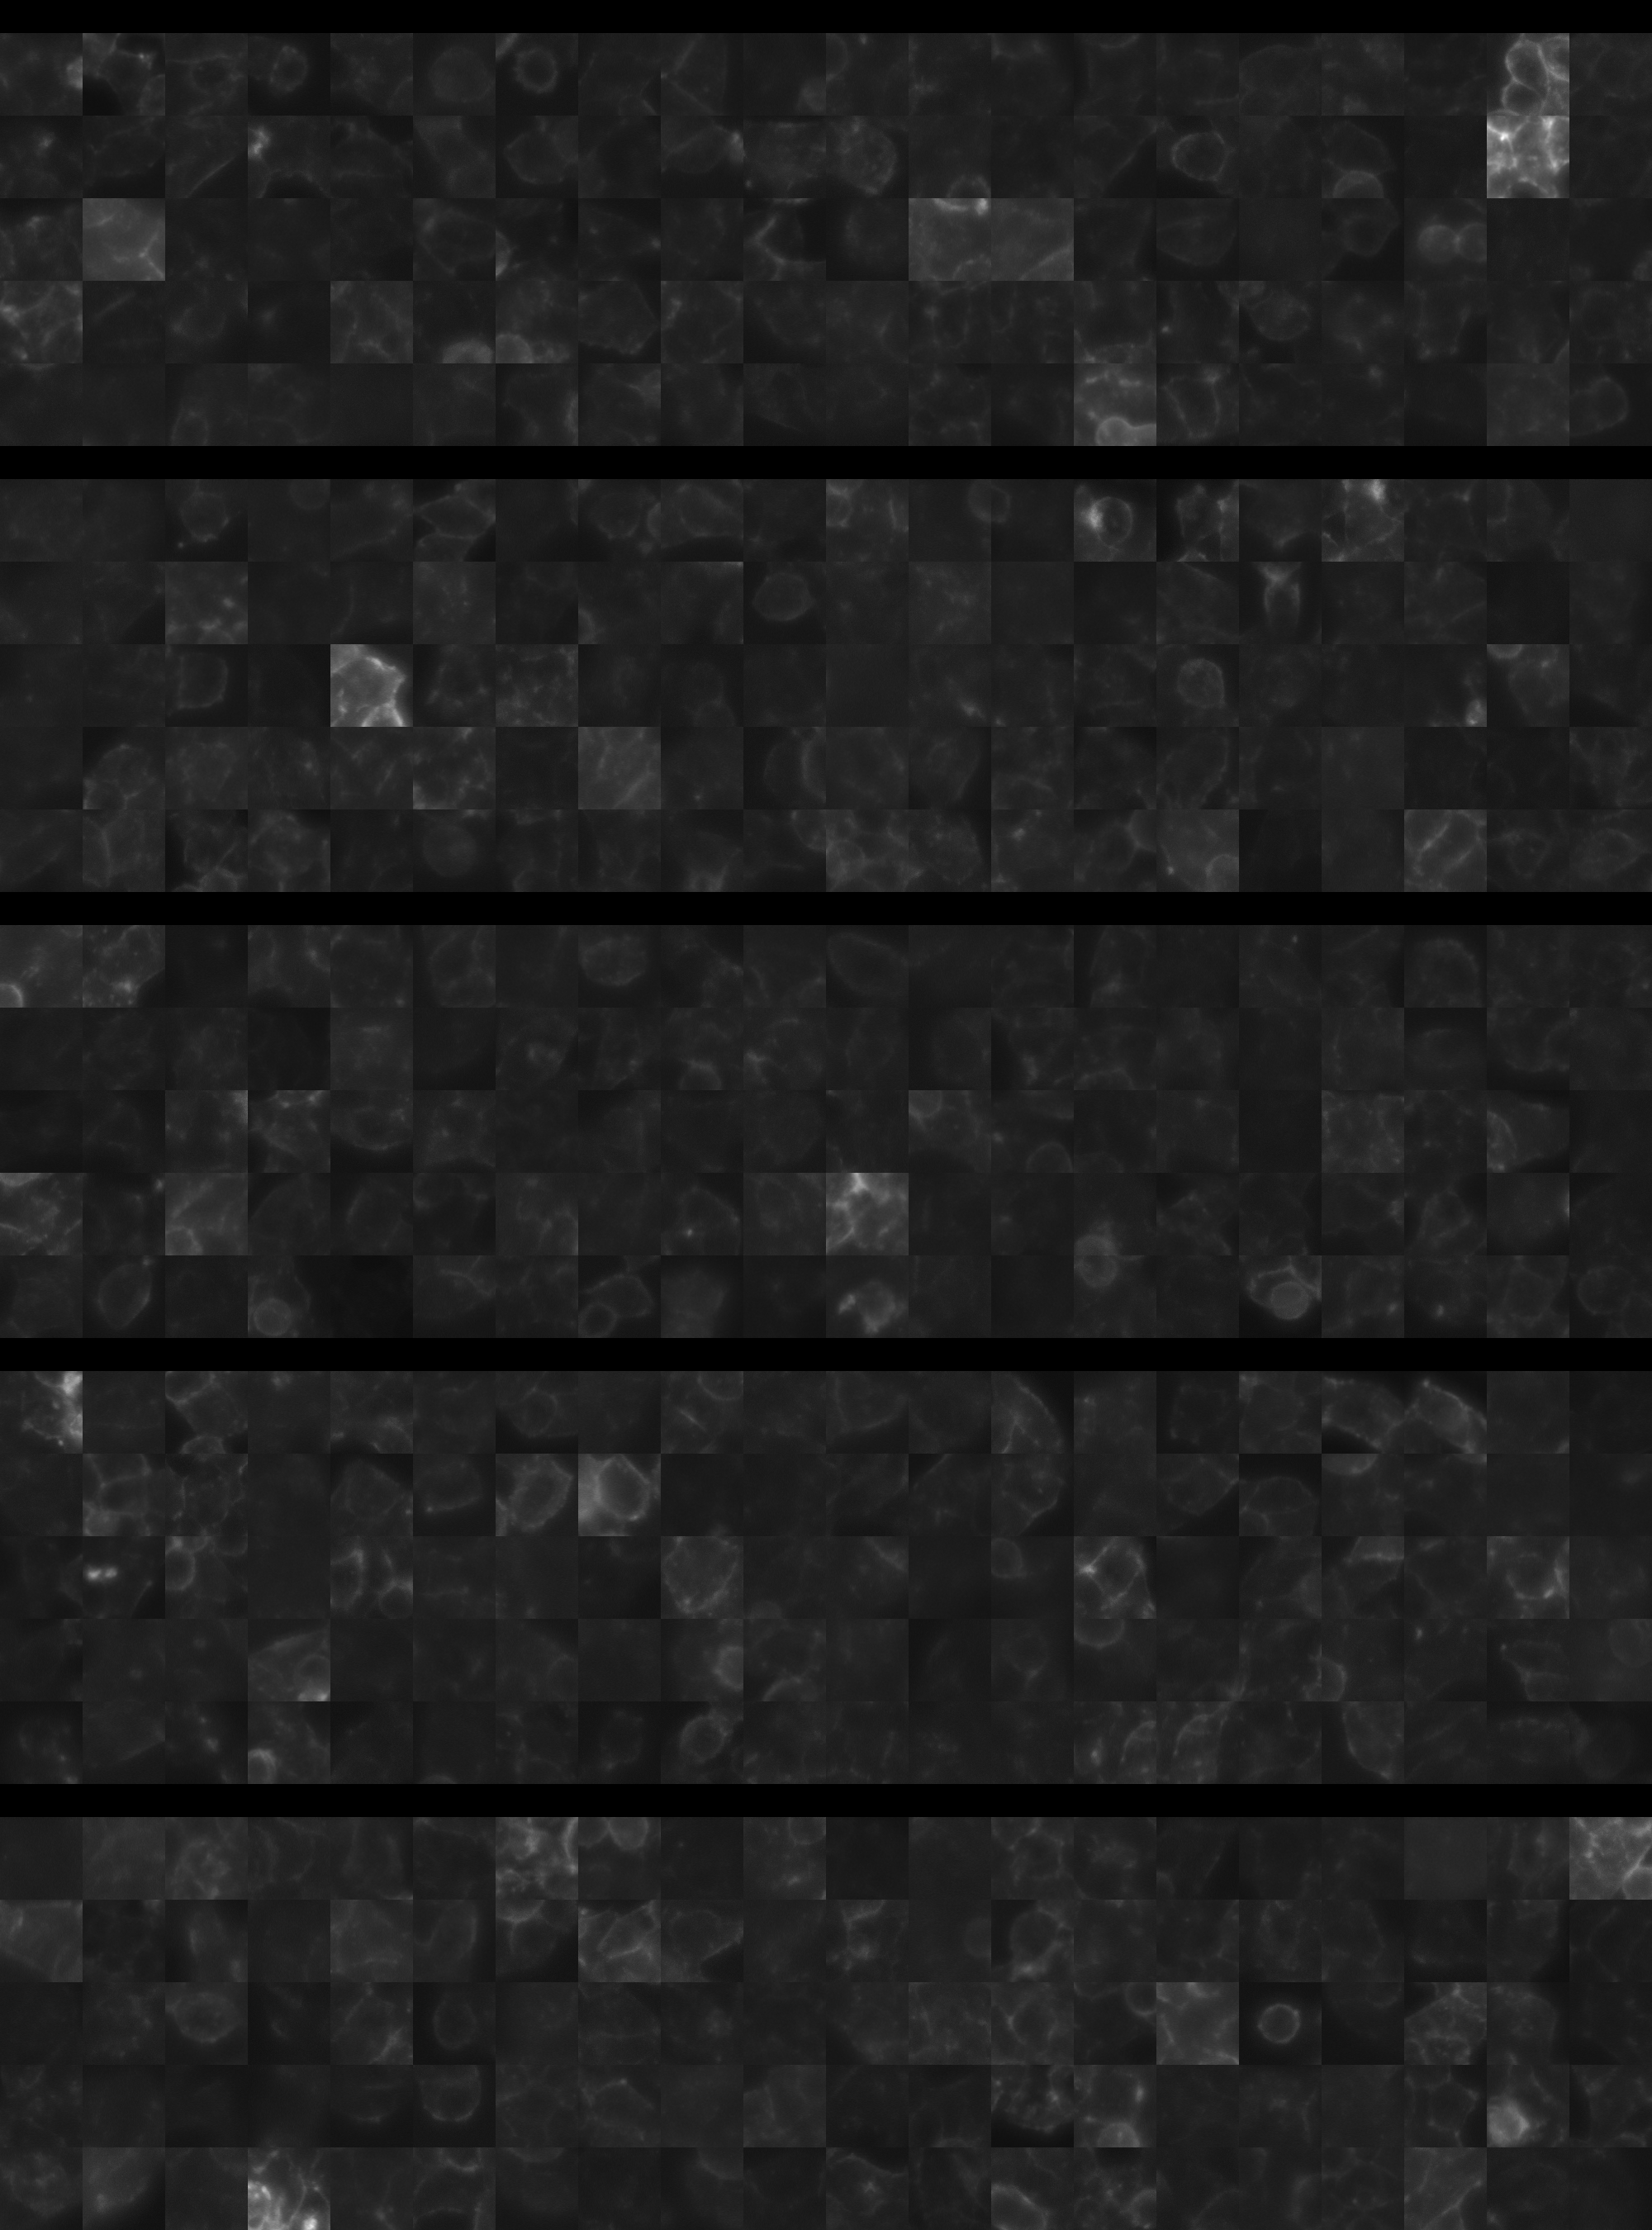
sgRNA 1: CAGCGGCTACGACTGGACGC (interphase cells: 1441, mitotic cells: 35)
sgRNA 2: CCATGTTGGACATTACCTCG (interphase cells: 1429, mitotic cells: 35)
sgRNA 3: GGTCAGAGTAGTCAAACTGG (interphase cells: 1814, mitotic cells: 46)
sgRNA 4: GTAGTGGGCCTGGATGGCGG (interphase cells: 447, mitotic cells: 17)

Interphase Cluster

Mitotic Cluster

Overview

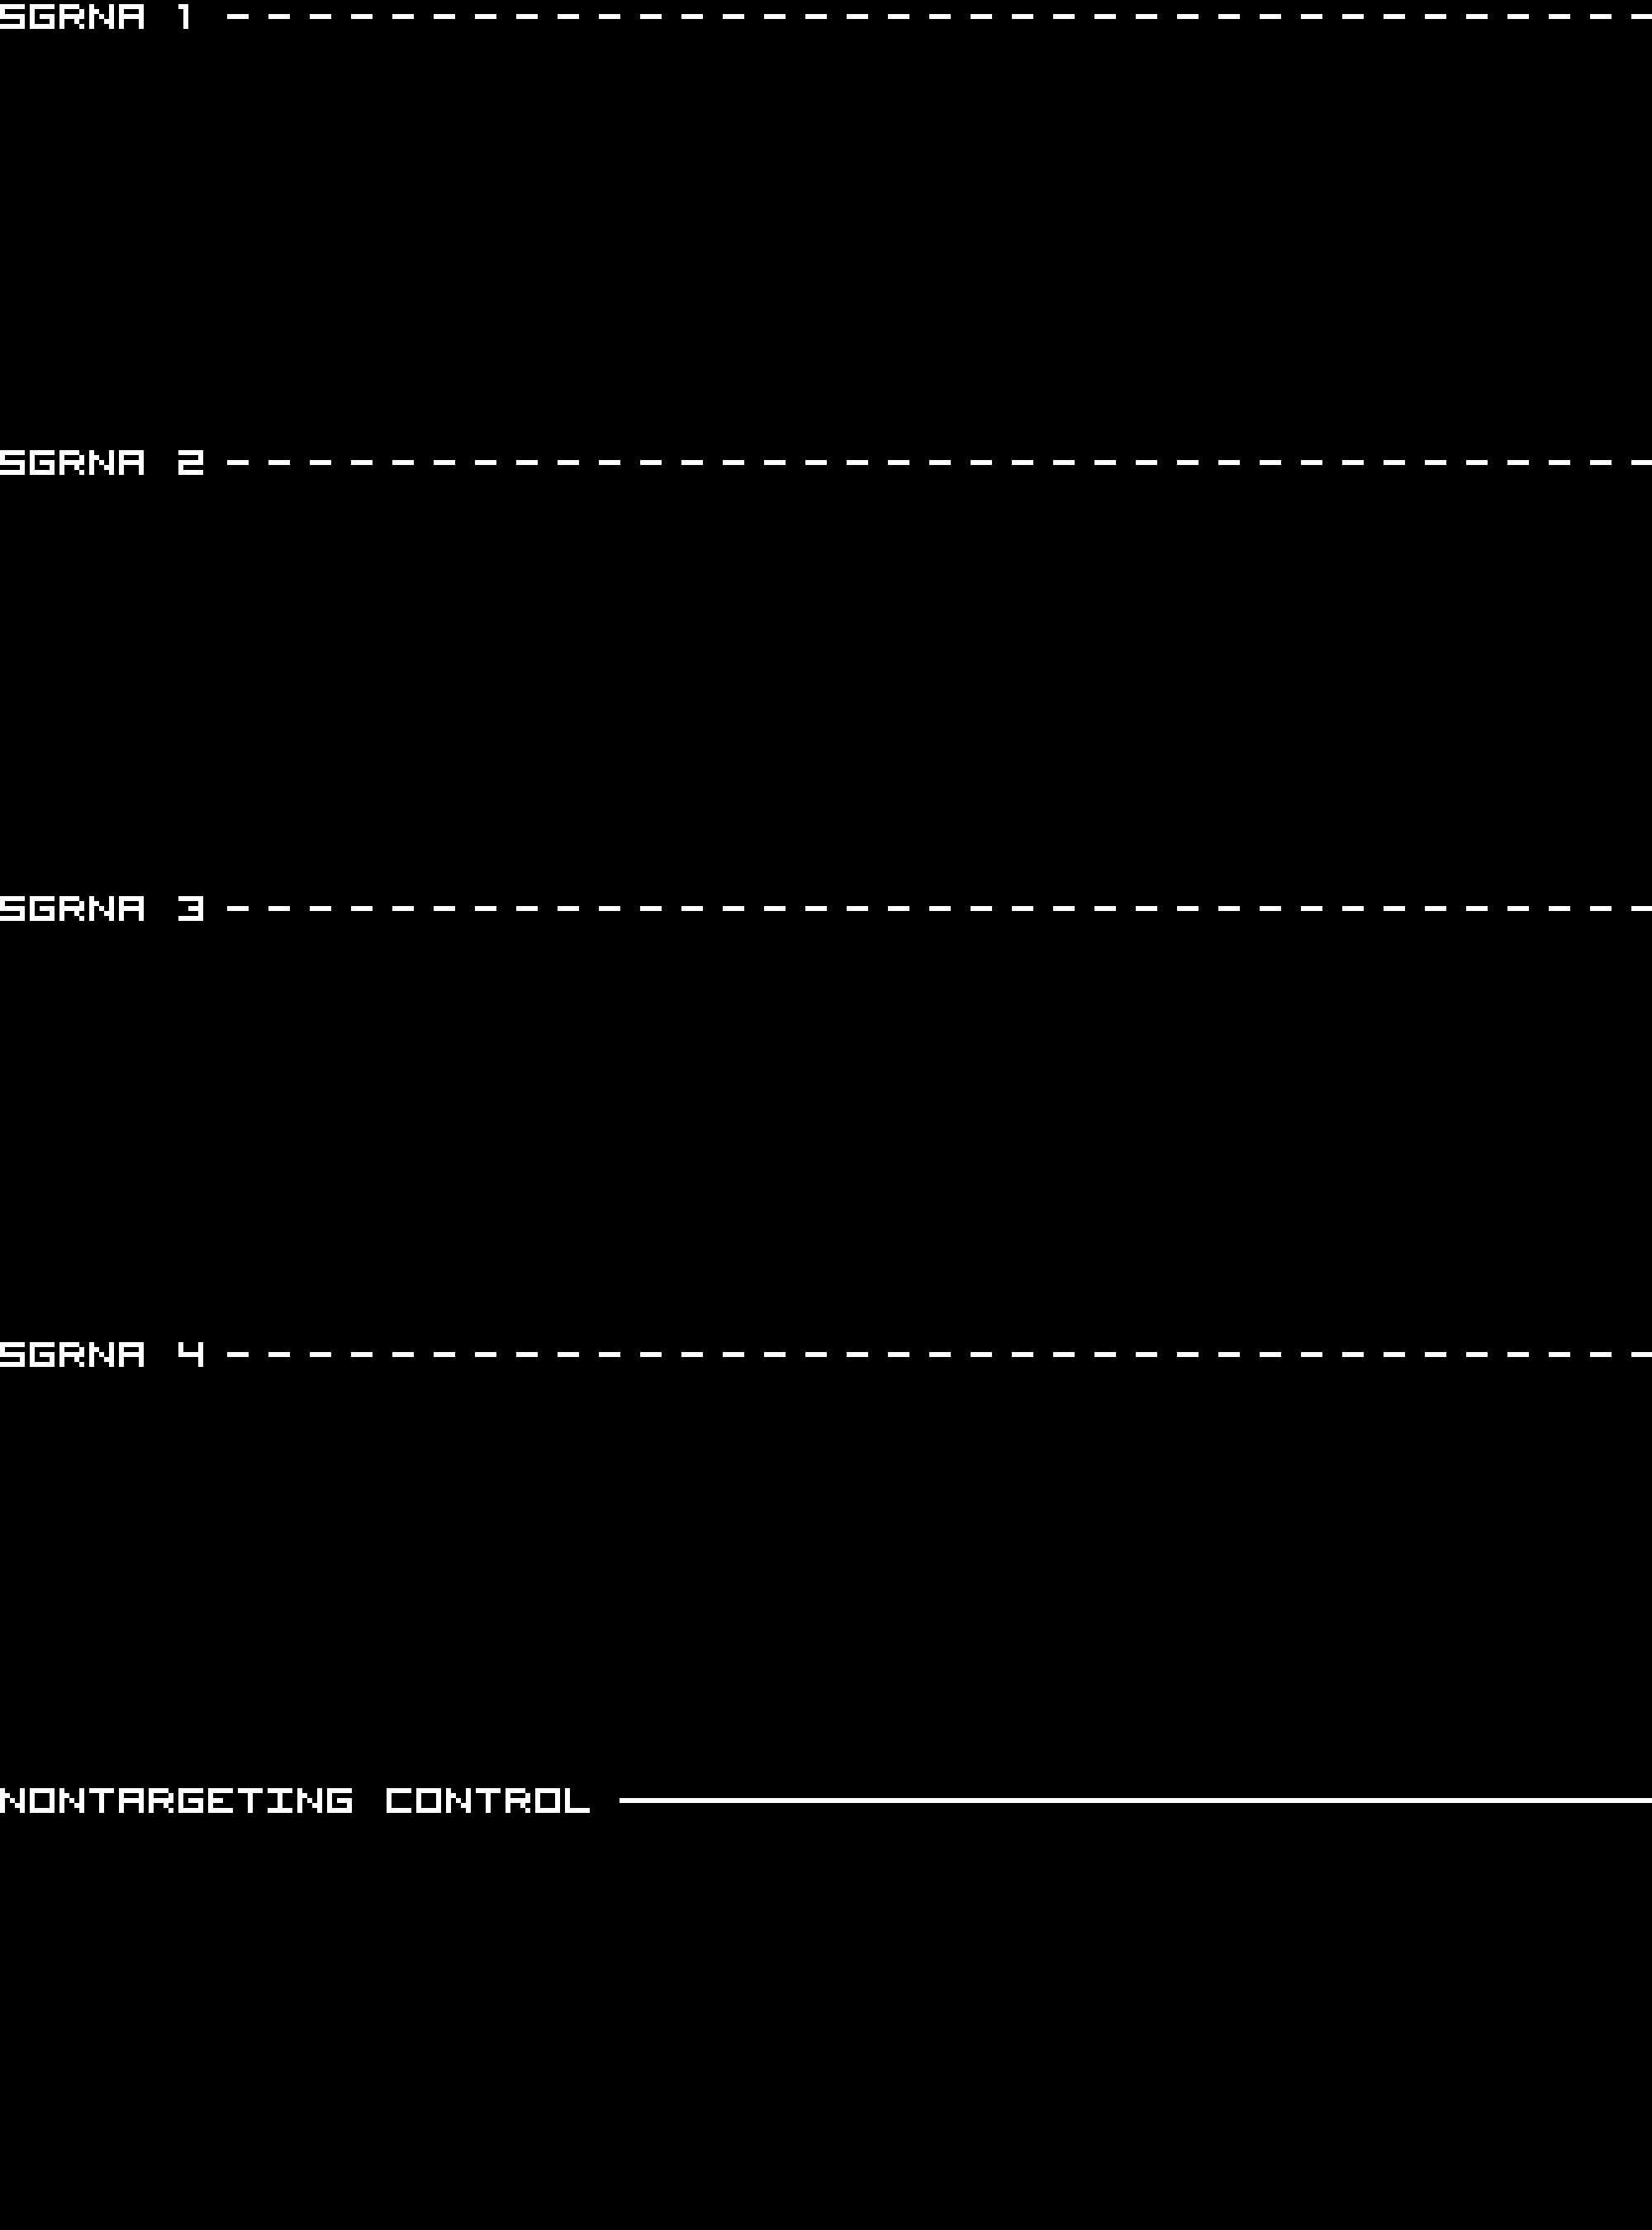
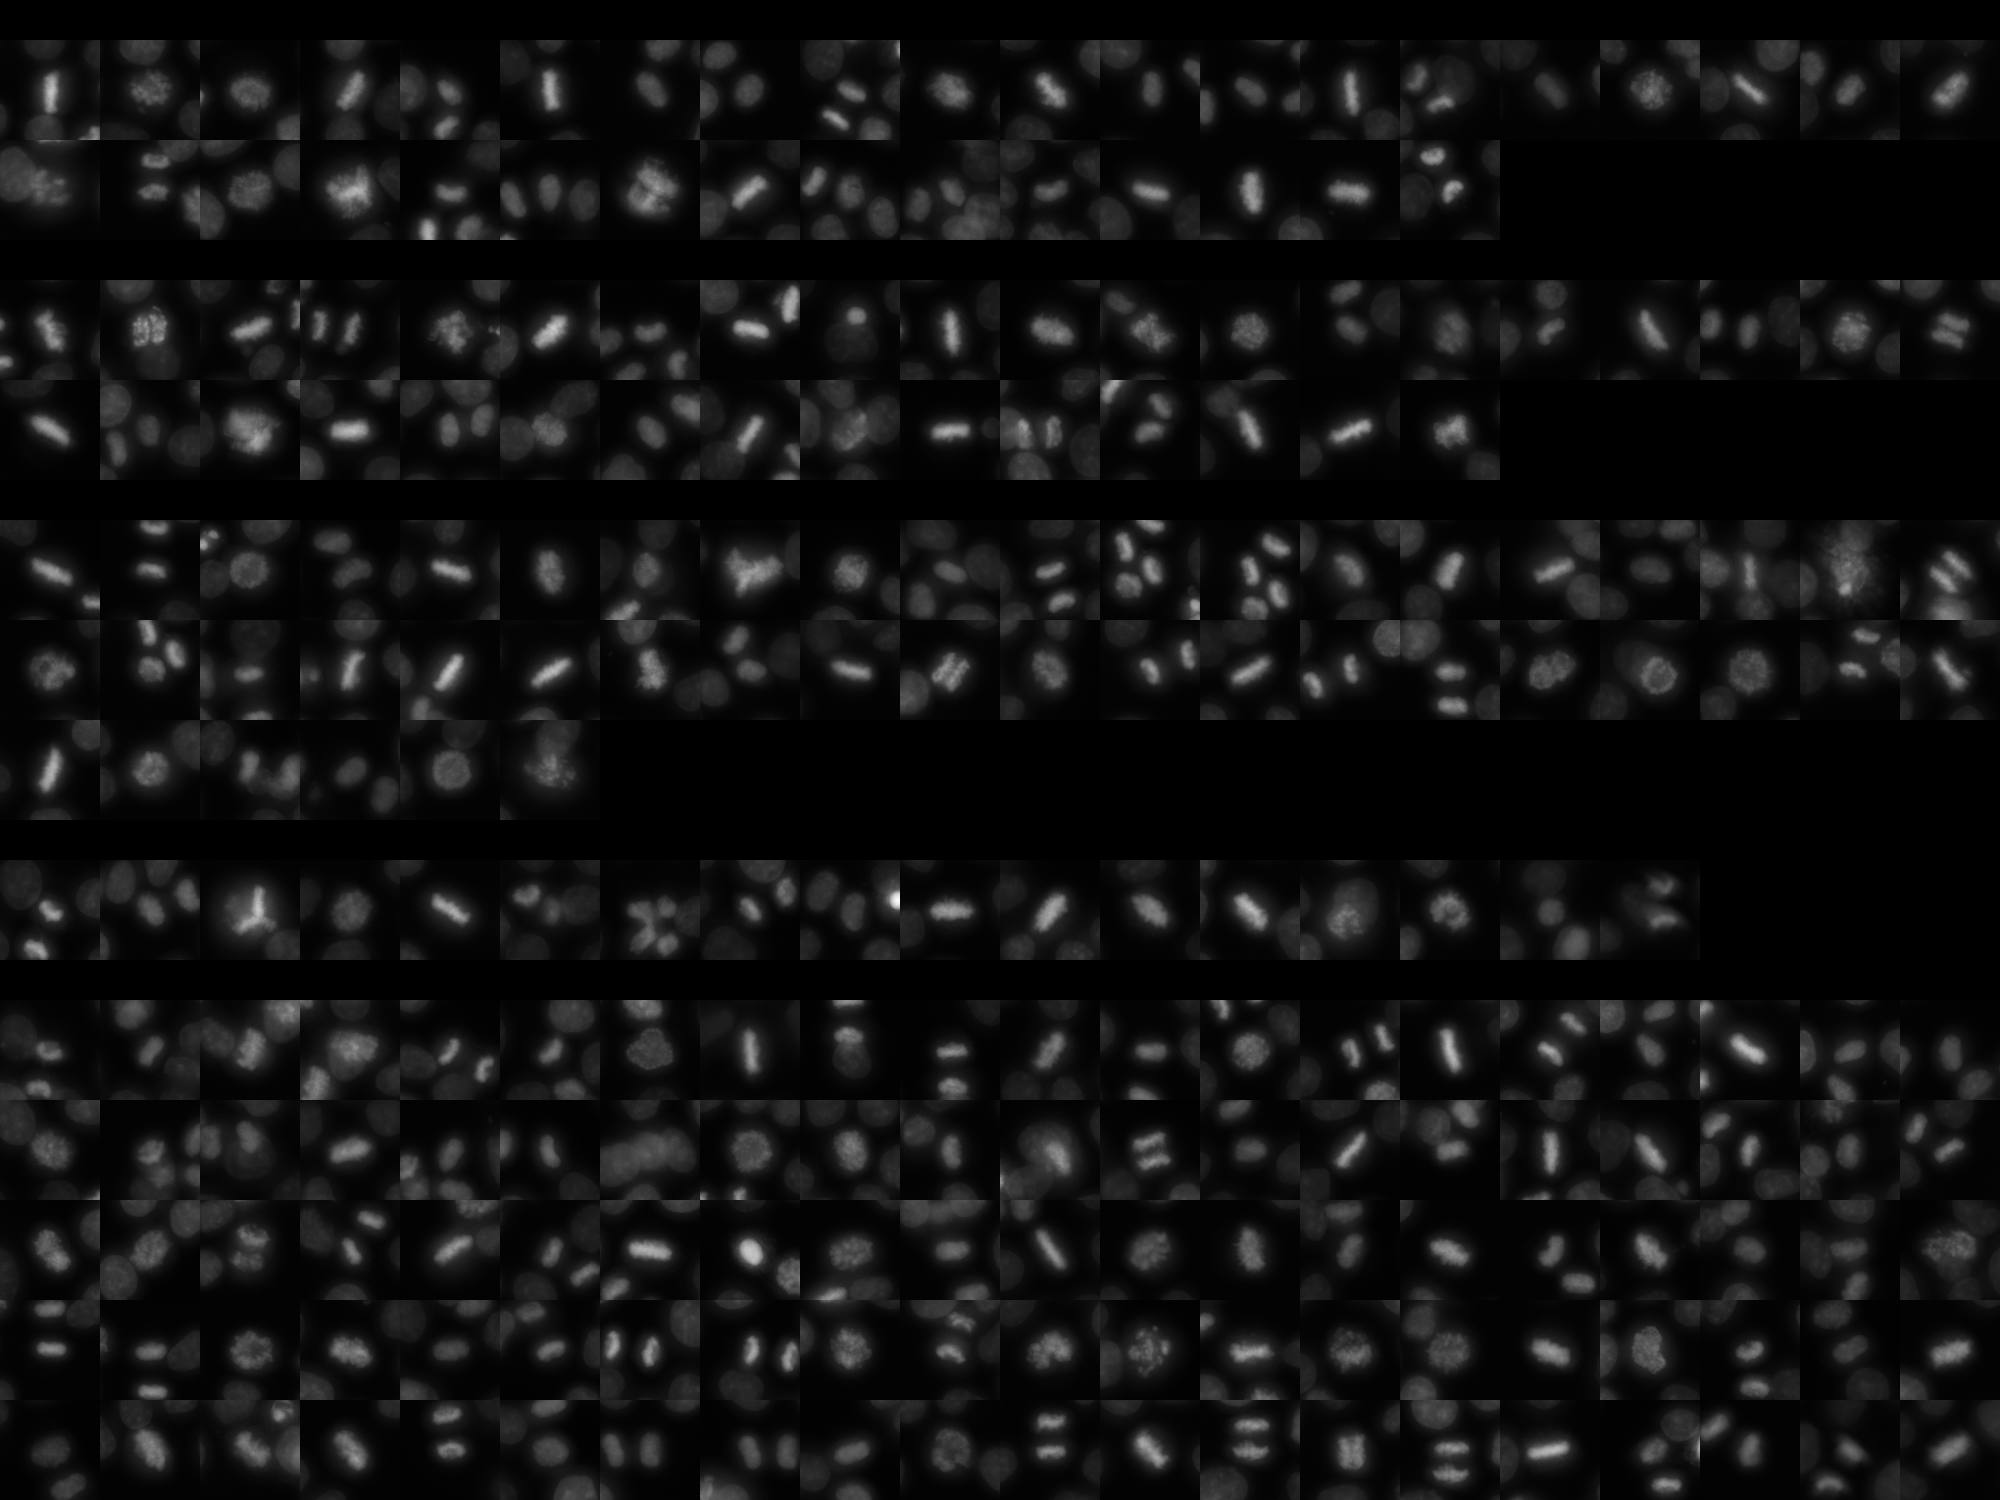
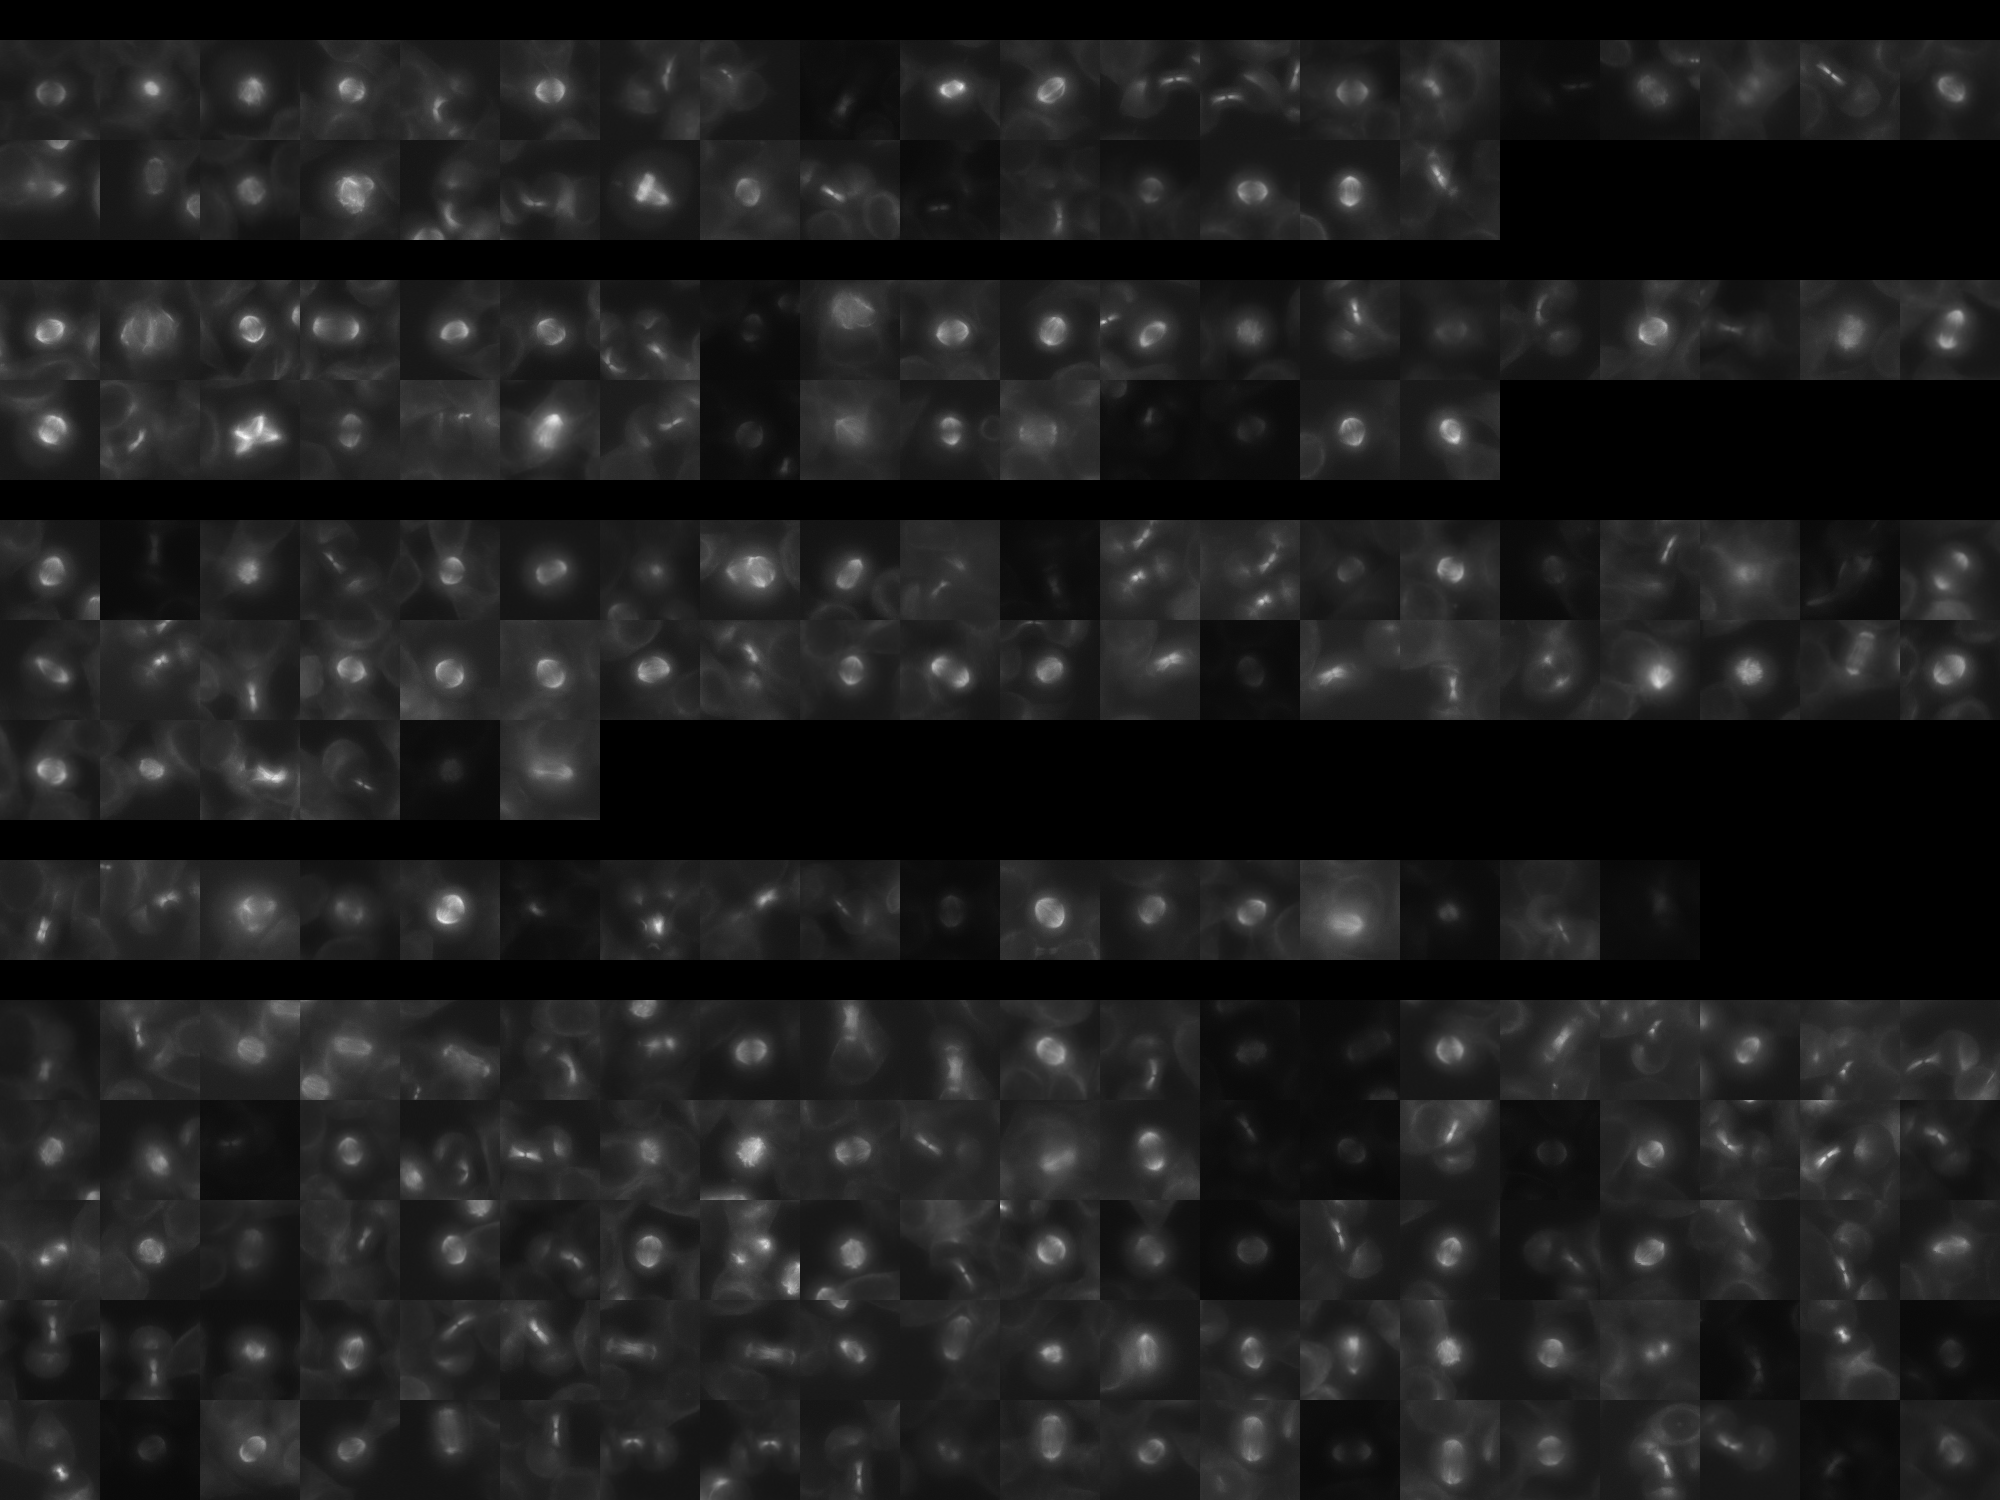
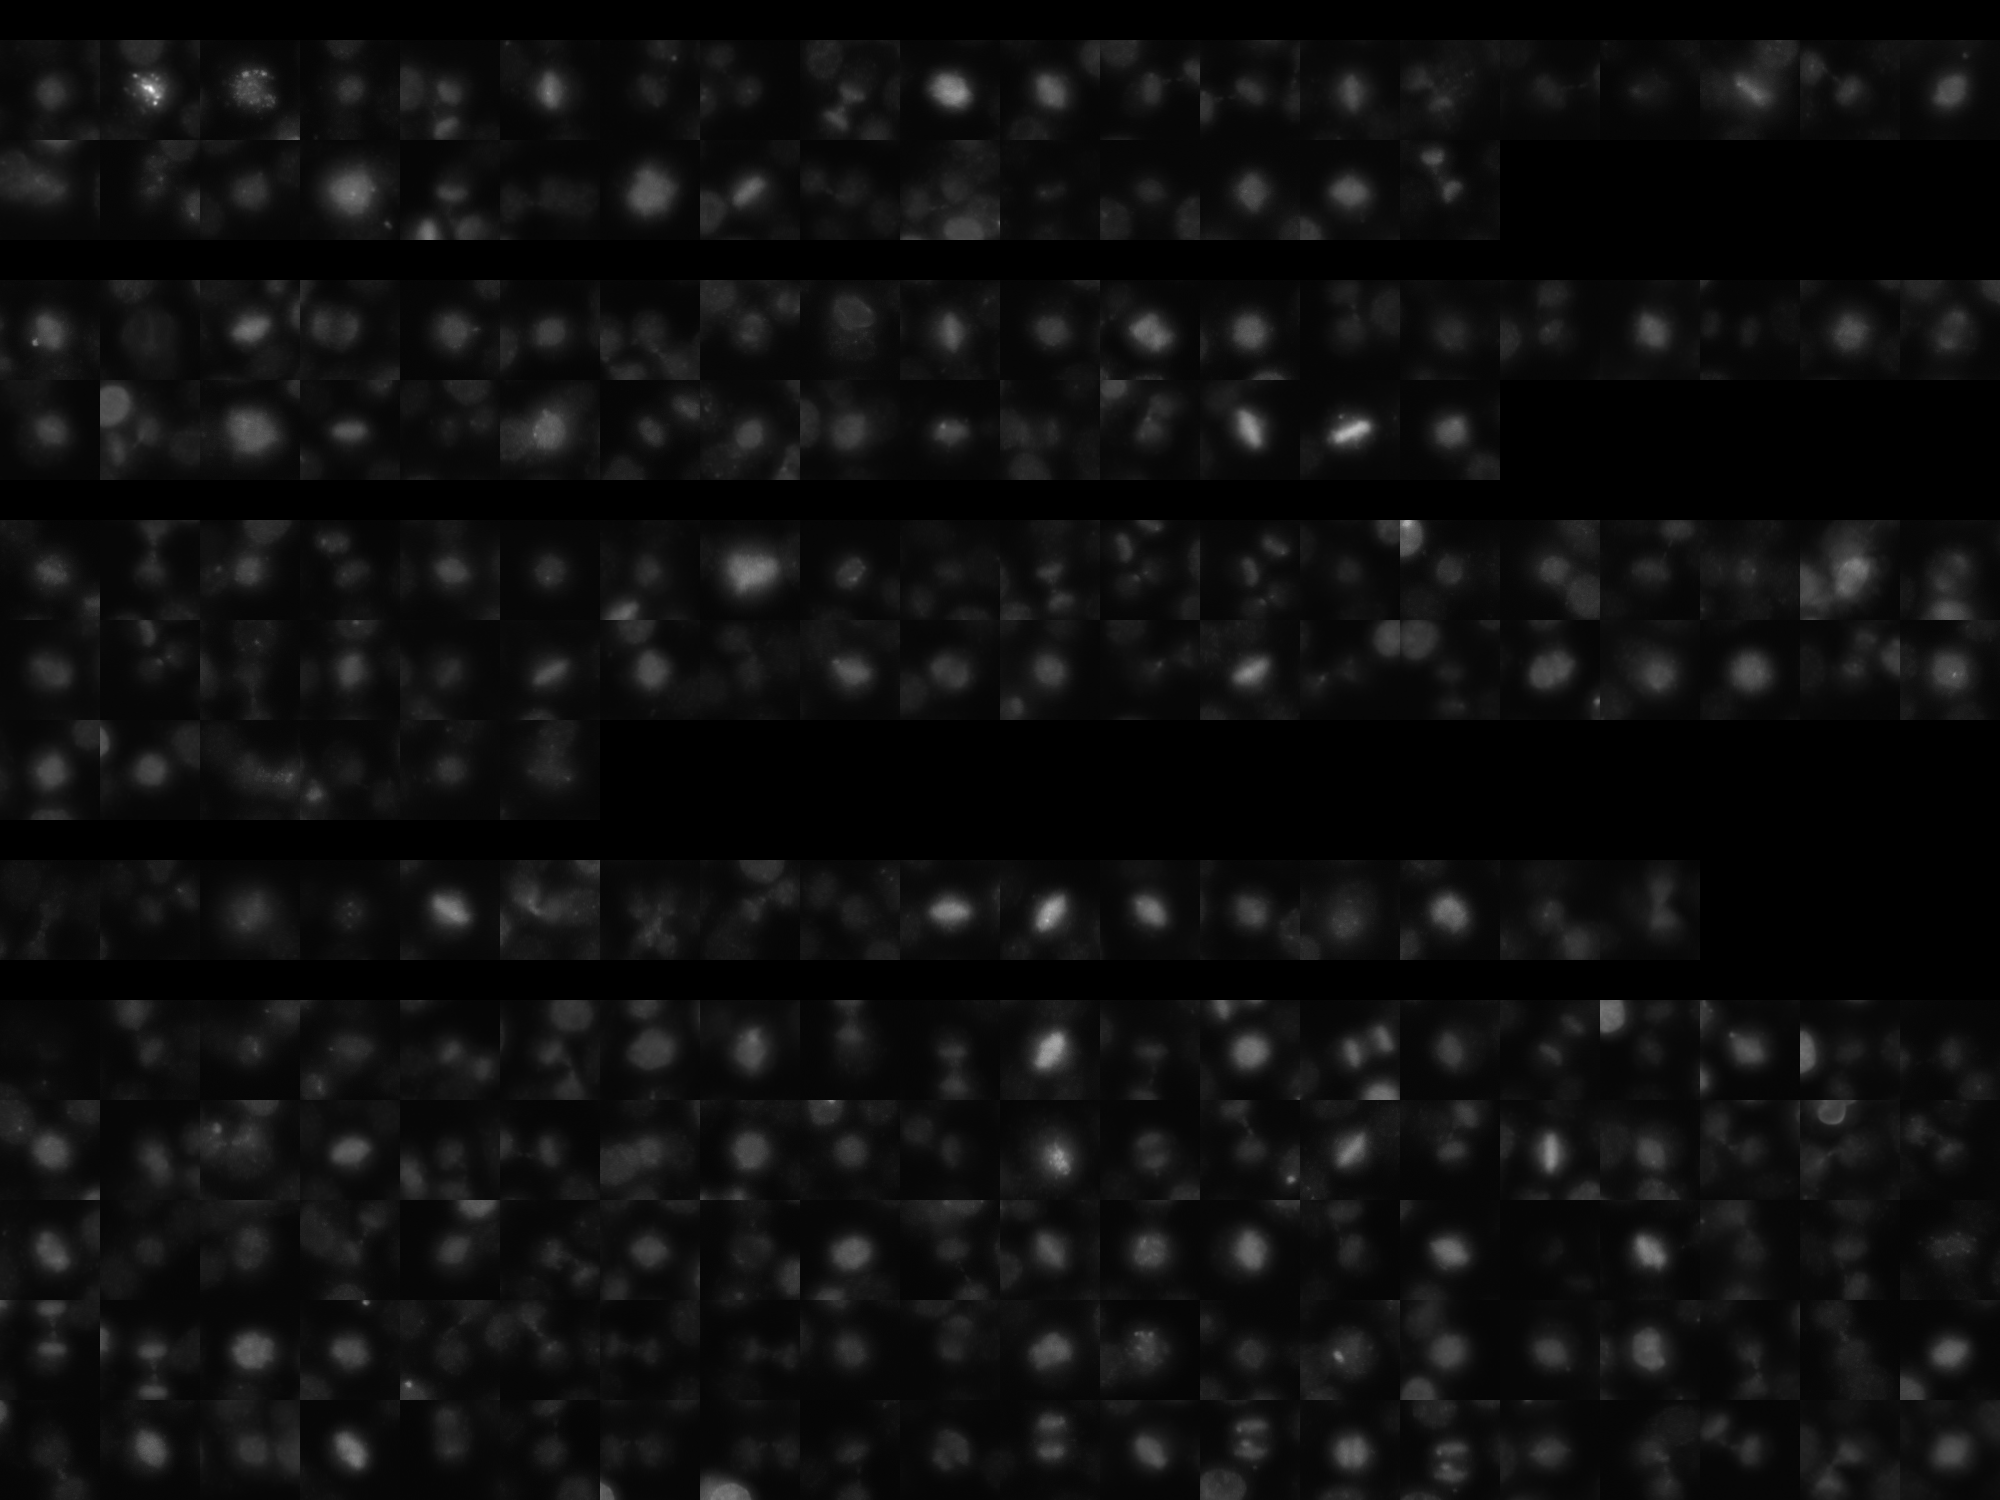
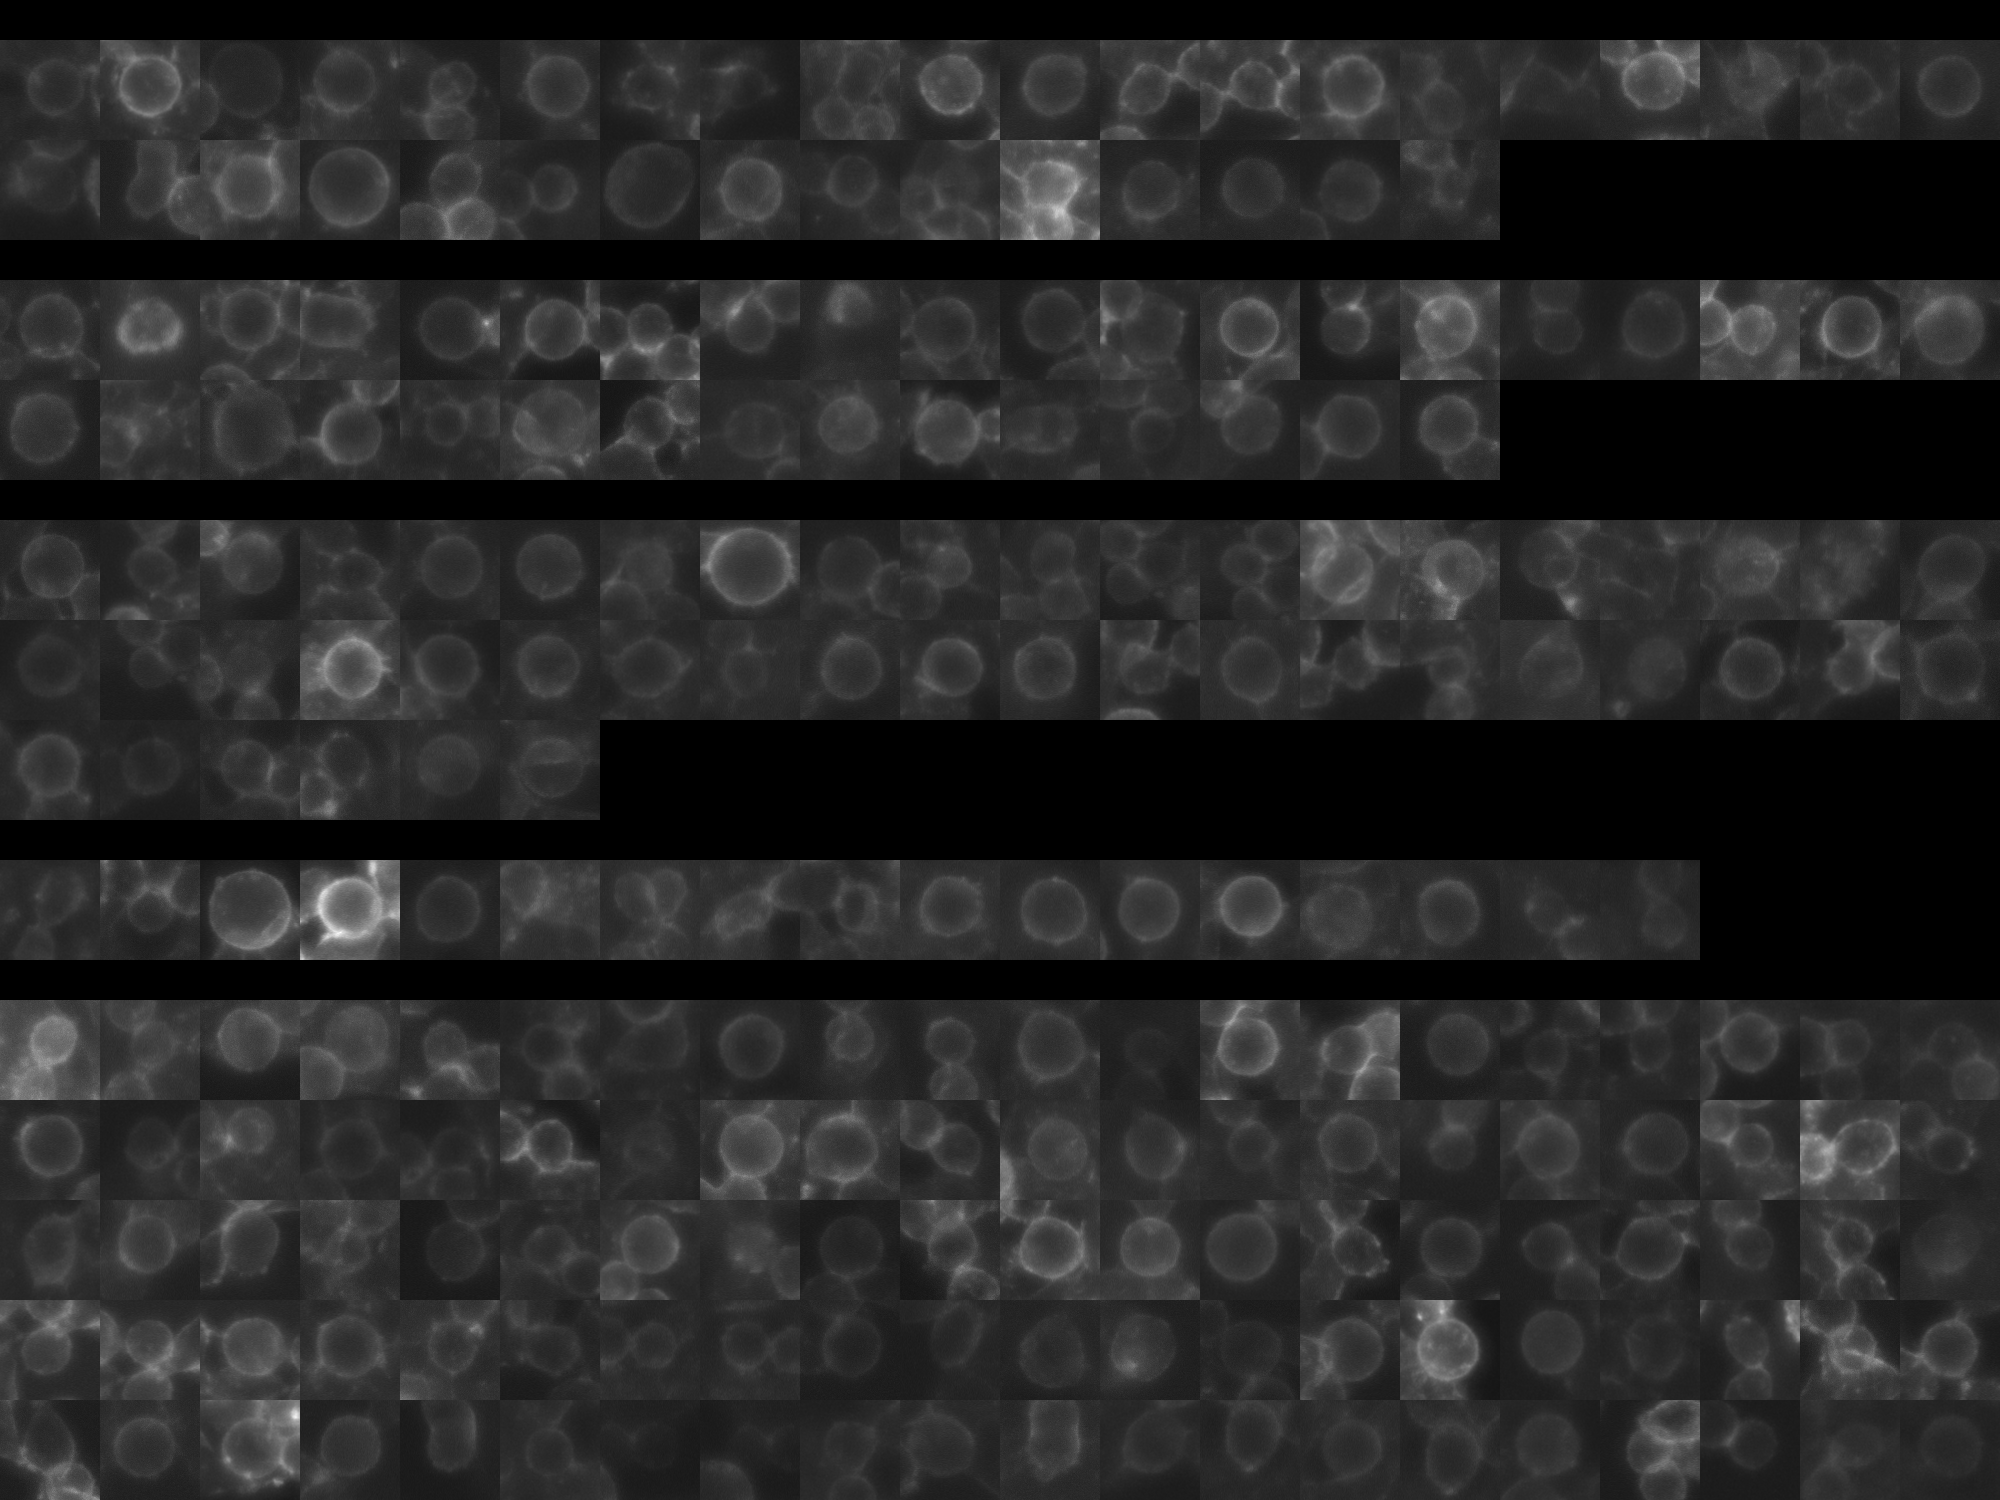
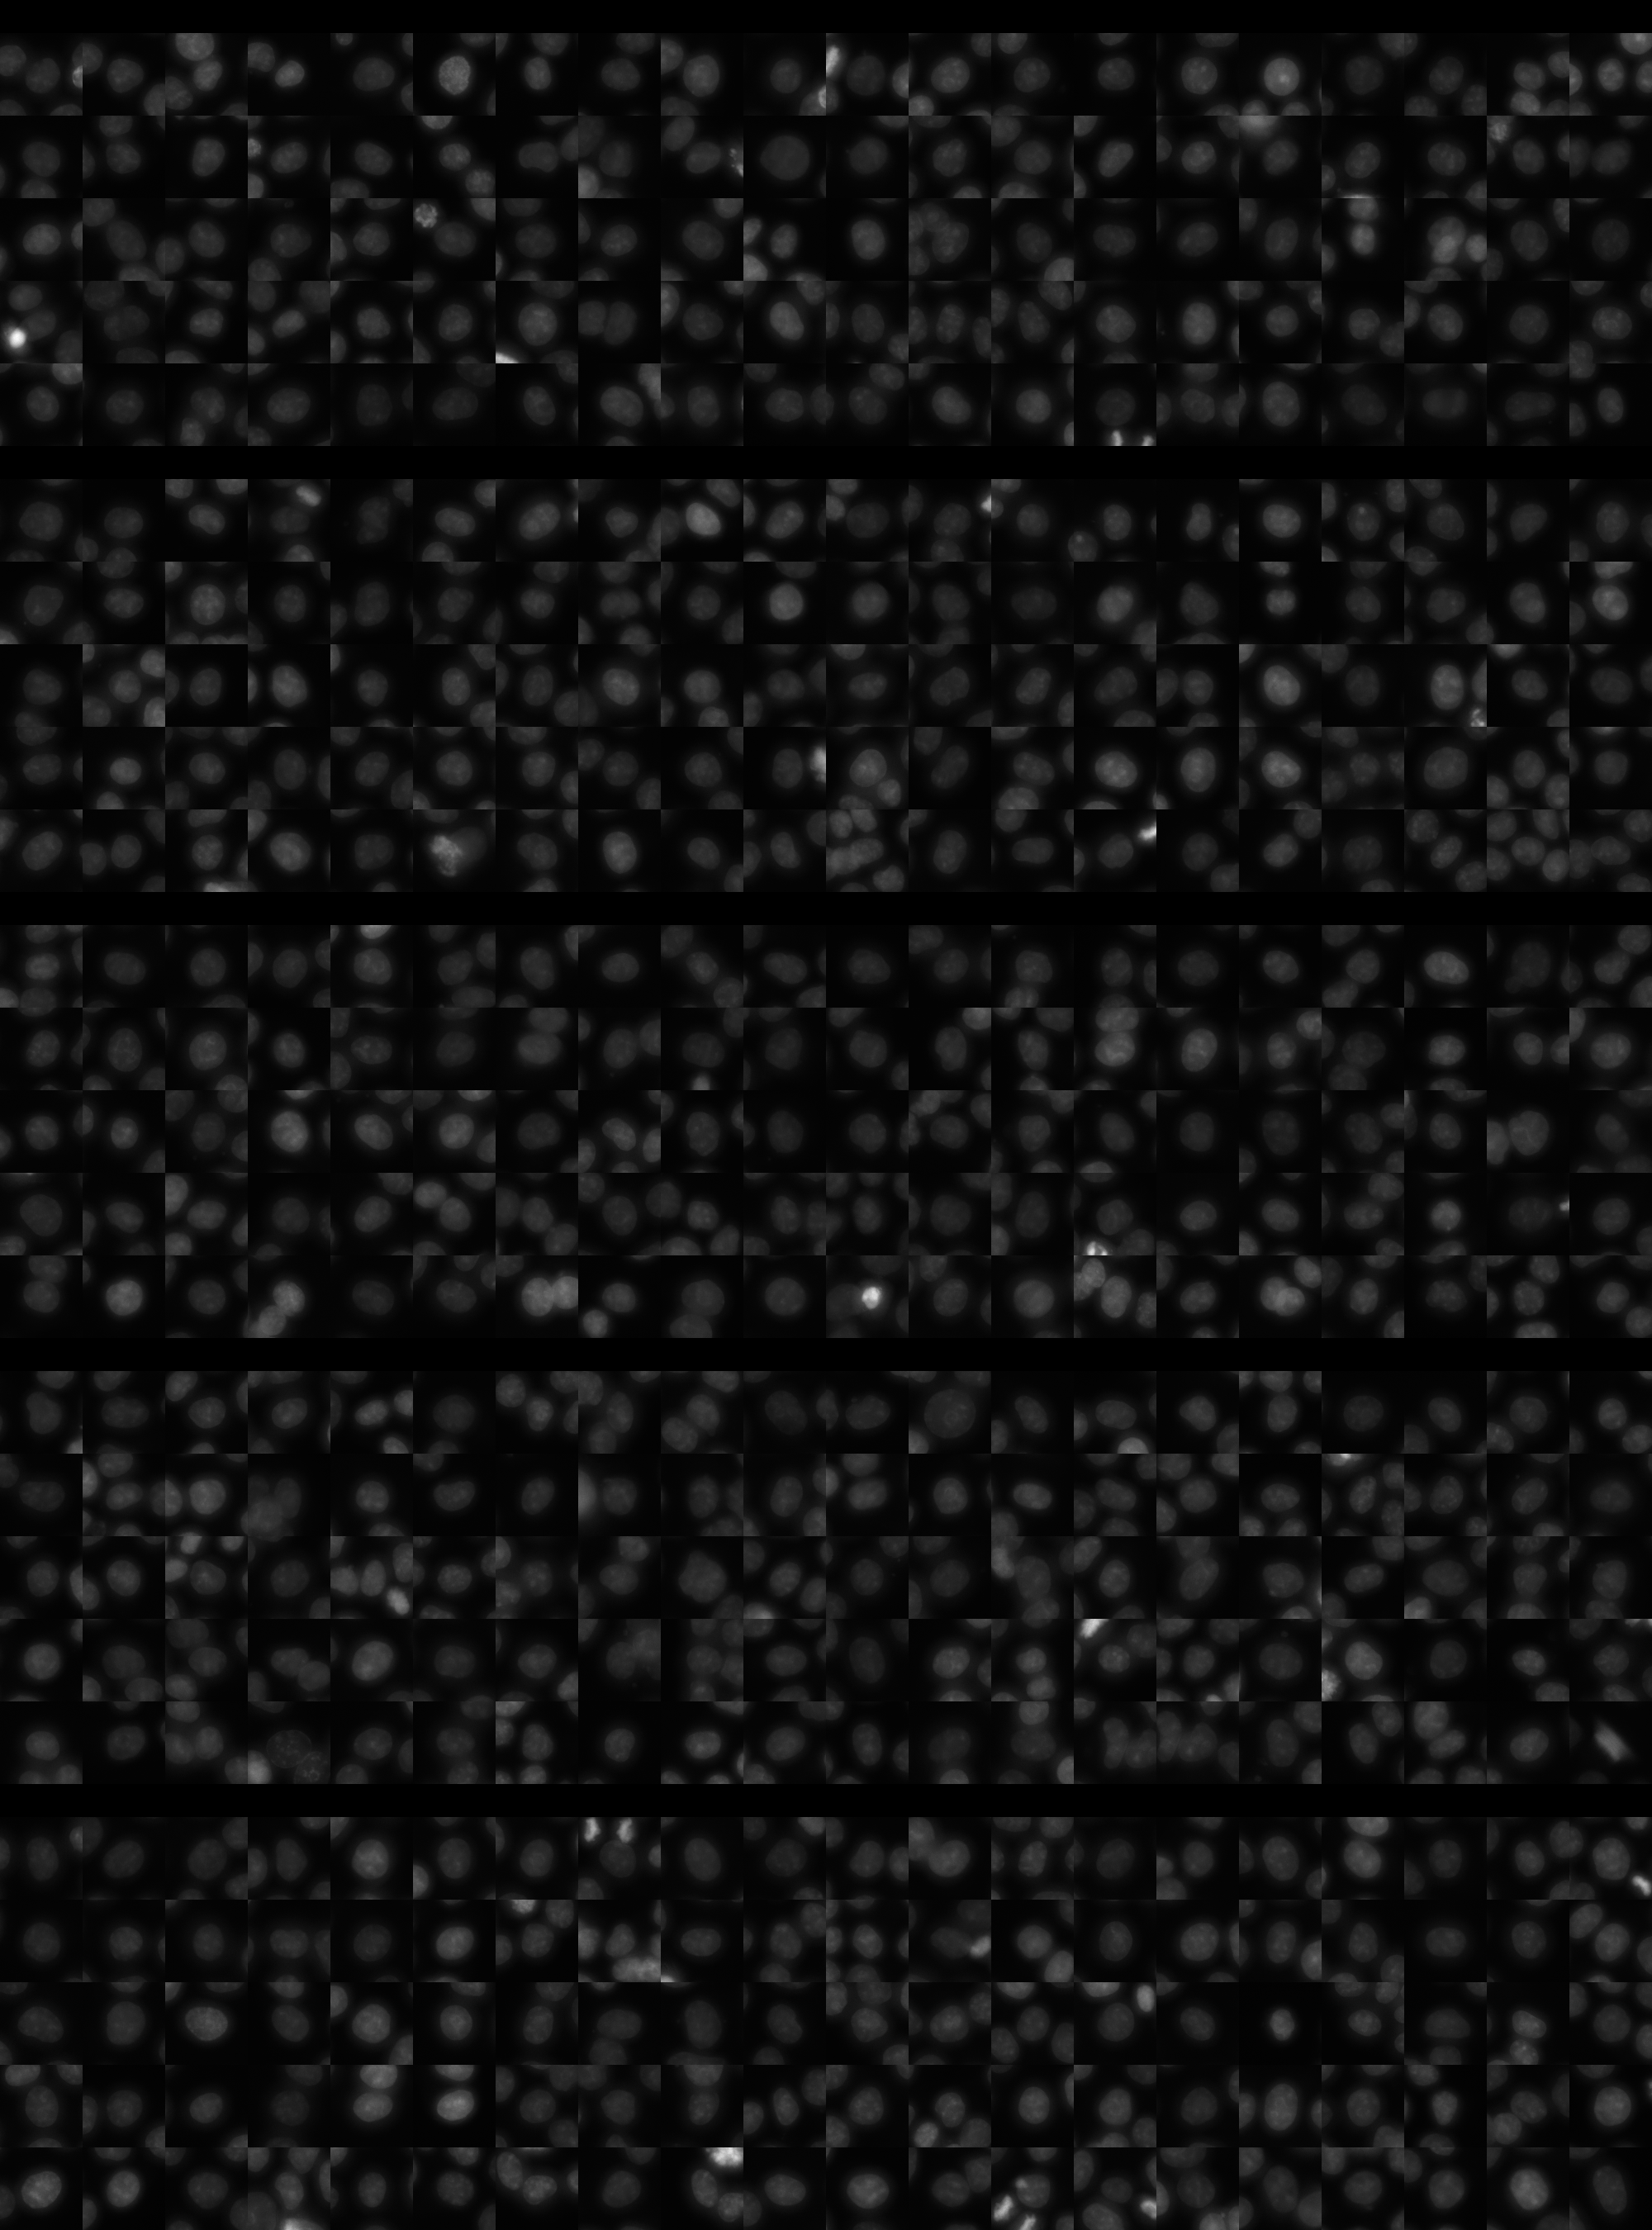
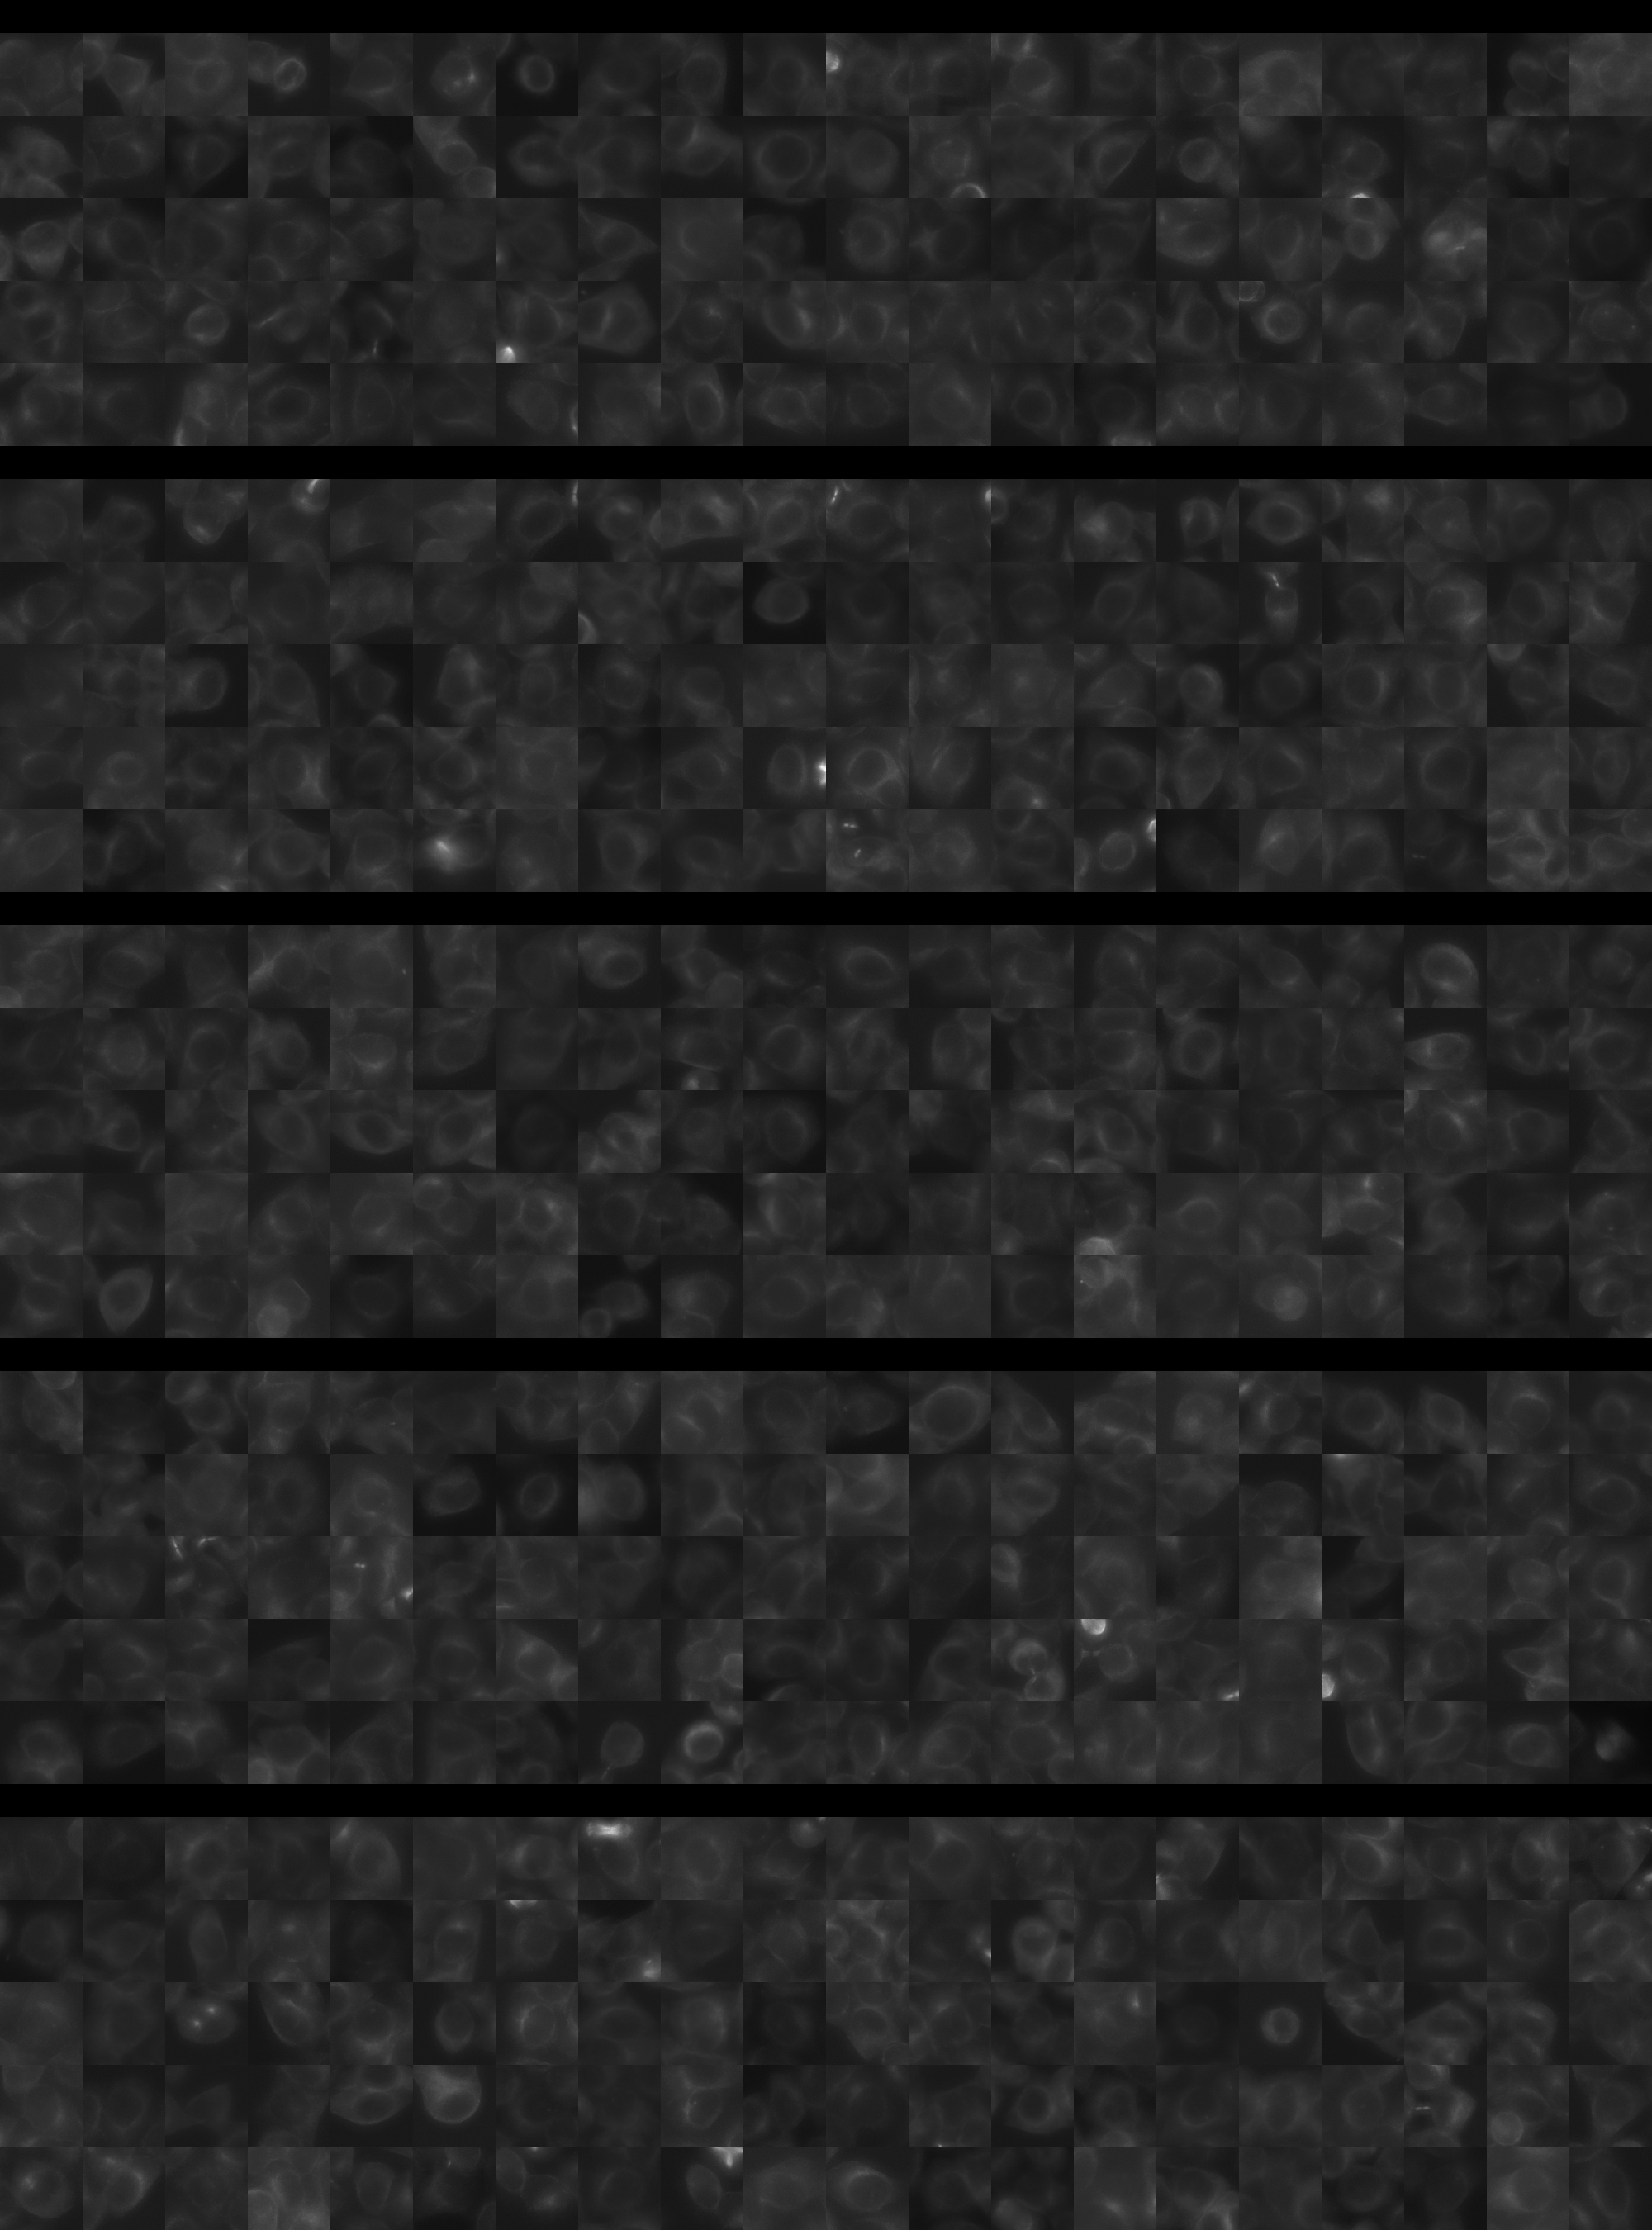
Each montage below shows randomly selected individual cell images for the same target gene separated by sgRNA, along with an example montage of cells expressing a non-targeting negative control sgRNA at the bottom. sgRNA labels in the montages correspond to the numbered sgRNA sequences in the gene info table above. The DNA (blue) and tubulin (green) channels are displayed by default, with gH2AX (grayscale) and actin (yellow) available using the check boxes. Channel brightness, contrast, and opacity are adjustable by clicking the arrow next to the channel name. When only one channel is selected, the display defaults to grayscale. Click the “Zoom” checkbox above the channel controls to enable image zooming (via scrolling) and panning (via click-and-drag).

The cell boxes displayed for this gene are square, 30.36 μm per side for the interphase montage and 30.36 μm per side for the mitotic montage.
Features

Interphase Score Rank FDR q-value
Nucleus DNA Integrated -5.224e-02 4911 of 5322 0.314
Nucleus DNA Mean -7.773e-02 4245 of 5322 0.074
Nucleus gH2AX Mean 0.067 2969 of 5322 0.103
Nucleus DNA - gH2AX Correlation -1.748e-01 4976 of 5322 1.021e-04
Nucleus Shape Area -6.004e-02 4574 of 5322 0.165
Nucleus Shape Eccentricity 0.074 432 of 5322 0.057
Nucleus Shape Form Factor -7.565e-02 3757 of 5322 0.068
Nucleus Shape Solidity -7.672e-02 3712 of 5322 0.032
Cell DNA Mass Displacement 0.019 3095 of 5322 0.819
Cell Tubulin Mean 0.067 823 of 5322 0.122
Cell Tubulin Mass Displacement 0.015 2099 of 5322 0.850
Cell Actin Mean -3.565e-02 4051 of 5322 0.548
Cell Tubulin - Actin Correlation 0.015 2947 of 5322 0.796
Cell DNA - Tubulin Correlation 0.019 3058 of 5322 0.708
Cell Shape Area -4.786e-02 4342 of 5322 0.296
Cell Shape Eccentricity 0.040 911 of 5322 0.549
Mitotic Score Rank FDR q-value
Nucleus DNA Integrated 0.232 974 of 5322 0.906
Nucleus DNA Mean 0.136 1065 of 5322 1.000
Nucleus DNA Mass Displacement 0.009 3376 of 5322 0.999
Nucleus DNA Mean Frac 3 0.133 1167 of 5322 1.000
Nucleus gH2AX Mean 0.017 2720 of 5322 1.000
Nucleus gH2AX Mean Frac 0 0.068 1302 of 5322 1.000
Nucleus Tubulin Mean Frac 0 -7.348e-04 3519 of 5322 0.999
Nucleus Tubulin Mean Edge 0.272 407 of 5322 0.996
Nucleus Tubulin Std Edge 0.154 750 of 5322 0.999
Nucleus Shape Area 0.107 2561 of 5322 0.990
Nucleus Shape Eccentricity 0.141 525 of 5322 1.000
Nucleus Shape Form Factor -3.691e-01 5032 of 5322 0.976
Cell Tubulin Mean 0.271 545 of 5322 0.997
Cell Tubulin Mean Frac 3 -1.754e-01 3815 of 5322 0.999
Cell Actin Mean 0.029 2813 of 5322 0.998
Cell Shape Area 0.170 1720 of 5322 0.998
( Reset Zoom )
Brightness
Contrast
Opacity
Brightness
Contrast
Opacity
Brightness
Contrast
Opacity
Brightness
Contrast
Opacity
Brightness
Contrast
Opacity

( Reset Zoom )
Brightness
Contrast
Opacity
Brightness
Contrast
Opacity
Brightness
Contrast
Opacity
Brightness
Contrast
Opacity
Brightness
Contrast
Opacity

MIT Central Accessability