SMC3

Gene symbol: SMC3
Gene: 9126
Uniprot Function: Central component of cohesin, a complex required for chromosome cohesion during the cell cycle. The cohesin complex may form a large proteinaceous ring within which sister chromatids can be trapped. At anaphase, the complex is cleaved and dissociates from chromatin, allowing sister chromatids to segregate. Cohesion is coupled to DNA replication and is involved in DNA repair. The cohesin complex plays also an important role in spindle pole assembly during mitosis and in chromosomes movement.
Mitotic Index 0.0296
Interphase Cluster: #218 (7 genes)
Mitotic Cluster: #36 (32 genes)
sgRNA 1: ACAGTCCATAGTGAAAGCAC (interphase cells: 1241, mitotic cells: 27)
sgRNA 2: GACAAGAGCAGATTAAGCAG (interphase cells: 3427, mitotic cells: 119)
sgRNA 3: TAGAGTGTATGACGAACGAA (interphase cells: 1315, mitotic cells: 46)
sgRNA 4: TAGCAGGCAATAGTGAACAA (interphase cells: 1988, mitotic cells: 51)

Interphase Cluster

Mitotic Cluster

Overview

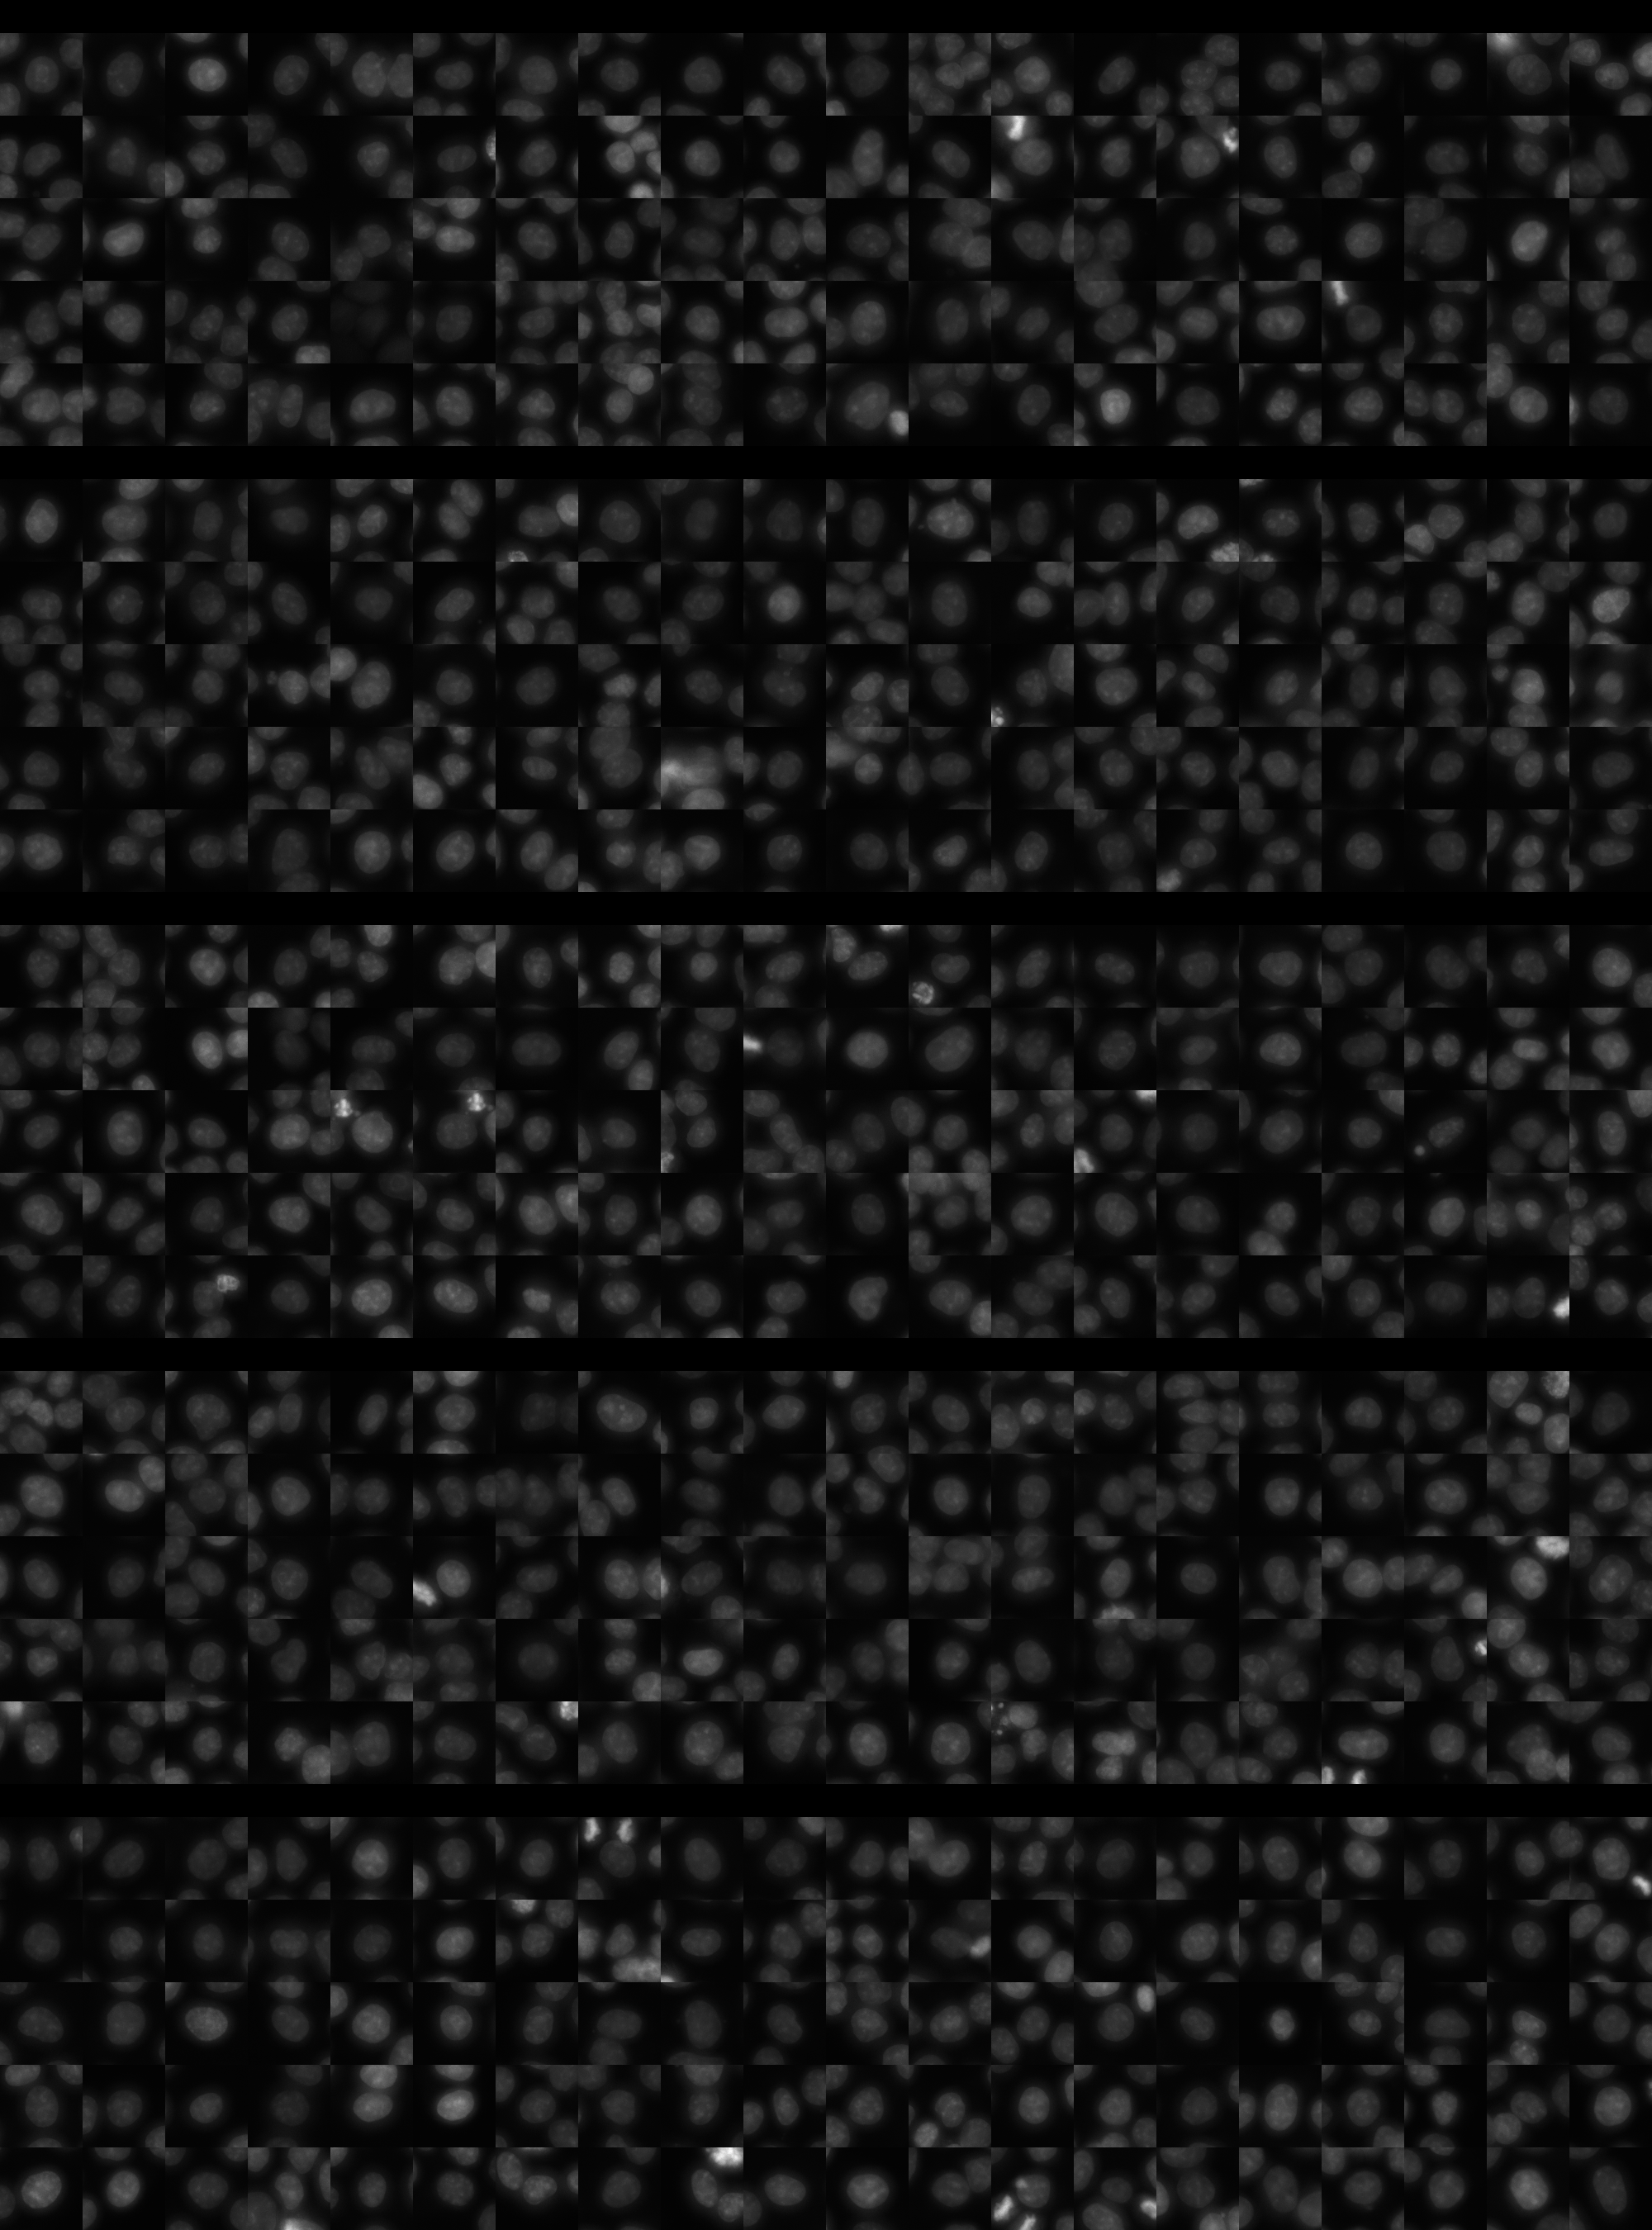
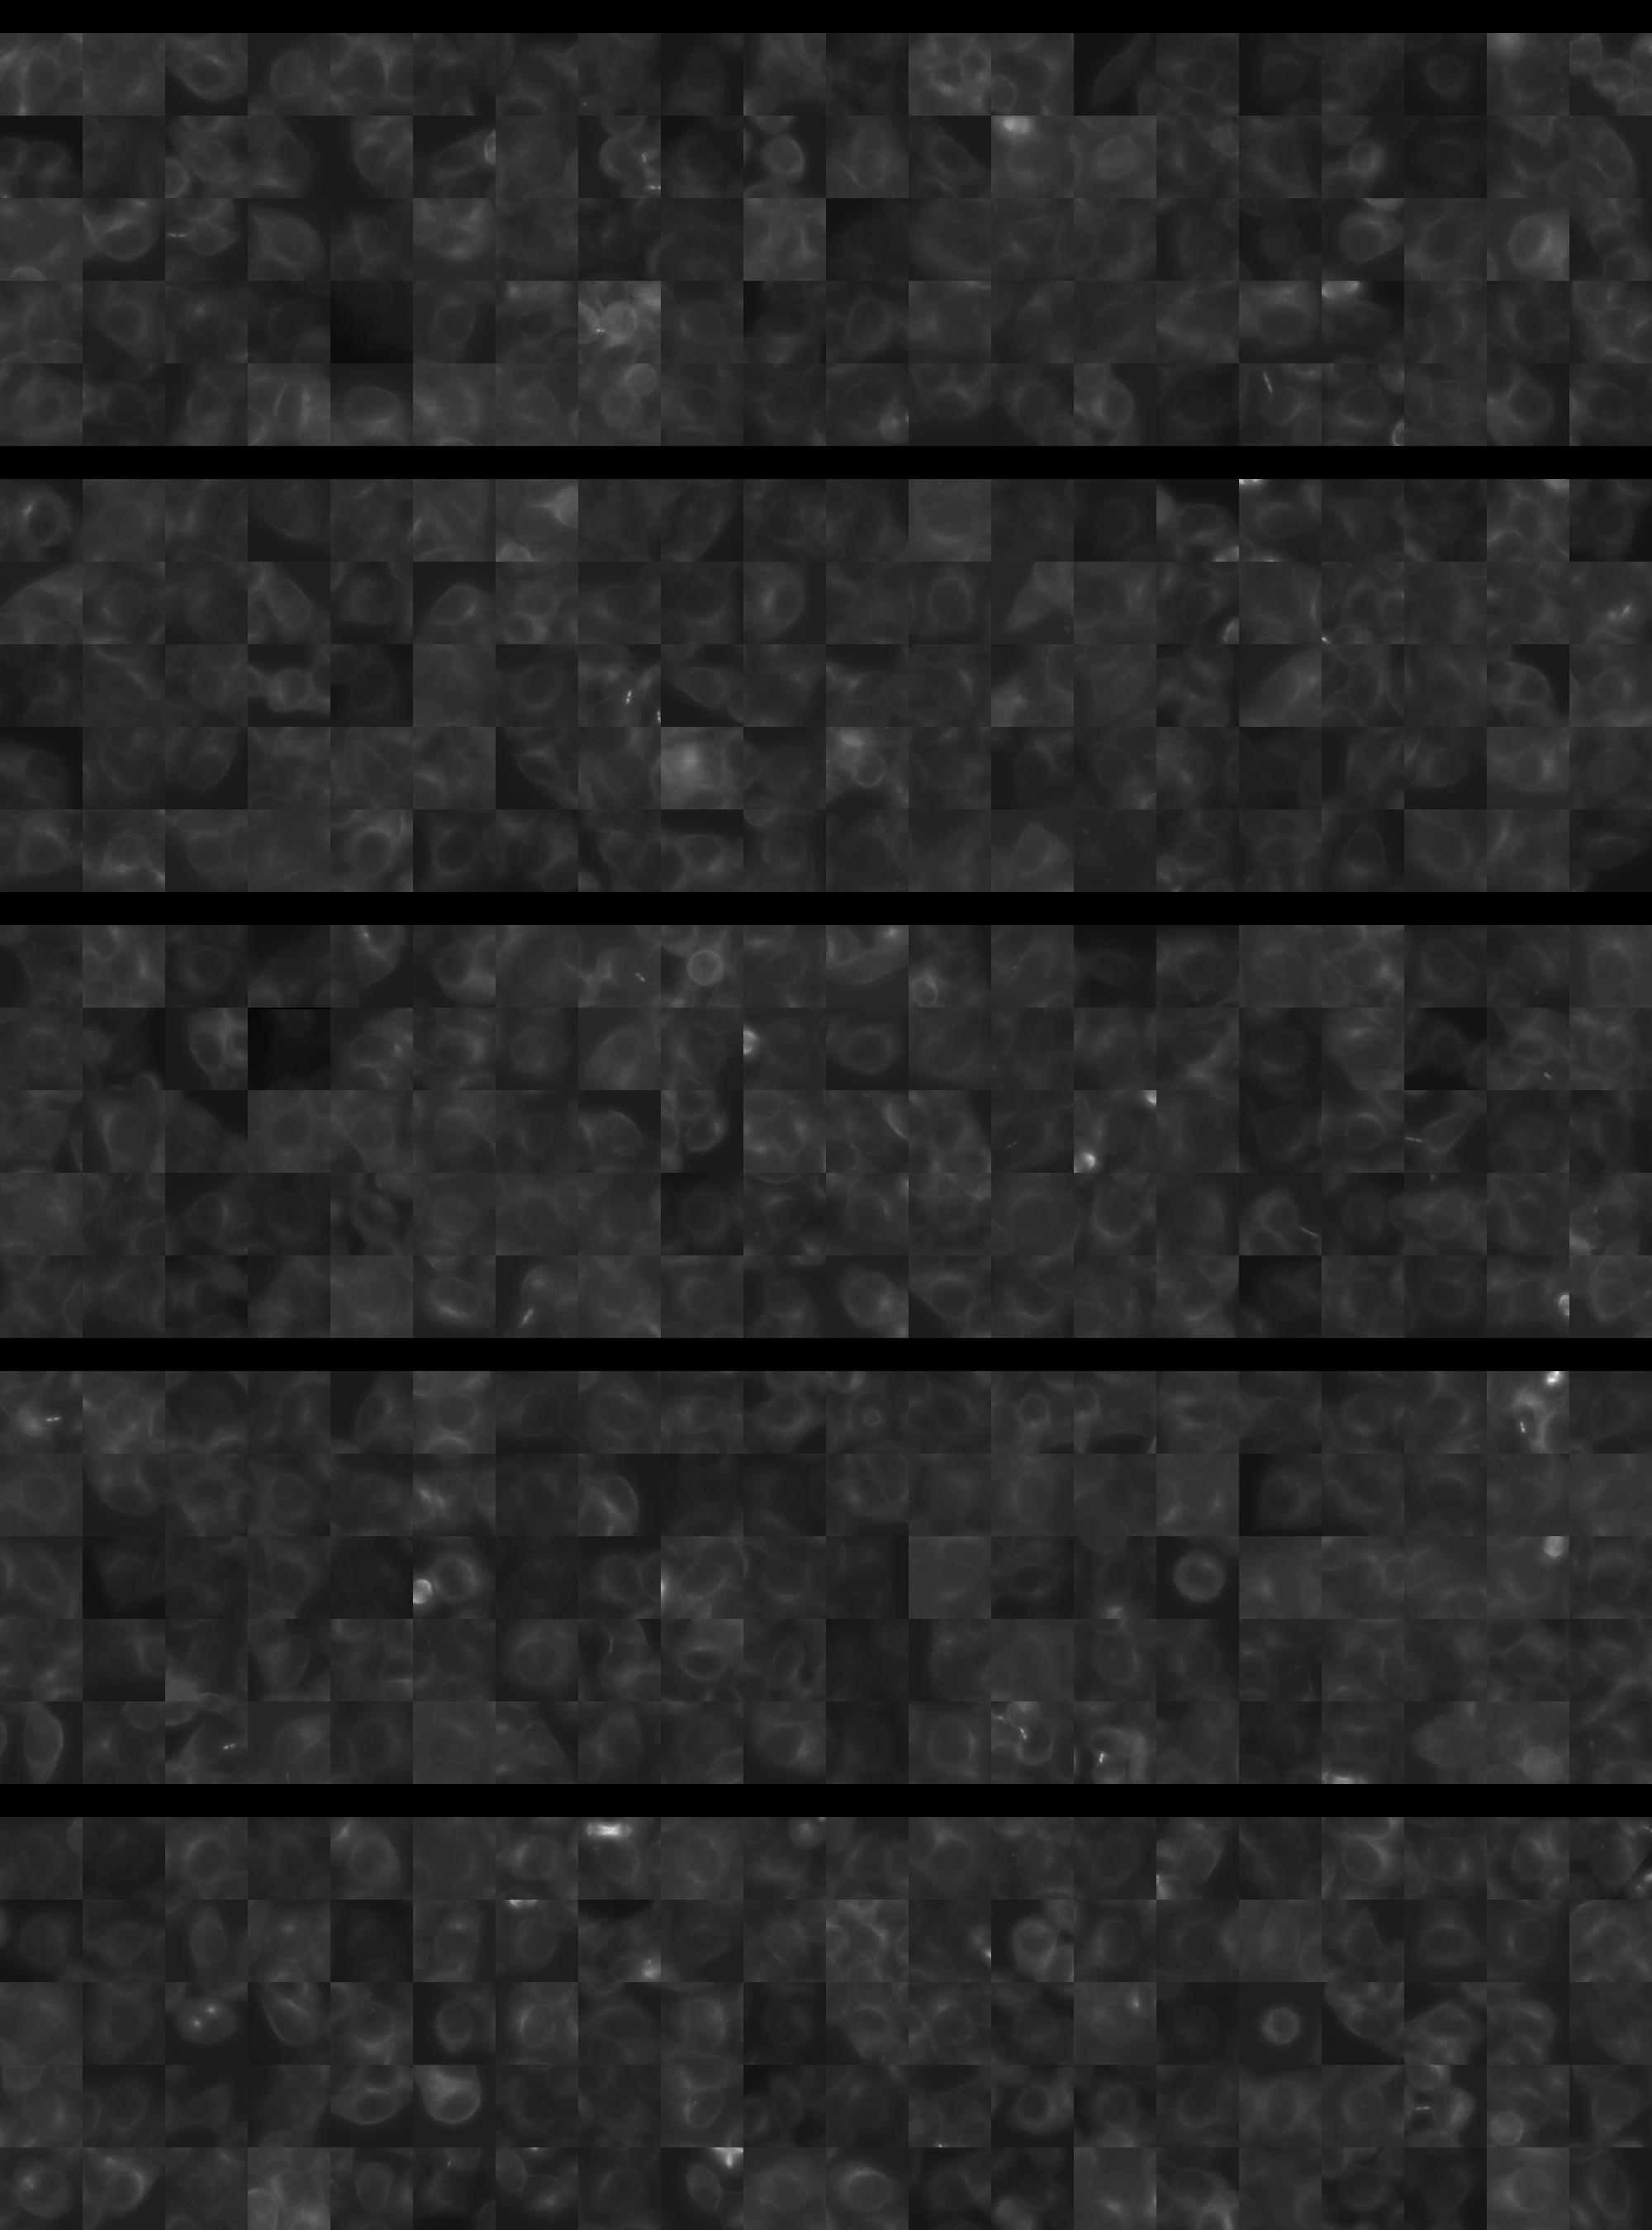
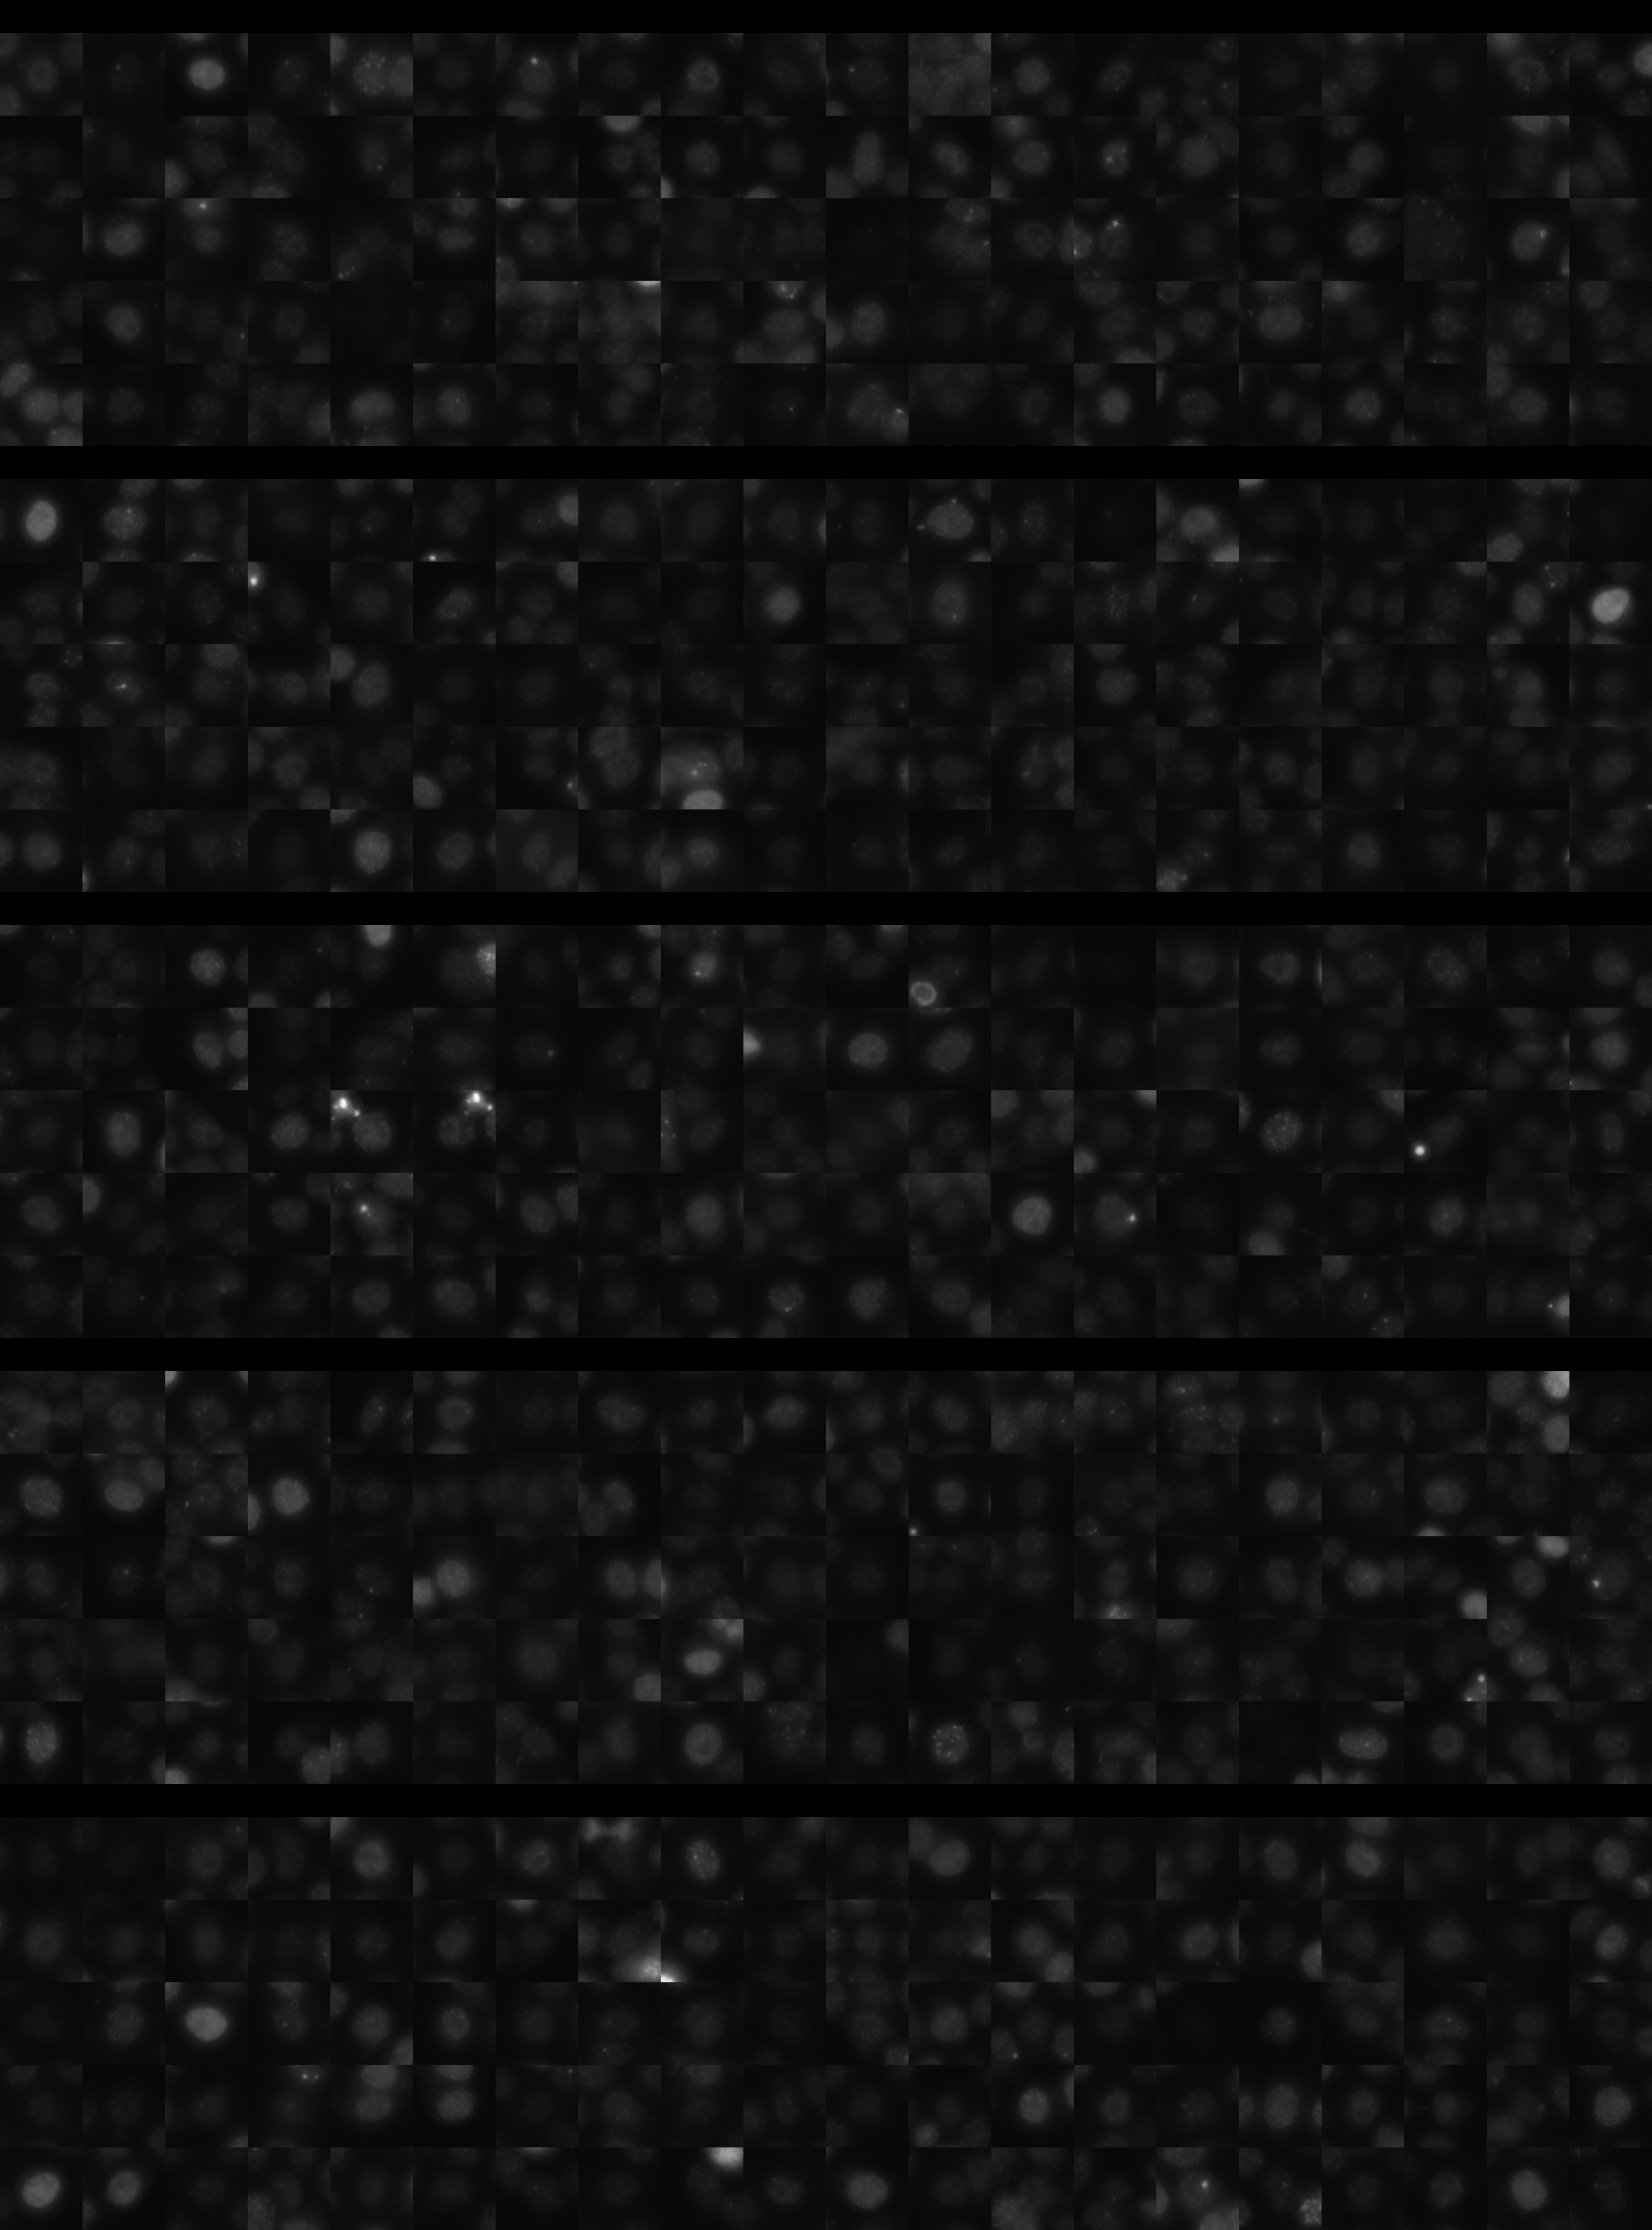
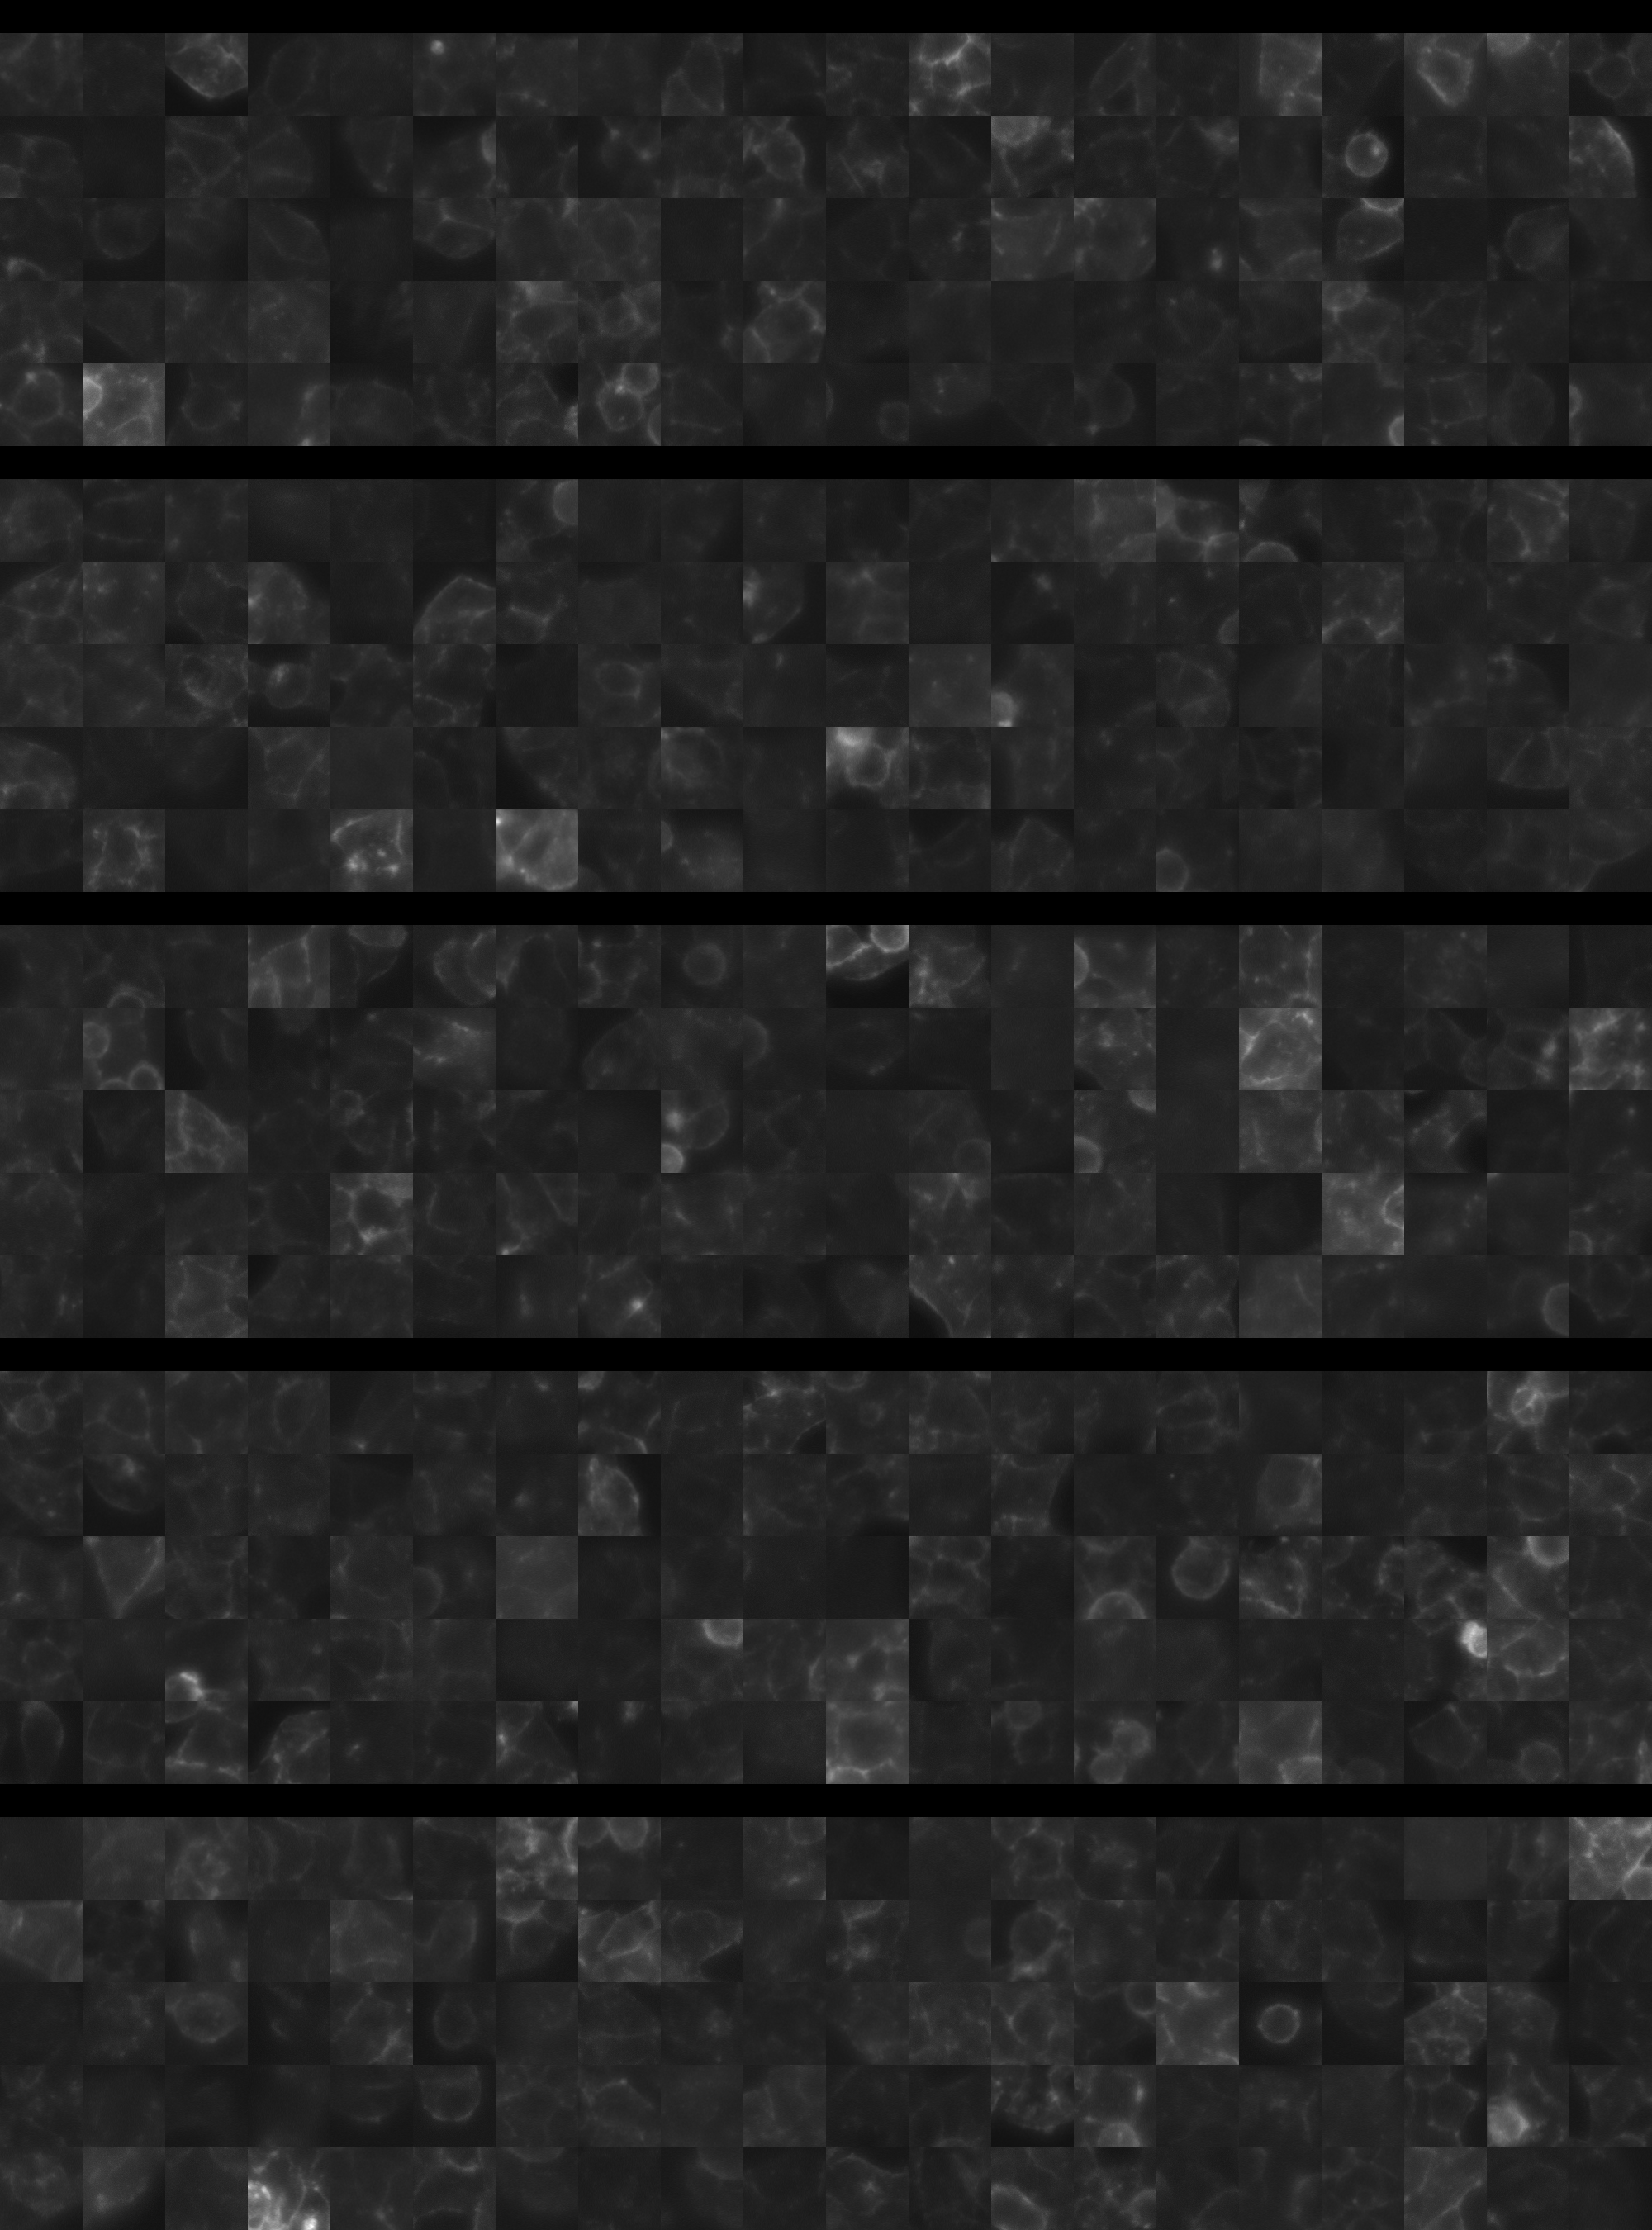
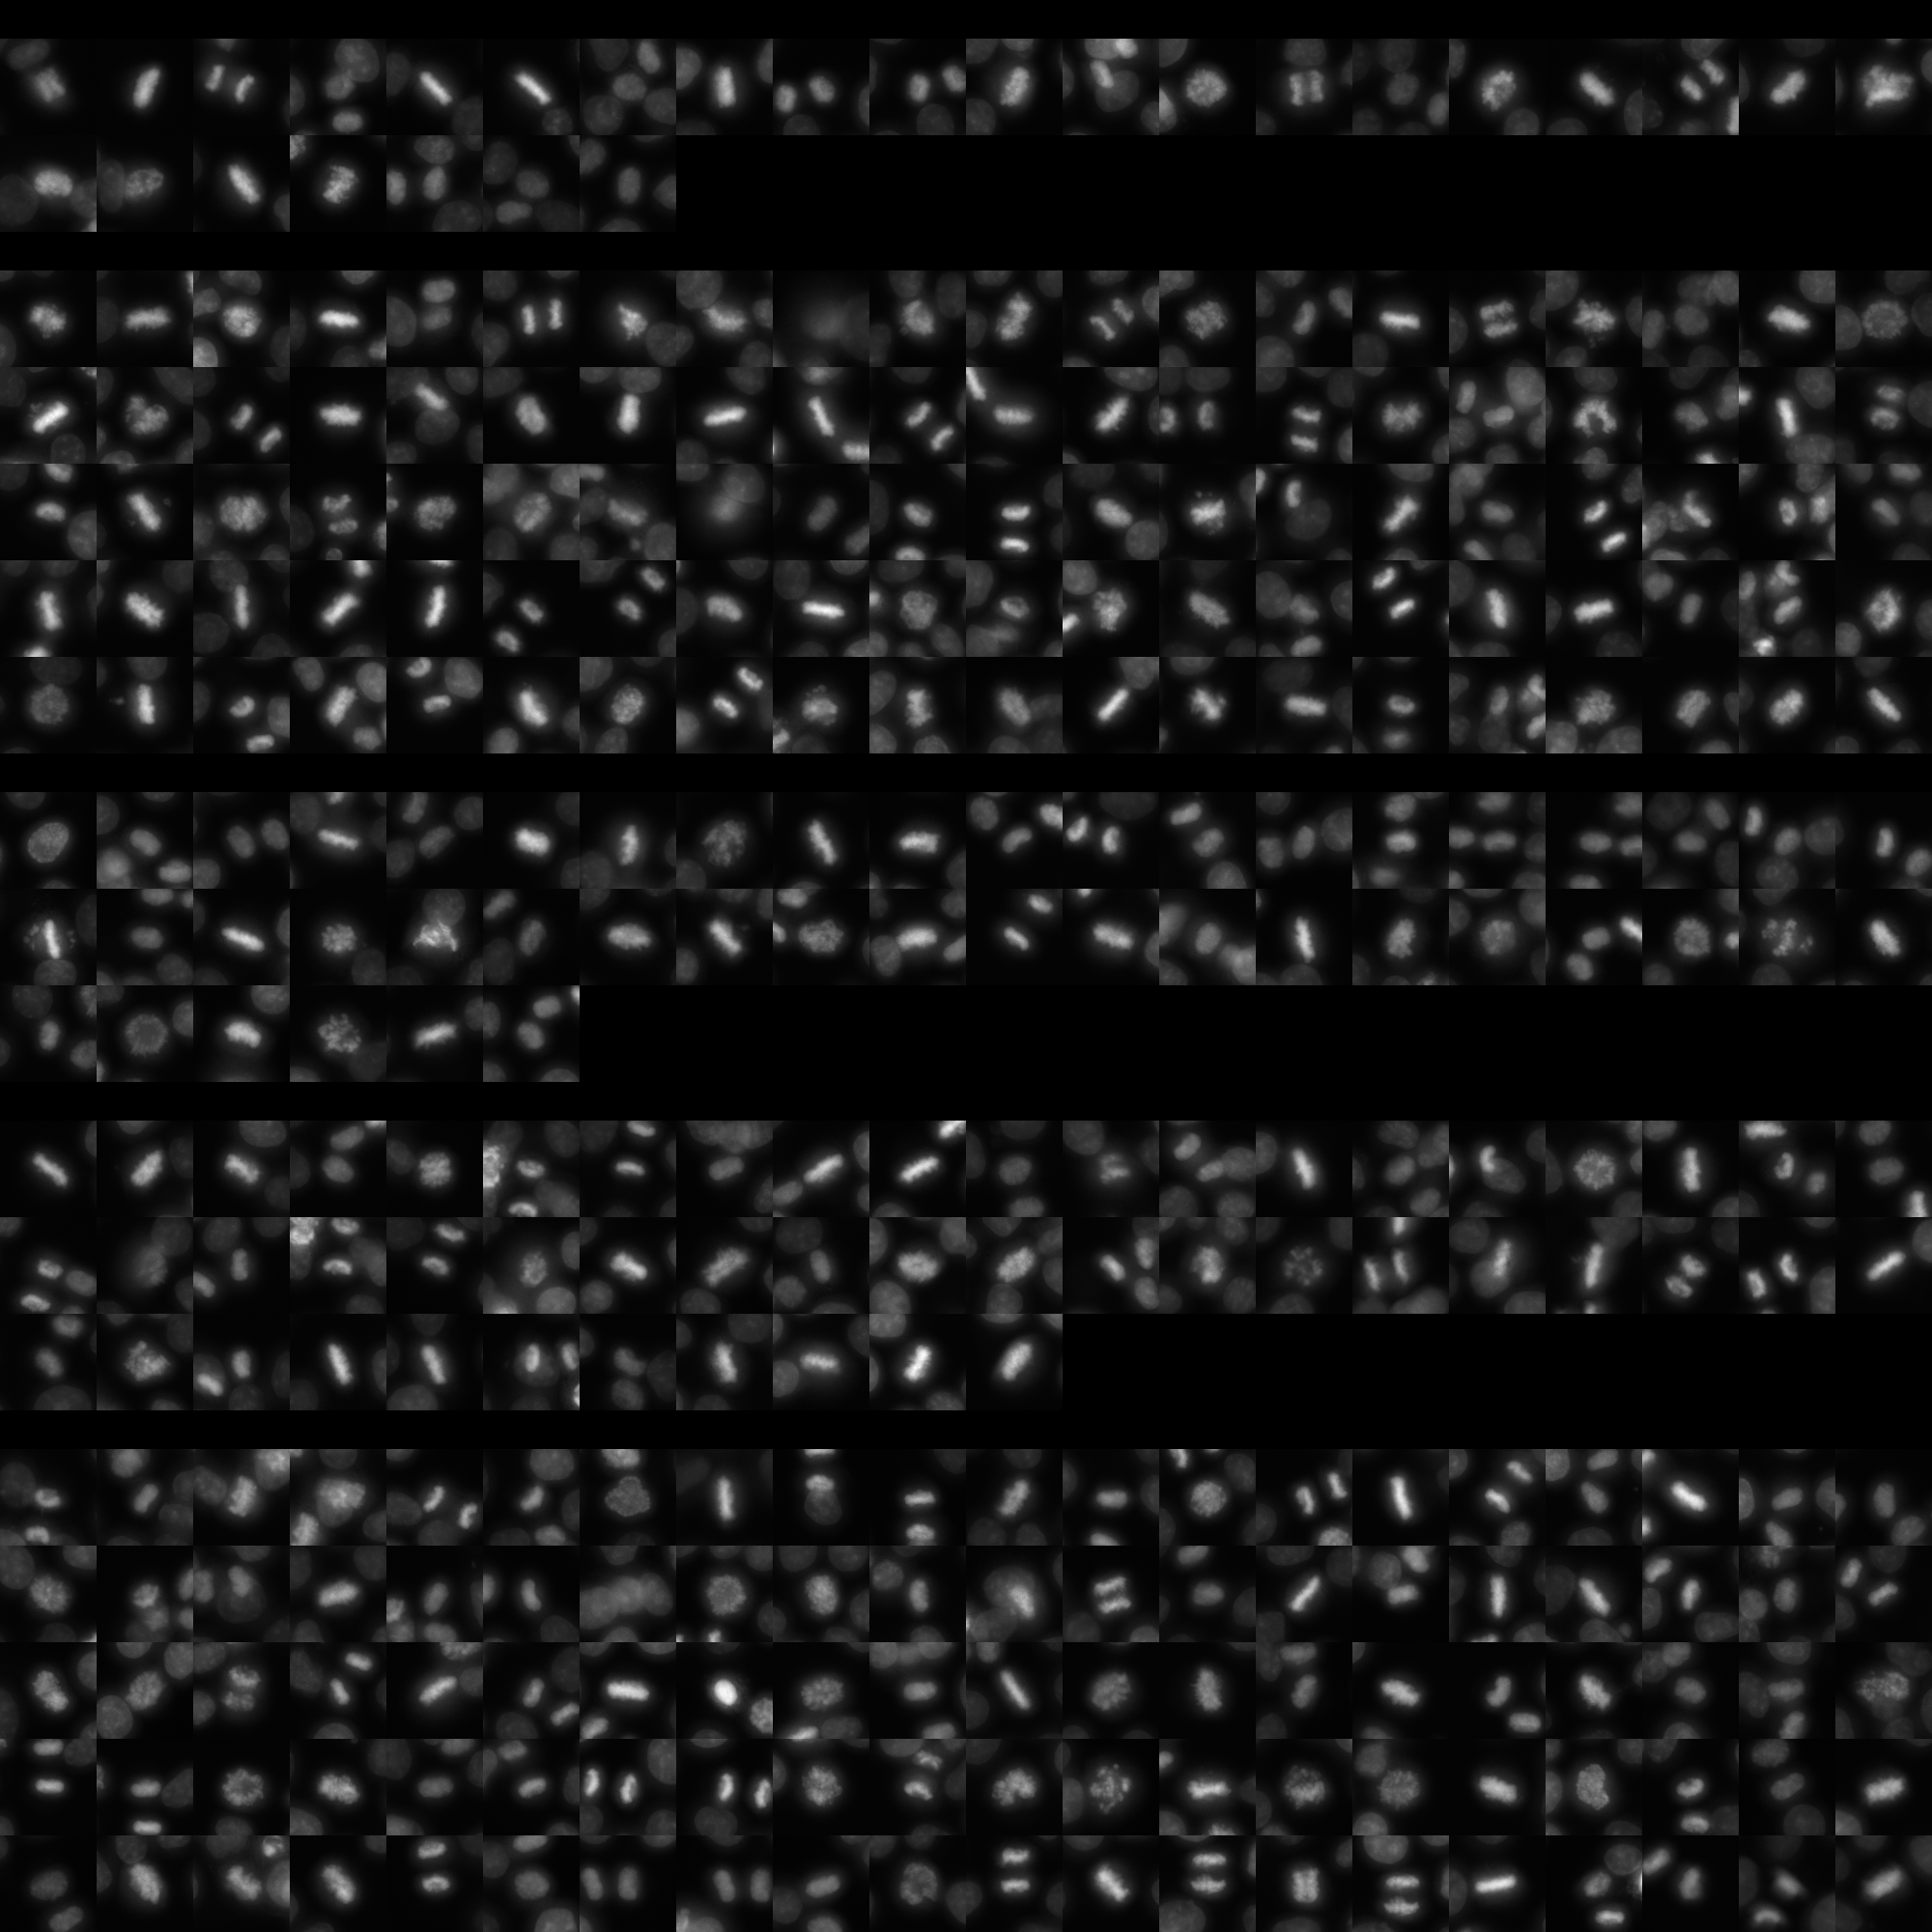
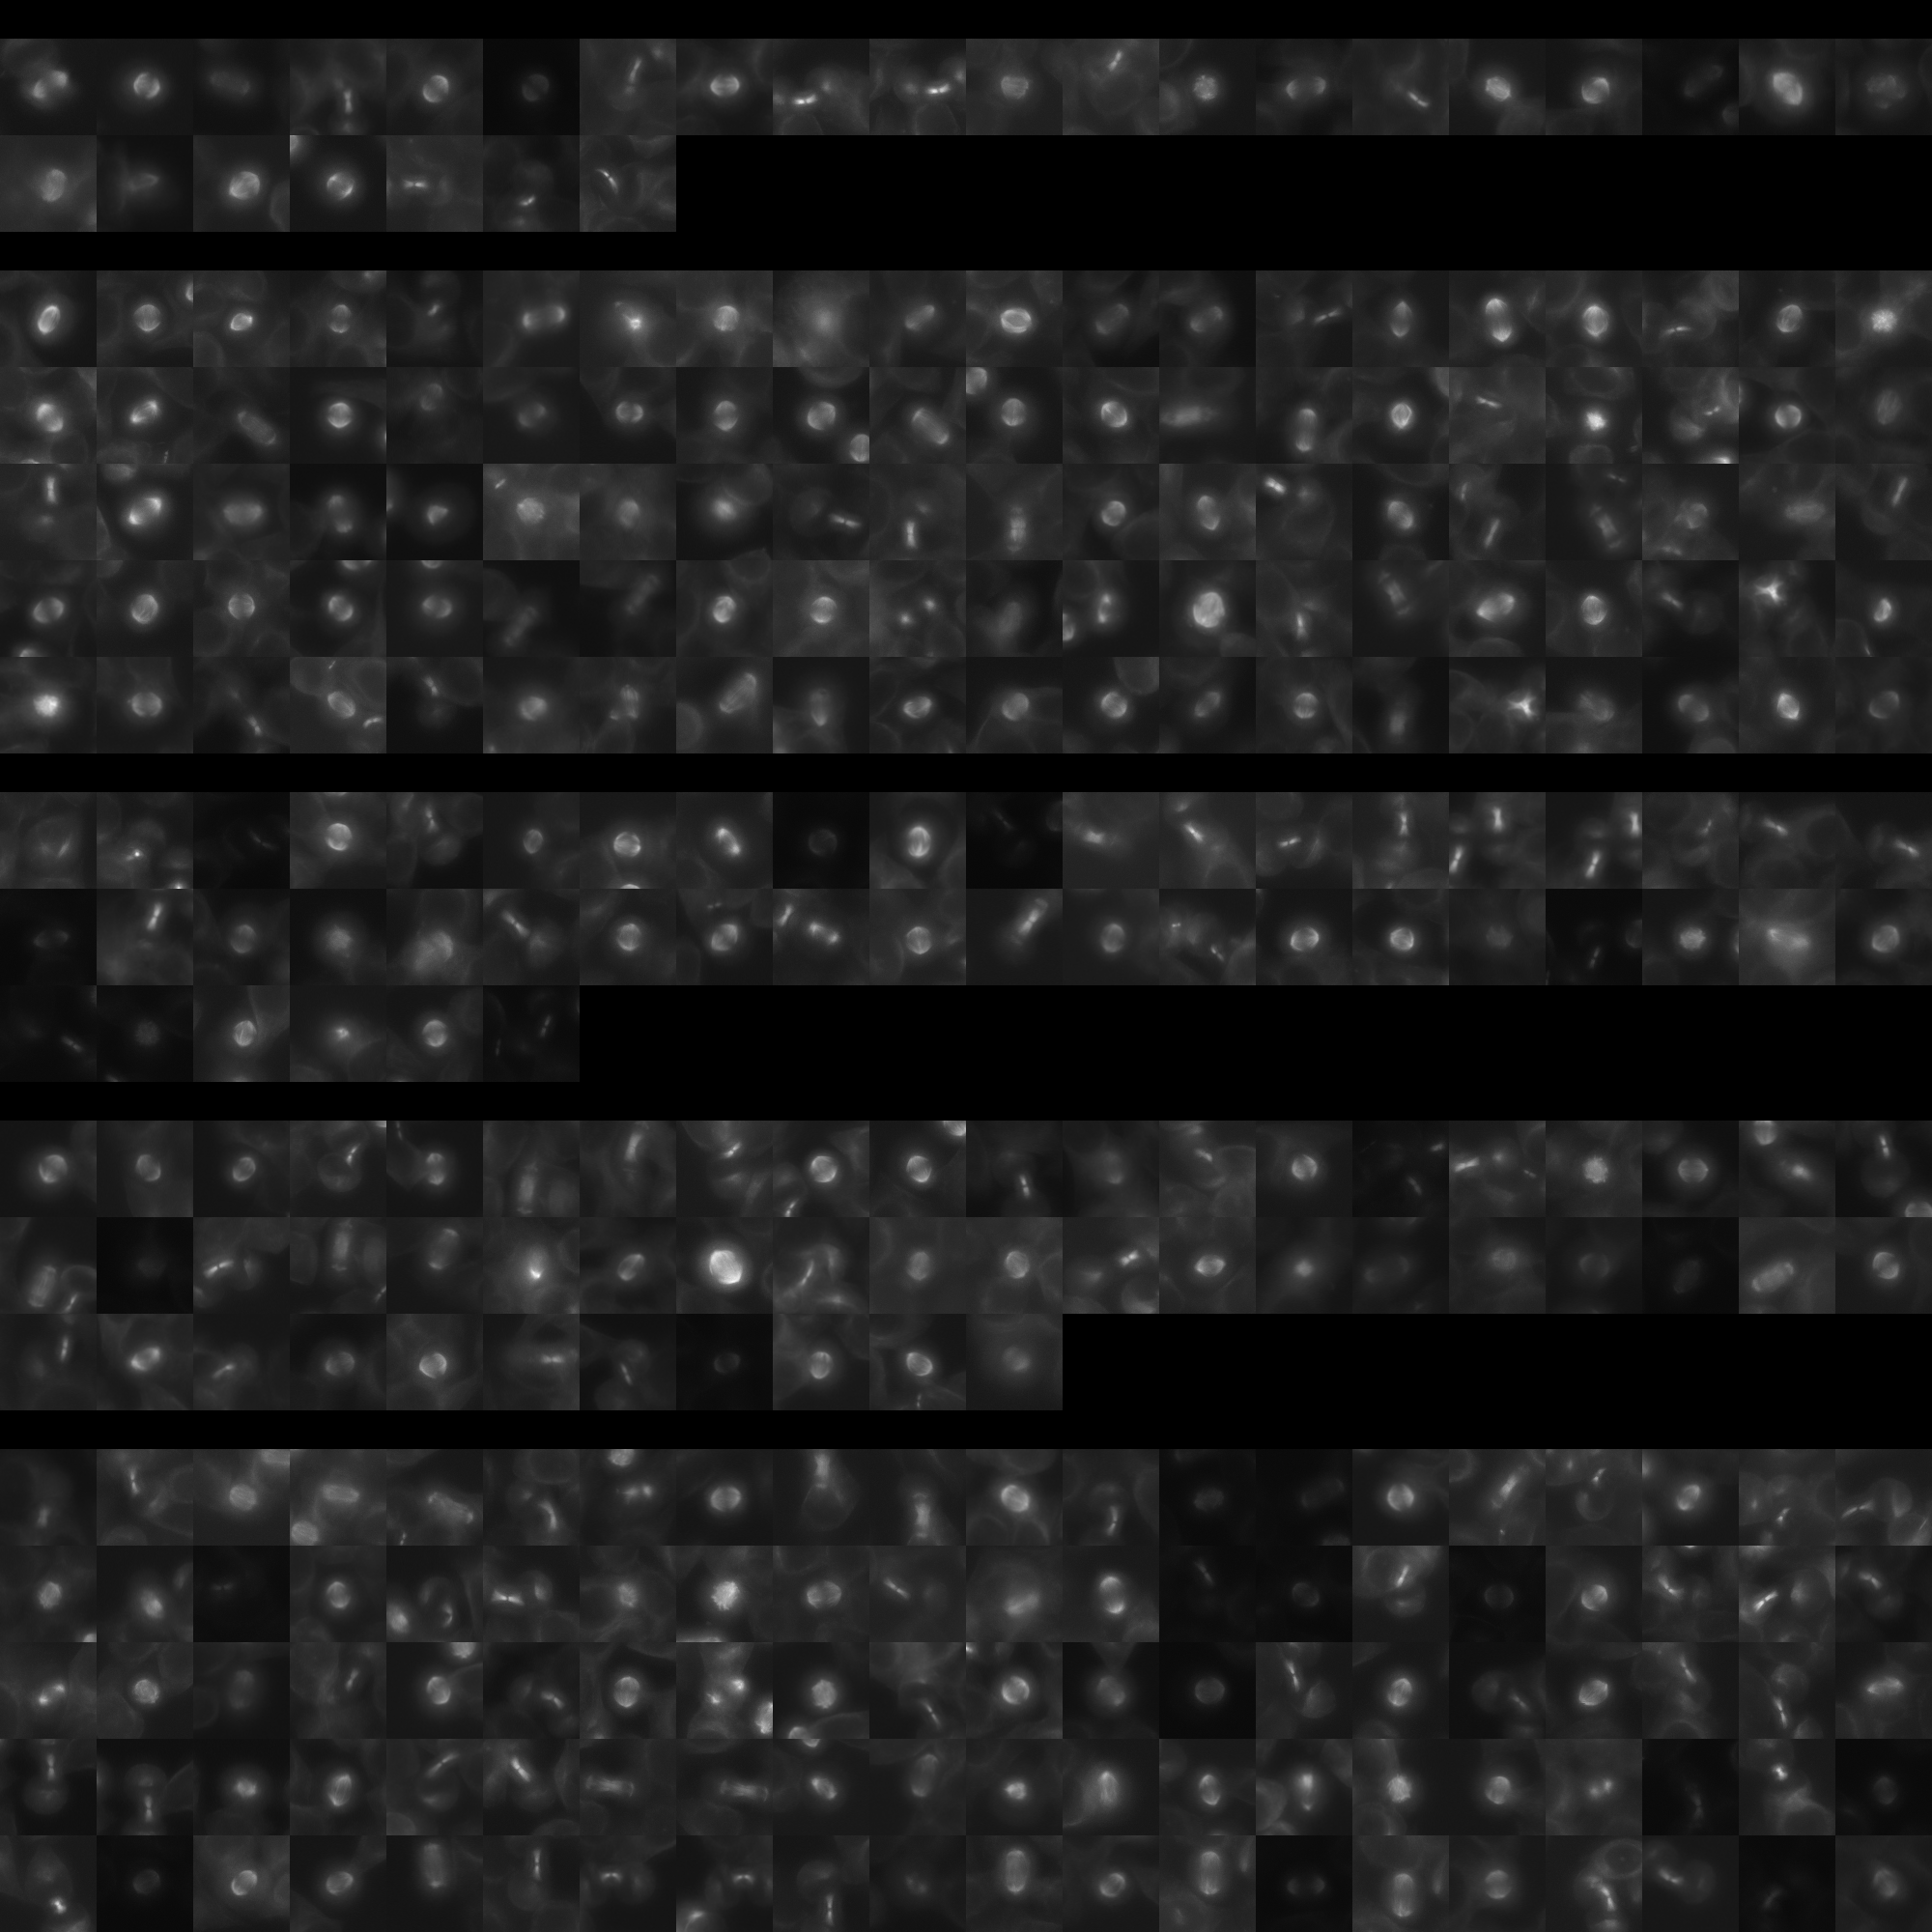
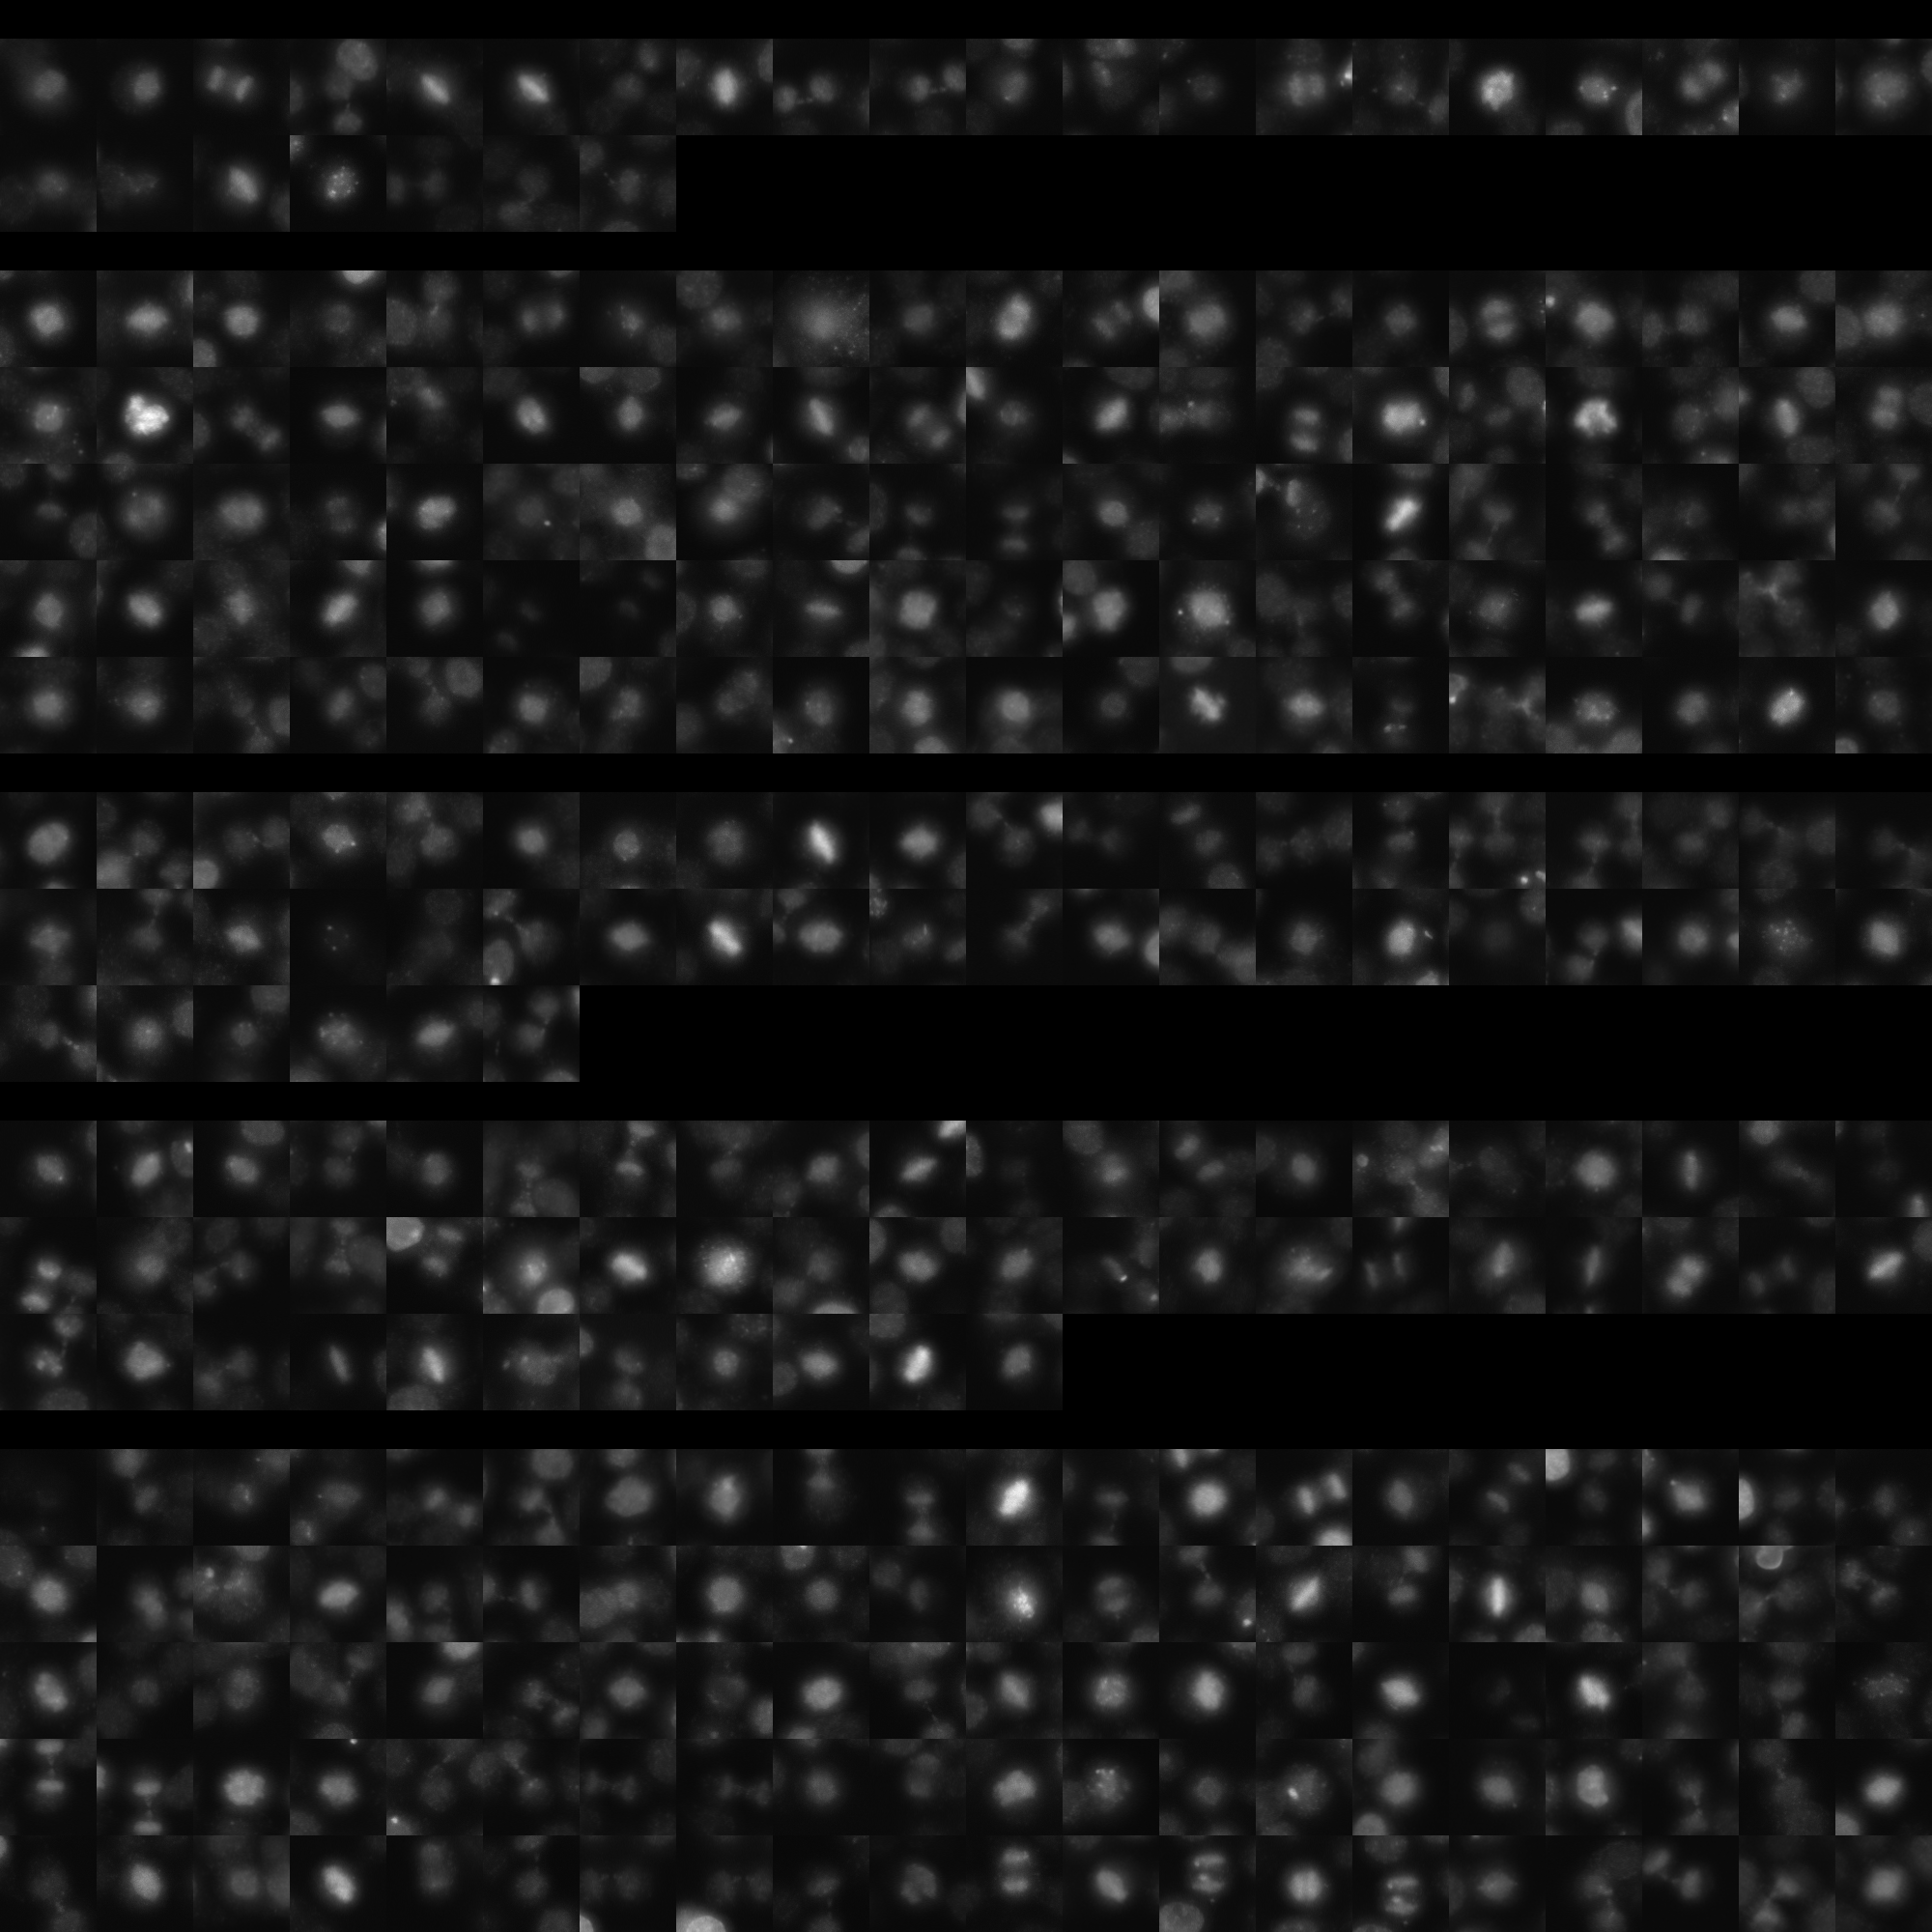
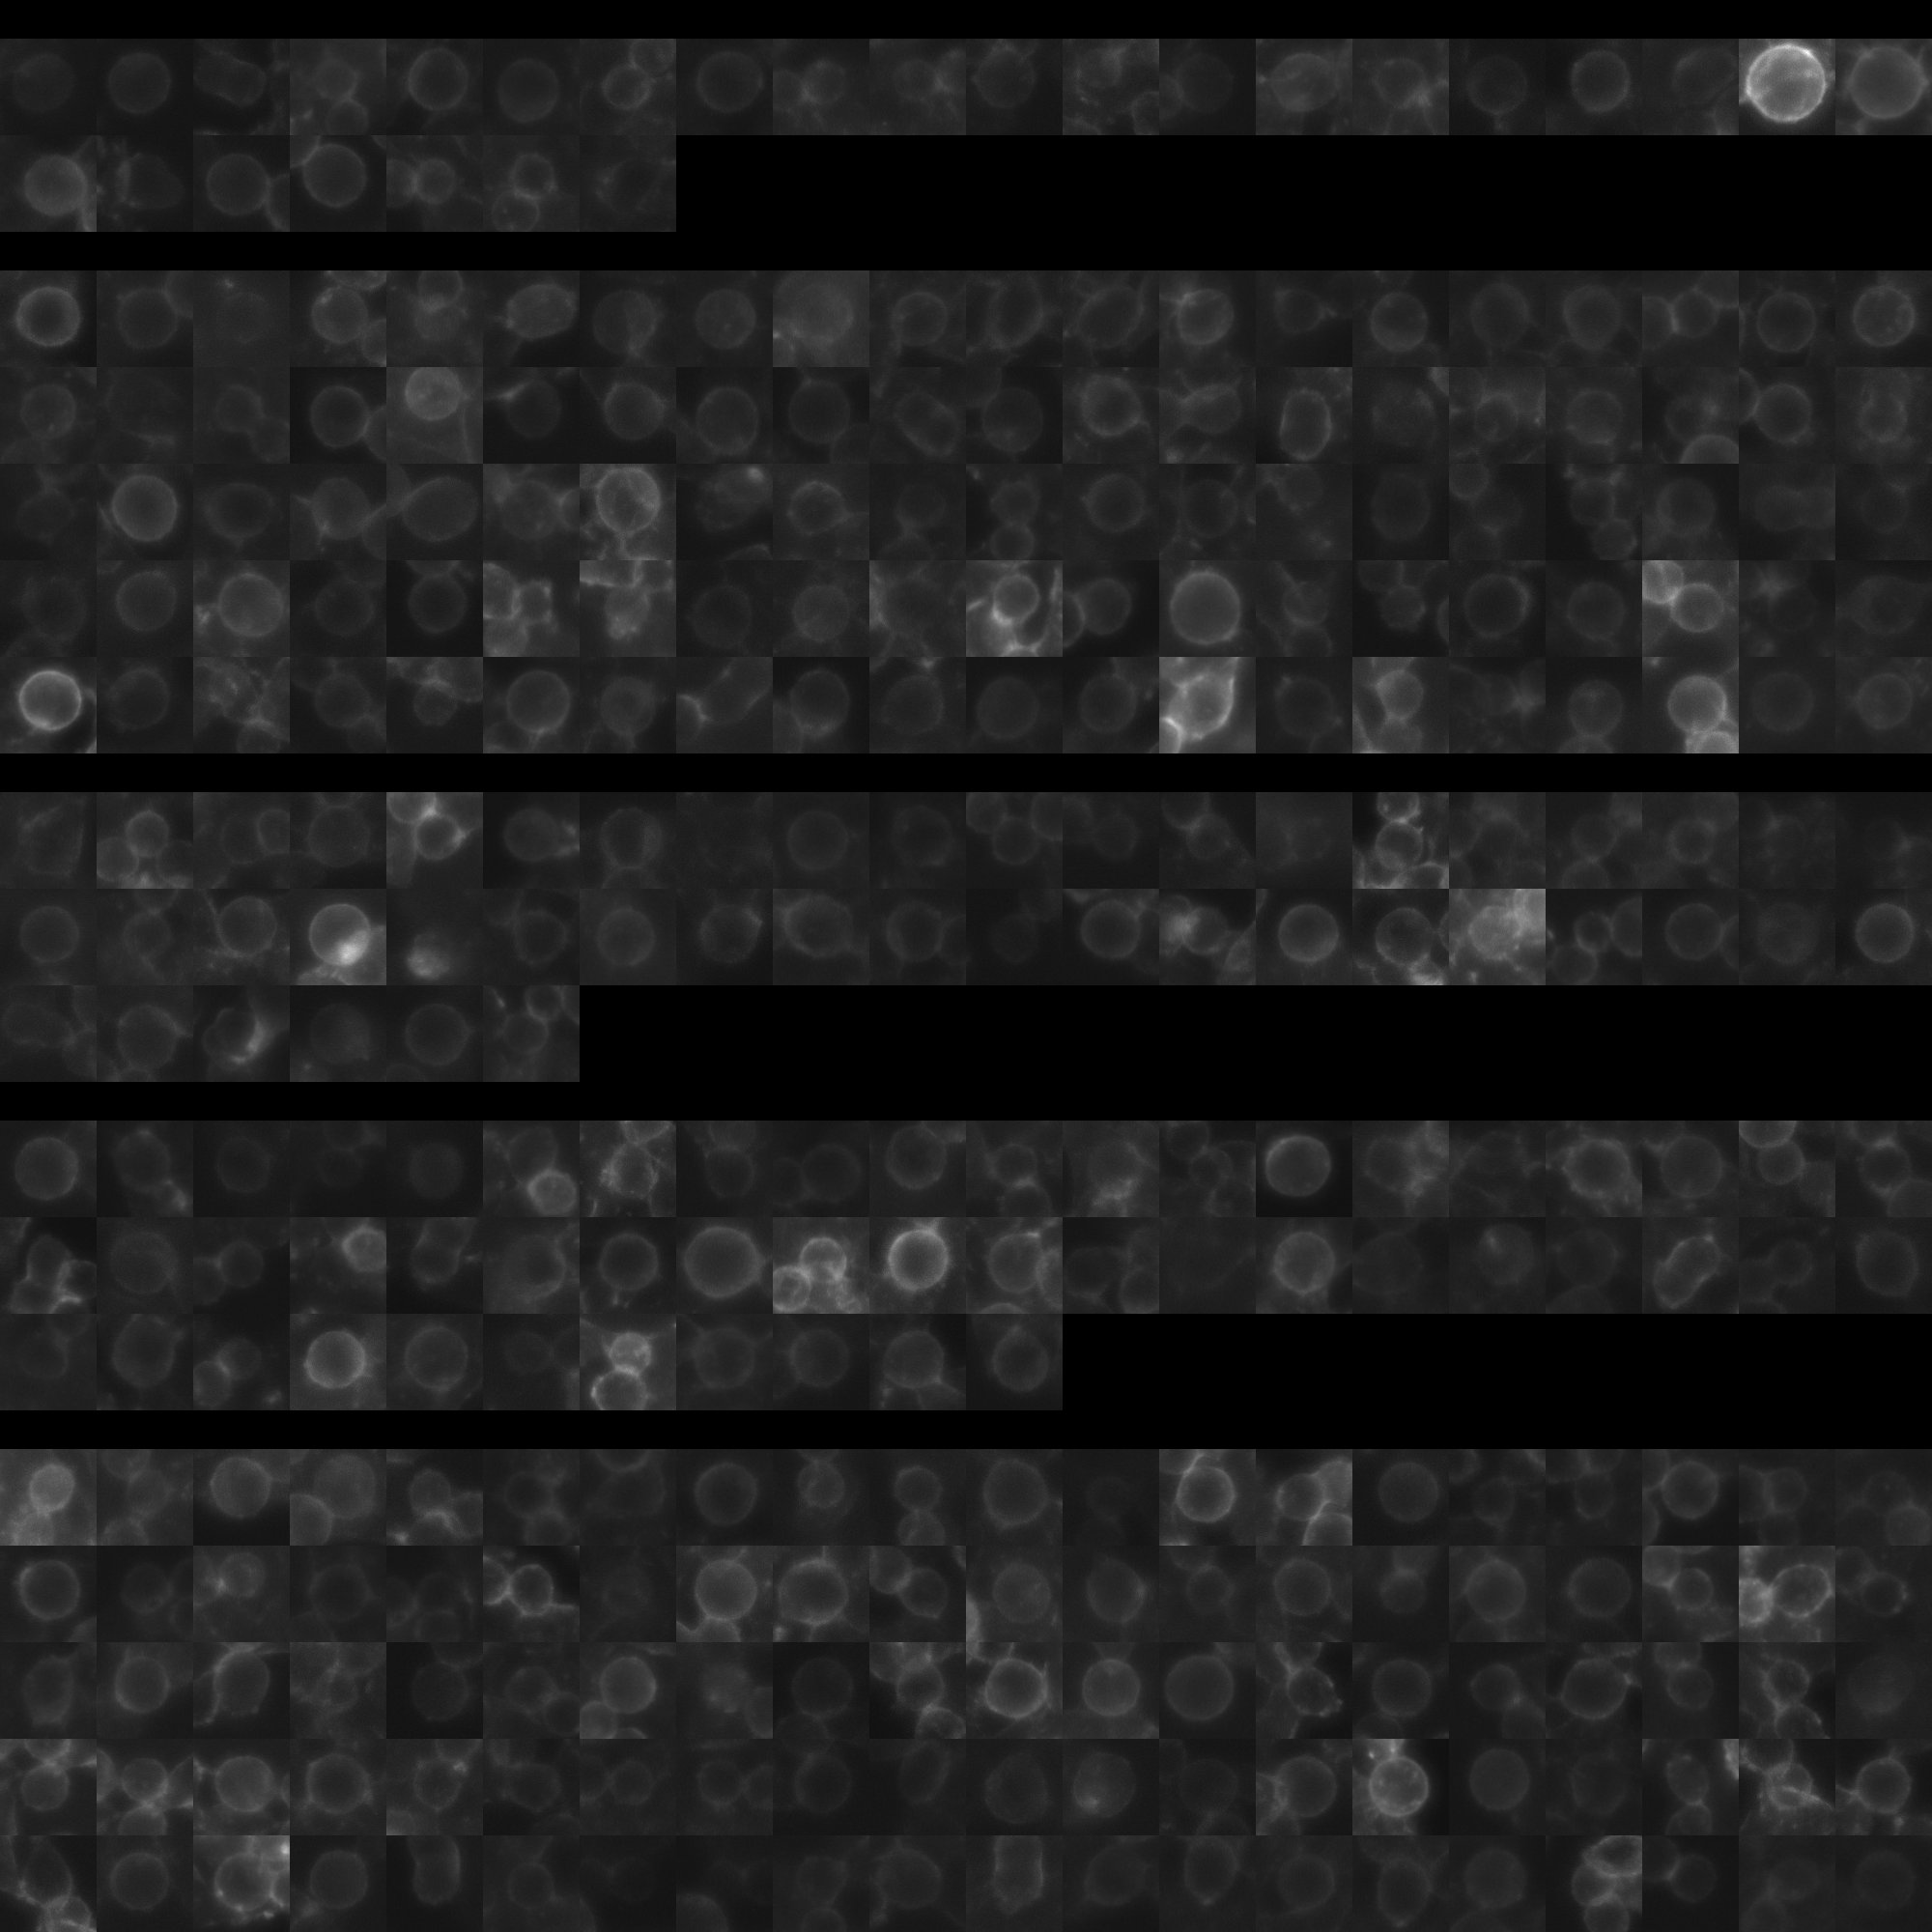
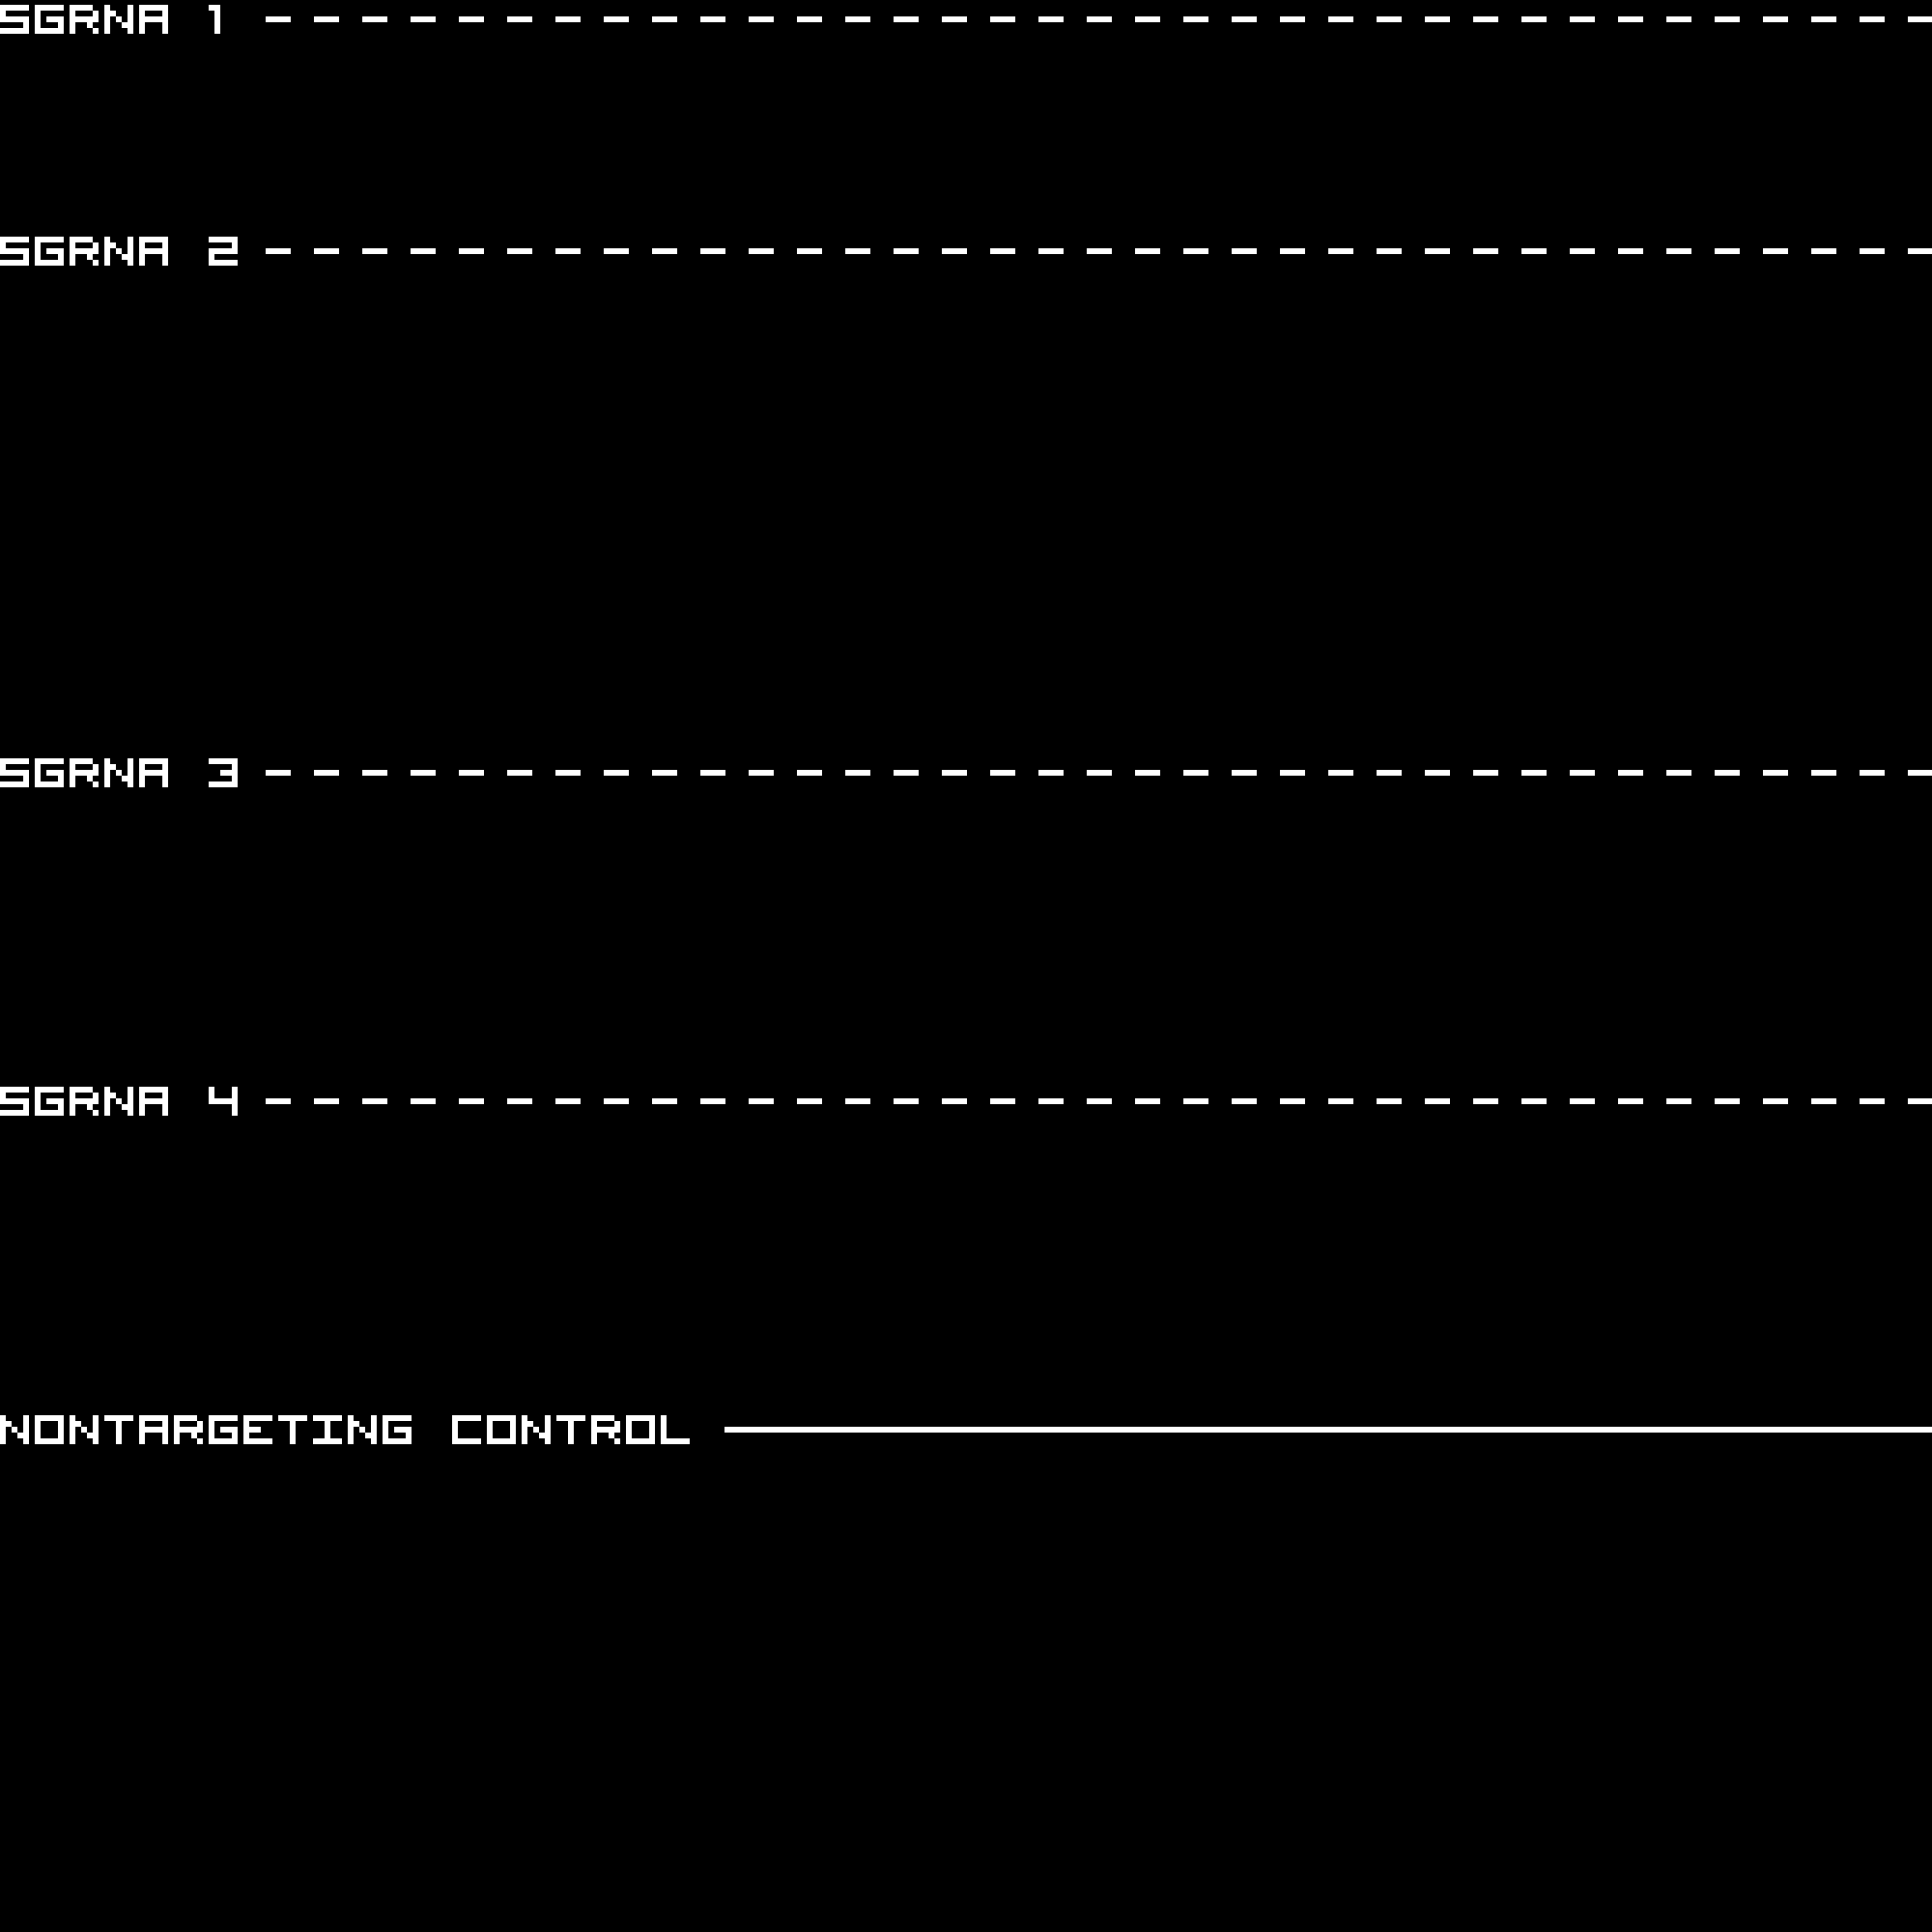
Each montage below shows randomly selected individual cell images for the same target gene separated by sgRNA, along with an example montage of cells expressing a non-targeting negative control sgRNA at the bottom. sgRNA labels in the montages correspond to the numbered sgRNA sequences in the gene info table above. The DNA (blue) and tubulin (green) channels are displayed by default, with gH2AX (grayscale) and actin (yellow) available using the check boxes. Channel brightness, contrast, and opacity are adjustable by clicking the arrow next to the channel name. When only one channel is selected, the display defaults to grayscale. Click the “Zoom” checkbox above the channel controls to enable image zooming (via scrolling) and panning (via click-and-drag).

The cell boxes displayed for this gene are square, 30.36 μm per side for the interphase montage and 30.36 μm per side for the mitotic montage.

Features

Interphase Score Rank FDR q-value
Nucleus DNA Integrated 0.070 635 of 5322 0.188
Nucleus DNA Mean 0.082 575 of 5322 0.032
Nucleus gH2AX Mean 0.143 1112 of 5322 5.413e-04
Nucleus DNA - gH2AX Correlation -1.441e-01 4699 of 5322 1.021e-04
Nucleus Shape Area 0.022 2556 of 5322 0.810
Nucleus Shape Eccentricity 0.134 82 of 5322 4.529e-04
Nucleus Shape Form Factor -5.482e-02 2918 of 5322 0.143
Nucleus Shape Solidity -1.068e-01 4415 of 5322 0.001
Cell DNA Mass Displacement 0.124 129 of 5322 0.001
Cell Tubulin Mean -1.119e-01 4953 of 5322 0.006
Cell Tubulin Mass Displacement 0.041 862 of 5322 0.333
Cell Actin Mean -1.812e-01 5191 of 5322 1.723e-04
Cell Tubulin - Actin Correlation -2.963e-02 4739 of 5322 0.496
Cell DNA - Tubulin Correlation -5.660e-01 5322 of 5322 1.948e-04
Cell Shape Area -1.695e-01 4978 of 5322 1.651e-04
Cell Shape Eccentricity 0.089 84 of 5322 0.043
Mitotic Score Rank FDR q-value
Nucleus DNA Integrated 0.053 3194 of 5322 0.984
Nucleus DNA Mean 0.110 1343 of 5322 1.000
Nucleus DNA Mass Displacement -2.828e-02 3930 of 5322 0.999
Nucleus DNA Mean Frac 3 0.080 1845 of 5322 1.000
Nucleus gH2AX Mean -6.158e-02 3805 of 5322 1.000
Nucleus gH2AX Mean Frac 0 -9.759e-02 3775 of 5322 1.000
Nucleus Tubulin Mean Frac 0 0.027 3076 of 5322 0.999
Nucleus Tubulin Mean Edge 0.155 1215 of 5322 0.996
Nucleus Tubulin Std Edge 0.098 1288 of 5322 0.999
Nucleus Shape Area -2.775e-02 4240 of 5322 0.990
Nucleus Shape Eccentricity 0.093 920 of 5322 1.000
Nucleus Shape Form Factor -1.430e-02 1586 of 5322 0.998
Cell Tubulin Mean 0.147 1469 of 5322 0.997
Cell Tubulin Mean Frac 3 0.147 439 of 5322 0.999
Cell Actin Mean -1.527e-01 4815 of 5322 0.997
Cell Shape Area -2.275e-02 4165 of 5322 0.998
( Reset Zoom )
Brightness
Contrast
Opacity
Brightness
Contrast
Opacity
Brightness
Contrast
Opacity
Brightness
Contrast
Opacity
Brightness
Contrast
Opacity

( Reset Zoom )
Brightness
Contrast
Opacity
Brightness
Contrast
Opacity
Brightness
Contrast
Opacity
Brightness
Contrast
Opacity
Brightness
Contrast
Opacity

MIT Central Accessability