SLC38A7

Gene symbol: SLC38A7
Gene: 55238
Uniprot Function: Mediates sodium-dependent transport of amino acids, preferentially L-glutamine.
Mitotic Index 0.0268
Interphase Cluster: #38 (33 genes)
Mitotic Cluster: #116 (23 genes)
sgRNA 1: CAATGAGAGGACCTACCAGG (interphase cells: 2128, mitotic cells: 60)
sgRNA 2: GCTGACAGGTGTGCTATGTG (interphase cells: 2310, mitotic cells: 67)
sgRNA 3: TAGCCCTCGCTGTCTACATG (interphase cells: 1530, mitotic cells: 45)
sgRNA 4: TGAGTGGGAAGCCTCTCCTG (interphase cells: 1085, mitotic cells: 22)

Interphase Cluster

Mitotic Cluster

Overview

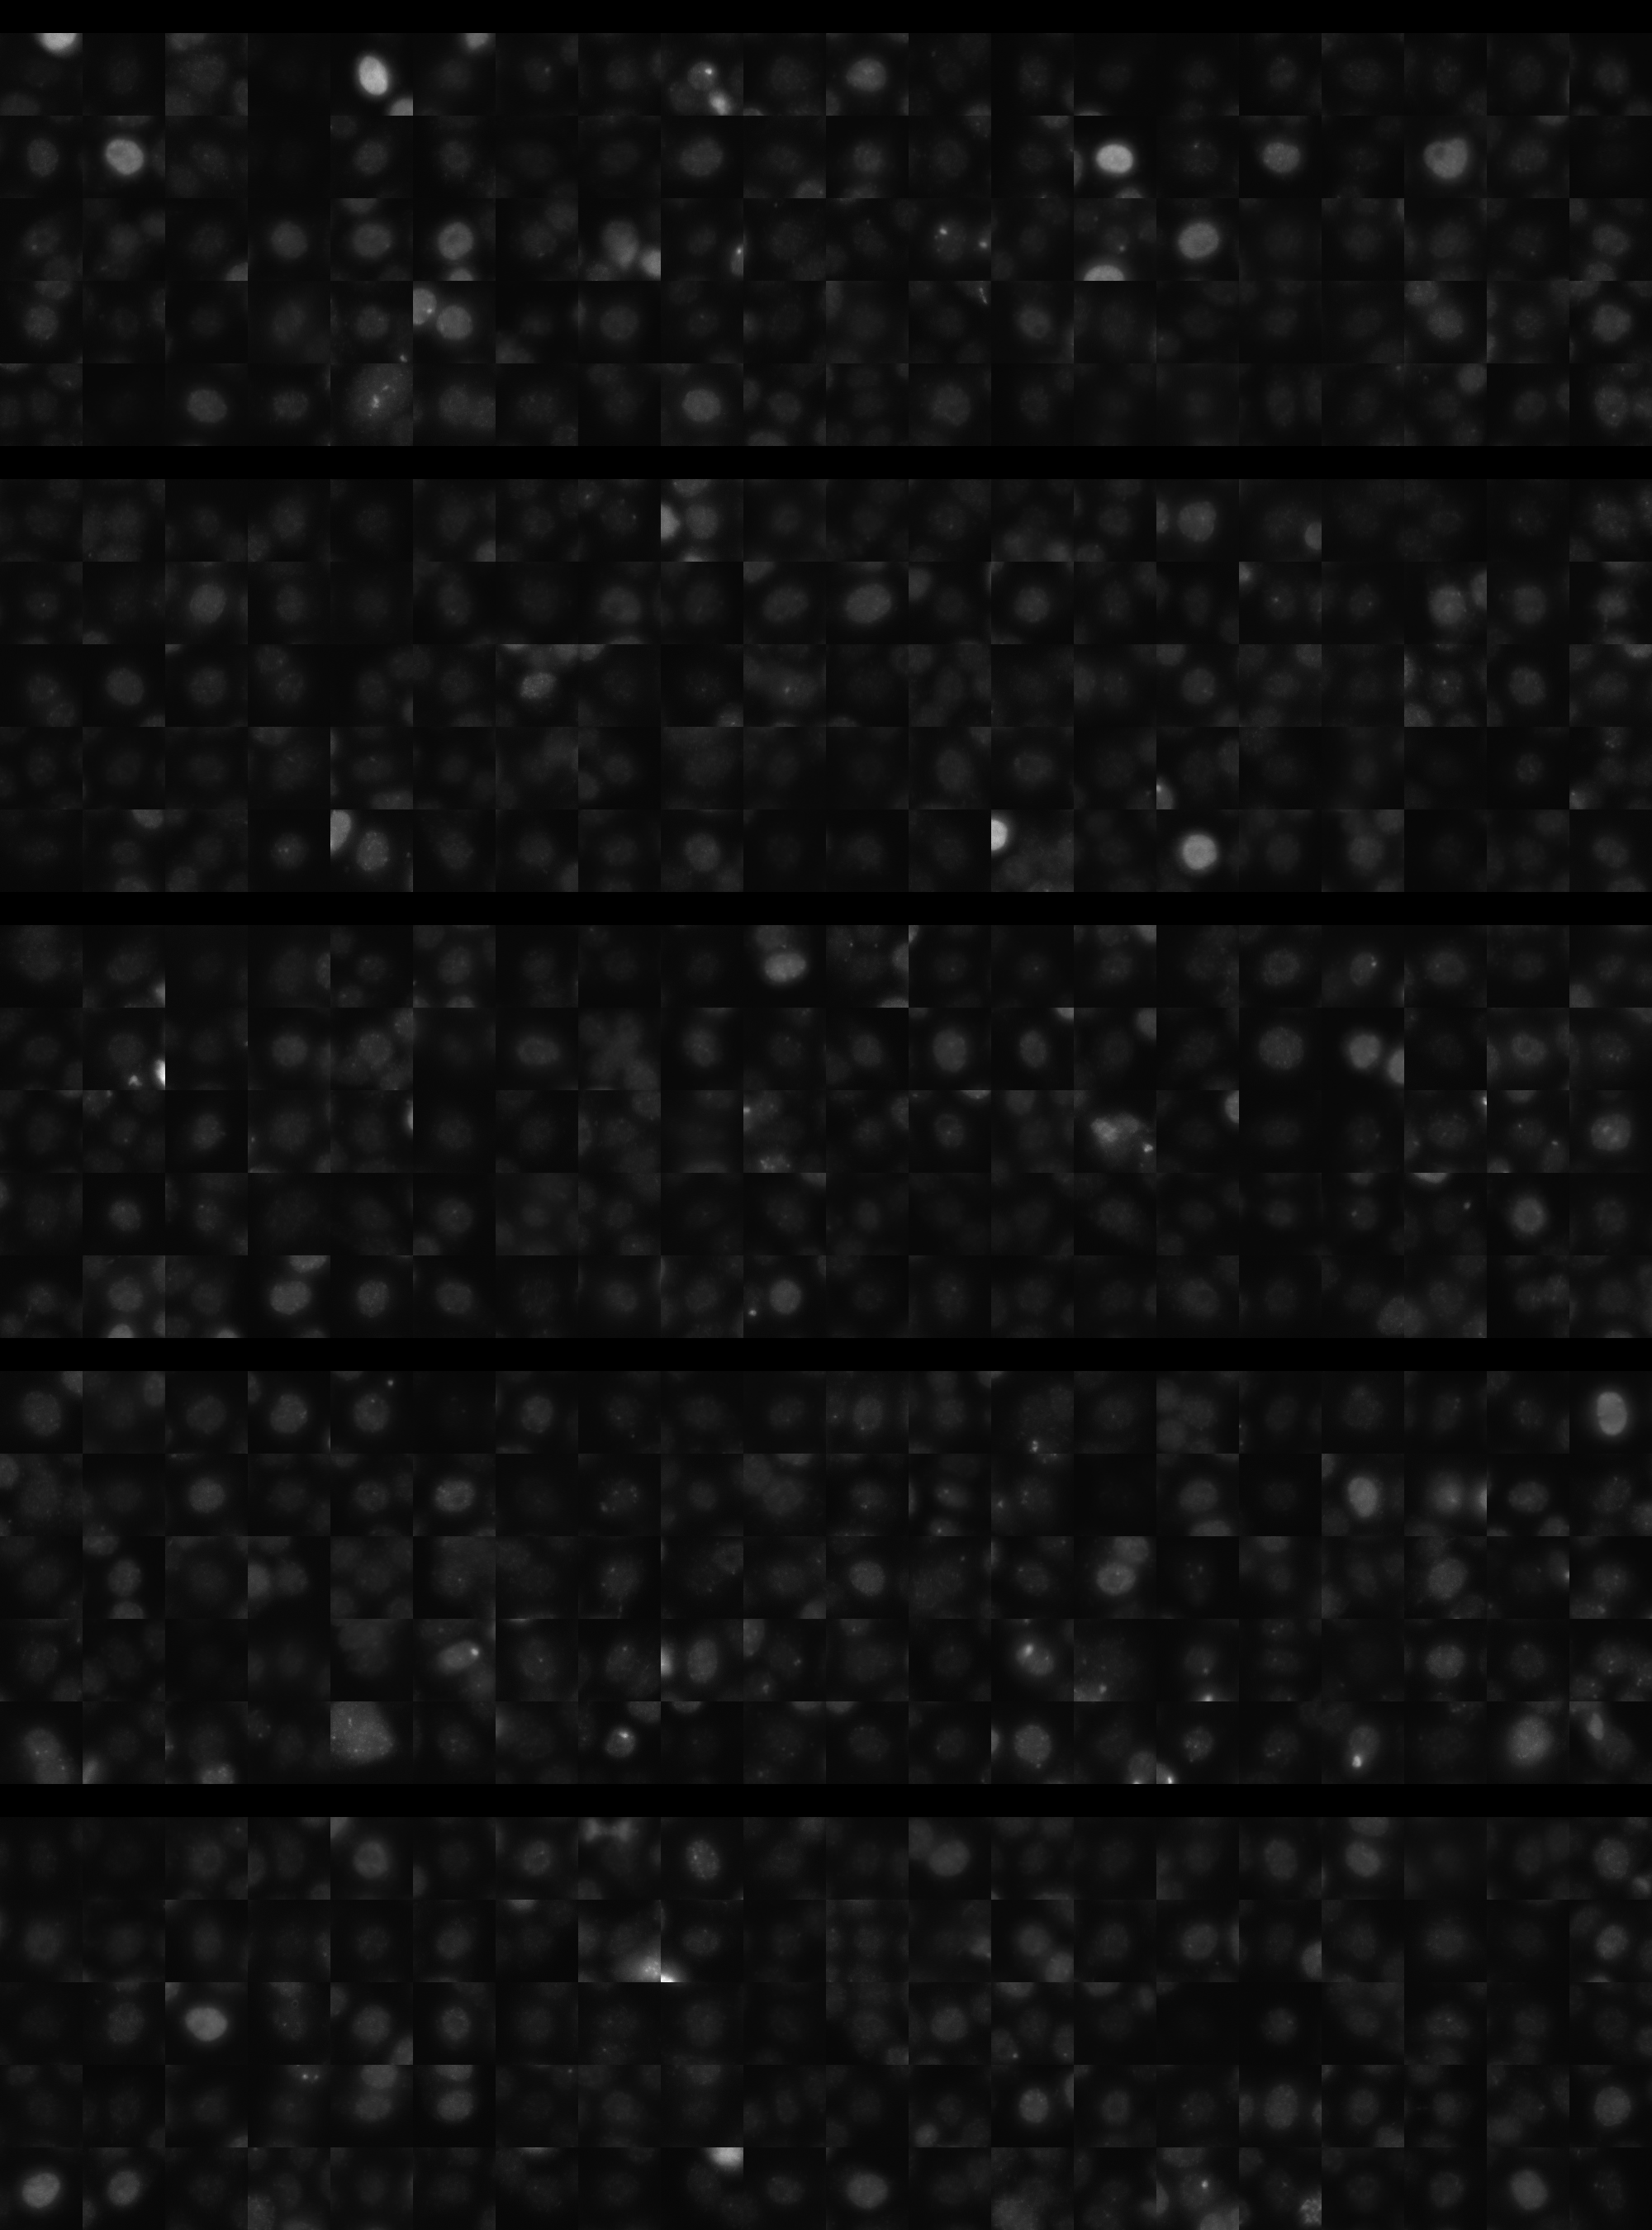
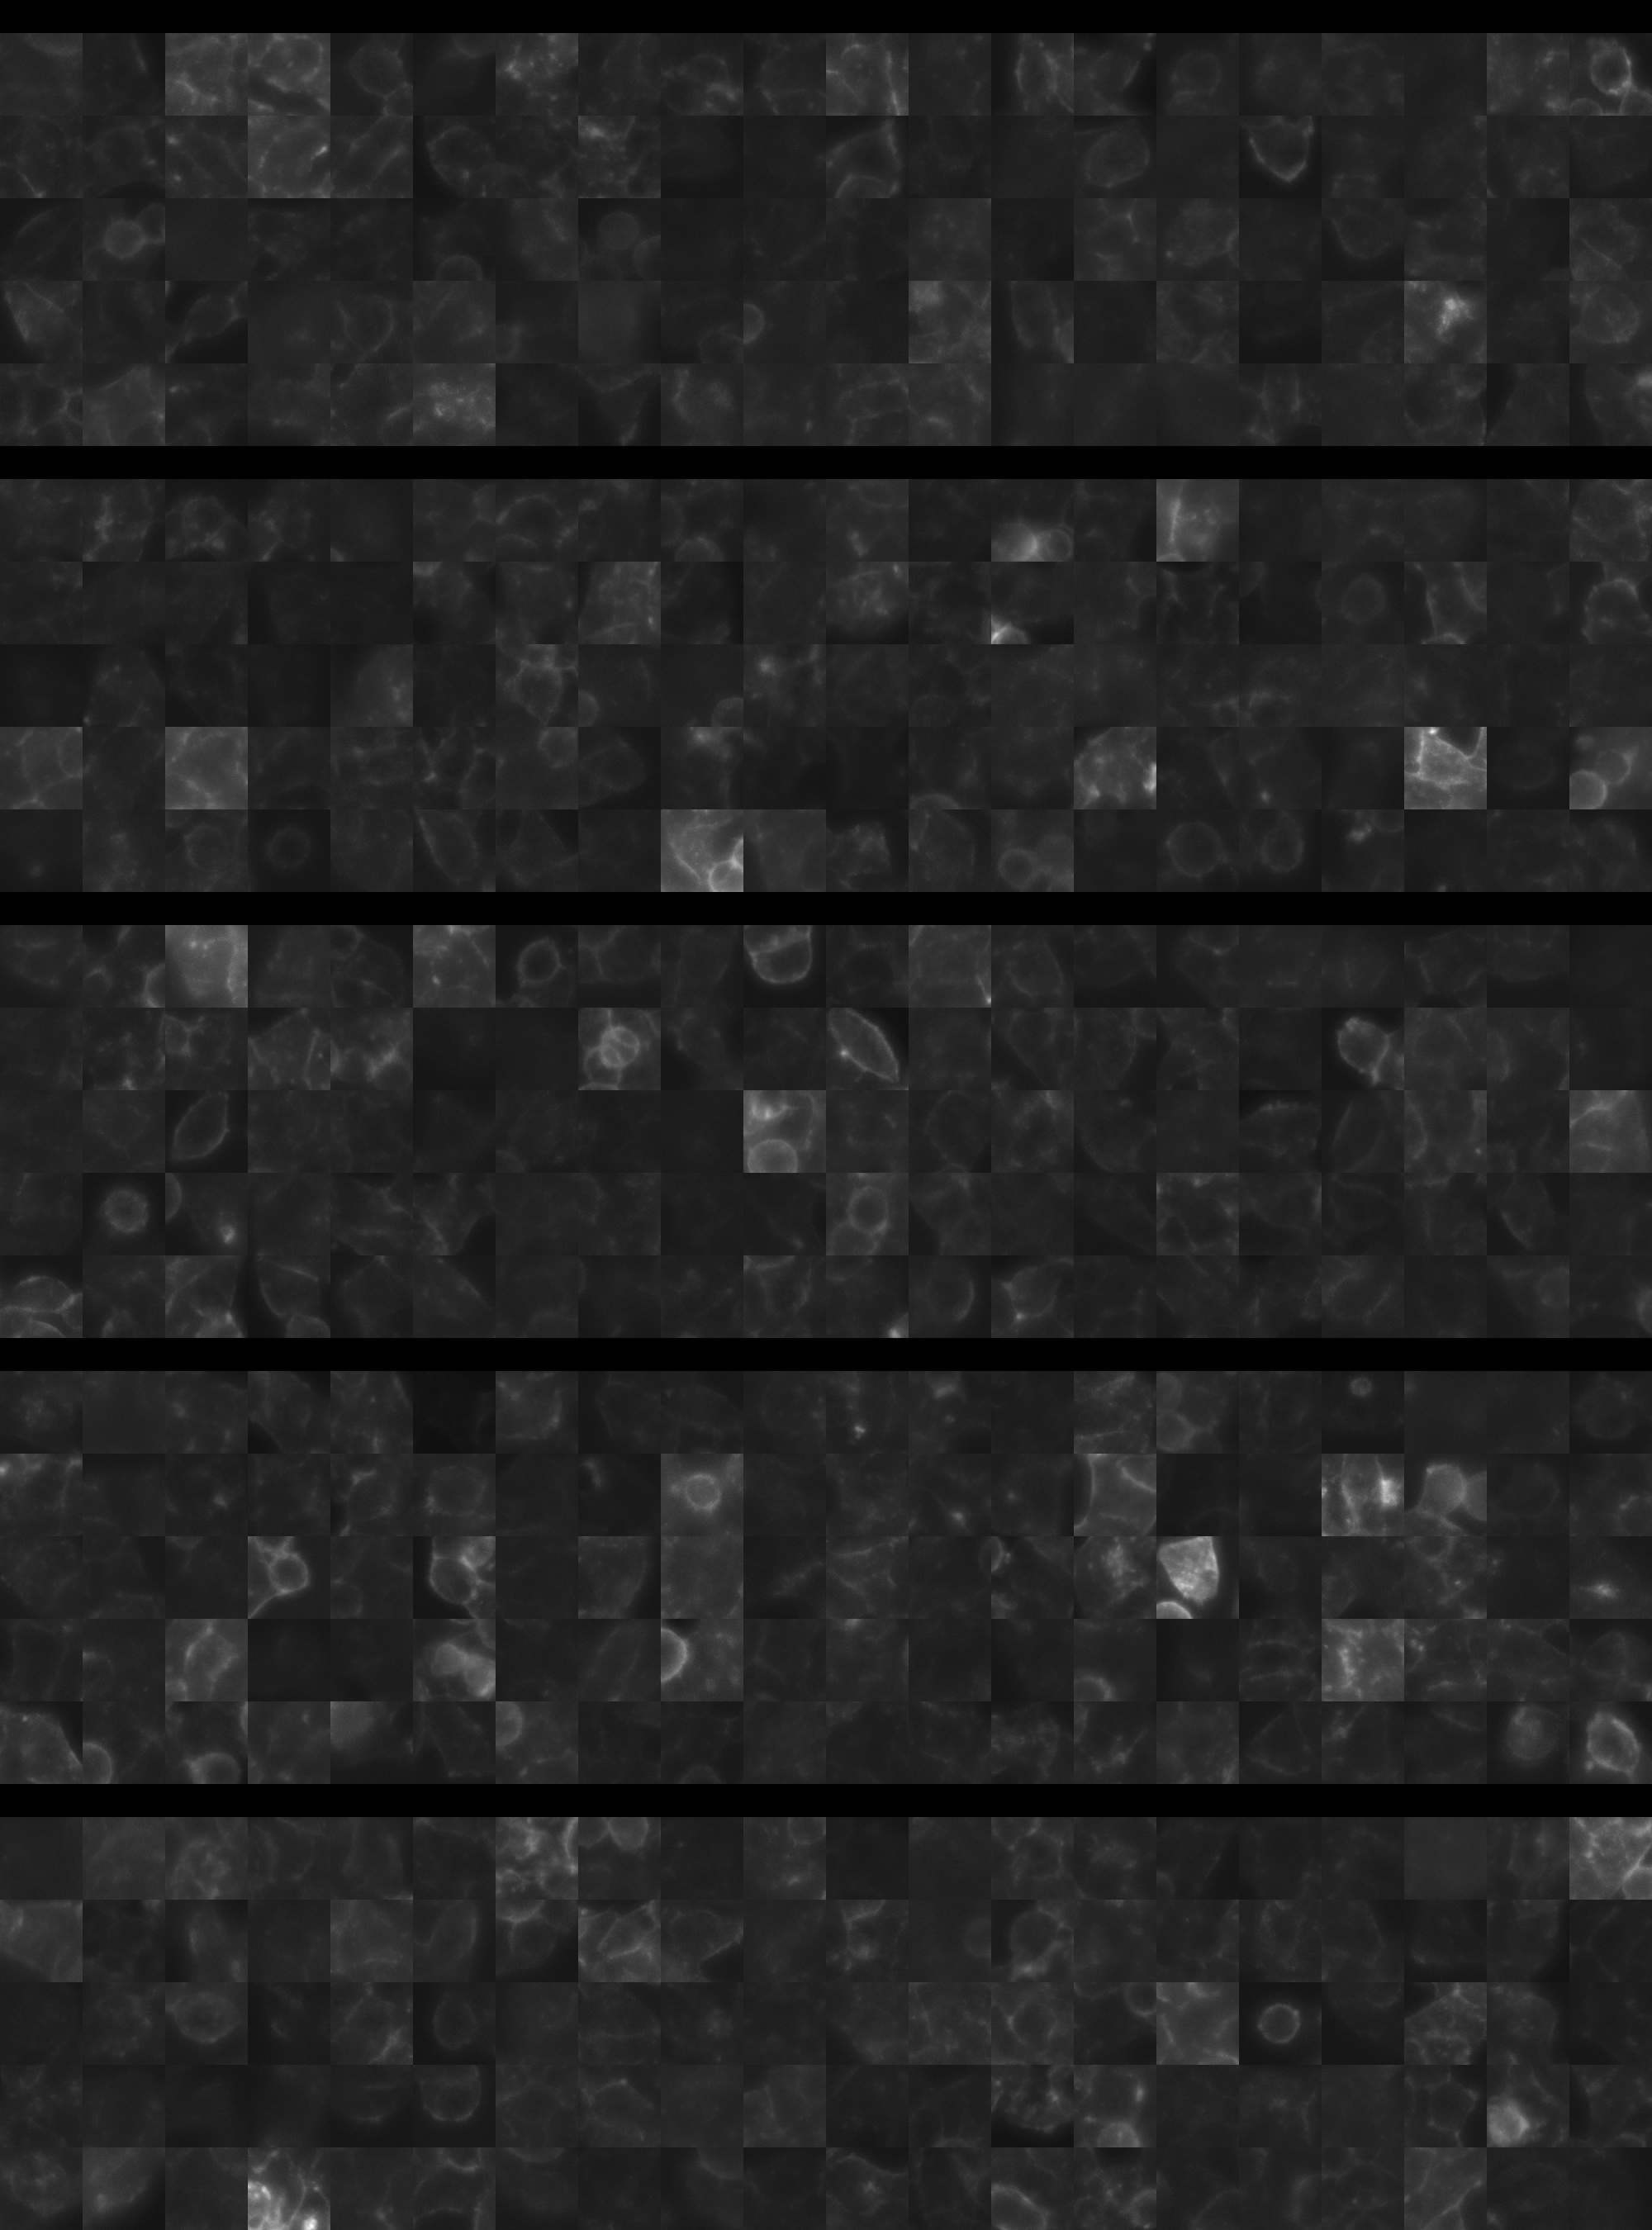
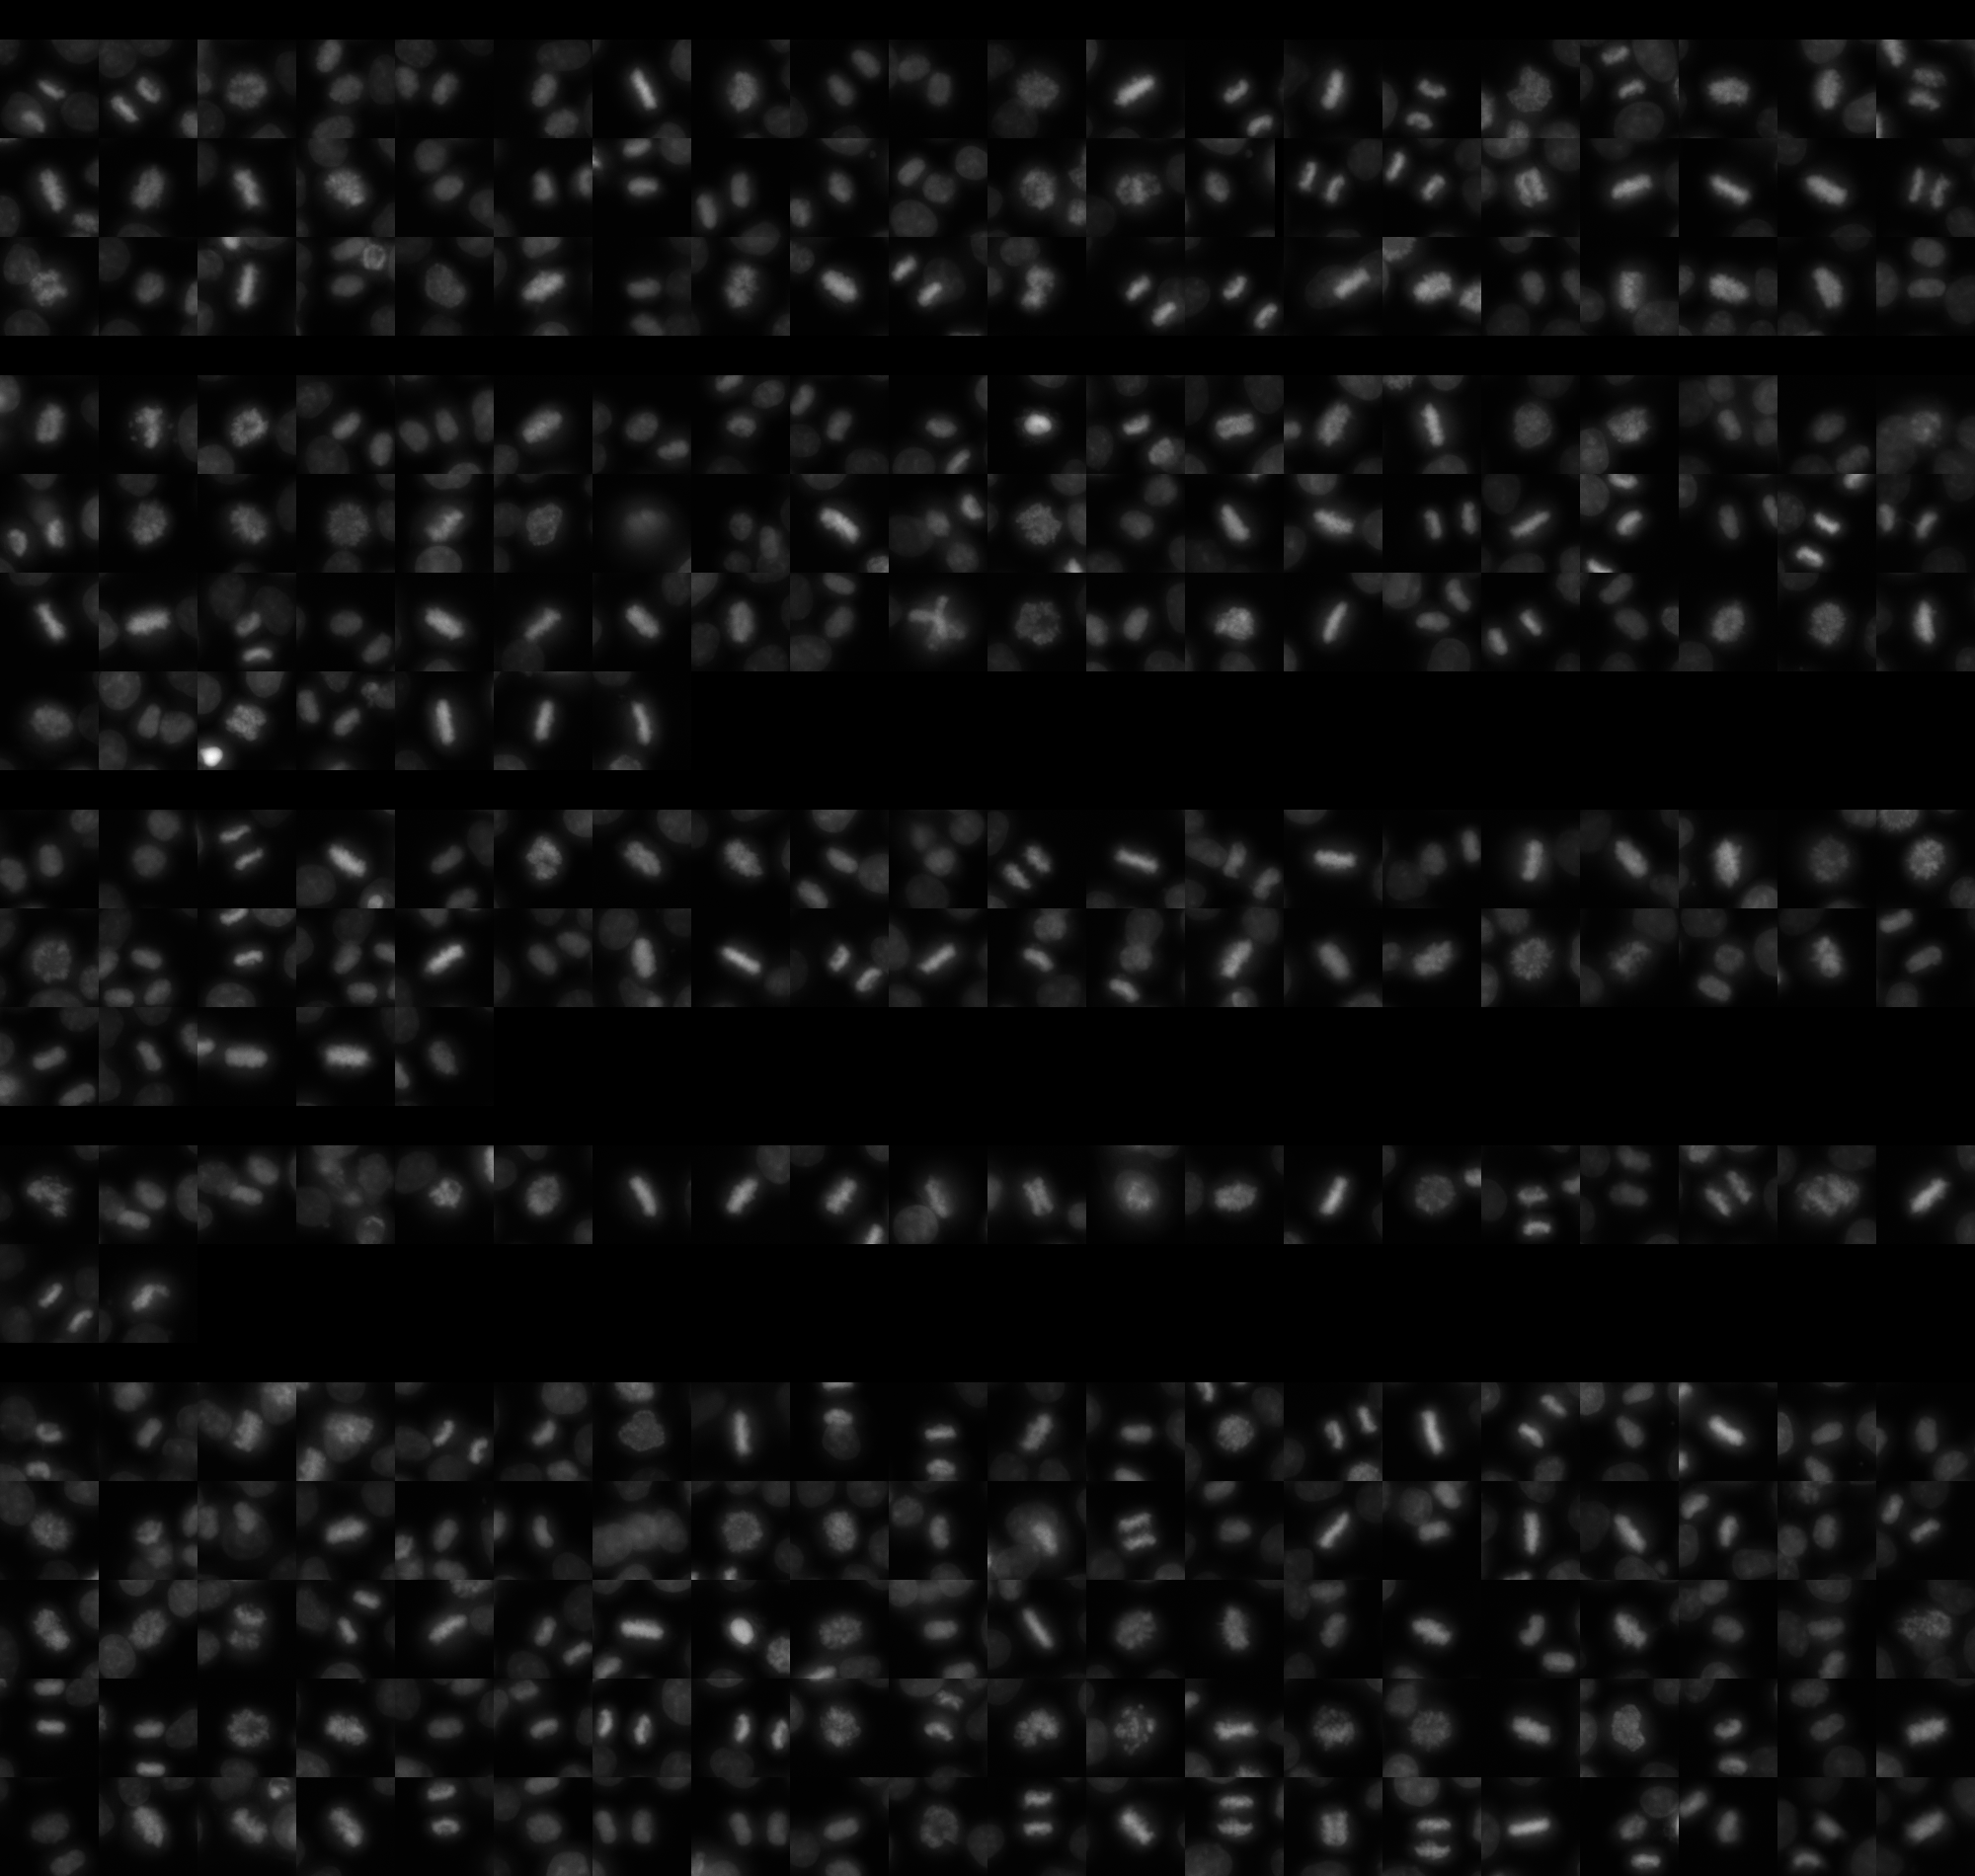
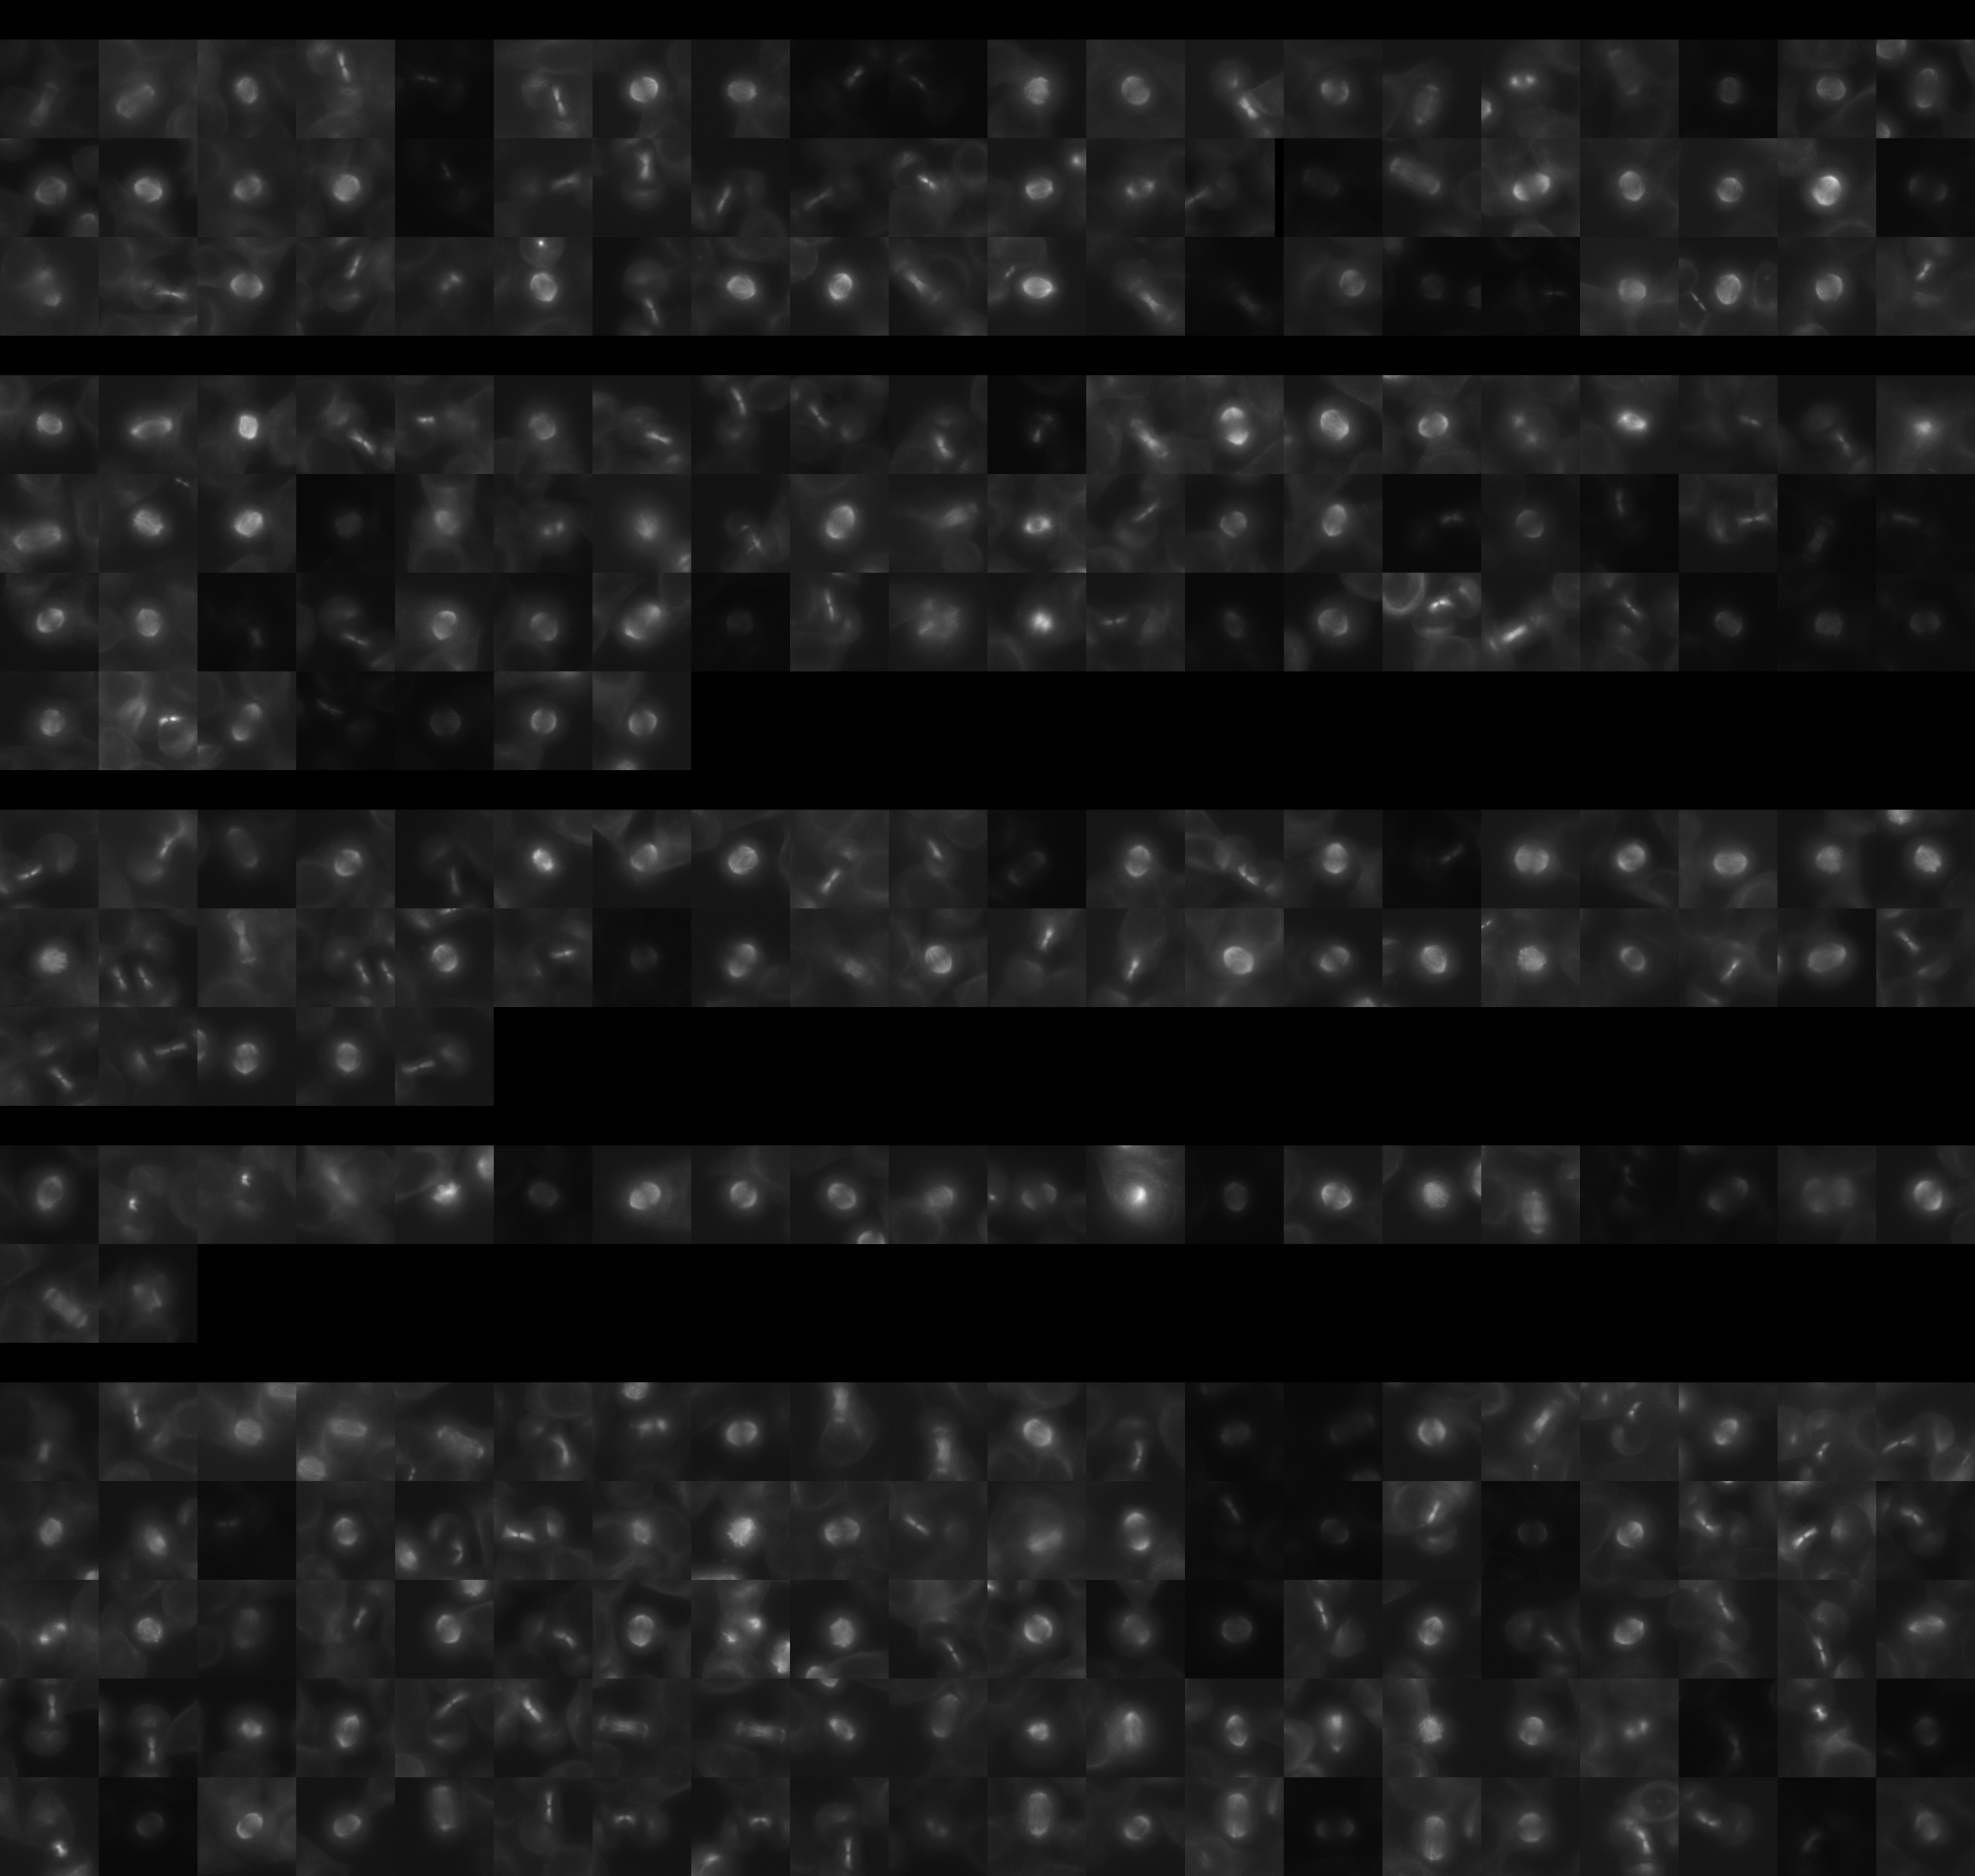
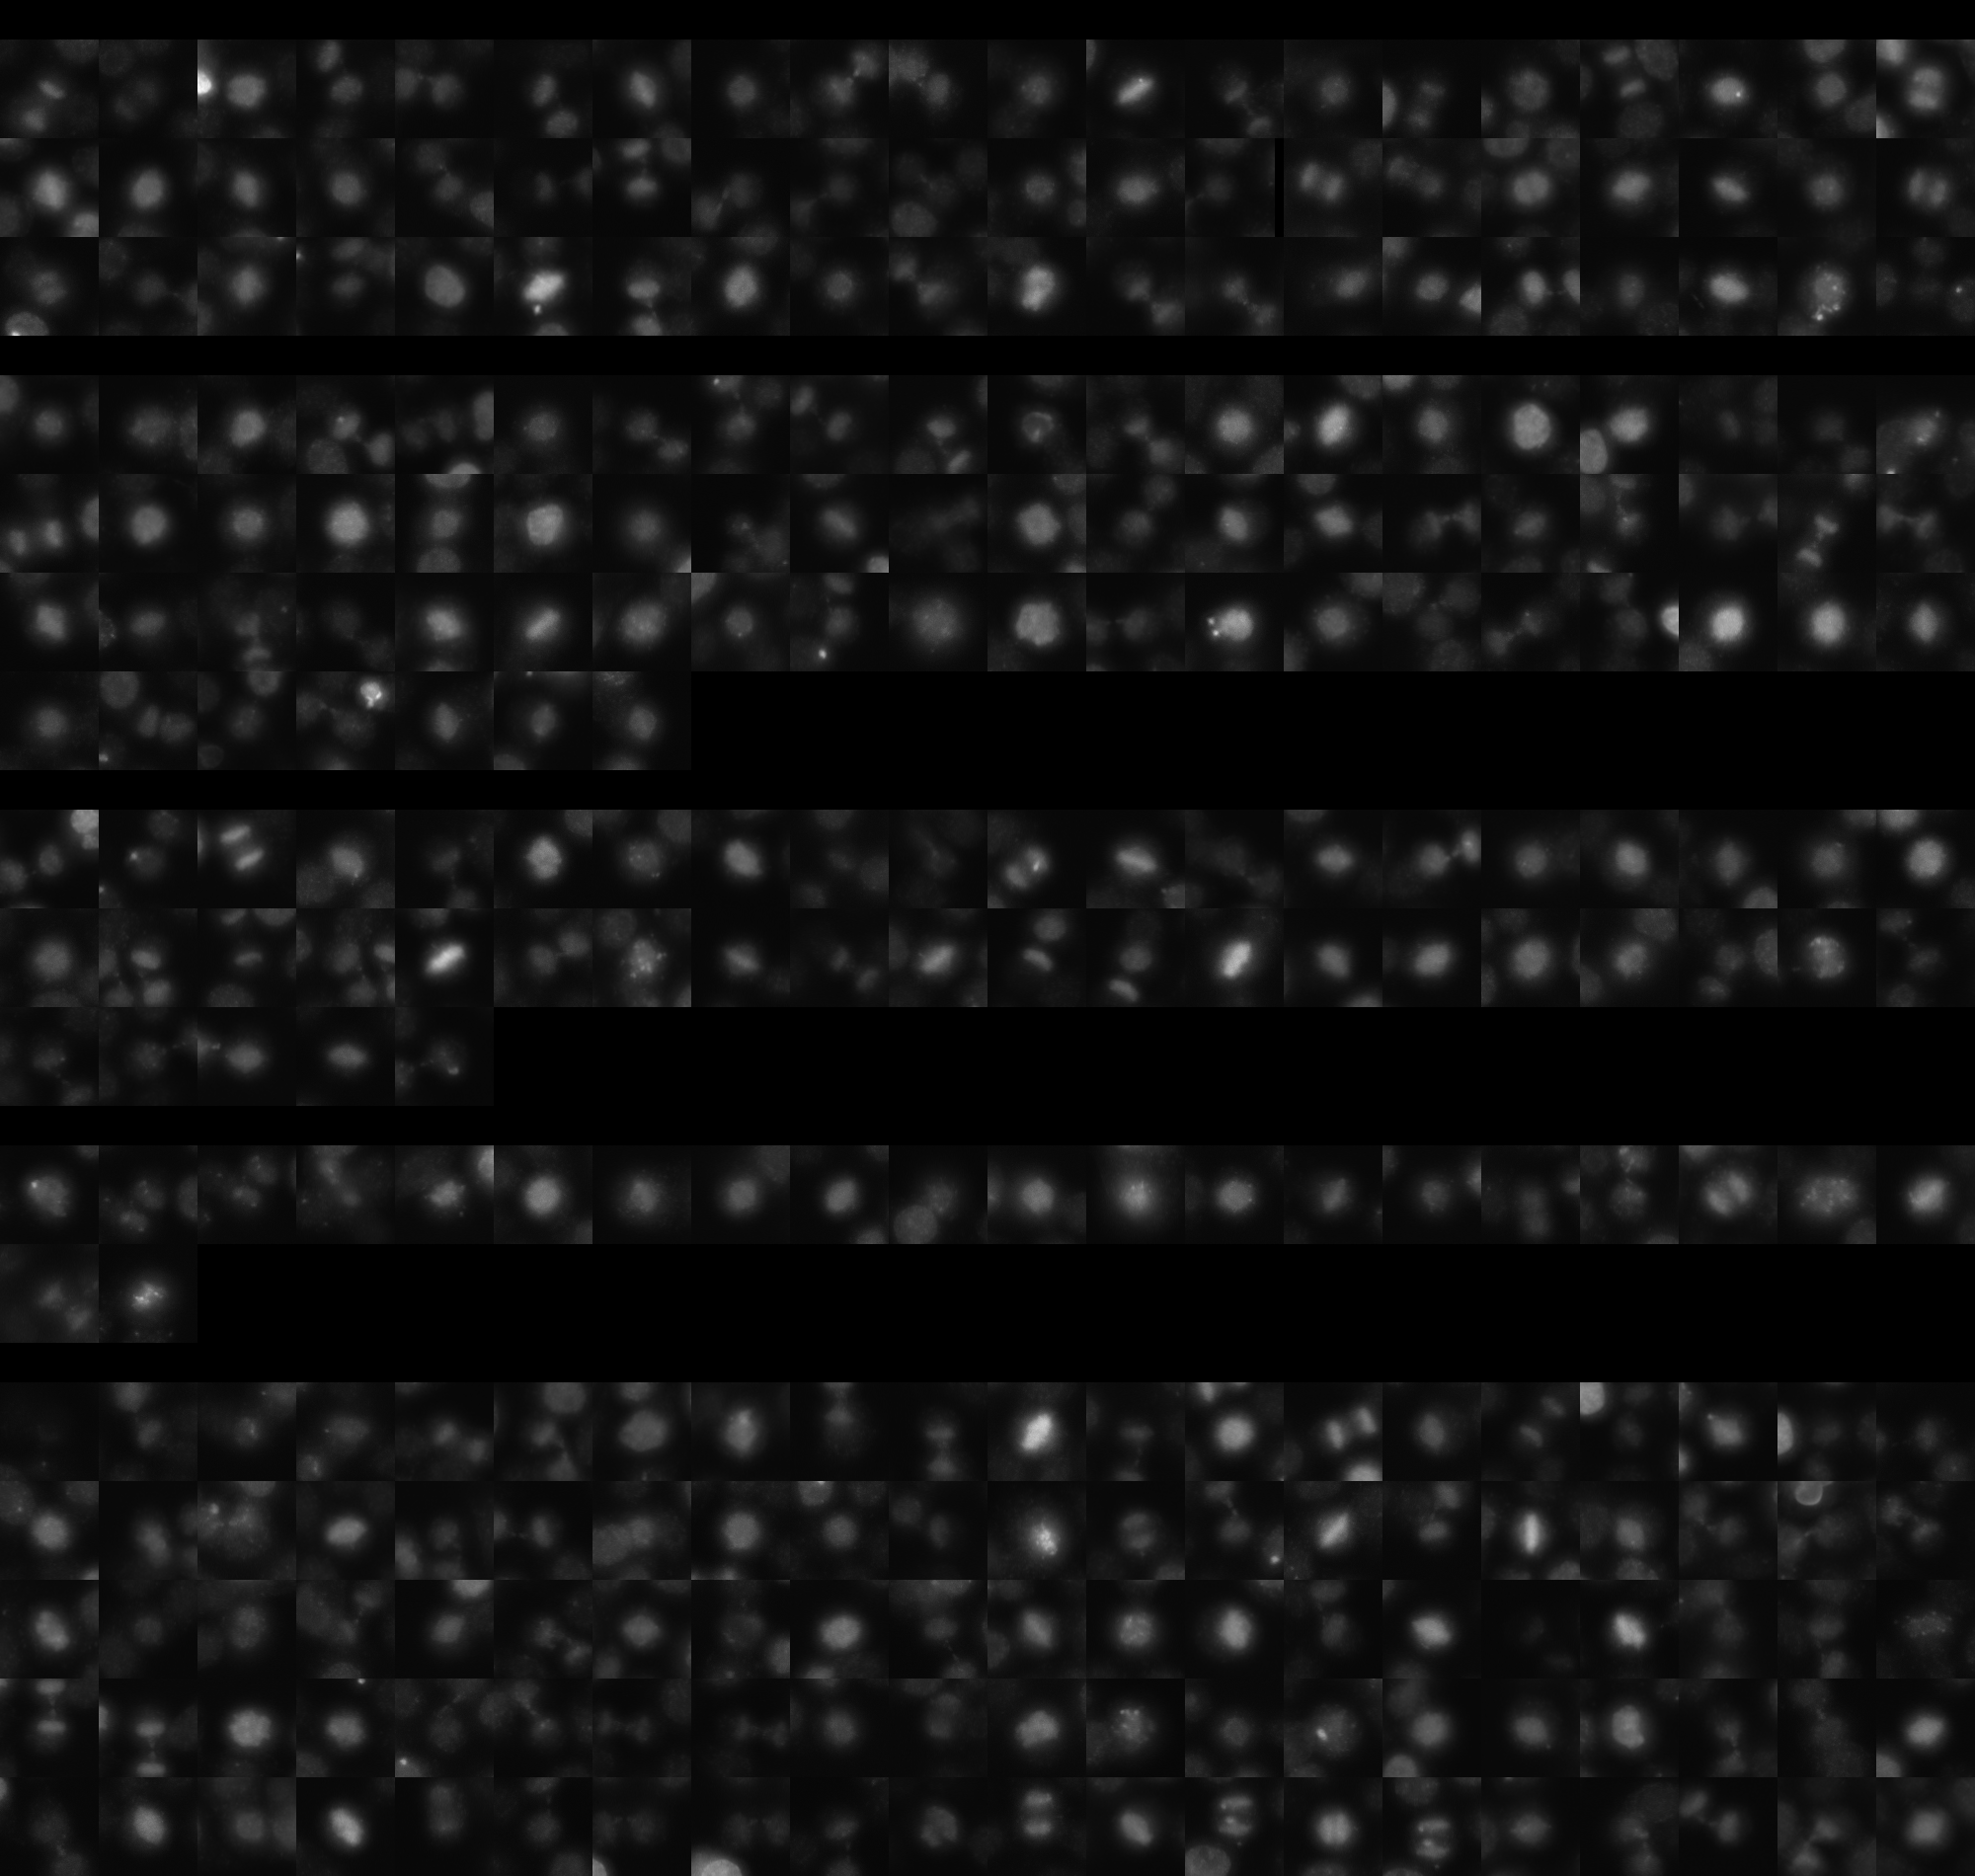
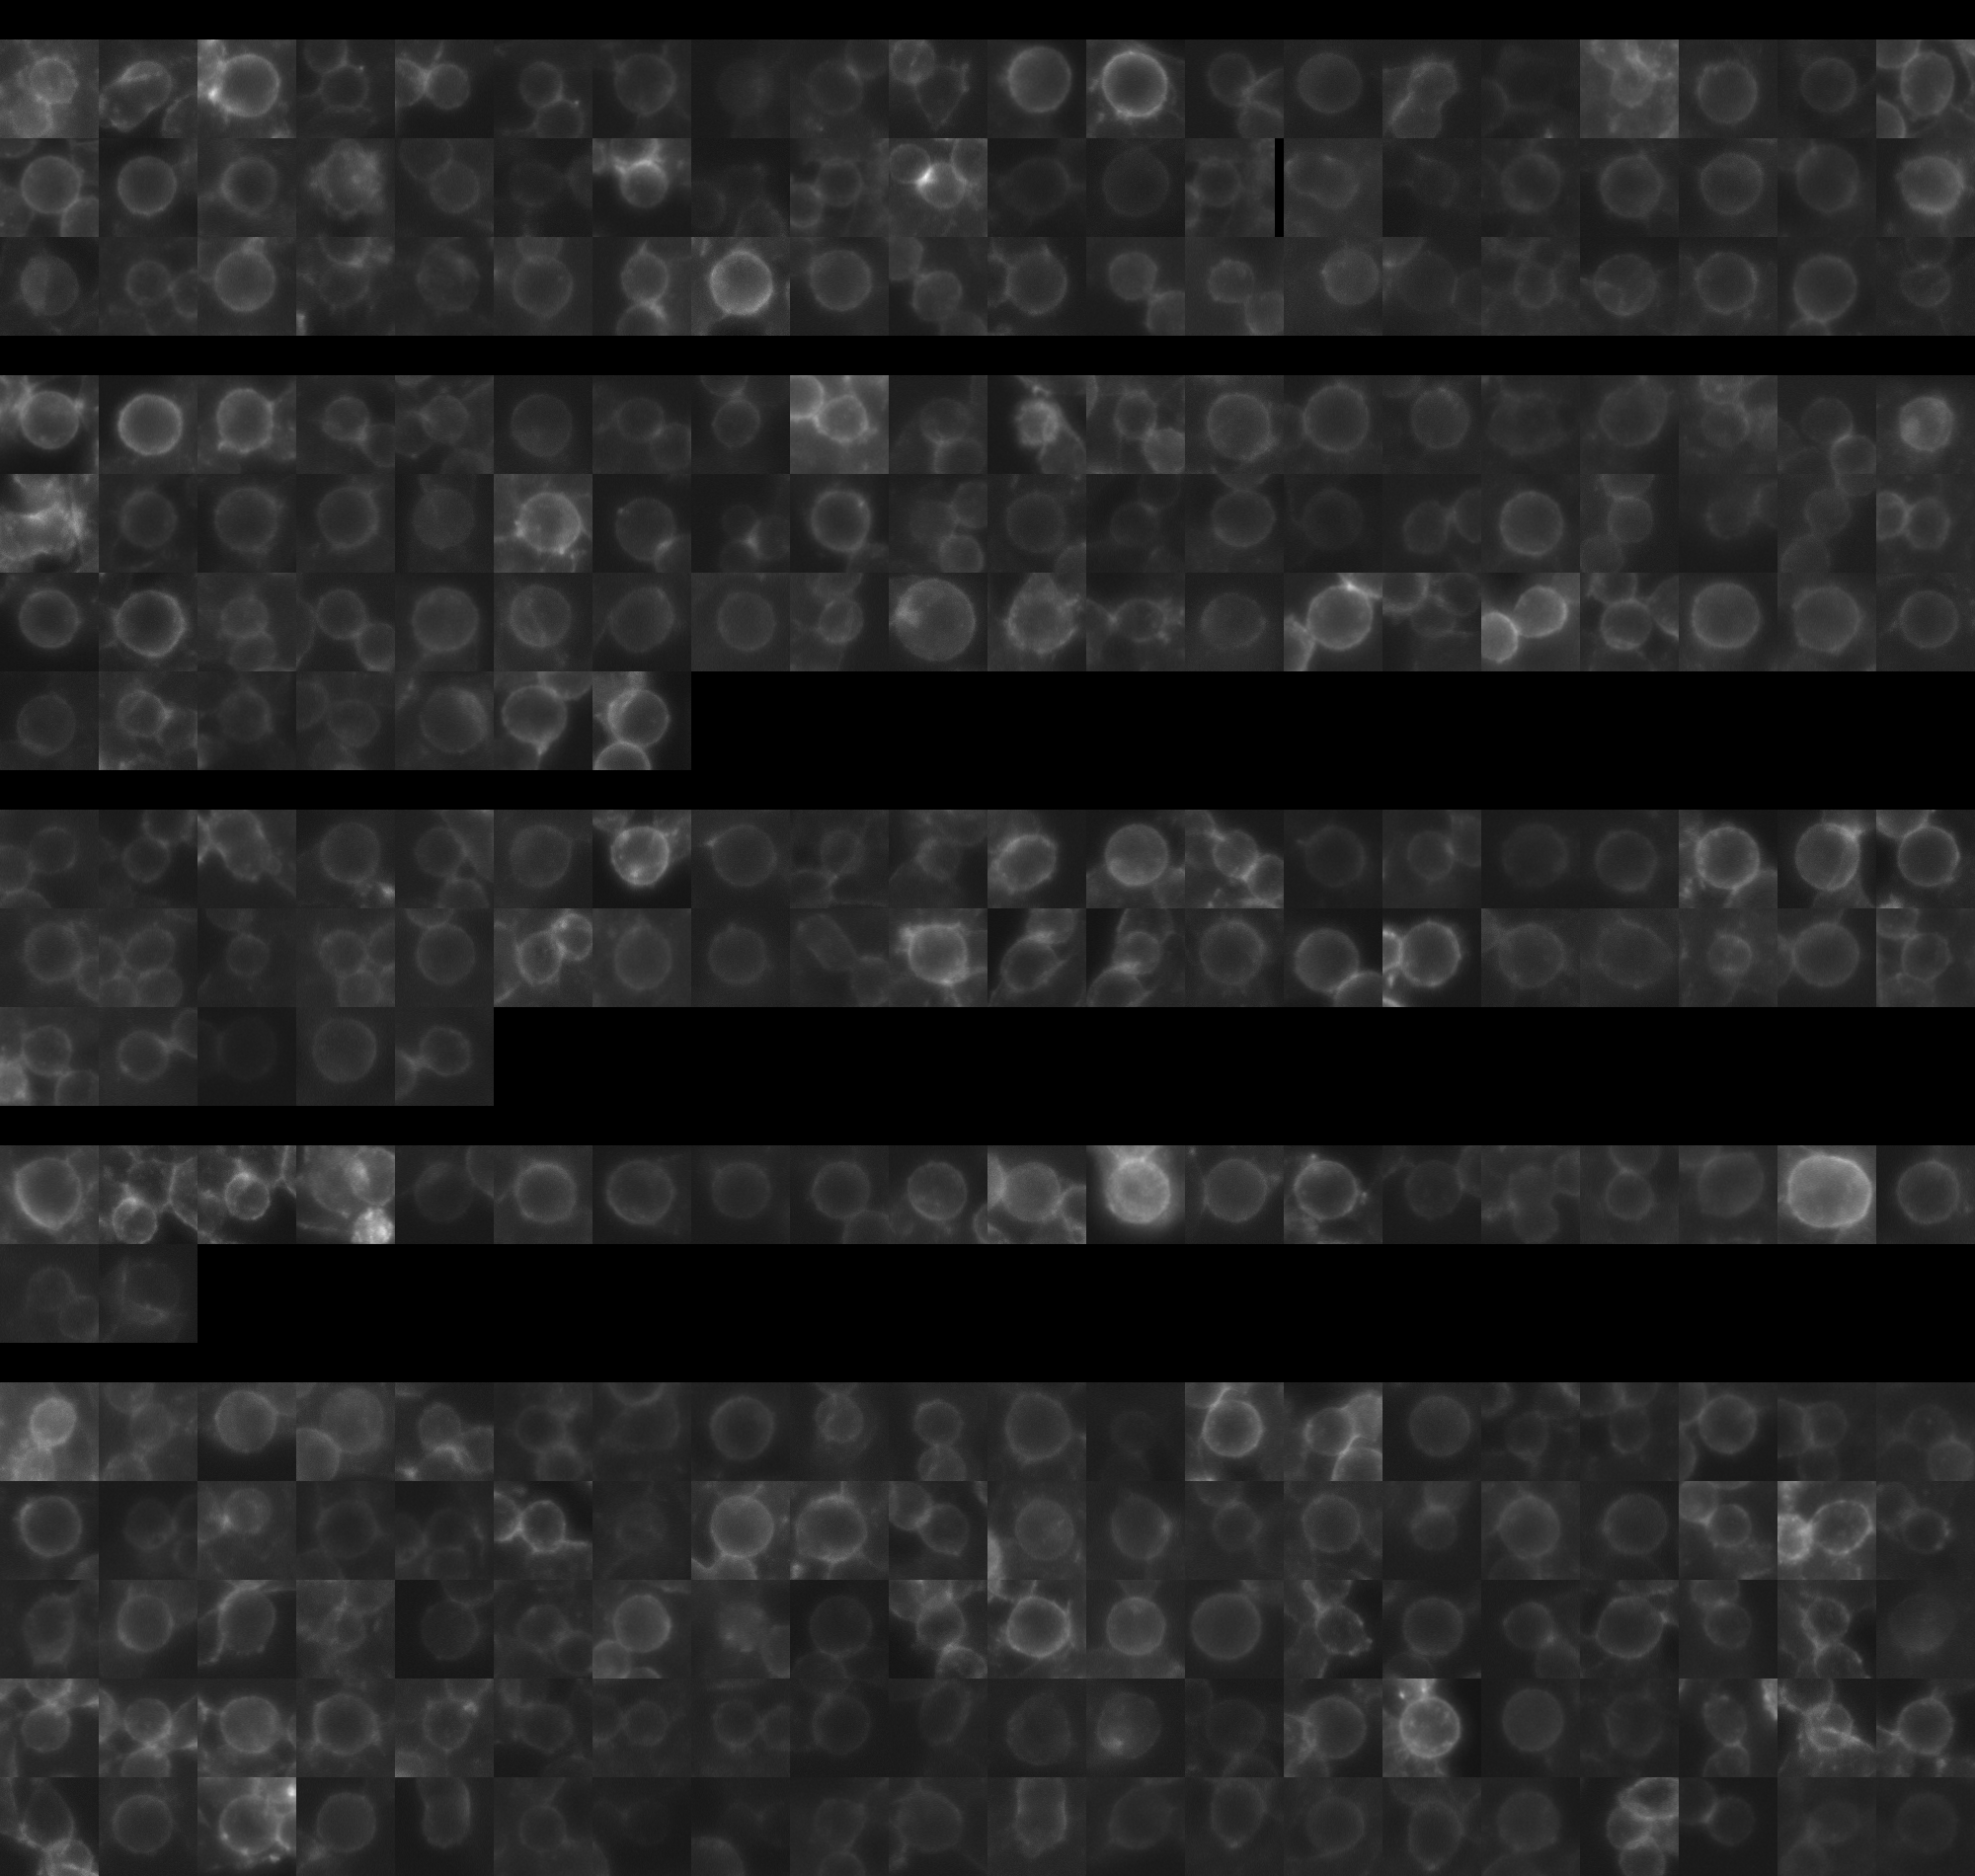
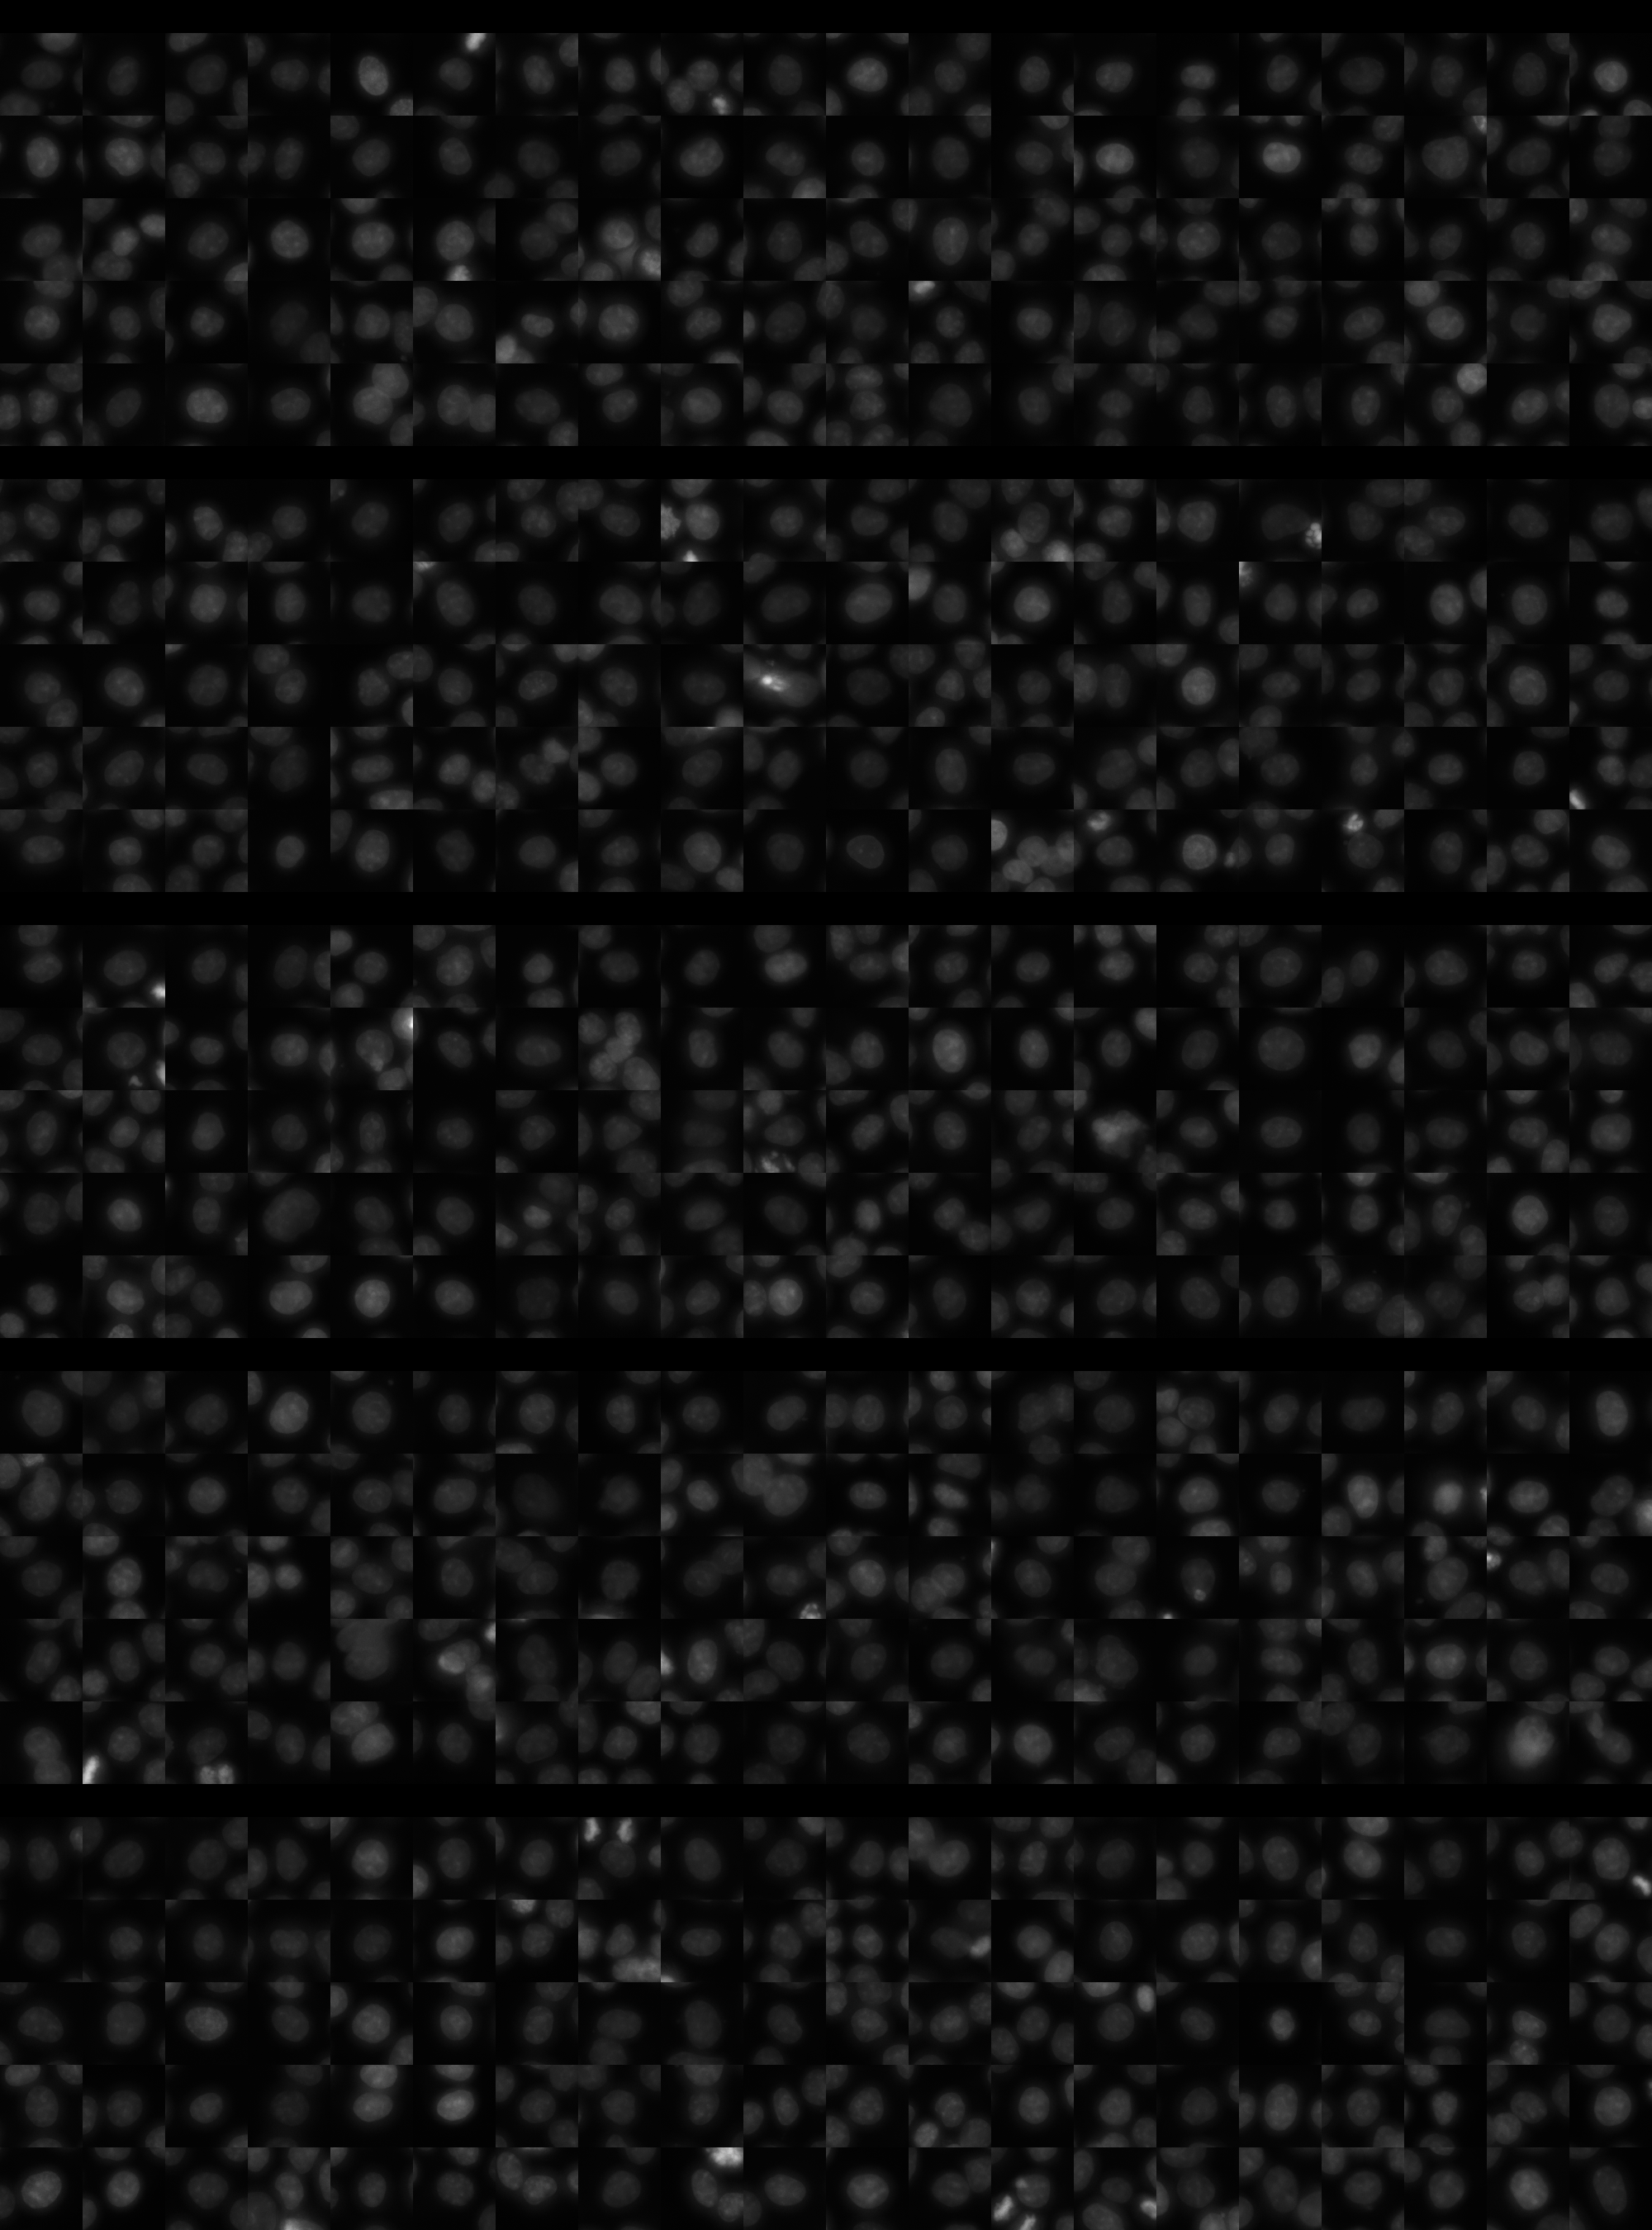
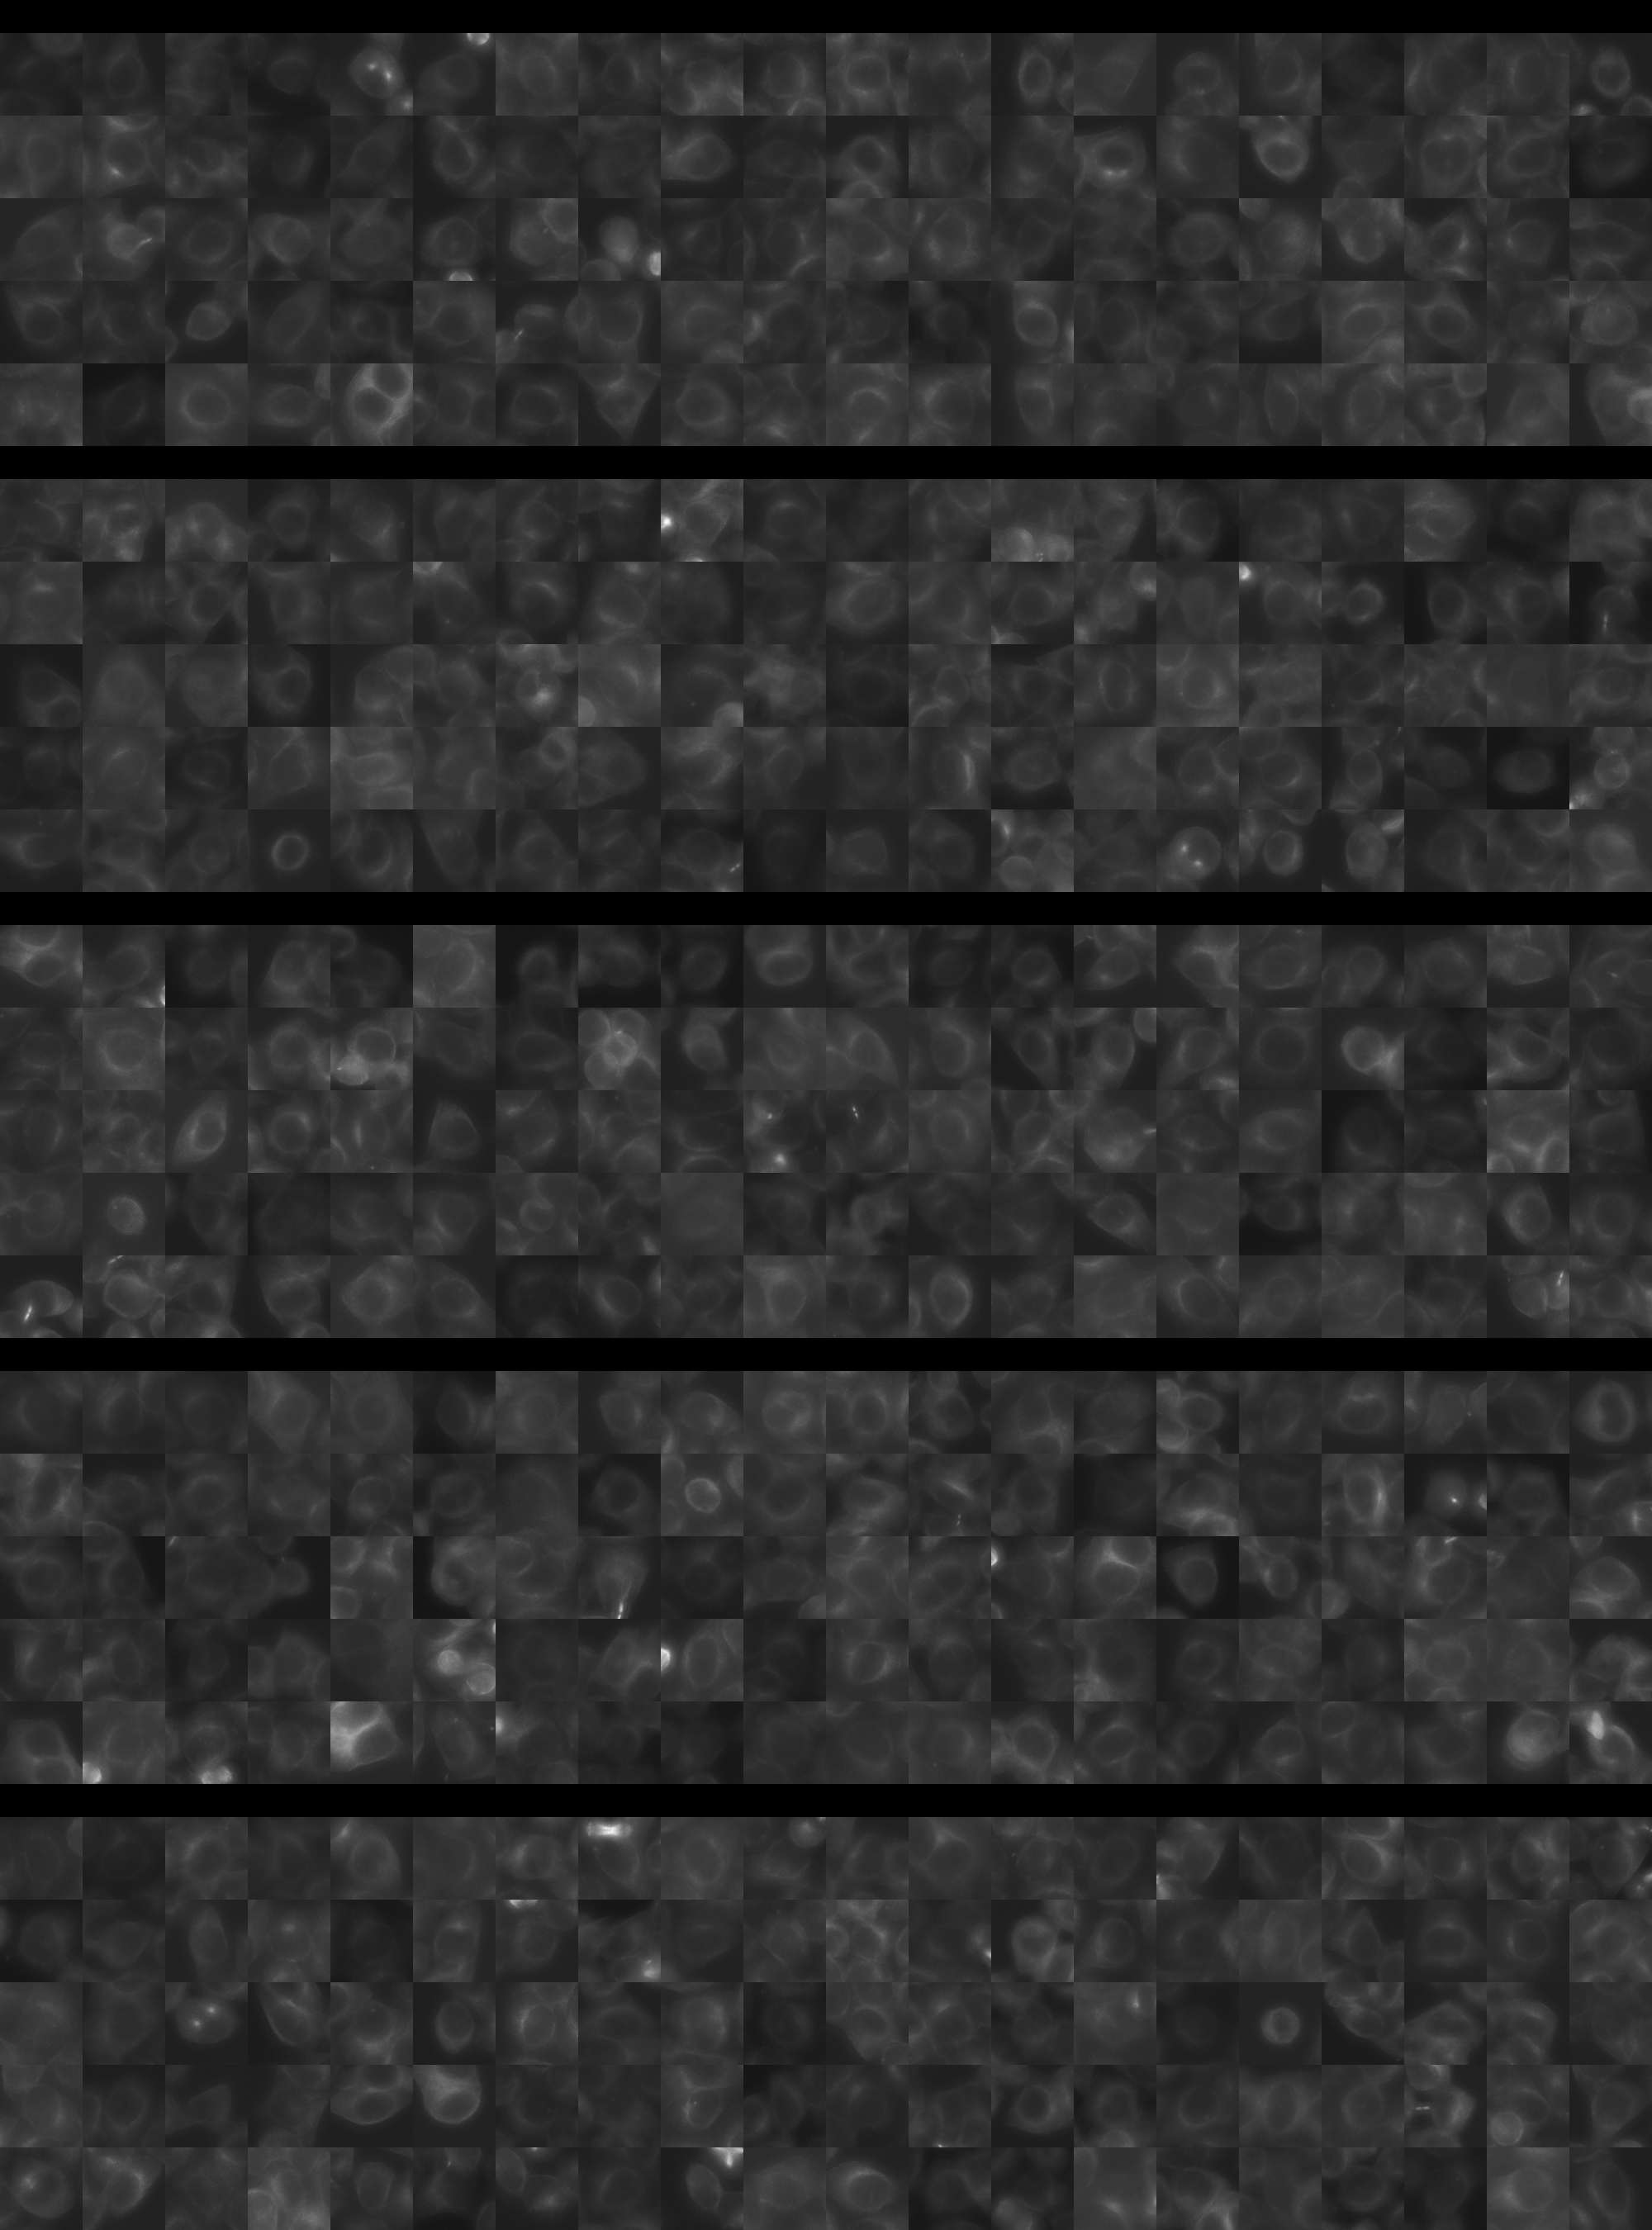
Each montage below shows randomly selected individual cell images for the same target gene separated by sgRNA, along with an example montage of cells expressing a non-targeting negative control sgRNA at the bottom. sgRNA labels in the montages correspond to the numbered sgRNA sequences in the gene info table above. The DNA (blue) and tubulin (green) channels are displayed by default, with gH2AX (grayscale) and actin (yellow) available using the check boxes. Channel brightness, contrast, and opacity are adjustable by clicking the arrow next to the channel name. When only one channel is selected, the display defaults to grayscale. Click the “Zoom” checkbox above the channel controls to enable image zooming (via scrolling) and panning (via click-and-drag).

The cell boxes displayed for this gene are square, 30.36 μm per side for the interphase montage and 30.36 μm per side for the mitotic montage.
Features

Interphase Score Rank FDR q-value
Nucleus DNA Integrated -2.856e-02 4359 of 5322 0.616
Nucleus DNA Mean -4.655e-02 3493 of 5322 0.283
Nucleus gH2AX Mean 0.075 2676 of 5322 0.052
Nucleus DNA - gH2AX Correlation -4.464e-02 2216 of 5322 0.105
Nucleus Shape Area 0.054 1550 of 5322 0.343
Nucleus Shape Eccentricity 0.025 2006 of 5322 0.541
Nucleus Shape Form Factor -3.020e-02 1736 of 5322 0.462
Nucleus Shape Solidity -3.238e-02 1855 of 5322 0.335
Cell DNA Mass Displacement 0.009 3852 of 5322 0.925
Cell Tubulin Mean 0.060 932 of 5322 0.127
Cell Tubulin Mass Displacement 0.034 1113 of 5322 0.485
Cell Actin Mean -5.500e-02 4442 of 5322 0.255
Cell Tubulin - Actin Correlation 0.029 2234 of 5322 0.496
Cell DNA - Tubulin Correlation -2.684e-02 4638 of 5322 0.499
Cell Shape Area 0.018 2566 of 5322 0.911
Cell Shape Eccentricity -1.340e-02 4515 of 5322 0.908
Mitotic Score Rank FDR q-value
Nucleus DNA Integrated 0.084 2723 of 5322 0.965
Nucleus DNA Mean -1.470e-02 3173 of 5322 1.000
Nucleus DNA Mass Displacement 0.026 3108 of 5322 0.999
Nucleus DNA Mean Frac 3 -4.625e-02 3790 of 5322 1.000
Nucleus gH2AX Mean 0.134 1275 of 5322 1.000
Nucleus gH2AX Mean Frac 0 0.036 1750 of 5322 1.000
Nucleus Tubulin Mean Frac 0 0.054 2678 of 5322 0.999
Nucleus Tubulin Mean Edge -7.176e-02 4062 of 5322 0.999
Nucleus Tubulin Std Edge -7.233e-02 3562 of 5322 0.999
Nucleus Shape Area 0.031 3592 of 5322 0.990
Nucleus Shape Eccentricity 0.079 1067 of 5322 1.000
Nucleus Shape Form Factor 0.092 457 of 5322 0.998
Cell Tubulin Mean 0.152 1415 of 5322 0.997
Cell Tubulin Mean Frac 3 -1.376e-01 3398 of 5322 0.999
Cell Actin Mean 0.051 2523 of 5322 0.997
Cell Shape Area 0.172 1695 of 5322 0.994
( Reset Zoom )
Brightness
Contrast
Opacity
Brightness
Contrast
Opacity
Brightness
Contrast
Opacity
Brightness
Contrast
Opacity
Brightness
Contrast
Opacity

( Reset Zoom )
Brightness
Contrast
Opacity
Brightness
Contrast
Opacity
Brightness
Contrast
Opacity
Brightness
Contrast
Opacity
Brightness
Contrast
Opacity

MIT Central Accessability