SCAP

Gene symbol: SCAP
Gene: 22937
Uniprot Function: Escort protein required for cholesterol as well as lipid homeostasis (By similarity). Regulates export of the SCAP-SREBP complex from the endoplasmic reticulum to the Golgi upon low cholesterol, thereby regulating the processing of sterol regulatory element-binding proteins (SREBPs) SREBF1/SREBP1 and SREBF2/SREBP2 (By similarity). At high sterol concentrations, formation of a ternary complex with INSIG (INSIG1 or INSIG2) leads to mask the ER export signal in SCAP, promoting retention of the complex in the endoplasmic reticulum (By similarity). Low sterol concentrations trigger release of INSIG, a conformational change in the SSD domain of SCAP, unmasking of the ER export signal, promoting recruitment into COPII-coated vesicles and transport of the SCAP-SREBP to the Golgi: in the Golgi, SREBPs are then processed, releasing the transcription factor fragment of SREBPs from the membrane, its import into the nucleus and up-regulation of LDLR, INSIG1 and the mevalonate pathway (By similarity). Binds cholesterol via its SSD domain (By similarity).
Mitotic Index 0.0291
Interphase Cluster: #104 (23 genes)
Mitotic Cluster: #25 (36 genes)
sgRNA 1: CAGGATGCCAATCCAGACAA (interphase cells: 1623, mitotic cells: 56)
sgRNA 2: CTGCTGGACATAAGCCACCG (interphase cells: 1370, mitotic cells: 37)
sgRNA 3: GCCCACCCTCAATGGCGGGT (interphase cells: 1122, mitotic cells: 36)
sgRNA 4: GGTCCACGTGCACTTCAAGG (interphase cells: 1587, mitotic cells: 42)

Interphase Cluster

Mitotic Cluster

Overview

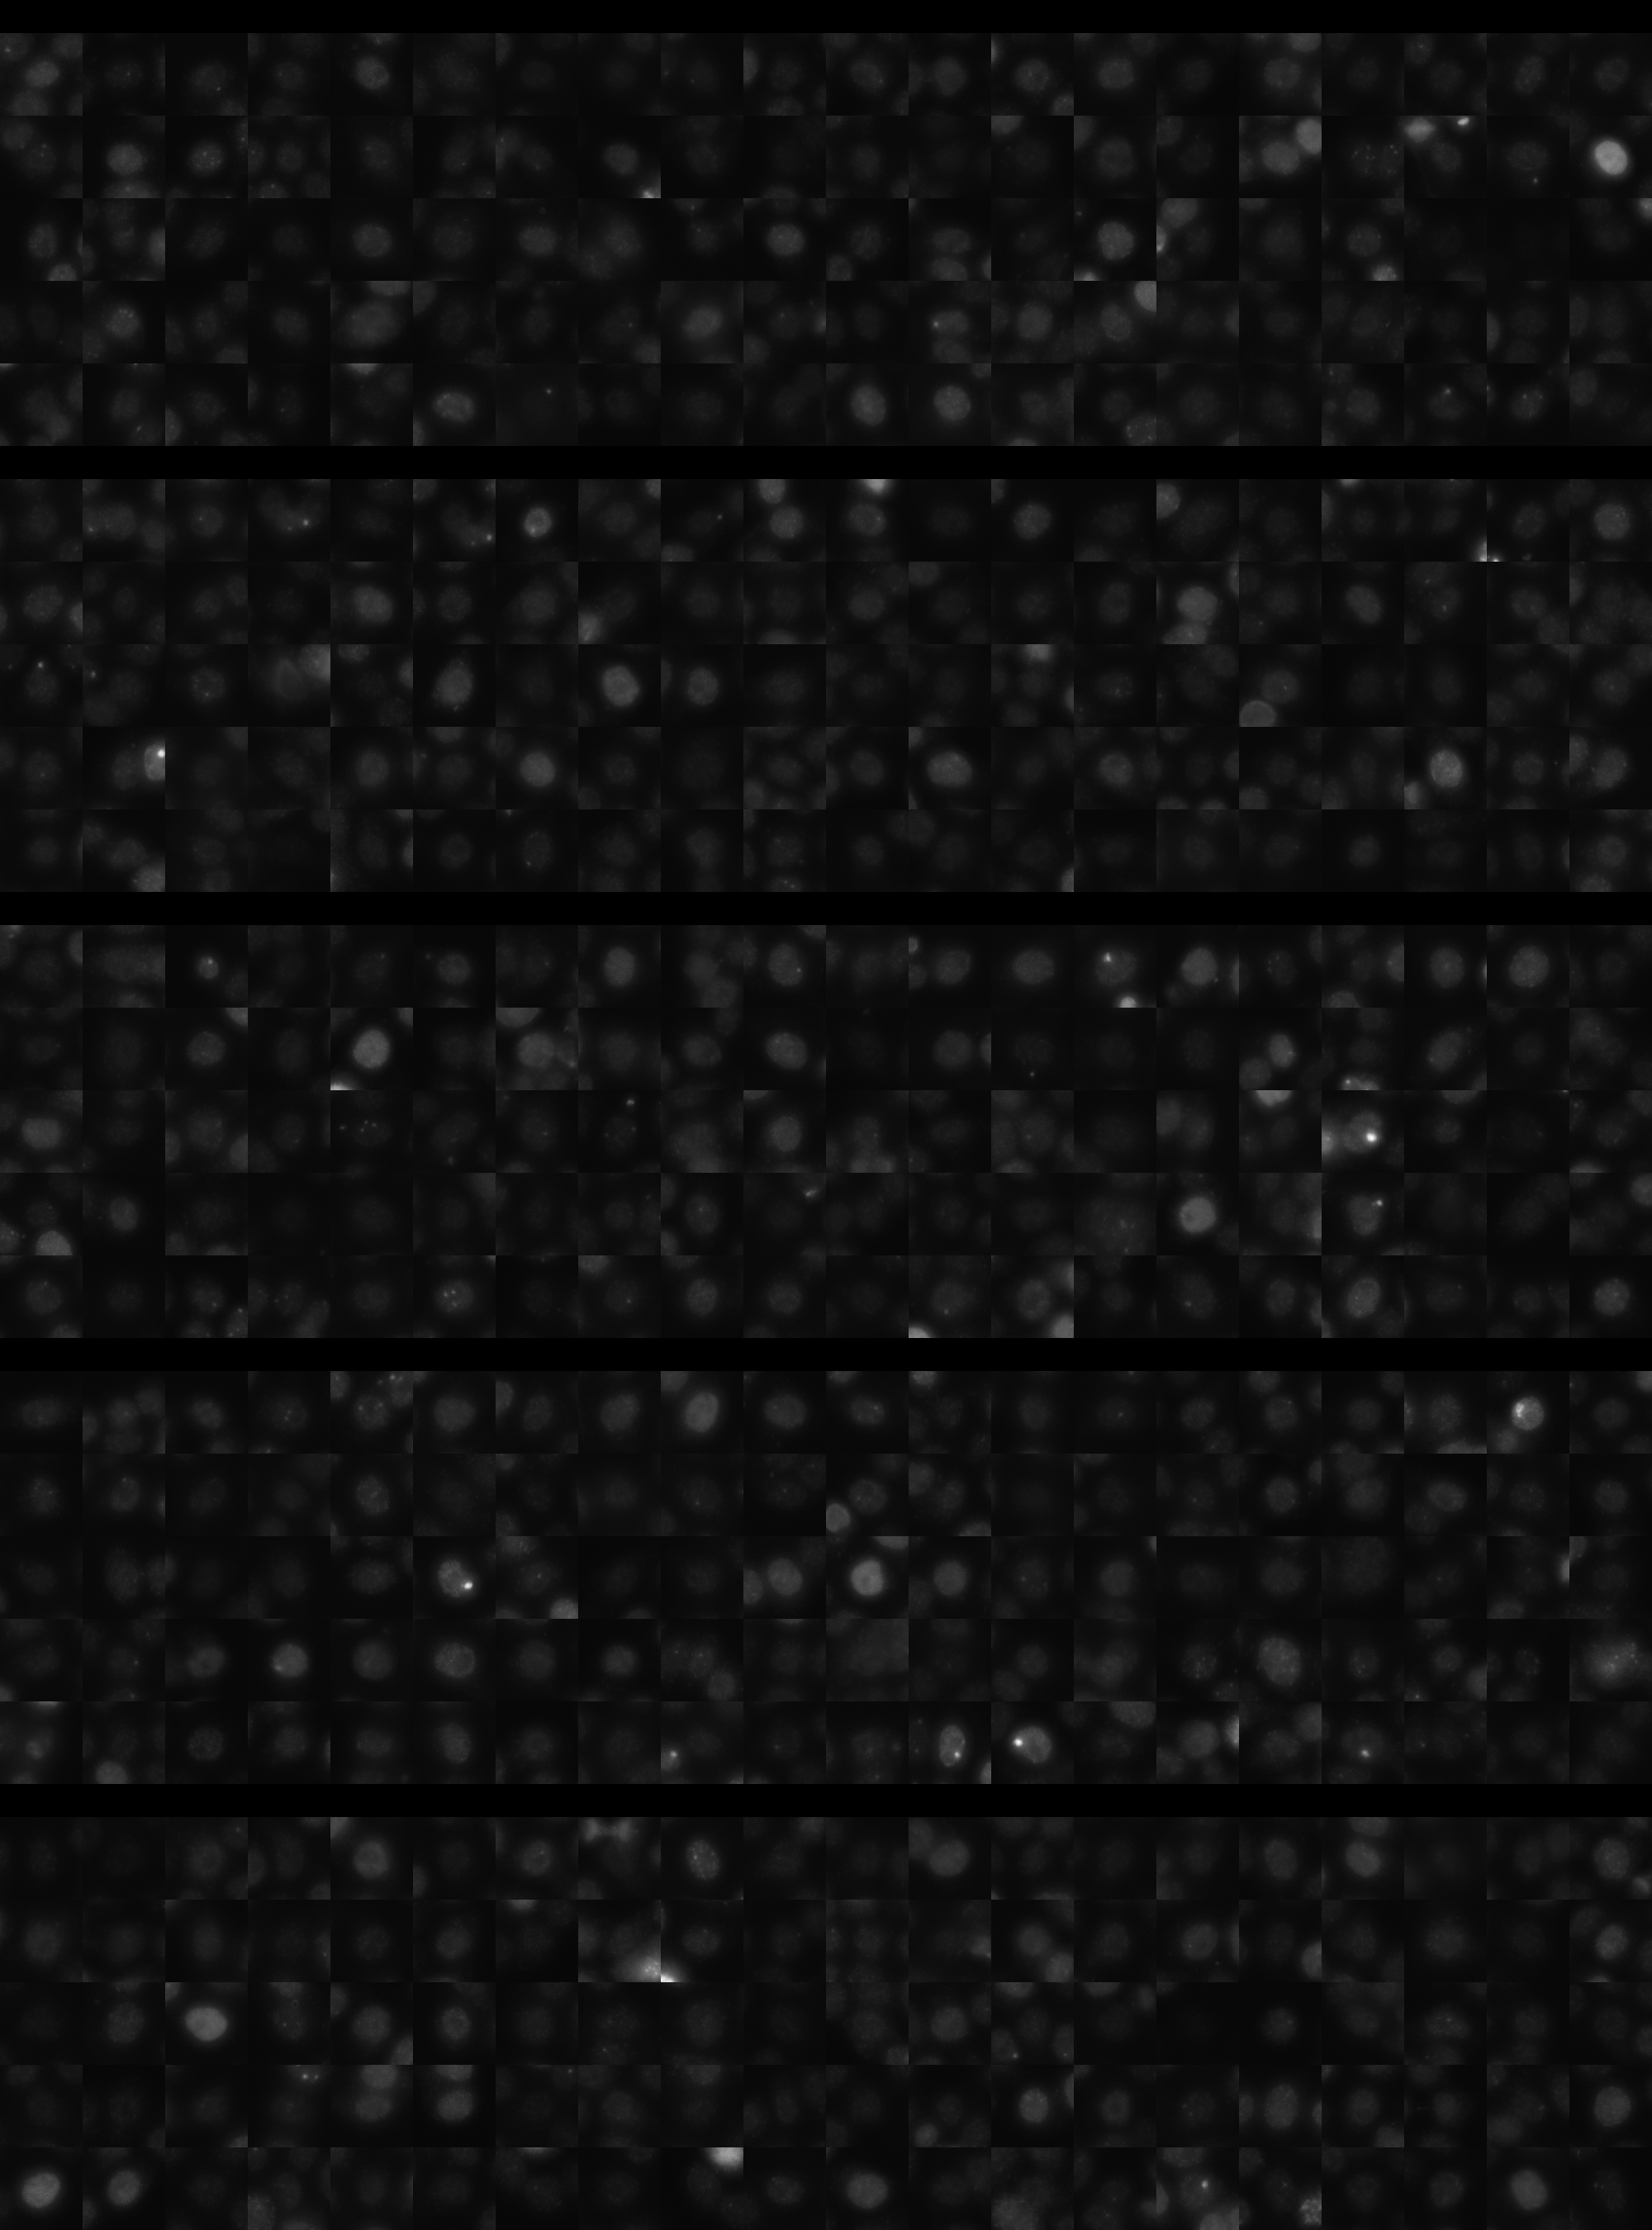
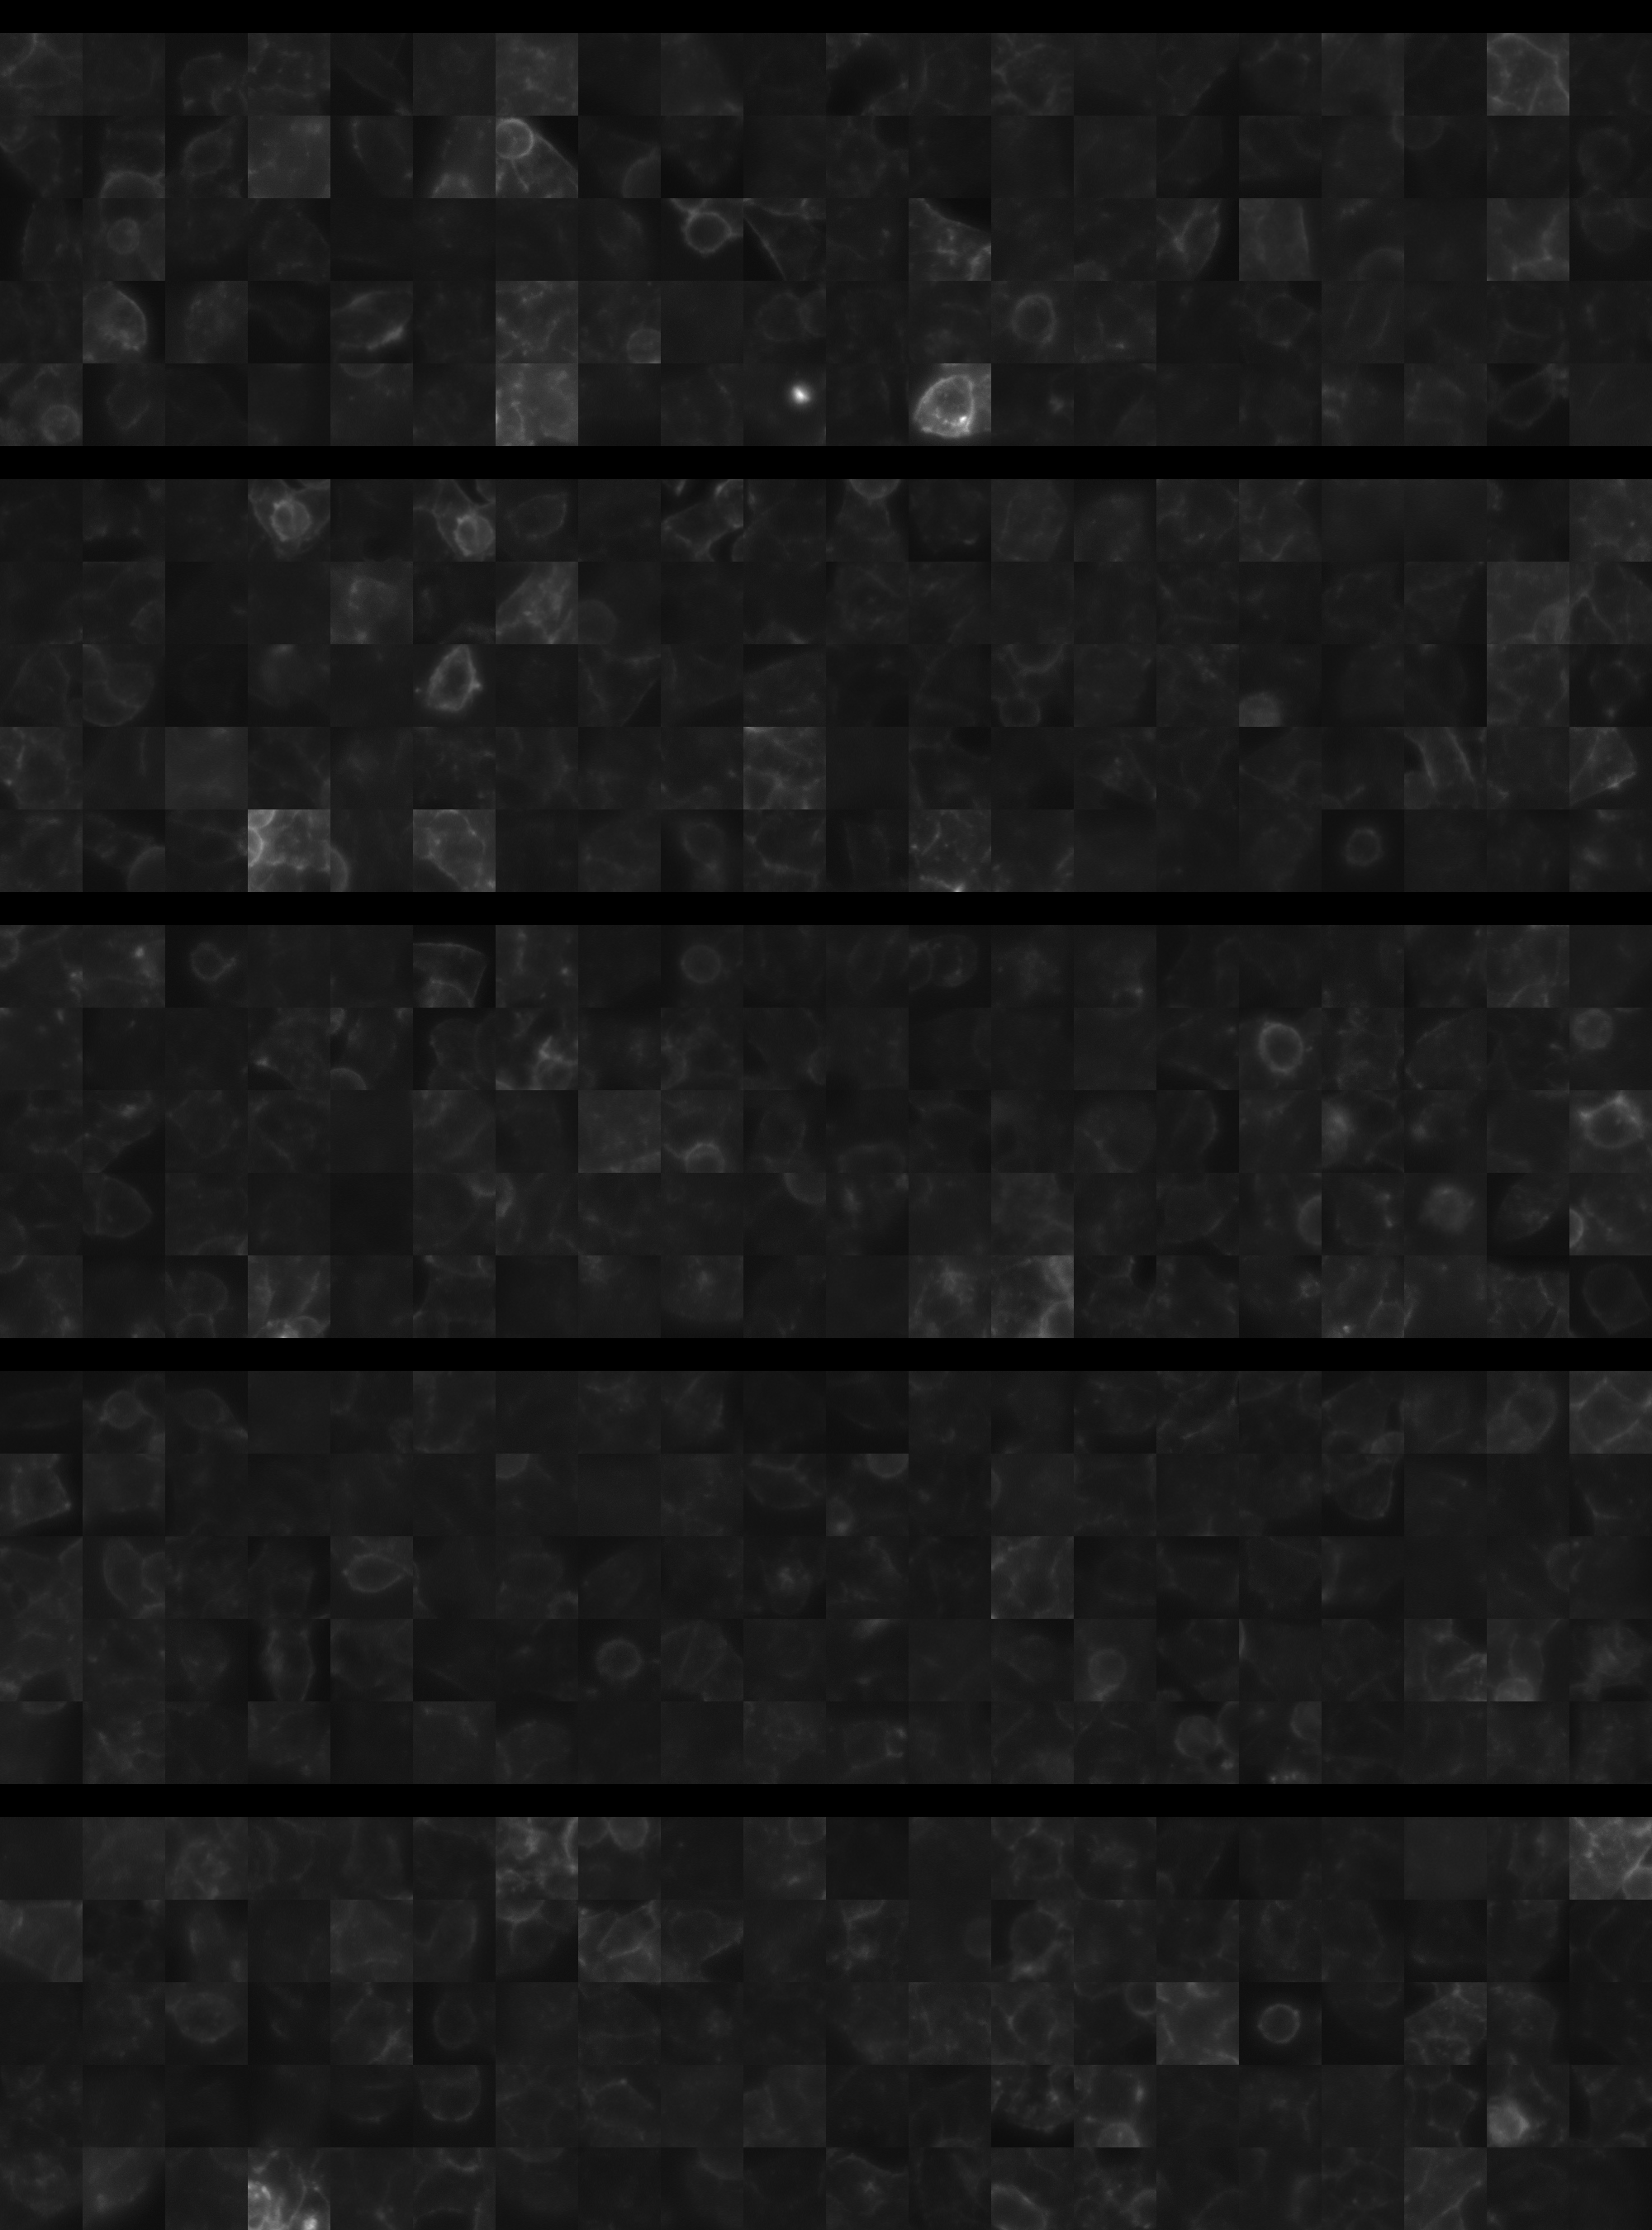
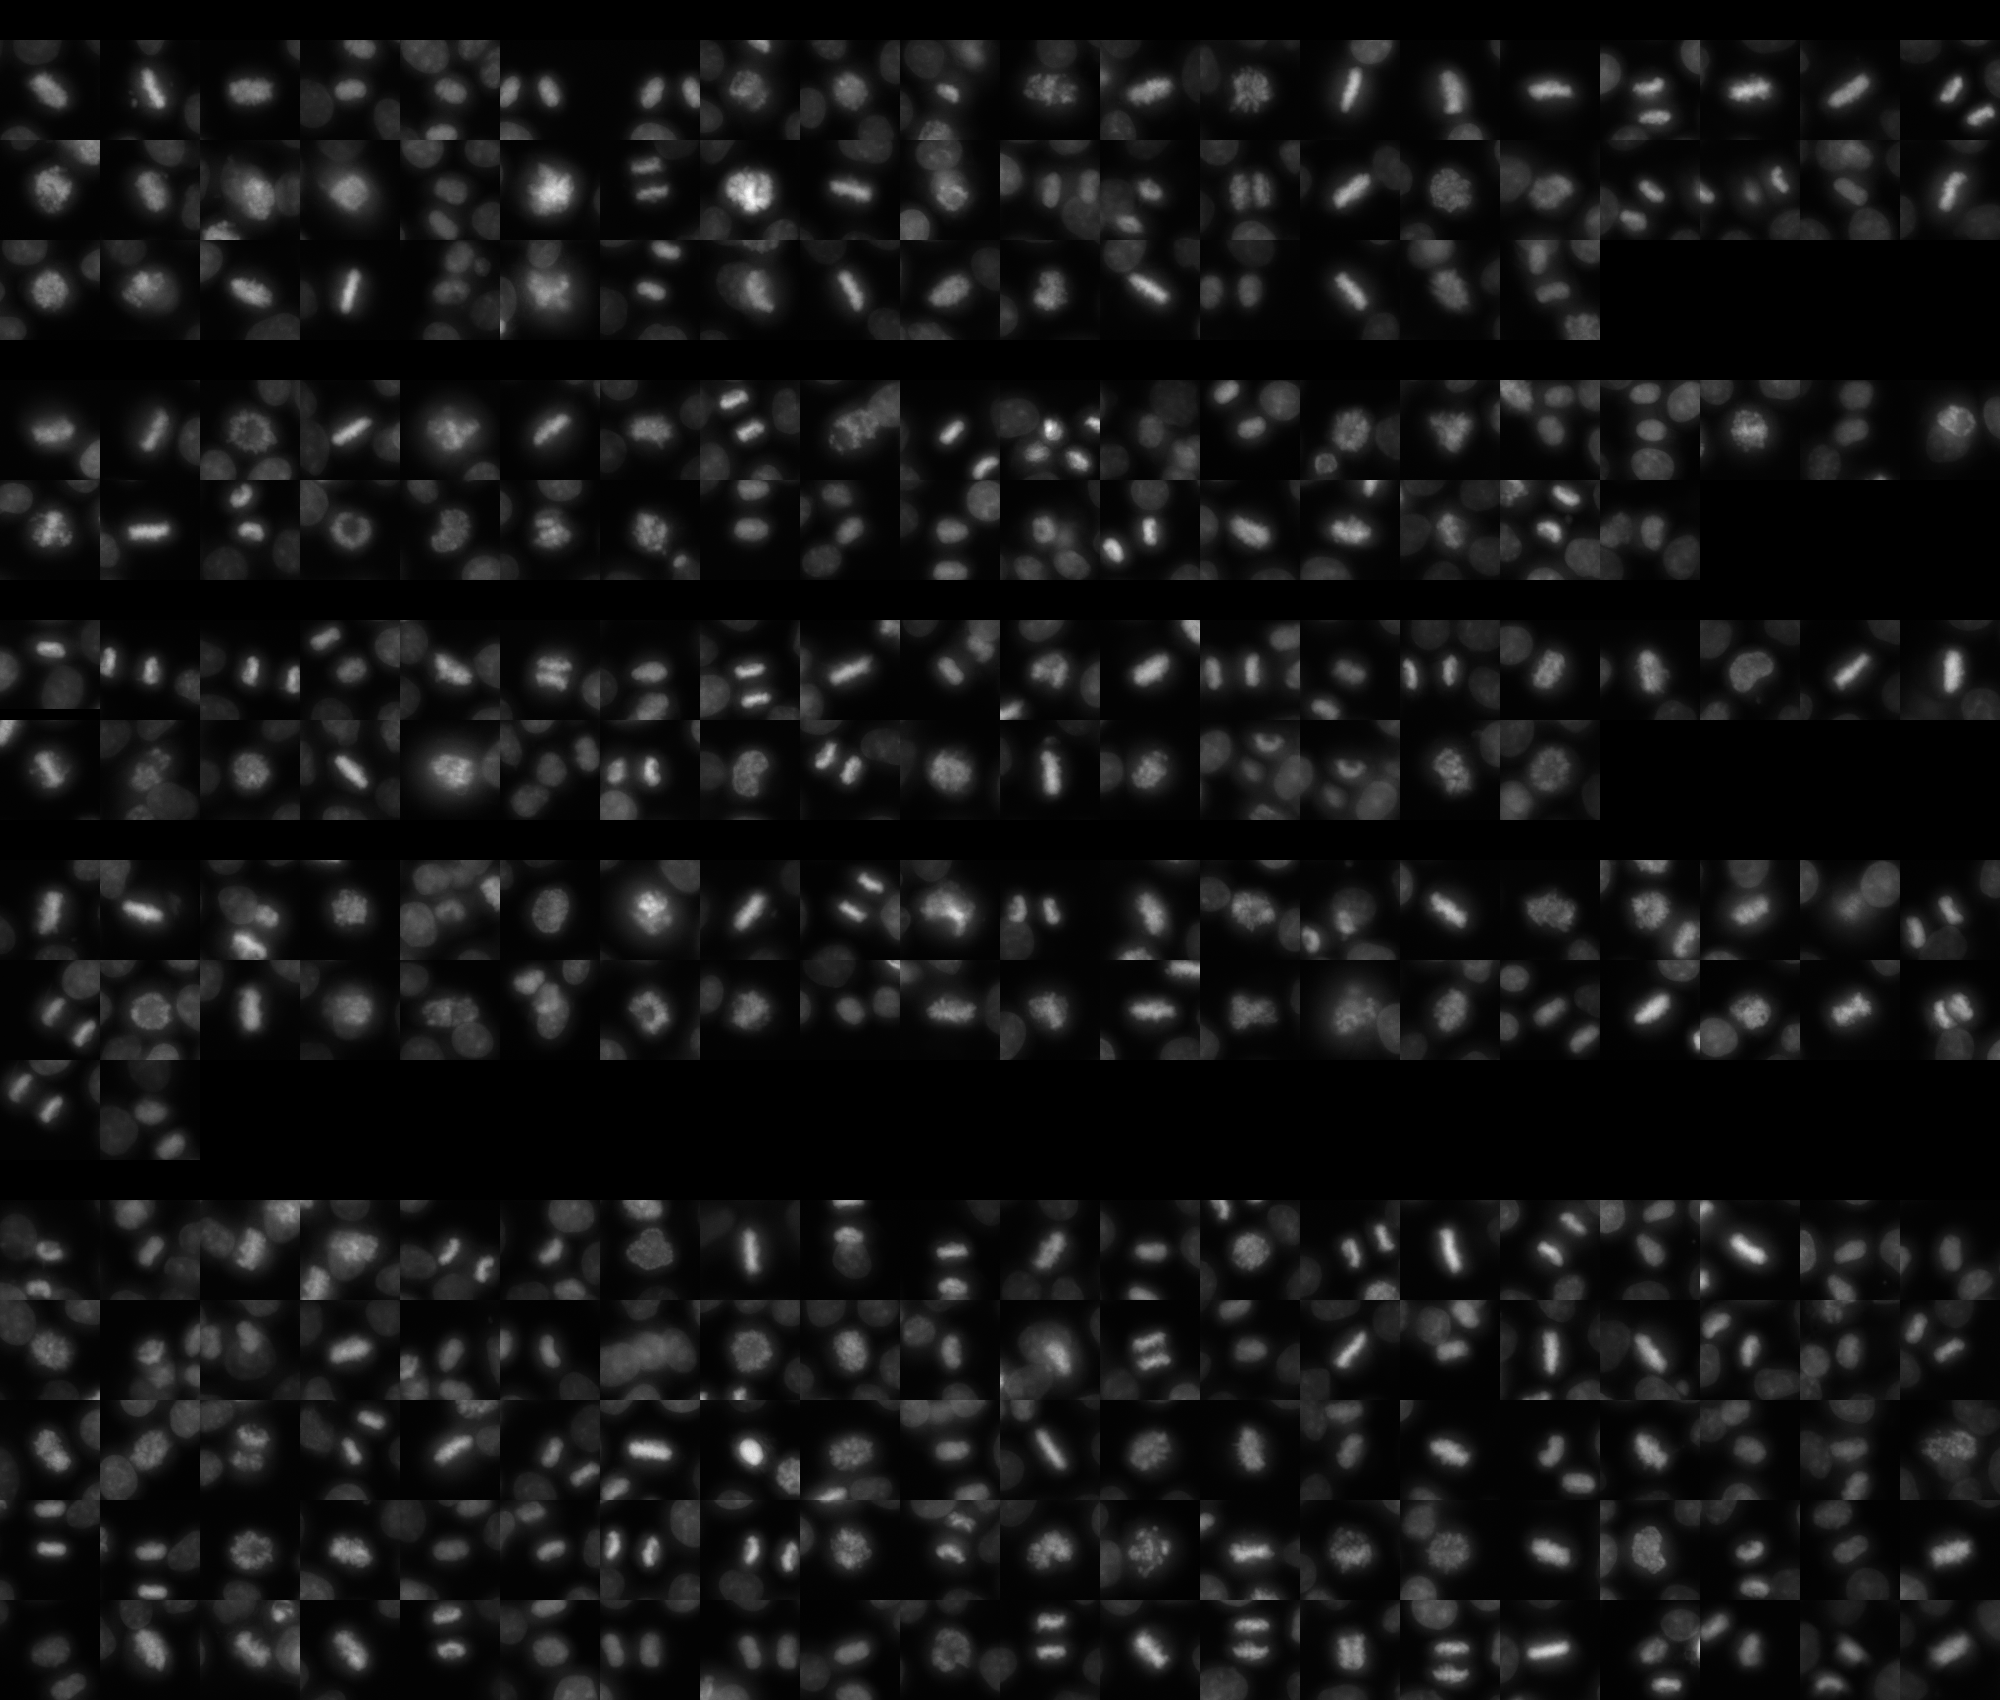
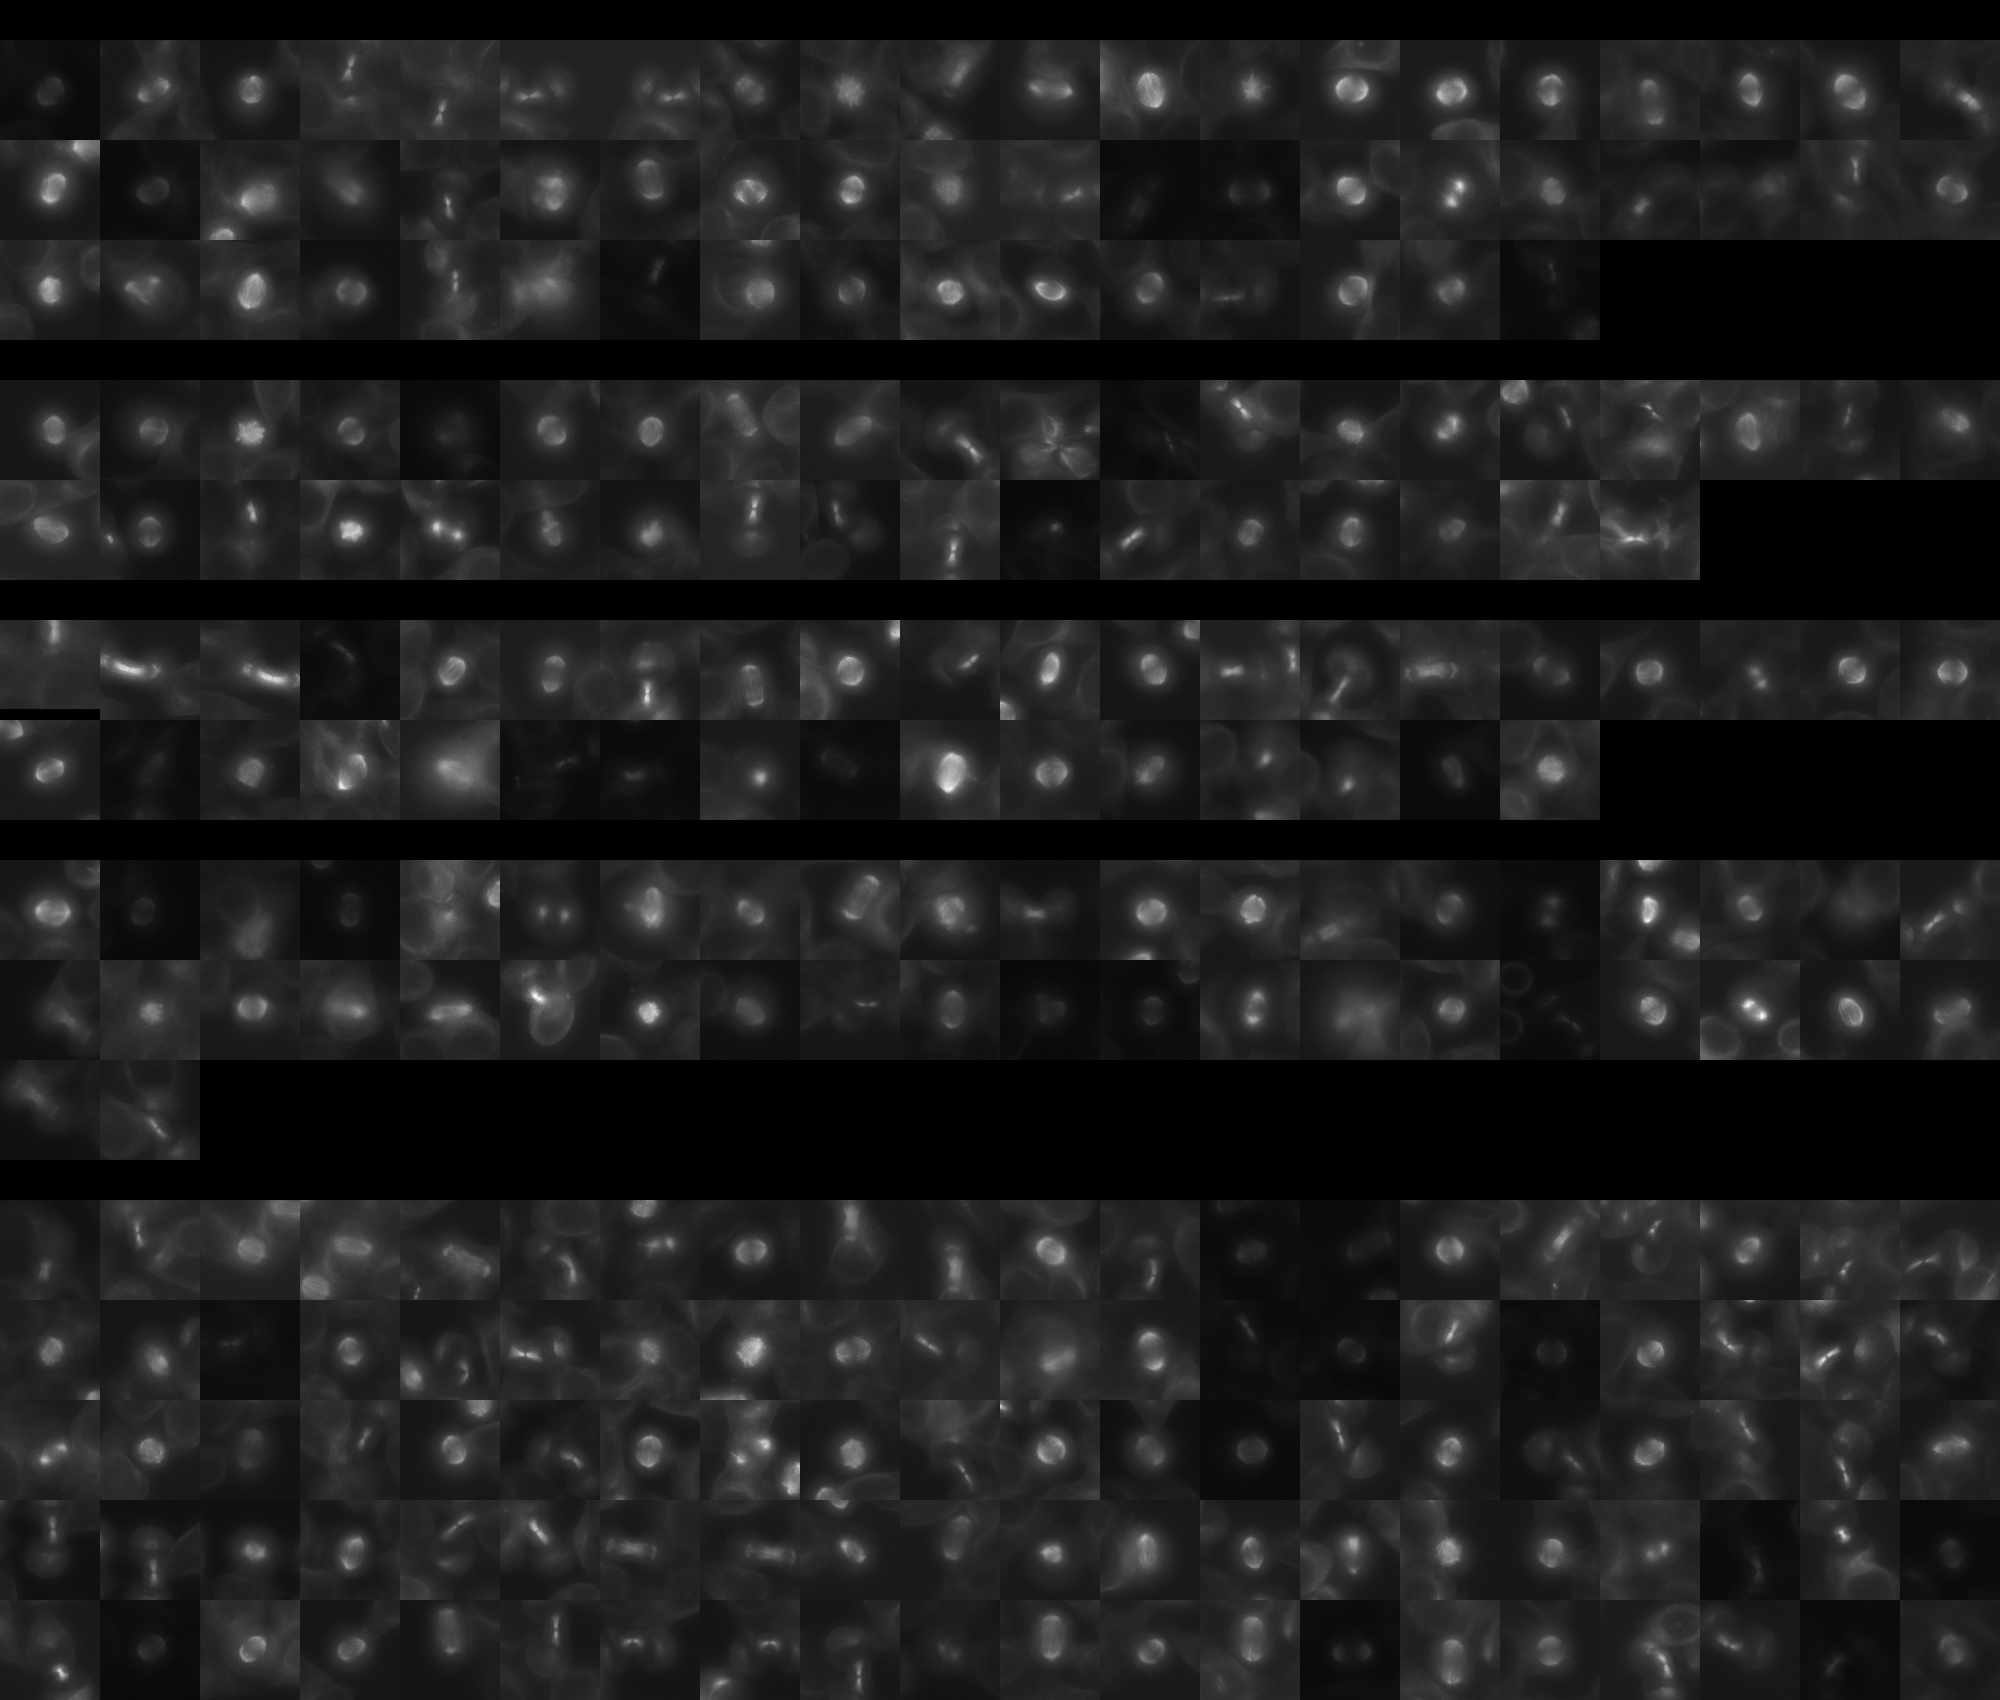
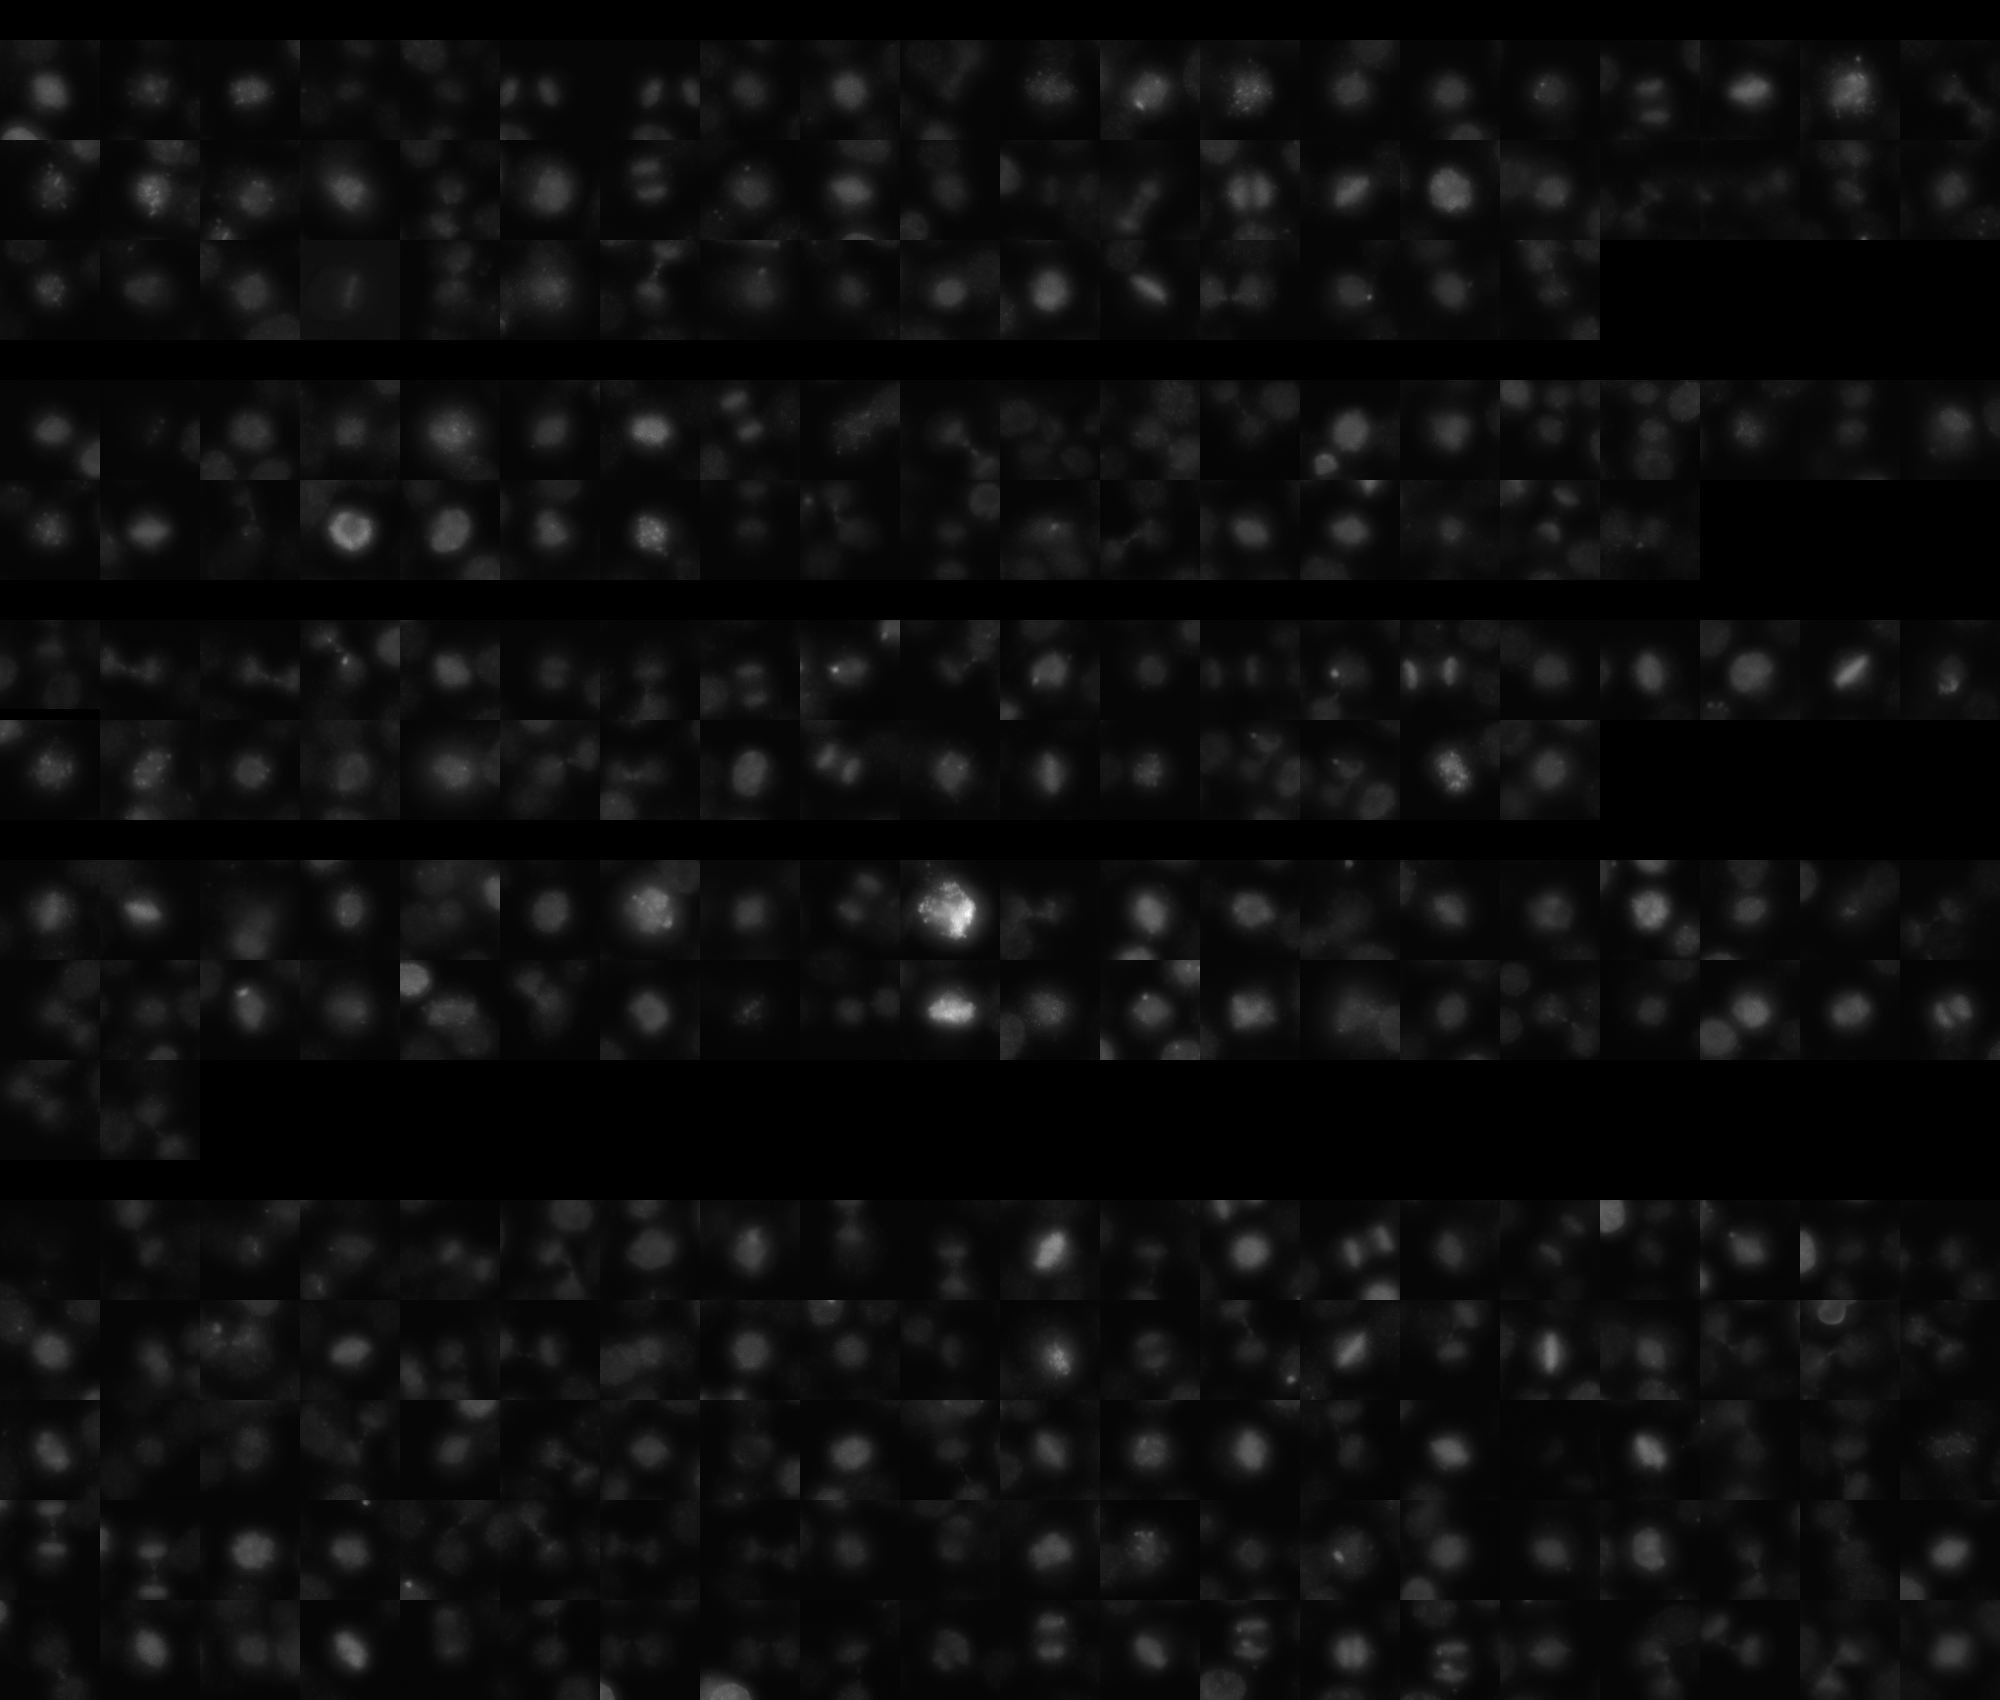
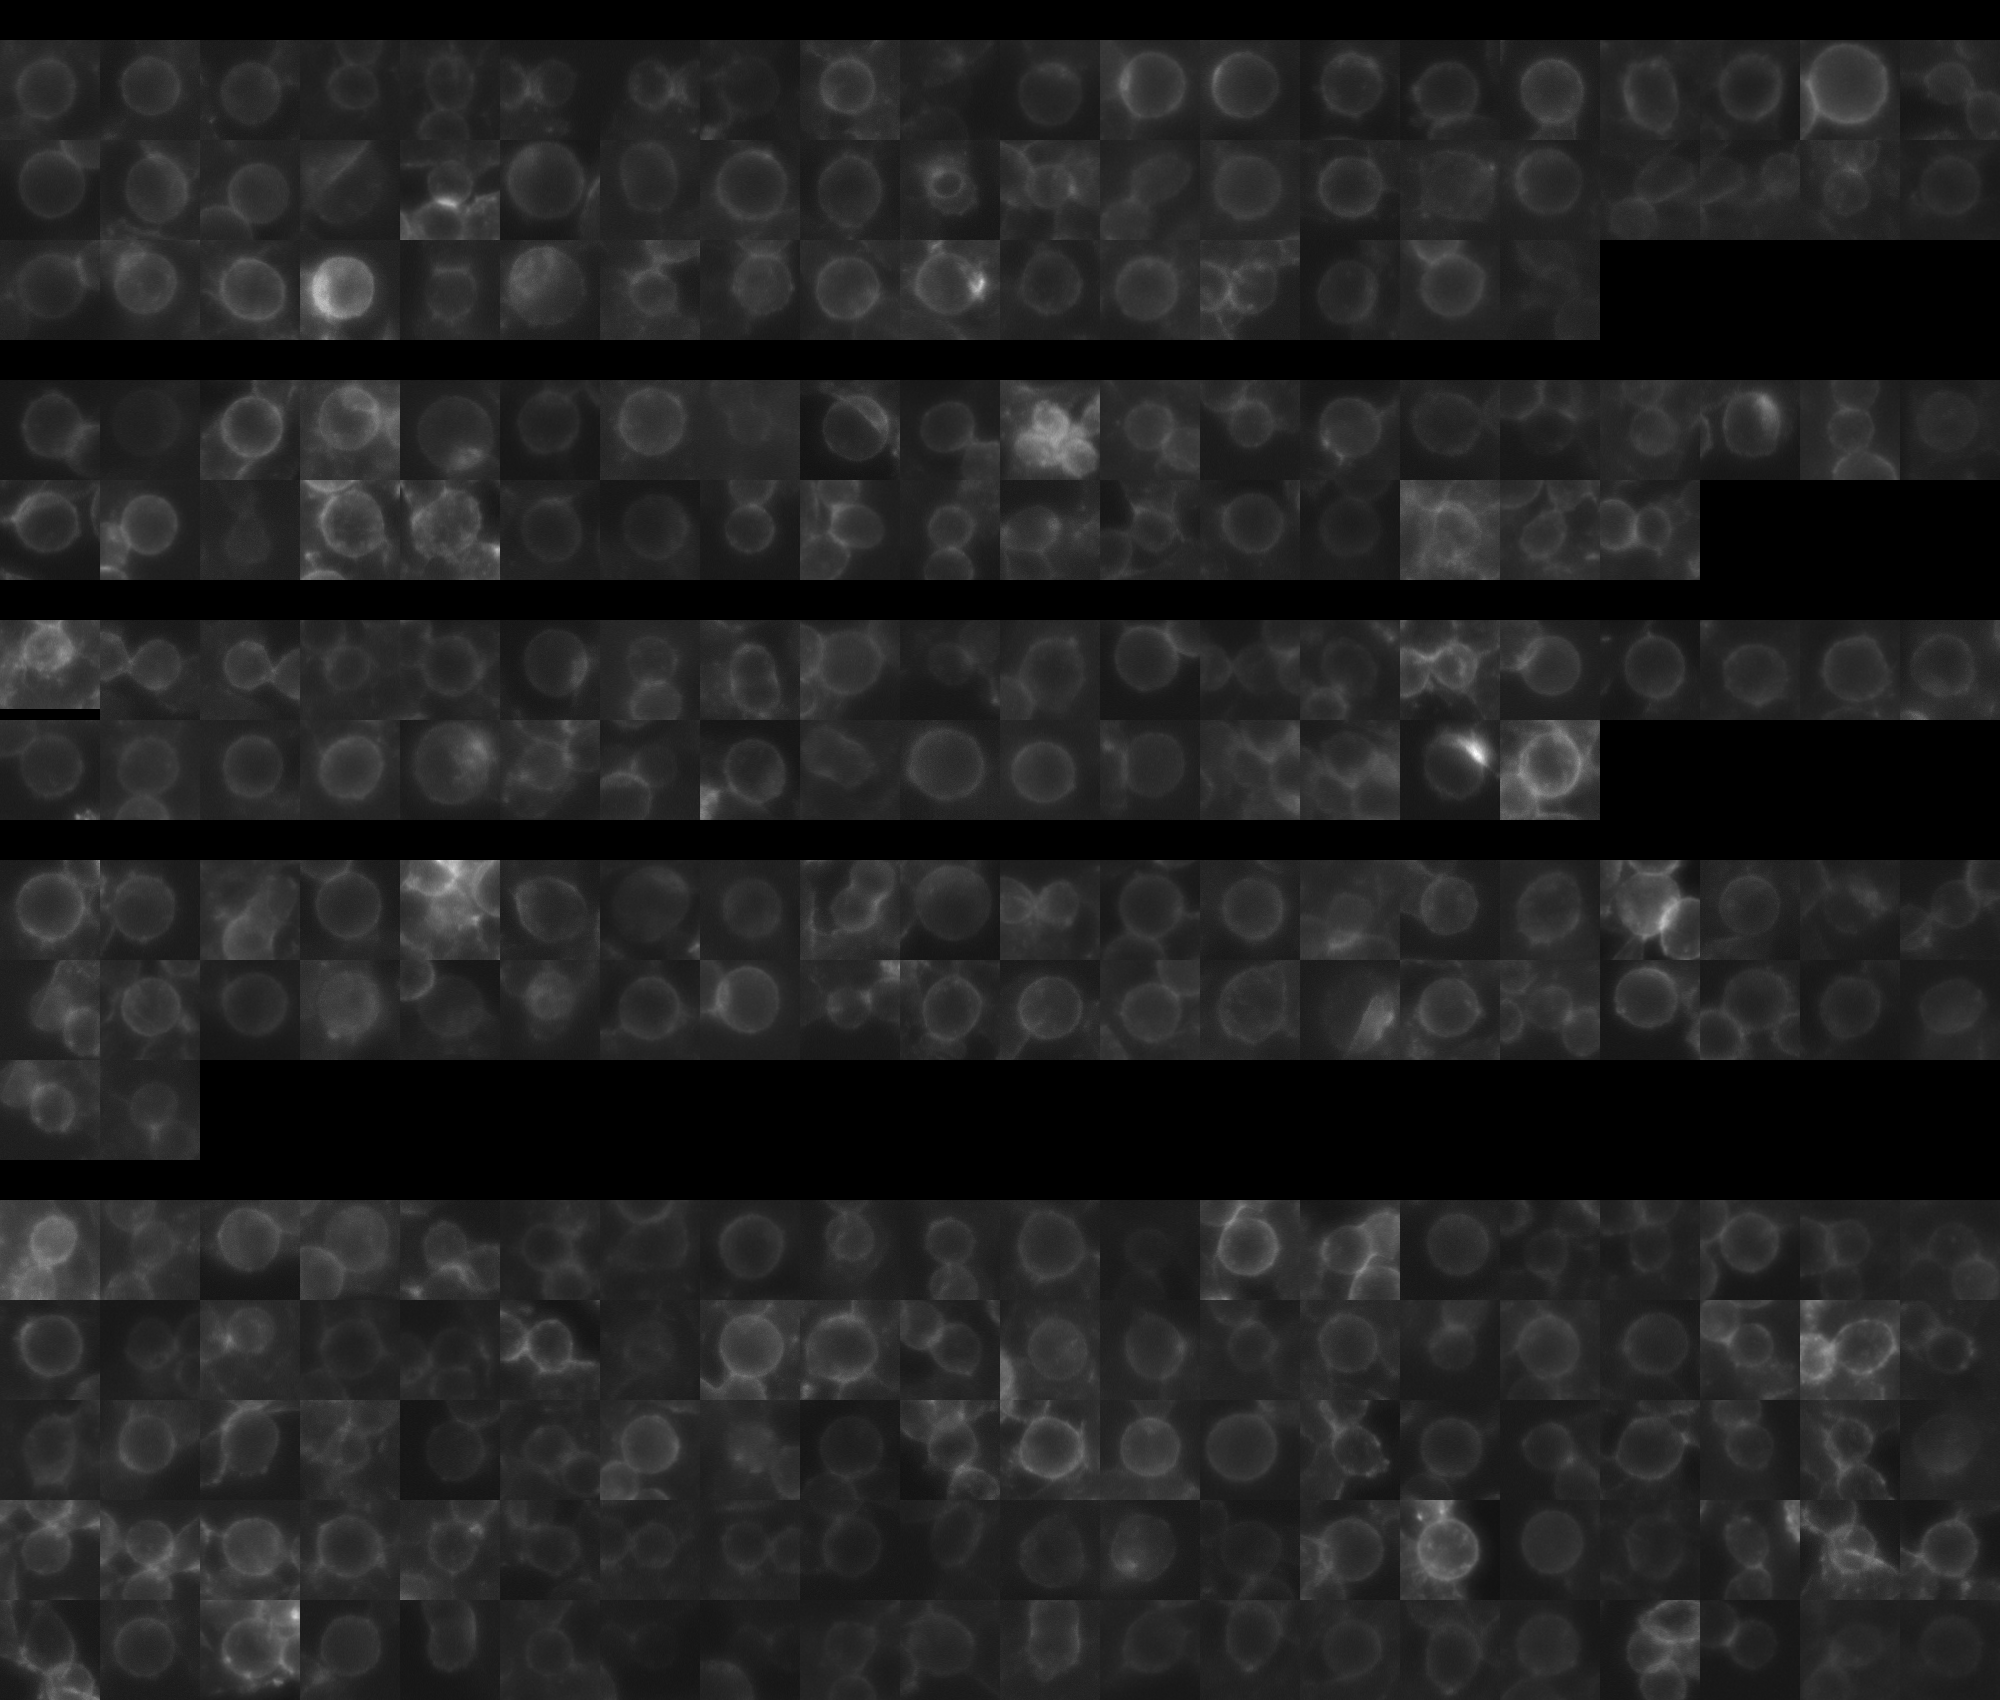
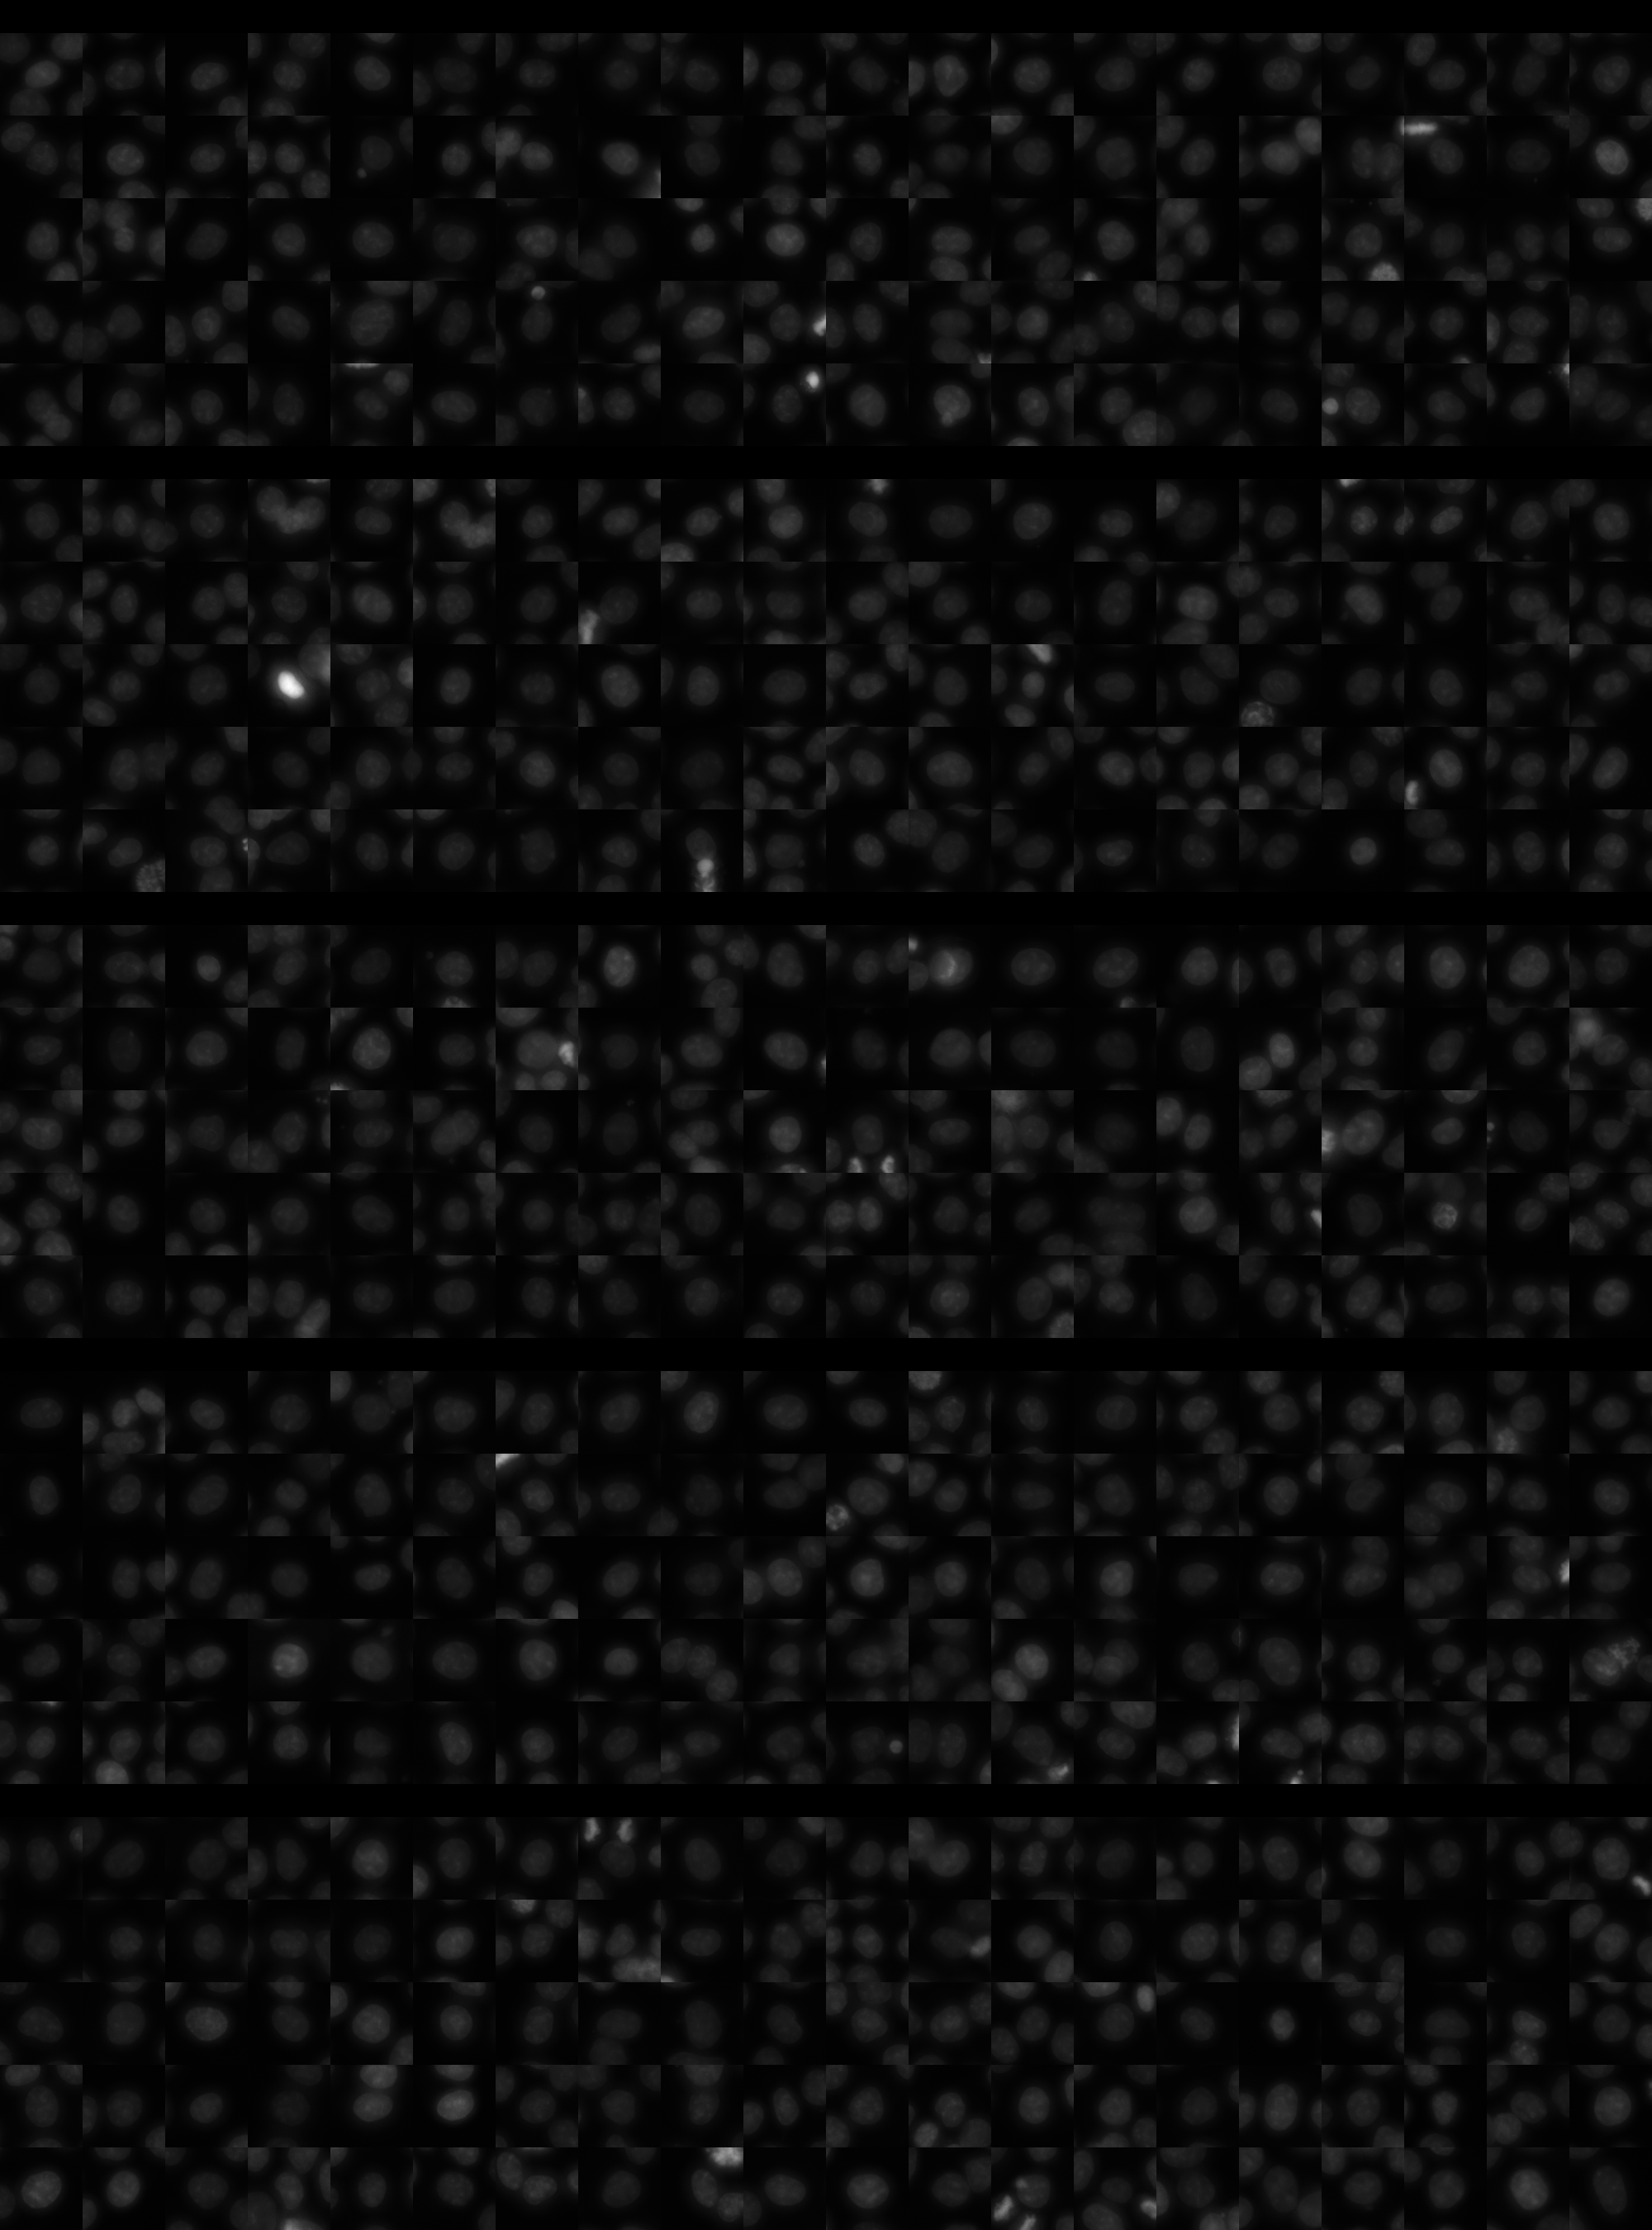
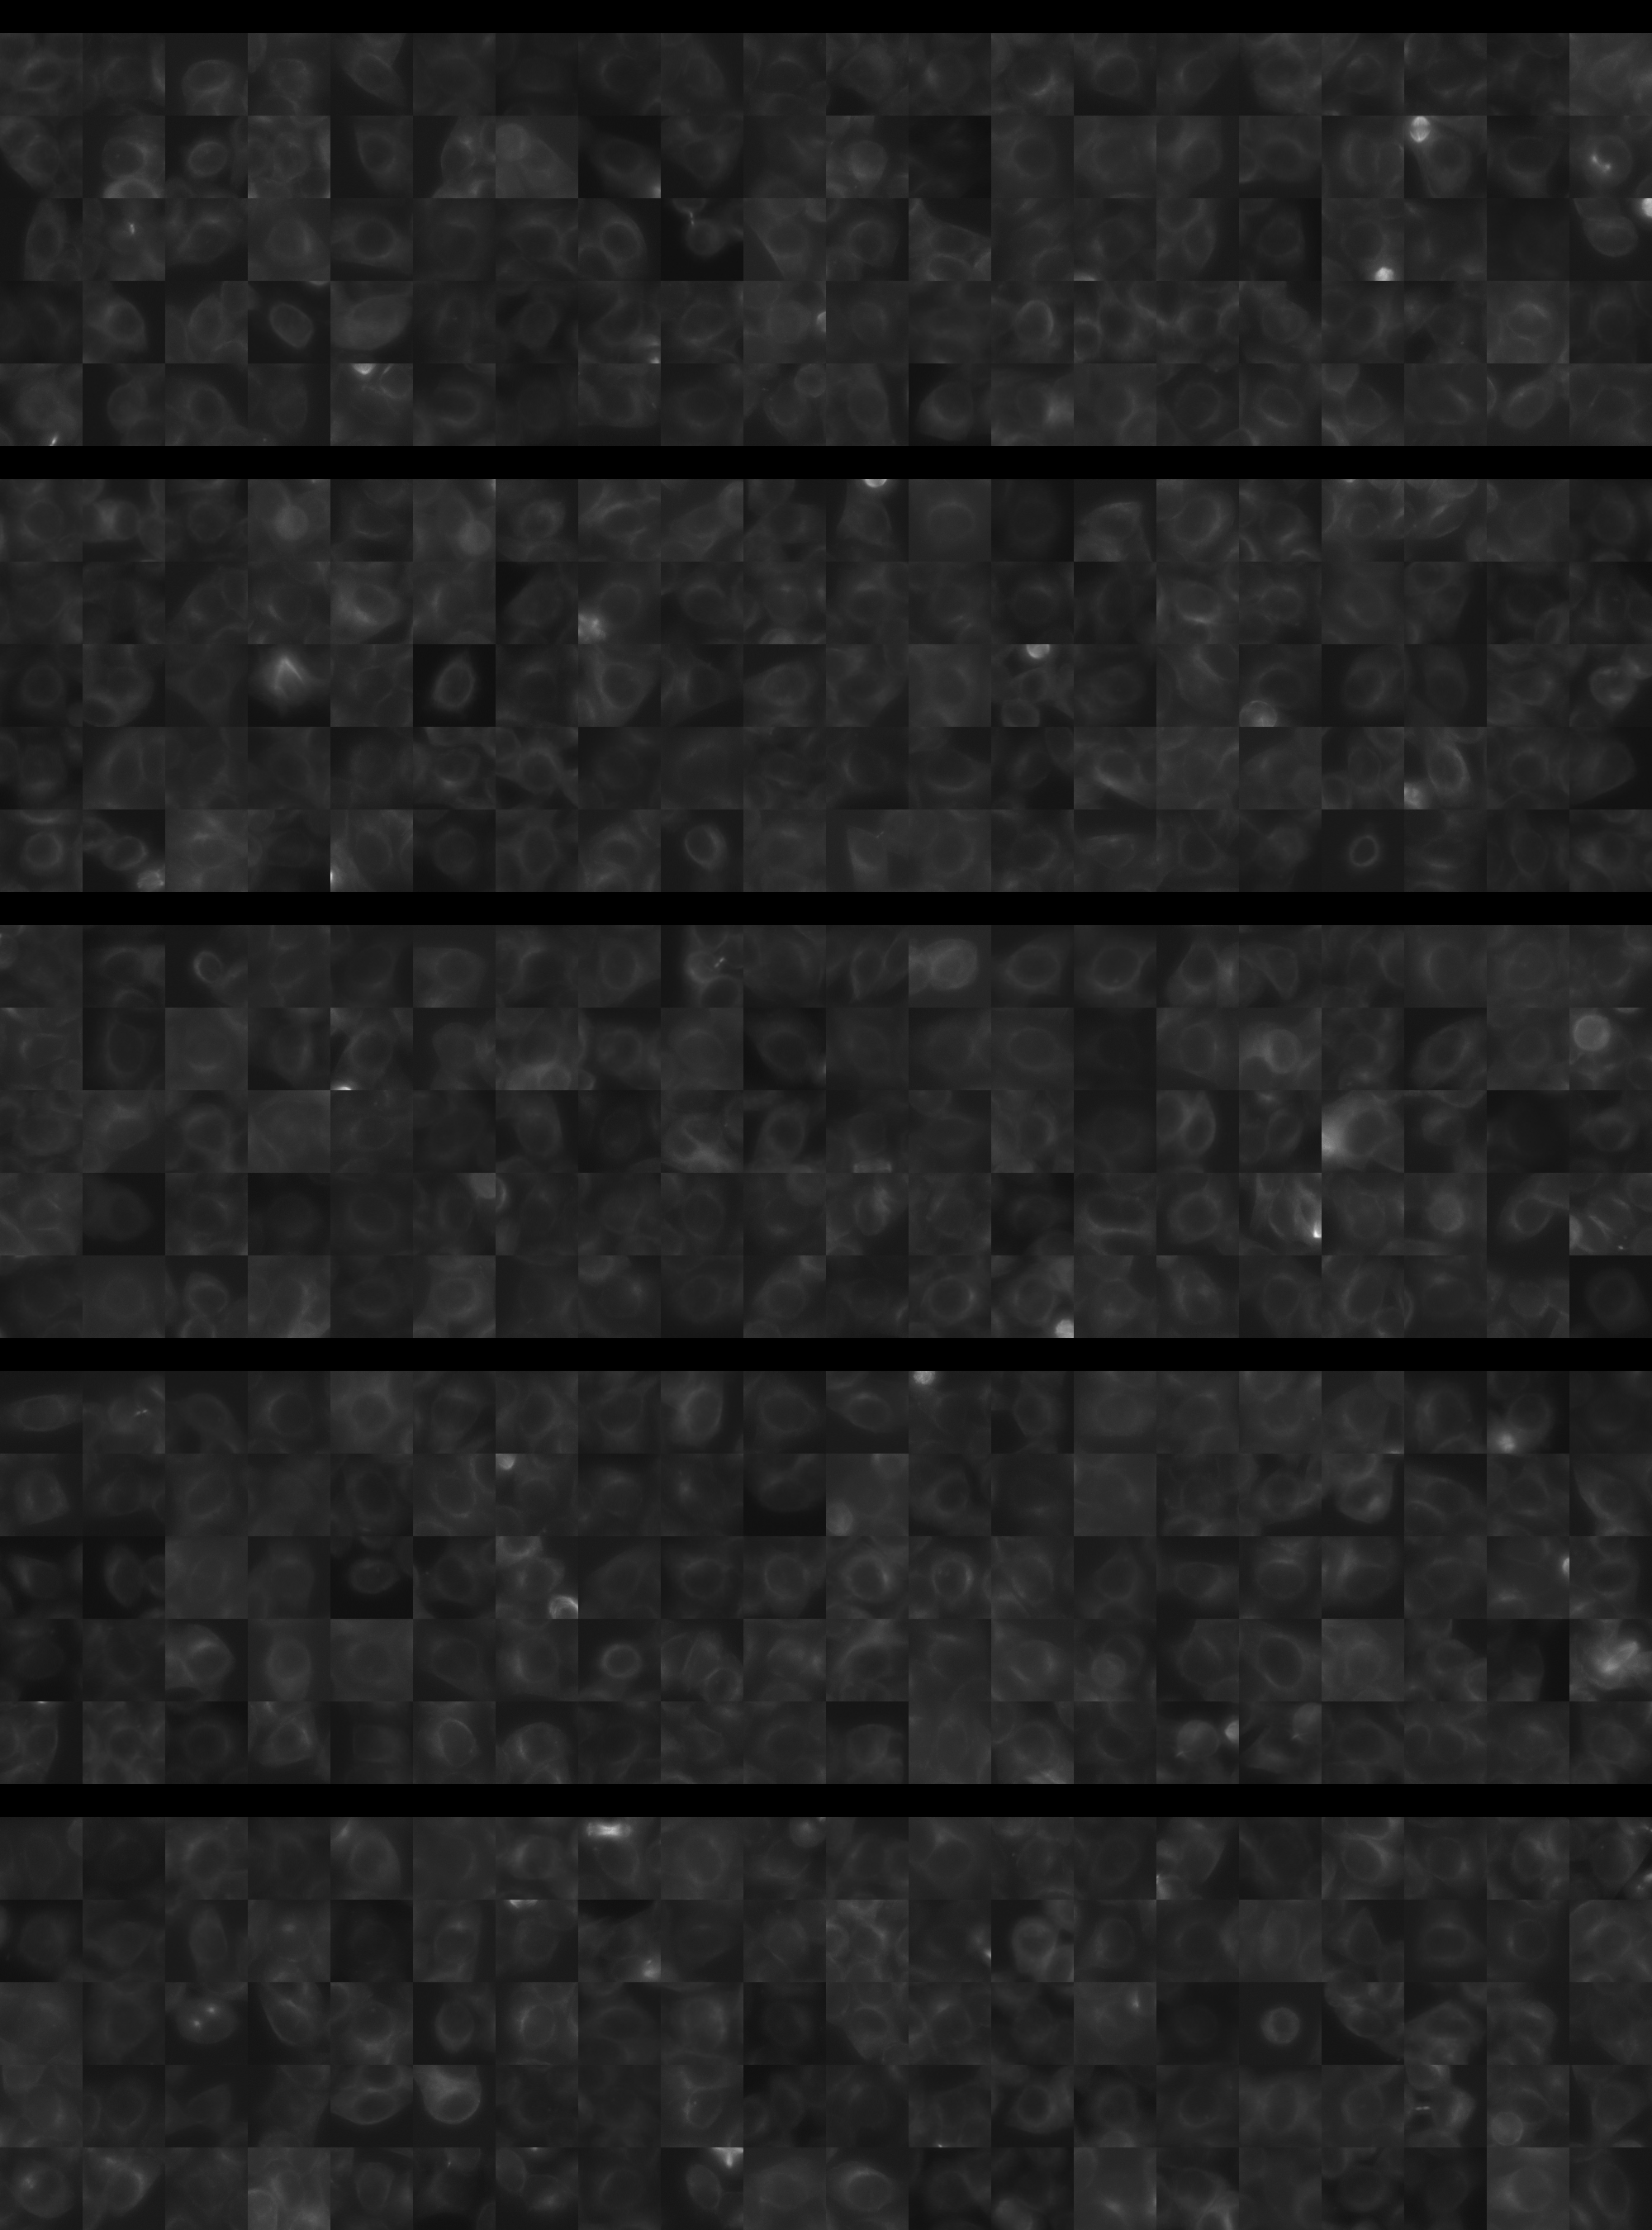
Each montage below shows randomly selected individual cell images for the same target gene separated by sgRNA, along with an example montage of cells expressing a non-targeting negative control sgRNA at the bottom. sgRNA labels in the montages correspond to the numbered sgRNA sequences in the gene info table above. The DNA (blue) and tubulin (green) channels are displayed by default, with gH2AX (grayscale) and actin (yellow) available using the check boxes. Channel brightness, contrast, and opacity are adjustable by clicking the arrow next to the channel name. When only one channel is selected, the display defaults to grayscale. Click the “Zoom” checkbox above the channel controls to enable image zooming (via scrolling) and panning (via click-and-drag).

The cell boxes displayed for this gene are square, 30.36 μm per side for the interphase montage and 30.36 μm per side for the mitotic montage.
Features

Interphase Score Rank FDR q-value
Nucleus DNA Integrated 0.007 2754 of 5322 0.964
Nucleus DNA Mean 0.085 562 of 5322 0.029
Nucleus gH2AX Mean 0.116 1577 of 5322 0.005
Nucleus DNA - gH2AX Correlation 0.061 300 of 5322 0.069
Nucleus Shape Area -7.183e-02 4679 of 5322 0.073
Nucleus Shape Eccentricity -1.223e-01 5167 of 5322 4.529e-04
Nucleus Shape Form Factor -2.437e-02 1476 of 5322 0.600
Nucleus Shape Solidity -4.192e-02 2334 of 5322 0.228
Cell DNA Mass Displacement 0.058 828 of 5322 0.244
Cell Tubulin Mean -2.815e-02 3783 of 5322 0.619
Cell Tubulin Mass Displacement 0.005 2693 of 5322 0.950
Cell Actin Mean -8.079e-02 4775 of 5322 0.070
Cell Tubulin - Actin Correlation 0.015 2930 of 5322 0.775
Cell DNA - Tubulin Correlation -1.885e-01 5289 of 5322 1.948e-04
Cell Shape Area 0.051 1490 of 5322 0.463
Cell Shape Eccentricity 0.034 1211 of 5322 0.600
Mitotic Score Rank FDR q-value
Nucleus DNA Integrated 0.091 2621 of 5322 0.965
Nucleus DNA Mean 0.066 1948 of 5322 1.000
Nucleus DNA Mass Displacement 0.057 2588 of 5322 0.999
Nucleus DNA Mean Frac 3 0.100 1583 of 5322 1.000
Nucleus gH2AX Mean 0.259 474 of 5322 1.000
Nucleus gH2AX Mean Frac 0 0.016 2029 of 5322 1.000
Nucleus Tubulin Mean Frac 0 0.315 294 of 5322 0.904
Nucleus Tubulin Mean Edge 0.108 1750 of 5322 0.999
Nucleus Tubulin Std Edge -1.314e-01 4181 of 5322 0.999
Nucleus Shape Area 0.393 468 of 5322 0.274
Nucleus Shape Eccentricity -3.101e-01 4988 of 5322 1.000
Nucleus Shape Form Factor 0.083 510 of 5322 0.998
Cell Tubulin Mean 0.238 720 of 5322 0.944
Cell Tubulin Mean Frac 3 -1.983e-01 4054 of 5322 0.999
Cell Actin Mean 0.094 1977 of 5322 0.997
Cell Shape Area 0.274 800 of 5322 0.917
( Reset Zoom )
Brightness
Contrast
Opacity
Brightness
Contrast
Opacity
Brightness
Contrast
Opacity
Brightness
Contrast
Opacity
Brightness
Contrast
Opacity

( Reset Zoom )
Brightness
Contrast
Opacity
Brightness
Contrast
Opacity
Brightness
Contrast
Opacity
Brightness
Contrast
Opacity
Brightness
Contrast
Opacity

MIT Central Accessability