RMND5A

Gene symbol: RMND5A
Gene: 64795
Uniprot Function: Core component of the CTLH E3 ubiquitin-protein ligase complex that selectively accepts ubiquitin from UBE2H and mediates ubiquitination and subsequent proteasomal degradation of the transcription factor HBP1. MAEA and RMND5A are both required for catalytic activity of the CTLH E3 ubiquitin-protein ligase complex (PubMed:29911972). Catalytic activity of the complex is required for normal cell proliferation (PubMed:29911972). The CTLH E3 ubiquitin-protein ligase complex is not required for the degradation of enzymes involved in gluconeogenesis, such as FBP1 (PubMed:29911972).
Mitotic Index 0.0333
Interphase Cluster: #77 (27 genes)
Mitotic Cluster: #140 (20 genes)
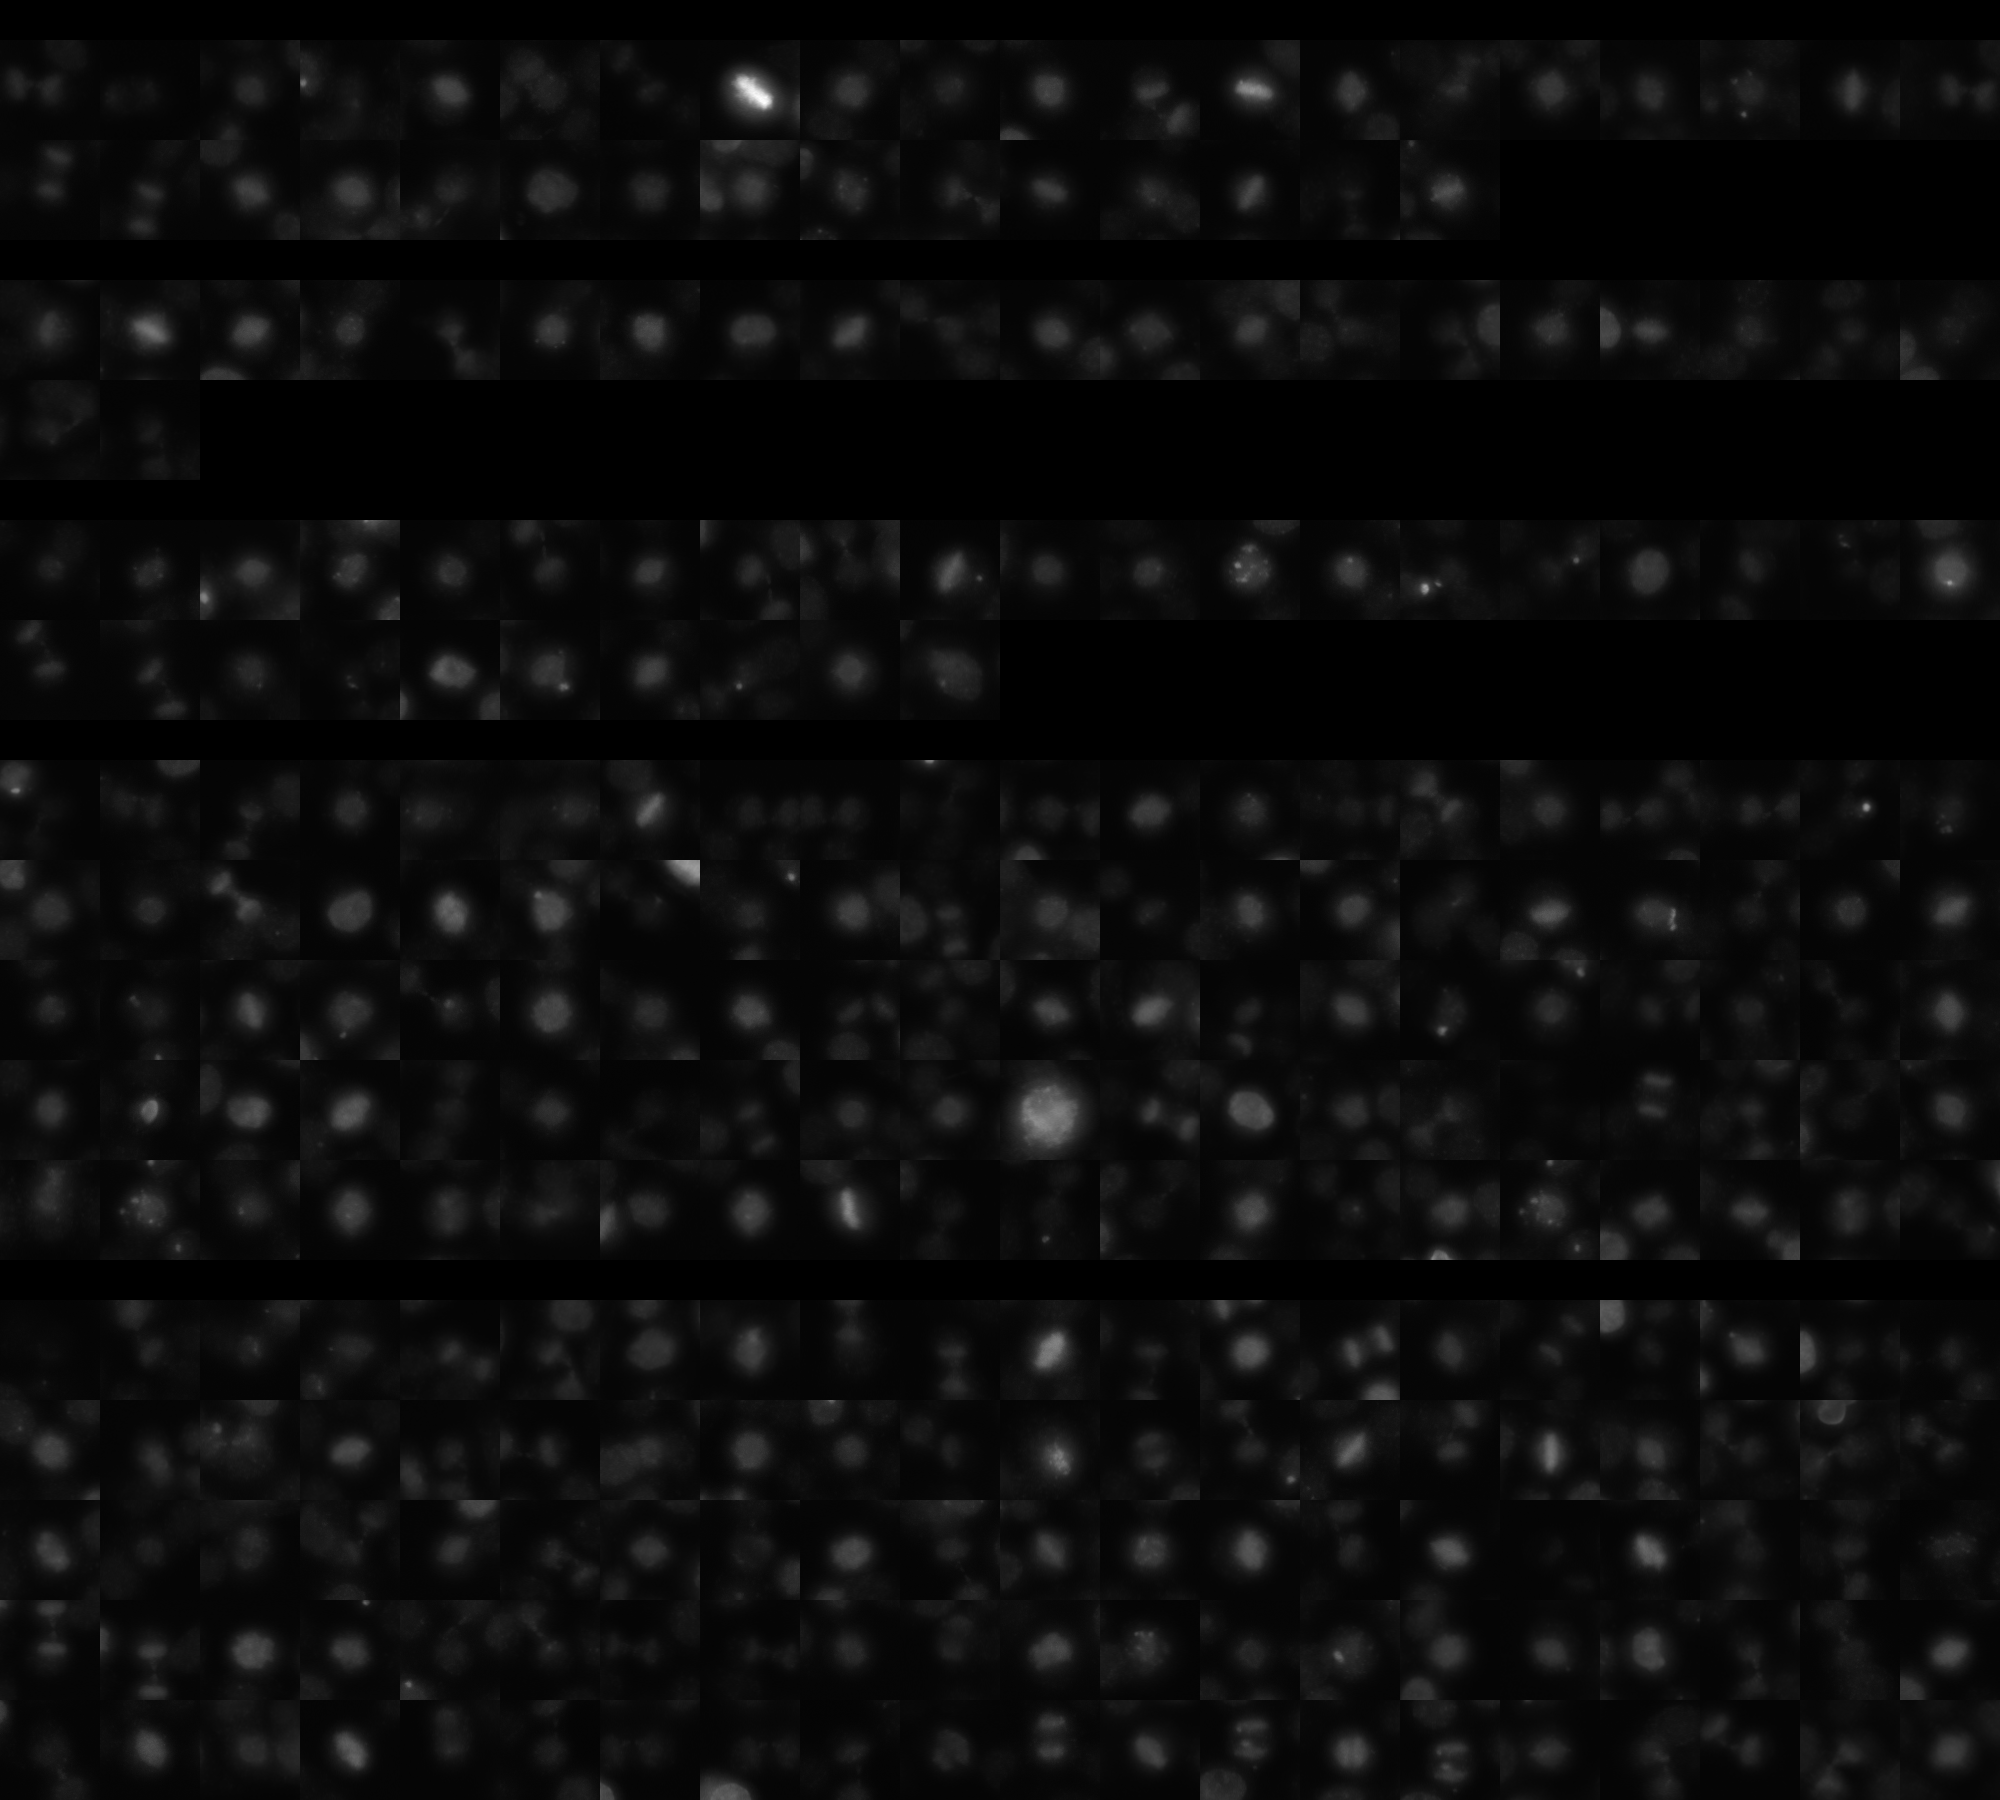
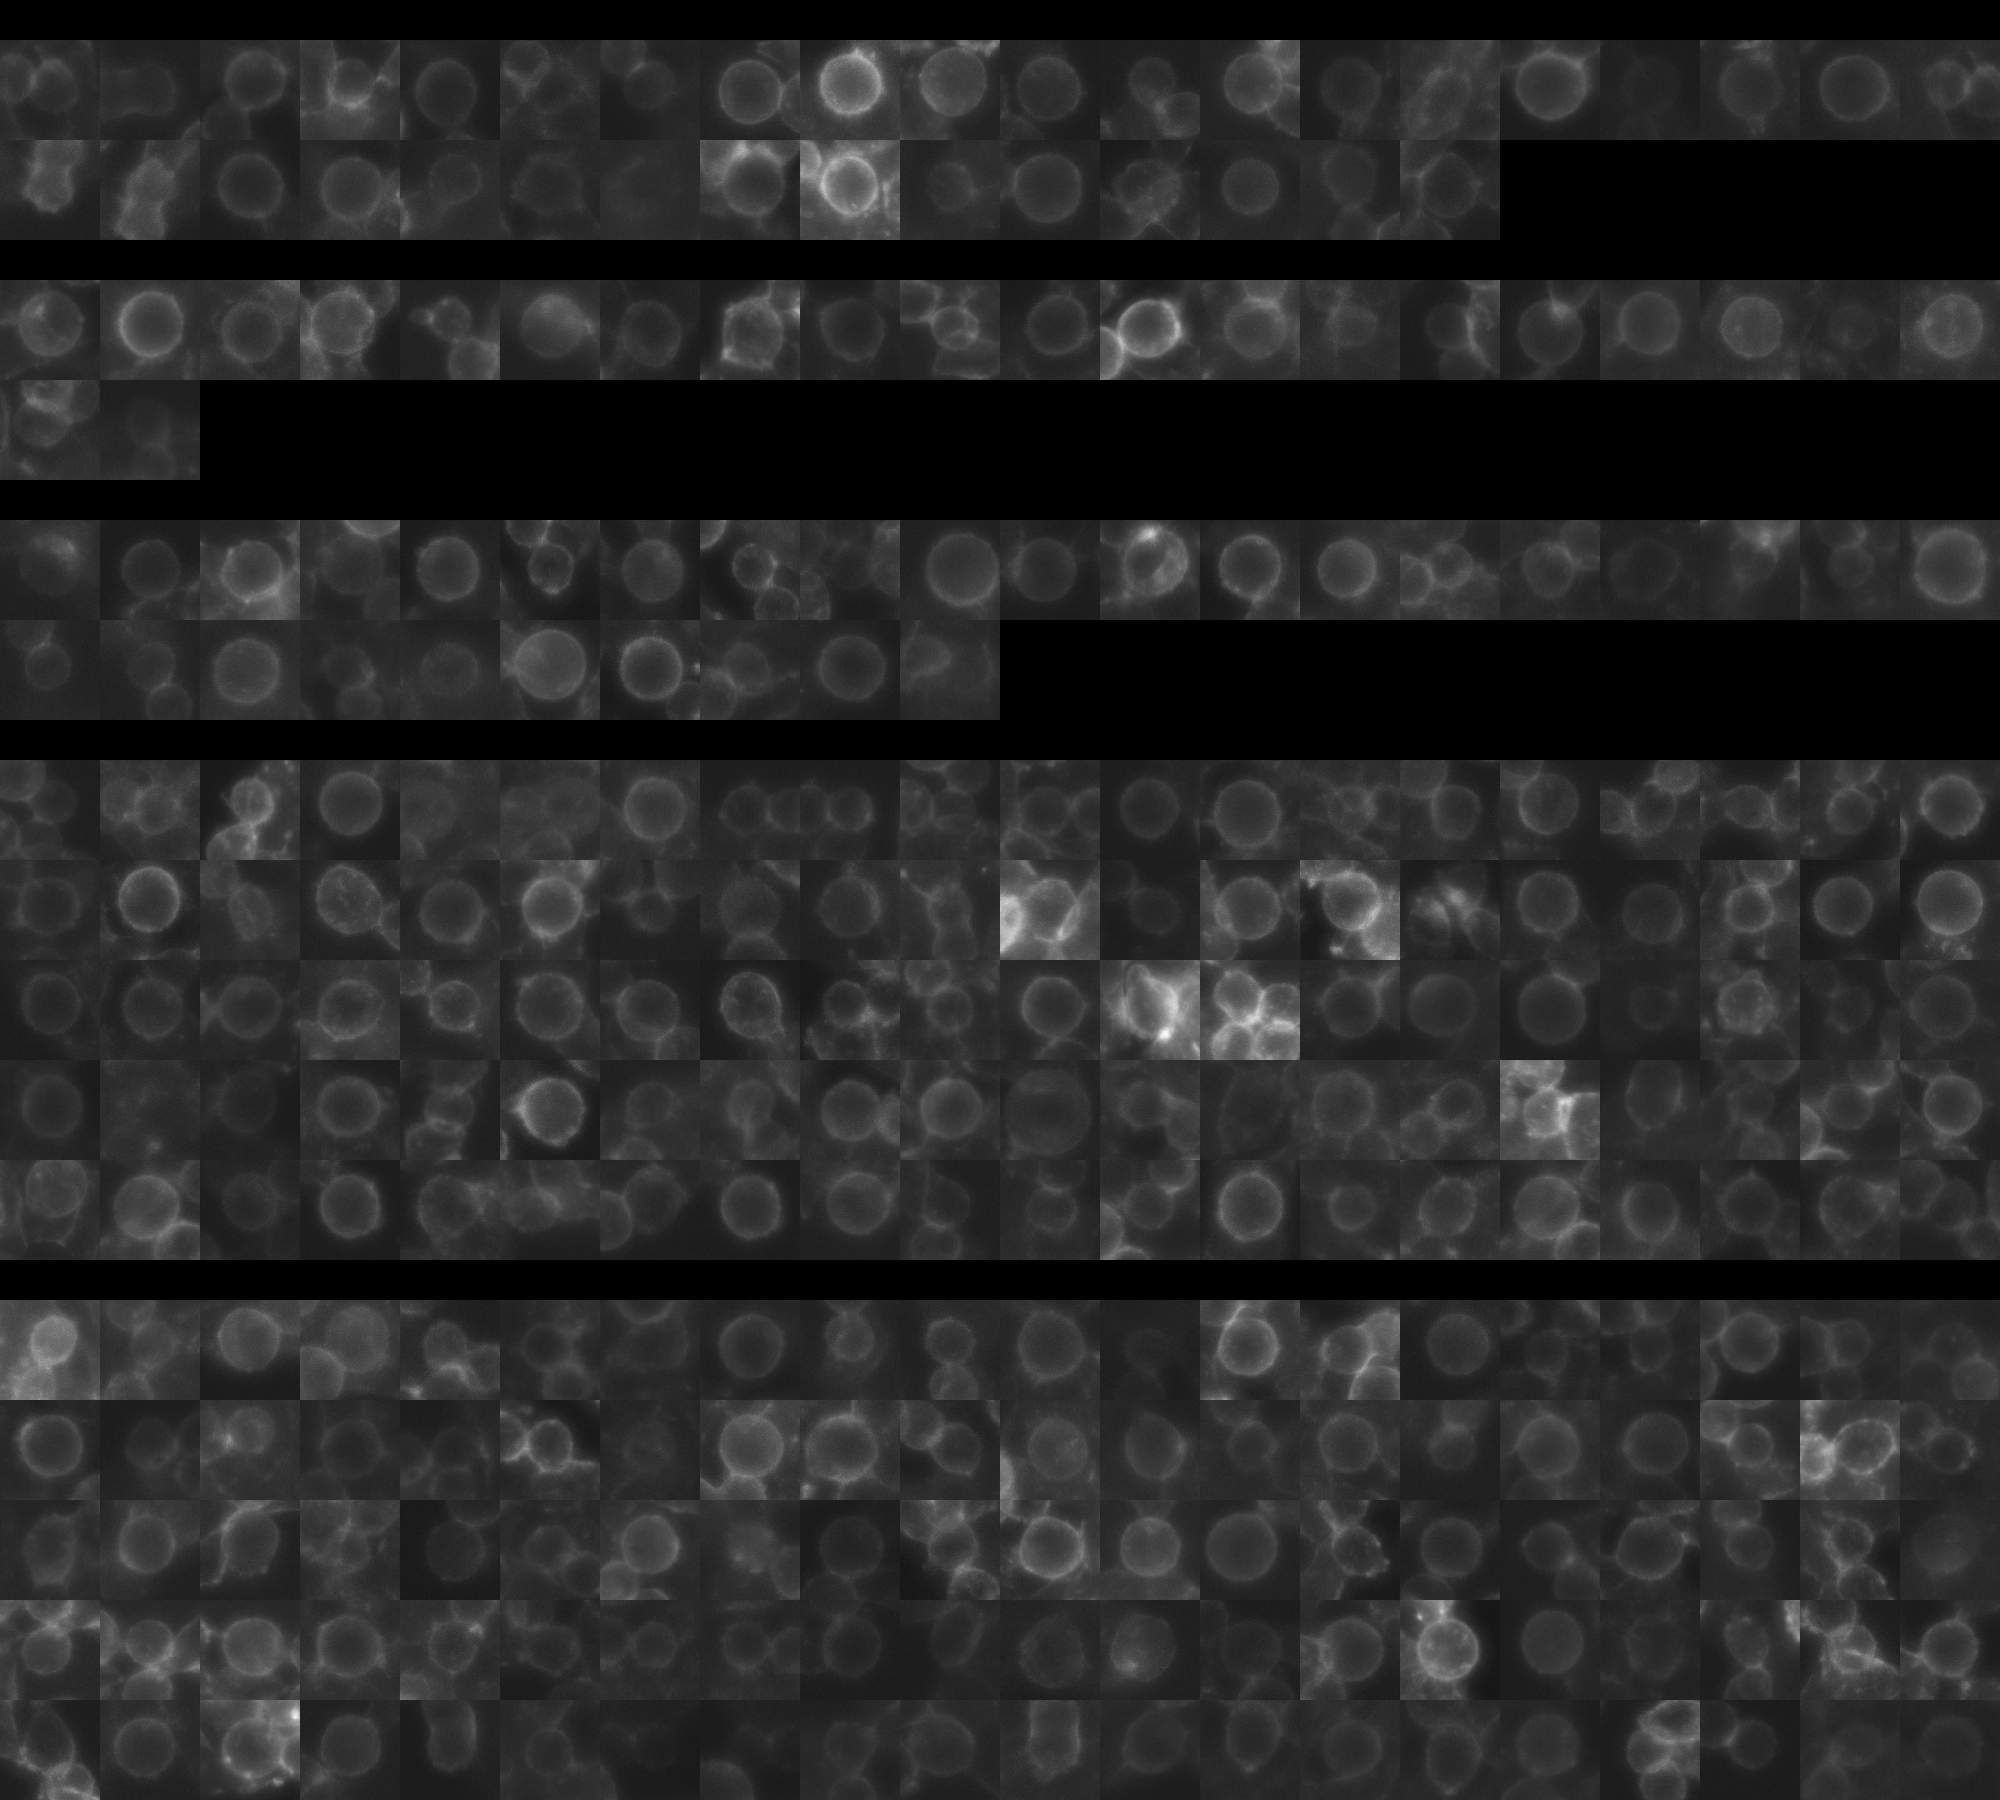
sgRNA 1: CCCACTGGTTTGCATCAAGT (interphase cells: 1307, mitotic cells: 35)
sgRNA 2: GAGCTCATCGACTACACCGG (interphase cells: 856, mitotic cells: 22)
sgRNA 3: GTGGAGCACTTCTTTCGACA (interphase cells: 731, mitotic cells: 30)
sgRNA 4: TGATTCTGACATTAGCAGTG (interphase cells: 2848, mitotic cells: 111)

Interphase Cluster

Mitotic Cluster

Overview

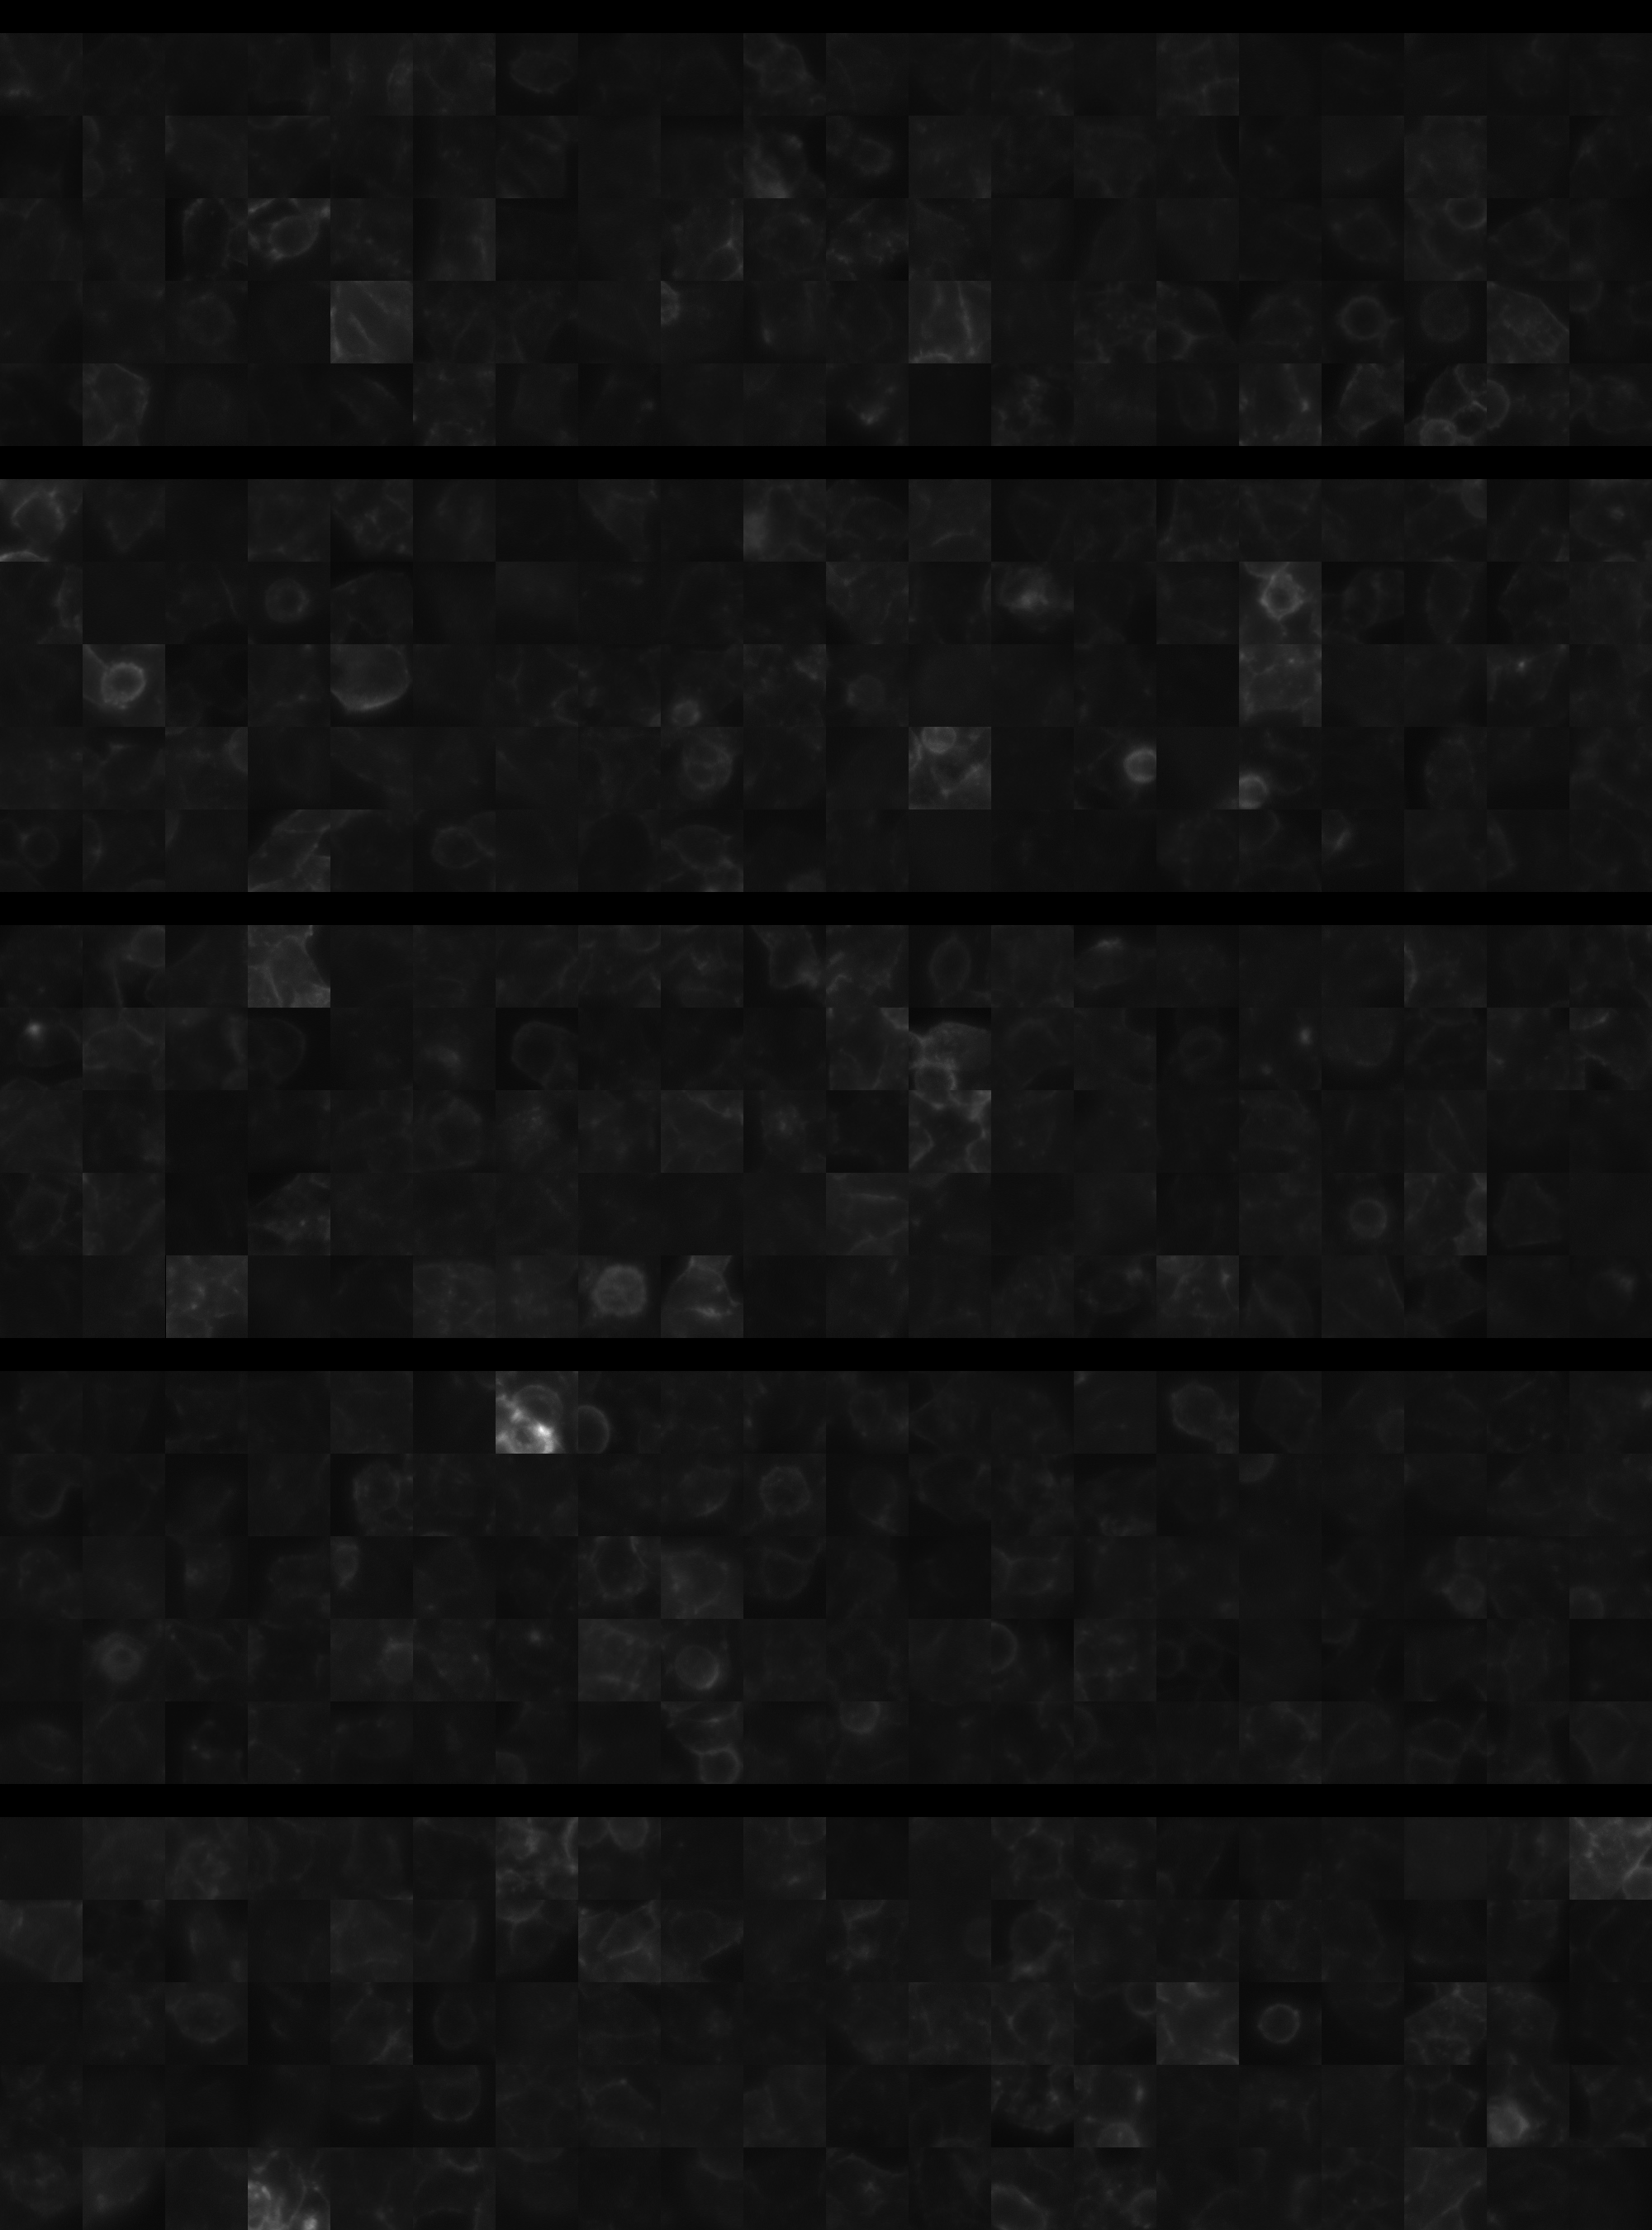
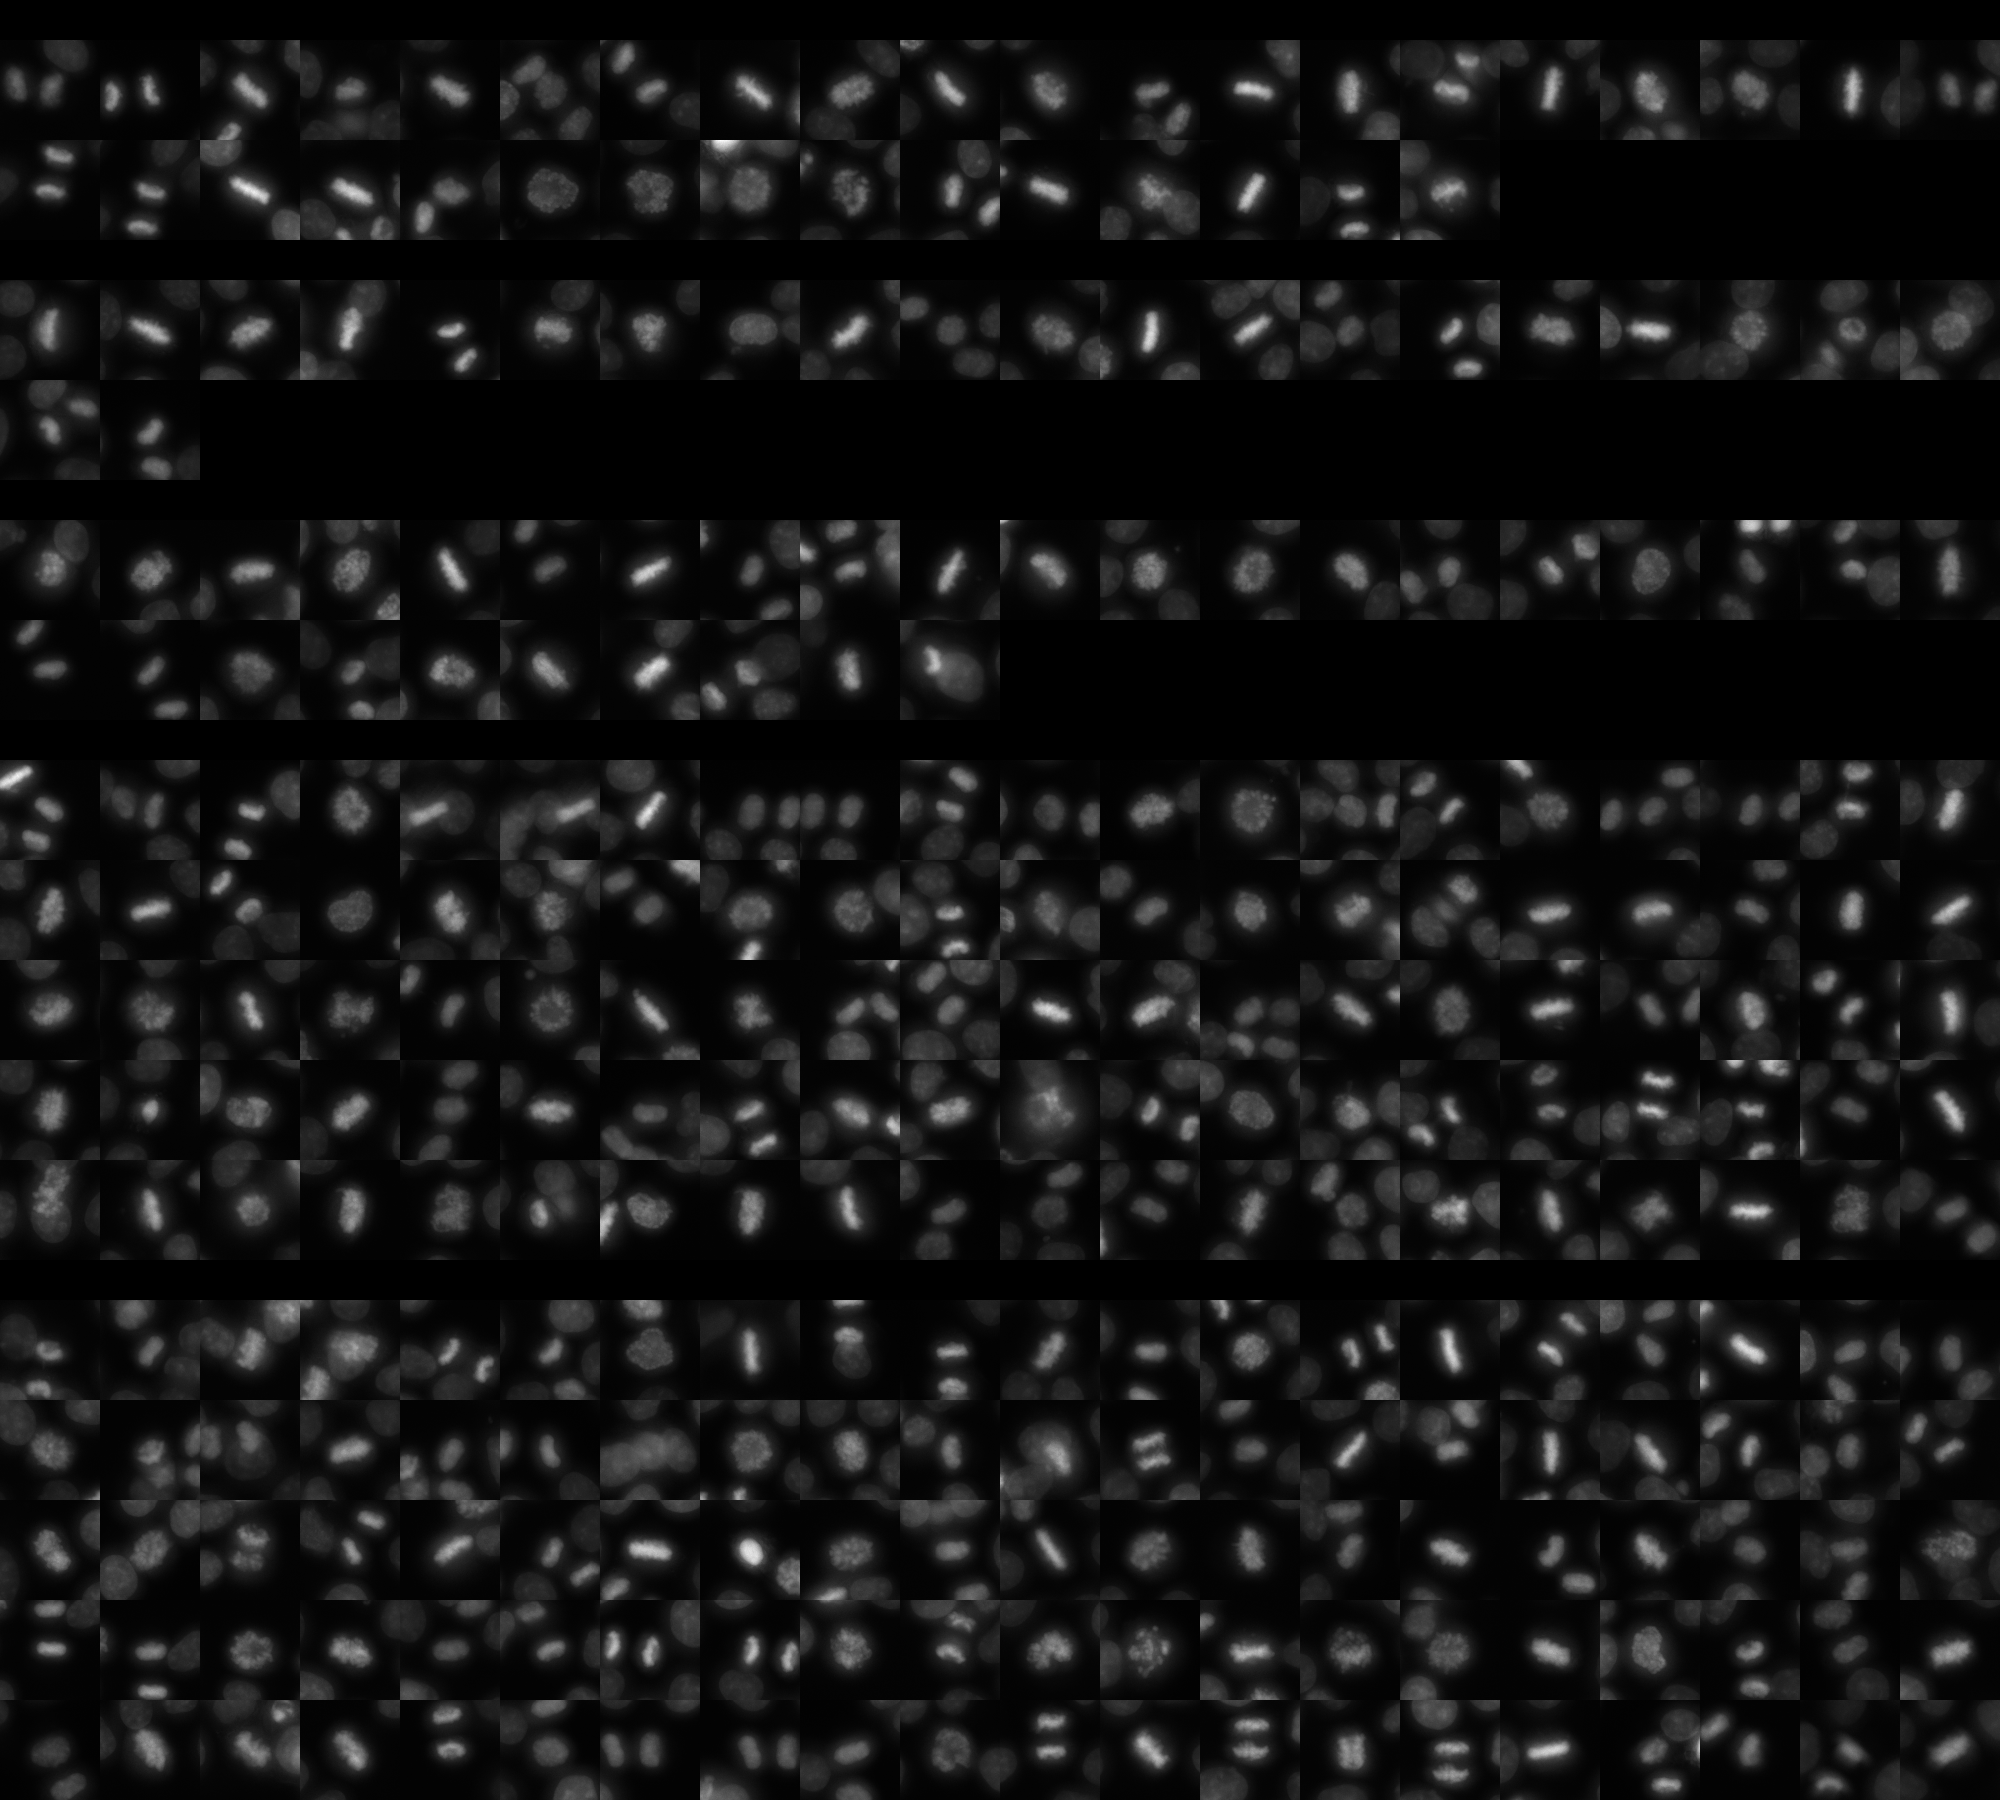
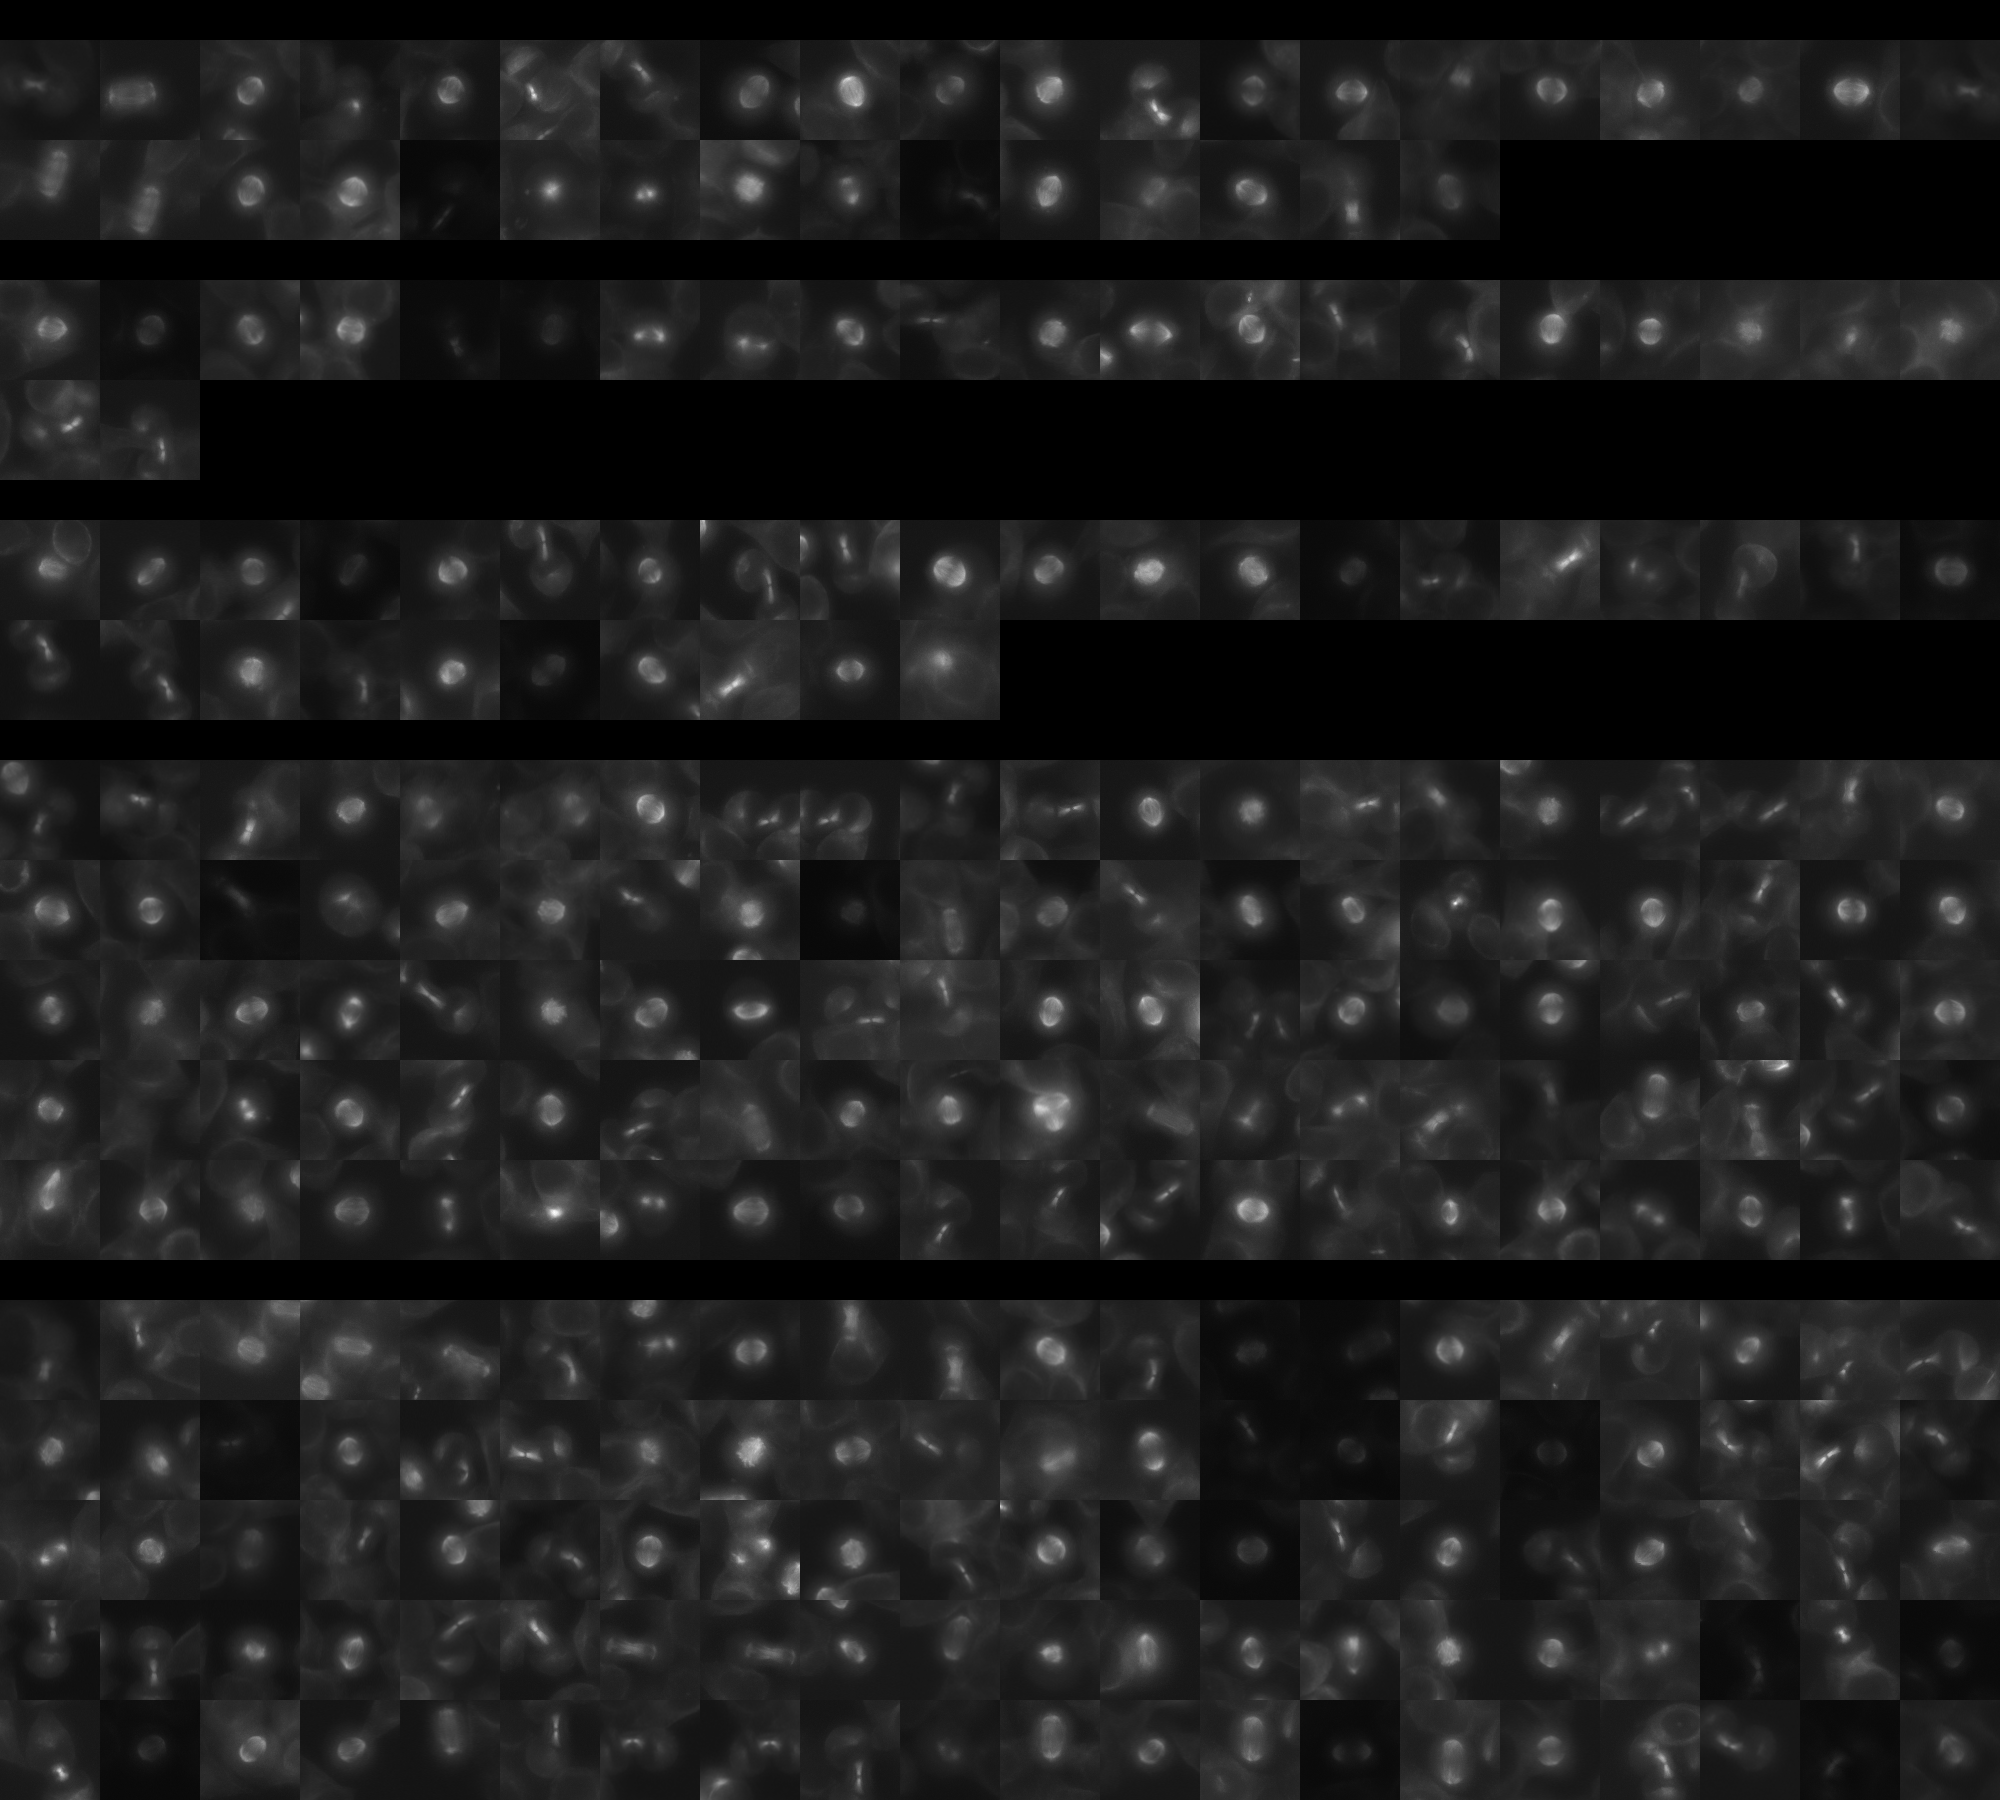
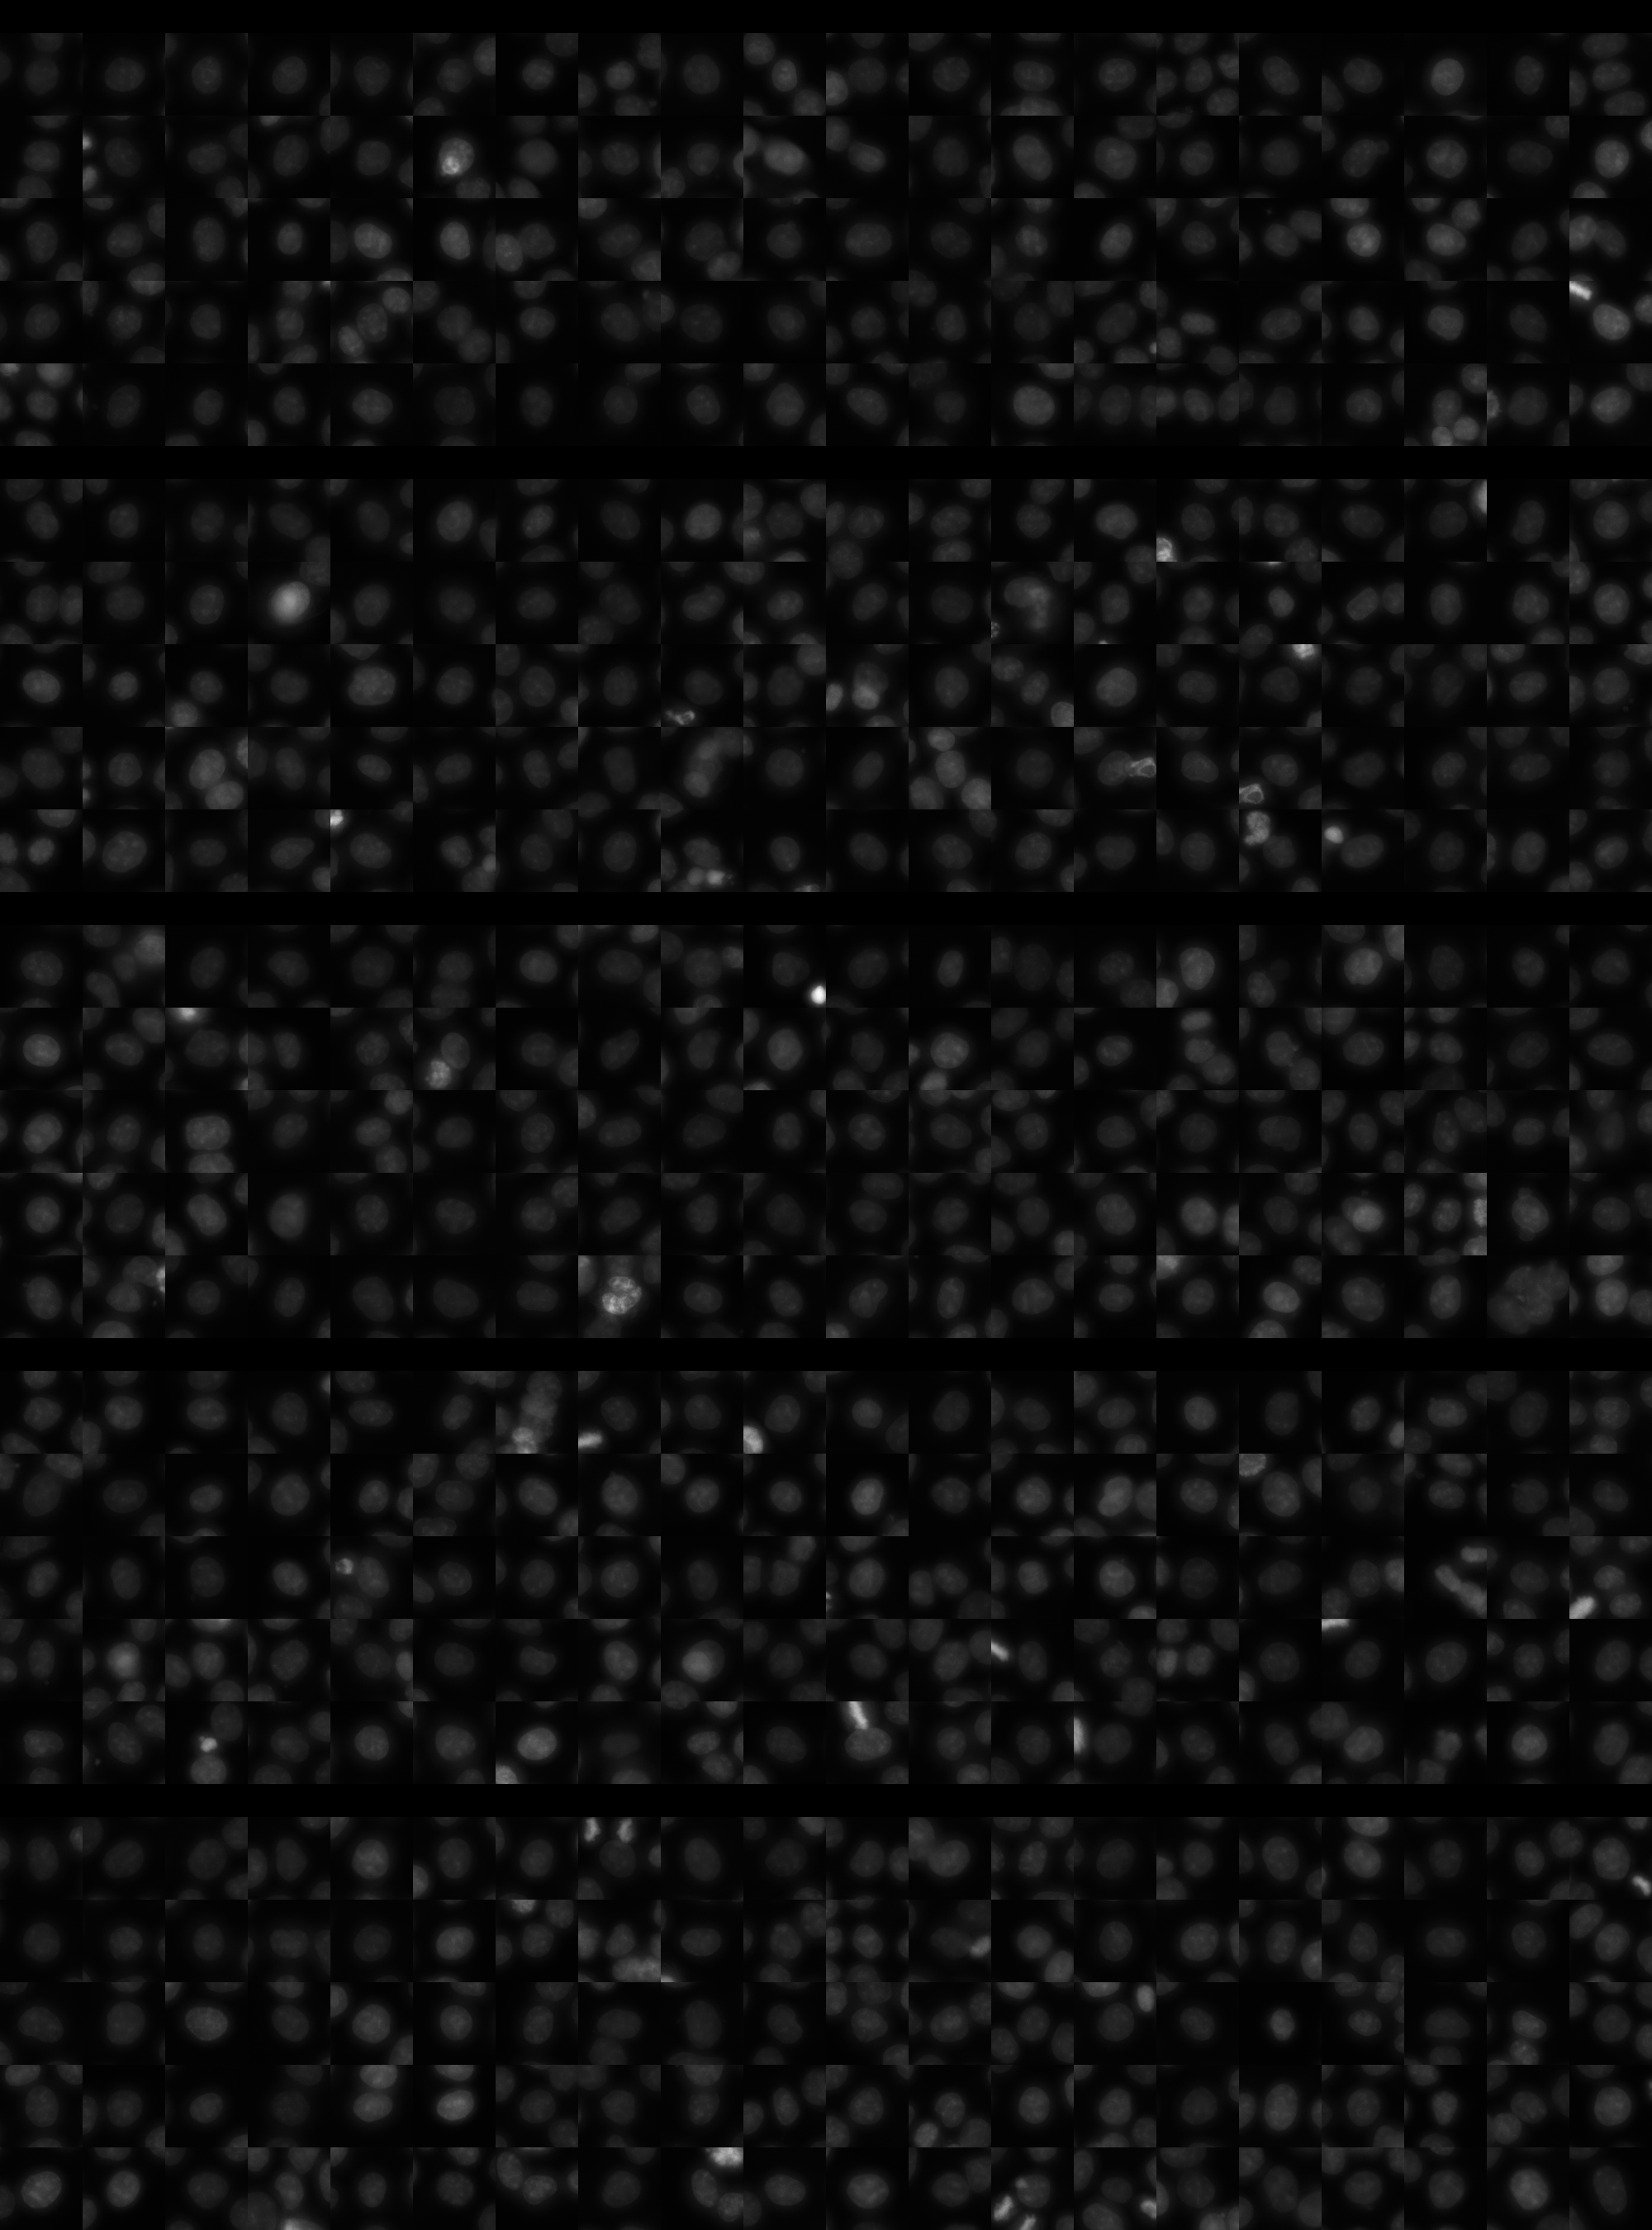
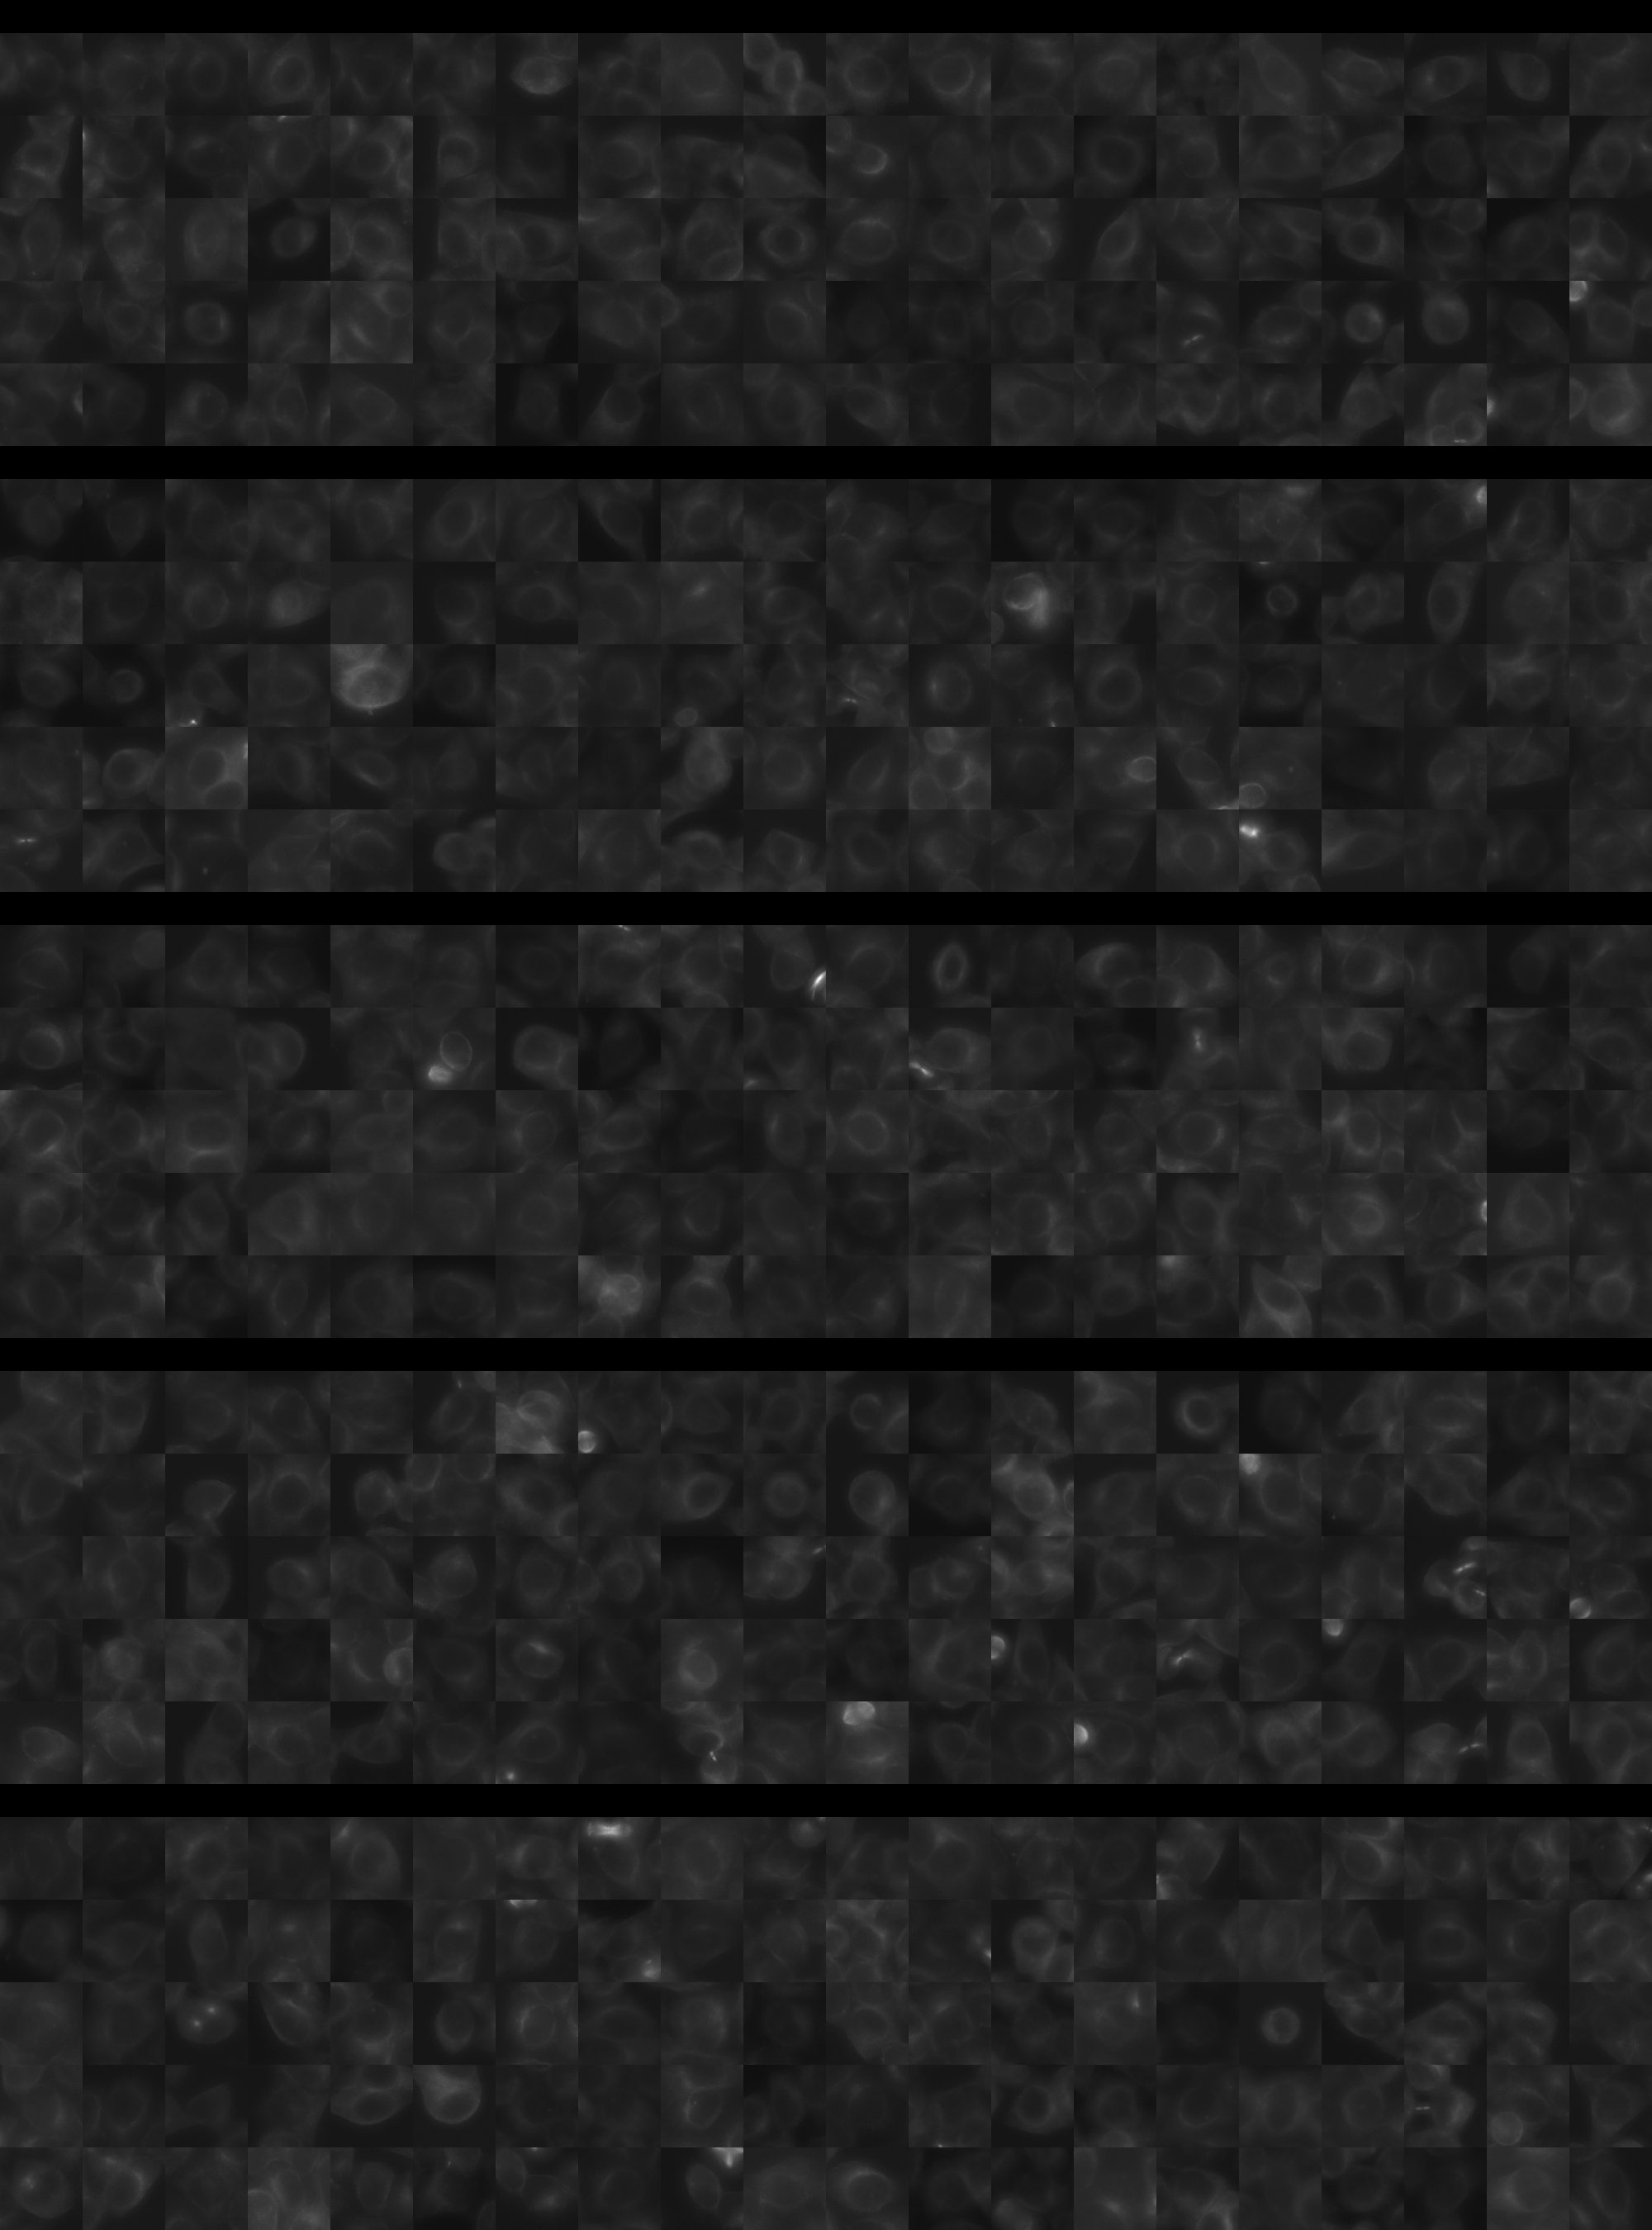
Each montage below shows randomly selected individual cell images for the same target gene separated by sgRNA, along with an example montage of cells expressing a non-targeting negative control sgRNA at the bottom. sgRNA labels in the montages correspond to the numbered sgRNA sequences in the gene info table above. The DNA (blue) and tubulin (green) channels are displayed by default, with gH2AX (grayscale) and actin (yellow) available using the check boxes. Channel brightness, contrast, and opacity are adjustable by clicking the arrow next to the channel name. When only one channel is selected, the display defaults to grayscale. Click the “Zoom” checkbox above the channel controls to enable image zooming (via scrolling) and panning (via click-and-drag).

The cell boxes displayed for this gene are square, 30.36 μm per side for the interphase montage and 30.36 μm per side for the mitotic montage.
Features

Interphase Score Rank FDR q-value
Nucleus DNA Integrated 0.035 1513 of 5322 0.663
Nucleus DNA Mean -2.567e-02 2831 of 5322 0.642
Nucleus gH2AX Mean 0.075 2658 of 5322 0.065
Nucleus DNA - gH2AX Correlation 0.005 836 of 5322 0.952
Nucleus Shape Area 0.053 1585 of 5322 0.390
Nucleus Shape Eccentricity 0.024 2031 of 5322 0.602
Nucleus Shape Form Factor -1.063e-01 4499 of 5322 0.009
Nucleus Shape Solidity -5.609e-02 2998 of 5322 0.115
Cell DNA Mass Displacement -6.988e-03 4686 of 5322 0.888
Cell Tubulin Mean 0.019 2009 of 5322 0.691
Cell Tubulin Mass Displacement -2.247e-03 3161 of 5322 0.988
Cell Actin Mean 0.004 2865 of 5322 0.930
Cell Tubulin - Actin Correlation 0.062 1101 of 5322 0.133
Cell DNA - Tubulin Correlation -8.106e-04 3858 of 5322 0.979
Cell Shape Area 0.040 1831 of 5322 0.619
Cell Shape Eccentricity -1.531e-03 3814 of 5322 0.999
Mitotic Score Rank FDR q-value
Nucleus DNA Integrated 0.169 1590 of 5322 0.903
Nucleus DNA Mean -2.216e-02 3301 of 5322 1.000
Nucleus DNA Mass Displacement 0.163 1111 of 5322 0.999
Nucleus DNA Mean Frac 3 -1.488e-01 4802 of 5322 1.000
Nucleus gH2AX Mean 0.012 2801 of 5322 1.000
Nucleus gH2AX Mean Frac 0 -1.327e-01 4212 of 5322 1.000
Nucleus Tubulin Mean Frac 0 0.081 2261 of 5322 0.999
Nucleus Tubulin Mean Edge -7.046e-02 4049 of 5322 0.999
Nucleus Tubulin Std Edge 0.006 2490 of 5322 0.999
Nucleus Shape Area 0.116 2432 of 5322 0.989
Nucleus Shape Eccentricity -4.324e-02 2783 of 5322 1.000
Nucleus Shape Form Factor -8.735e-02 2664 of 5322 0.998
Cell Tubulin Mean 0.125 1740 of 5322 0.997
Cell Tubulin Mean Frac 3 -1.726e-01 3784 of 5322 0.999
Cell Actin Mean 0.027 2842 of 5322 0.997
Cell Shape Area 0.214 1258 of 5322 0.994
( Reset Zoom )
Brightness
Contrast
Opacity
Brightness
Contrast
Opacity
Brightness
Contrast
Opacity
Brightness
Contrast
Opacity
Brightness
Contrast
Opacity

( Reset Zoom )
Brightness
Contrast
Opacity
Brightness
Contrast
Opacity
Brightness
Contrast
Opacity
Brightness
Contrast
Opacity
Brightness
Contrast
Opacity

MIT Central Accessability