RHOA

Gene symbol: RHOA
Gene: 387
Uniprot Function: Small GTPase which cycles between an active GTP-bound and an inactive GDP-bound state. Mainly associated with cytoskeleton organization, in active state binds to a variety of effector proteins to regulate cellular responses such as cytoskeletal dynamics, cell migration and cell cycle. Regulates a signal transduction pathway linking plasma membrane receptors to the assembly of focal adhesions and actin stress fibers (PubMed:8910519, PubMed:9121475, PubMed:31570889). Involved in a microtubule-dependent signal that is required for the myosin contractile ring formation during cell cycle cytokinesis (PubMed:16236794, PubMed:12900402). Plays an essential role in cleavage furrow formation. Required for the apical junction formation of keratinocyte cell-cell adhesion (PubMed:20974804, PubMed:23940119). Essential for the SPATA13-mediated regulation of cell migration and adhesion assembly and disassembly (PubMed:19934221). The MEMO1-RHOA-DIAPH1 signaling pathway plays an important role in ERBB2-dependent stabilization of microtubules at the cell cortex. It controls the localization of APC and CLASP2 to the cell membrane, via the regulation of GSK3B activity. In turn, membrane-bound APC allows the localization of the MACF1 to the cell membrane, which is required for microtubule capture and stabilization (PubMed:20937854). Regulates KCNA2 potassium channel activity by reducing its location at the cell surface in response to CHRM1 activation; promotes KCNA2 endocytosis (PubMed:9635436, PubMed:19403695). Acts as an allosteric activator of guanine nucleotide exchange factor ECT2 by binding in its activated GTP-bound form to the PH domain of ECT2 which stimulates the release of PH inhibition and promotes the binding of substrate RHOA to the ECT2 catalytic center (PubMed:31888991). May be an activator of PLCE1 (PubMed:16103226). In neurons, involved in the inhibiton of the initial spine growth. Upon activation by CaMKII, modulates dendritic spine structural plasticity by relaying CaMKII transient activation to synapse-specific, long-term signaling (By similarity). Acts as a regulator of platelet alpha-granule release during activation and aggregation of platelets (By similarity).
Mitotic Index 0.0278
Interphase Cluster: #24 (39 genes)
Mitotic Cluster: #27 (35 genes)
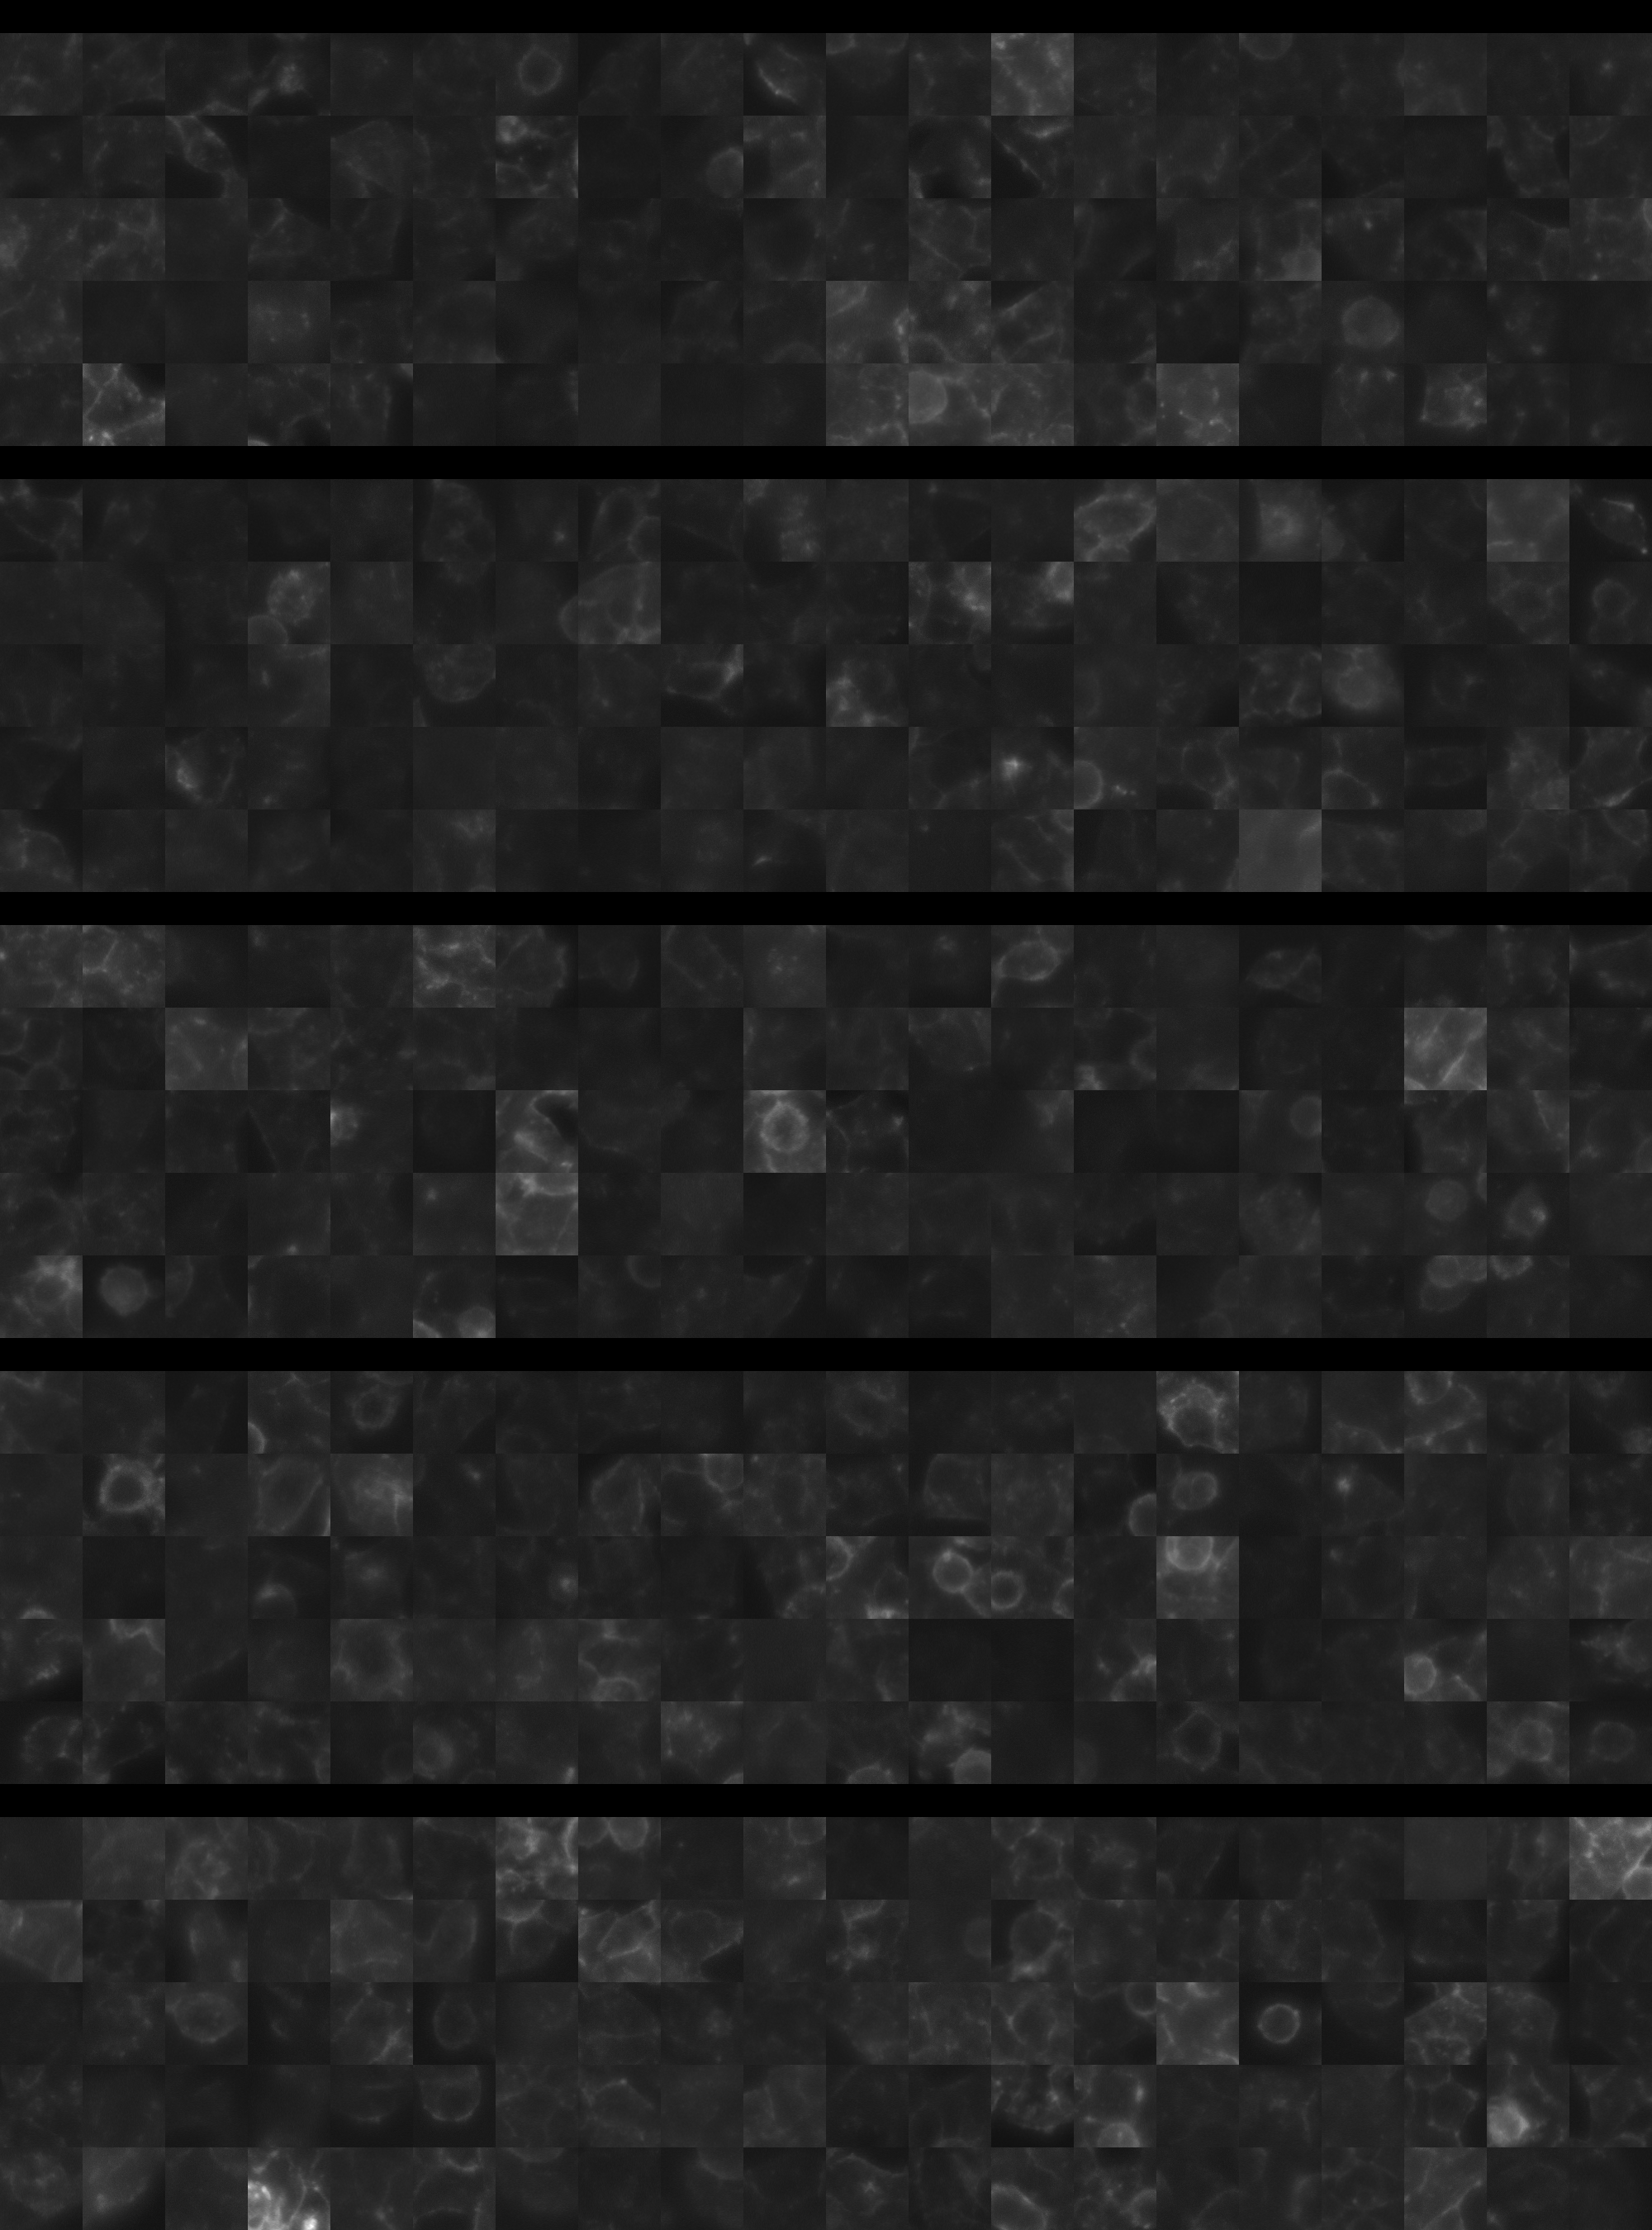
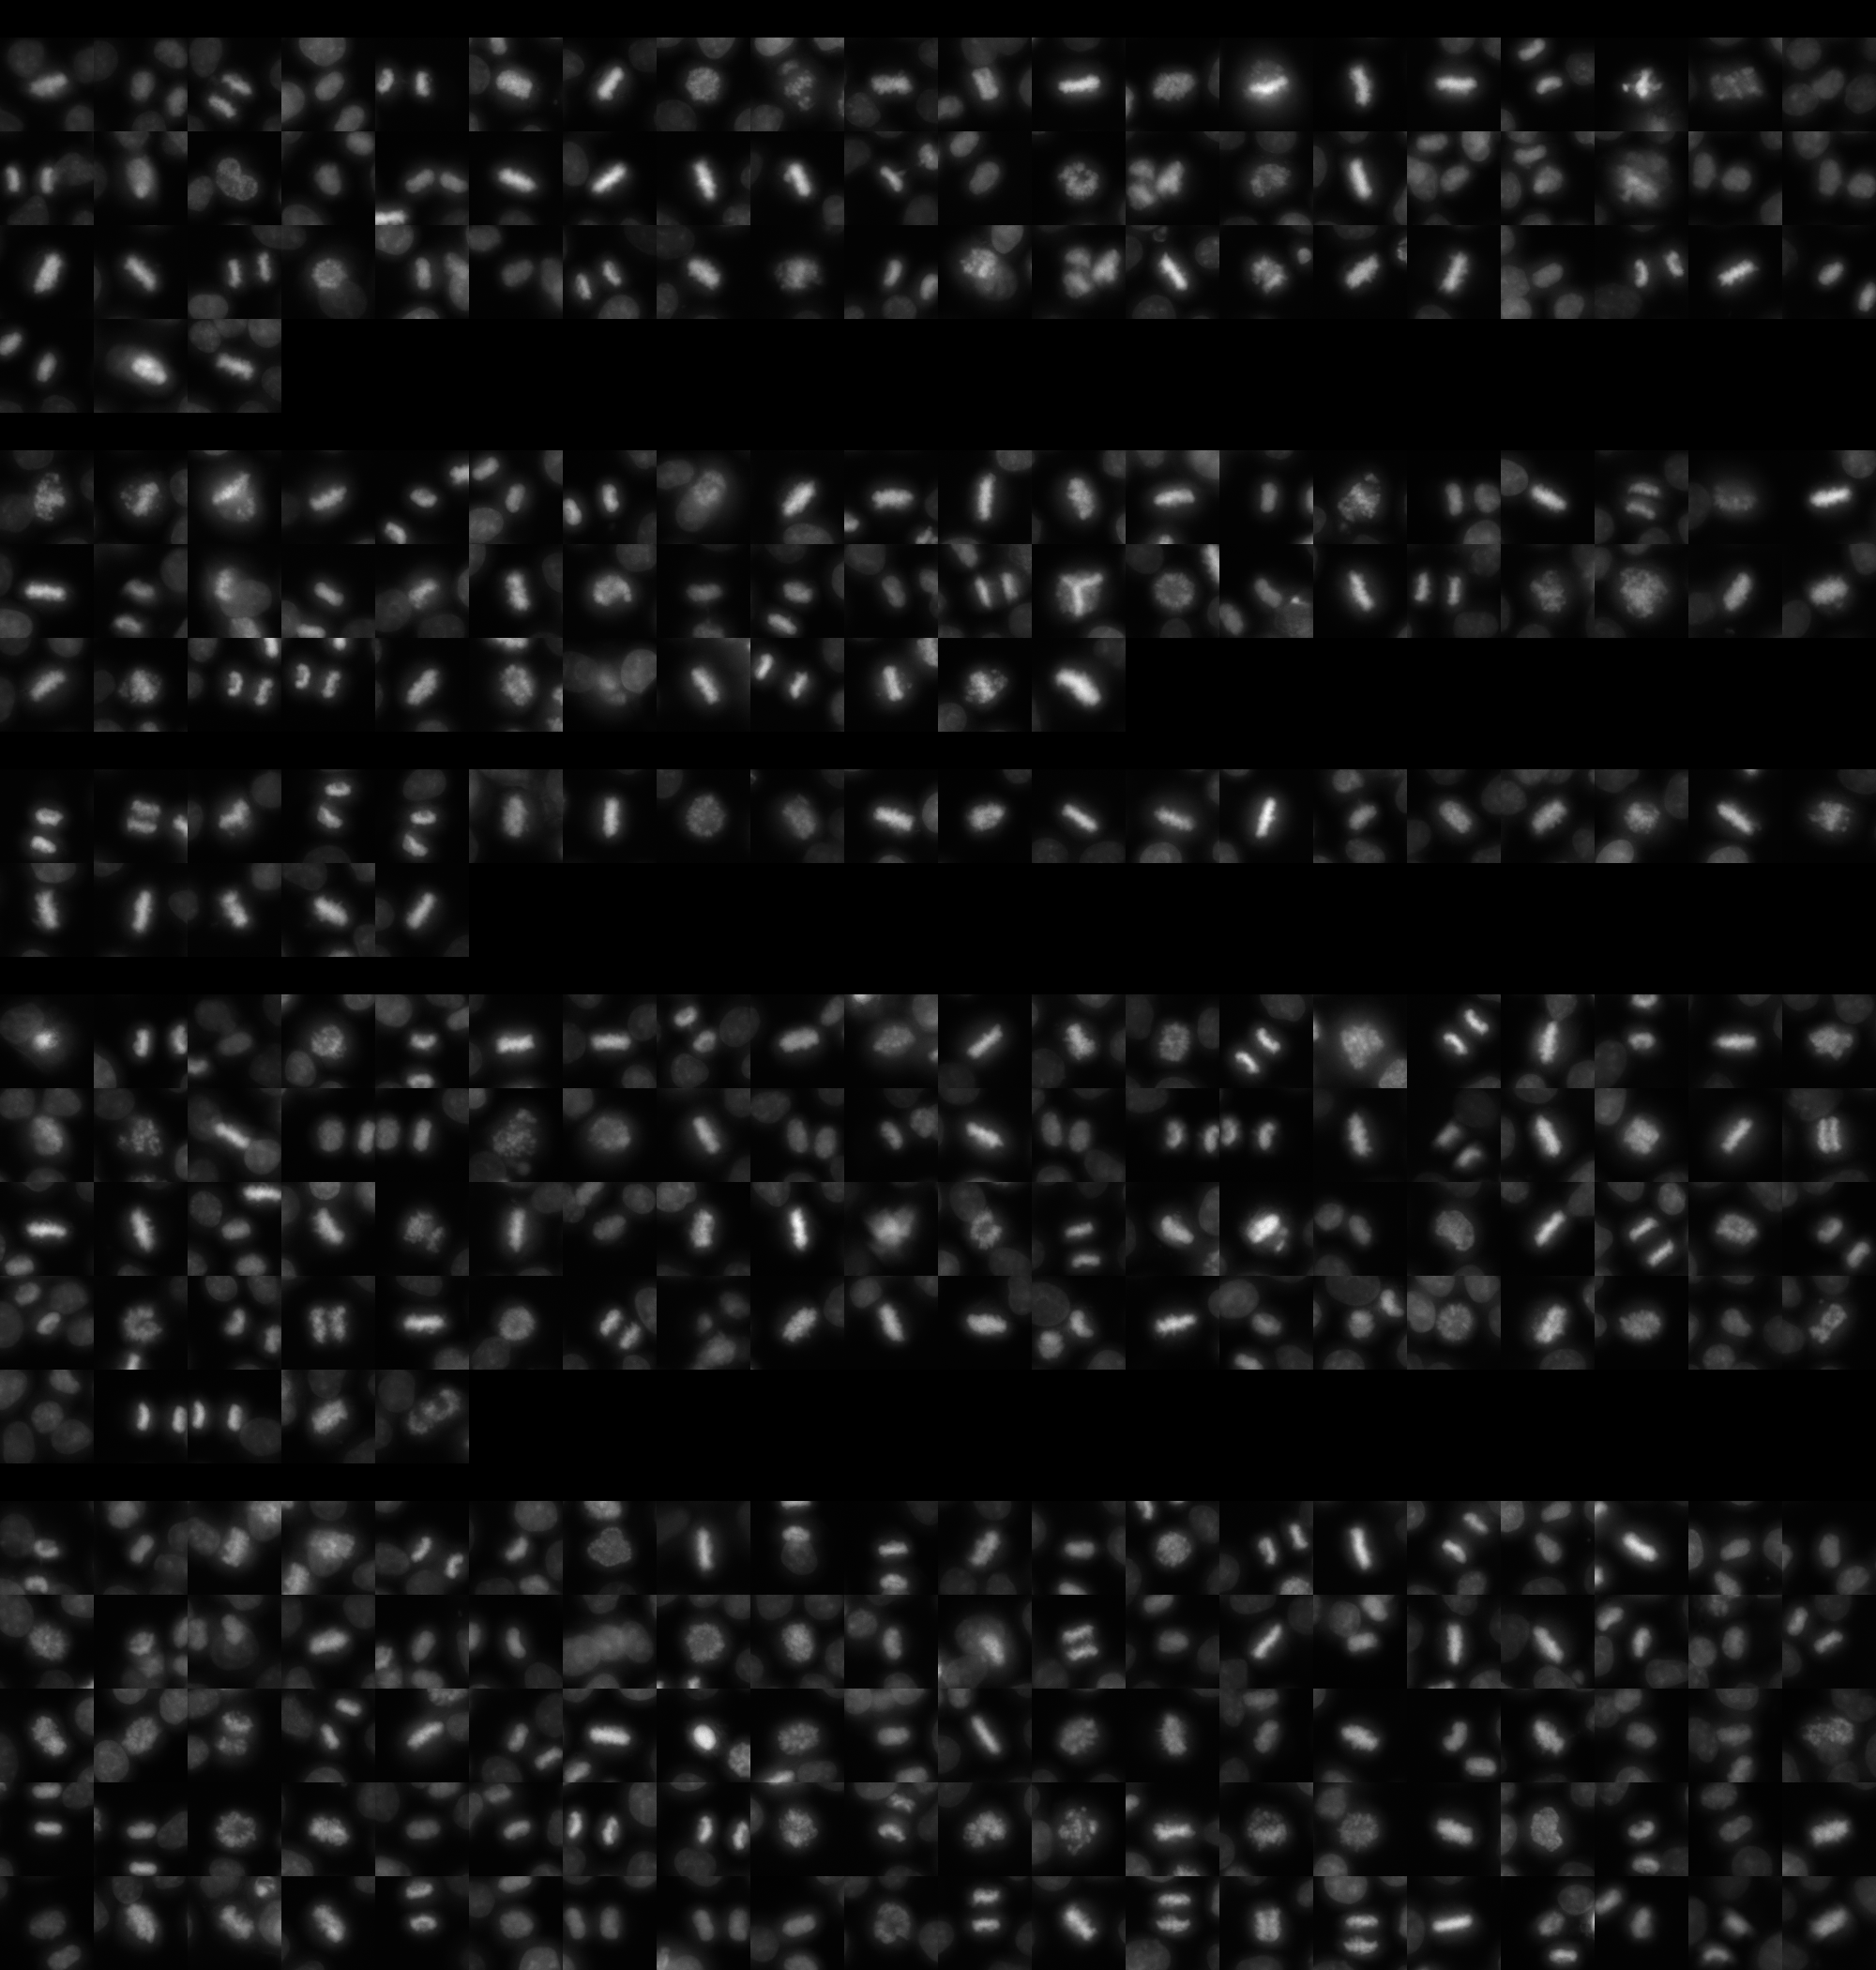
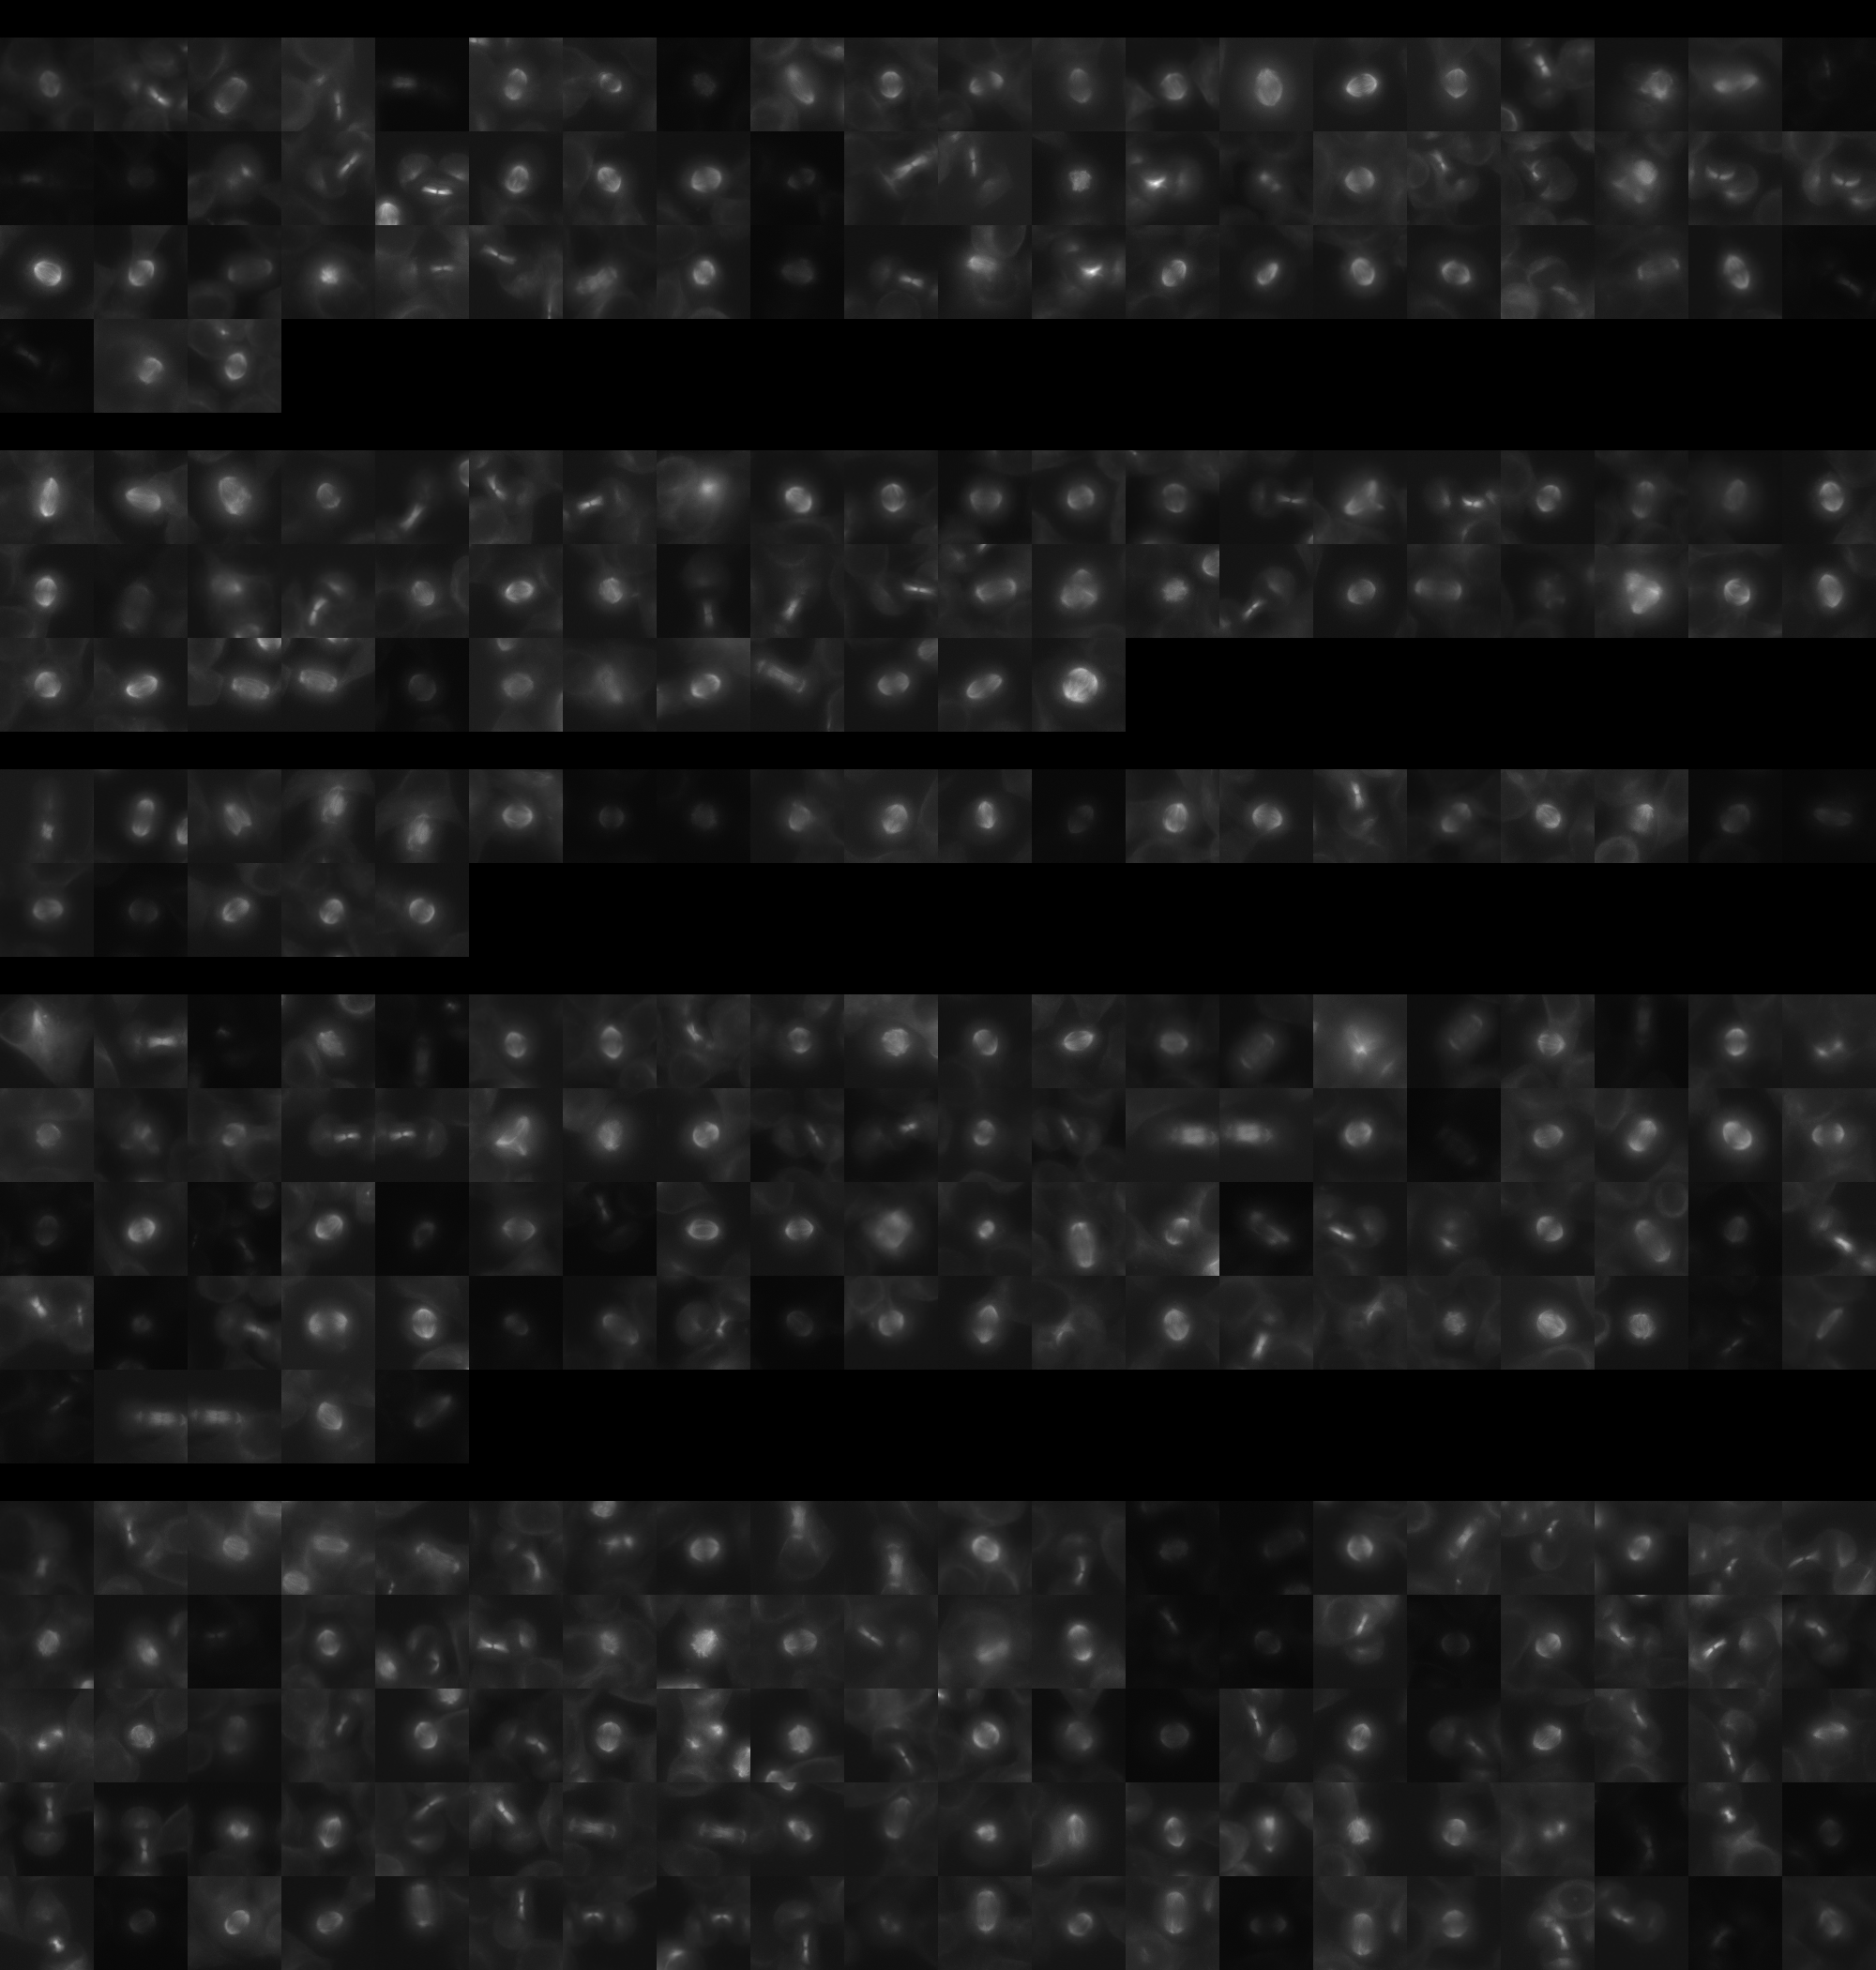
sgRNA 1: AAAACACATCAGTATAACAT (interphase cells: 2213, mitotic cells: 63)
sgRNA 2: ACAGAAATGCTTGACTTCTG (interphase cells: 1904, mitotic cells: 52)
sgRNA 3: CTATGTGGCAGATATCGAGG (interphase cells: 895, mitotic cells: 25)
sgRNA 4: GCCACTCACCTAAACTATCA (interphase cells: 2852, mitotic cells: 85)

Interphase Cluster

Mitotic Cluster

Overview

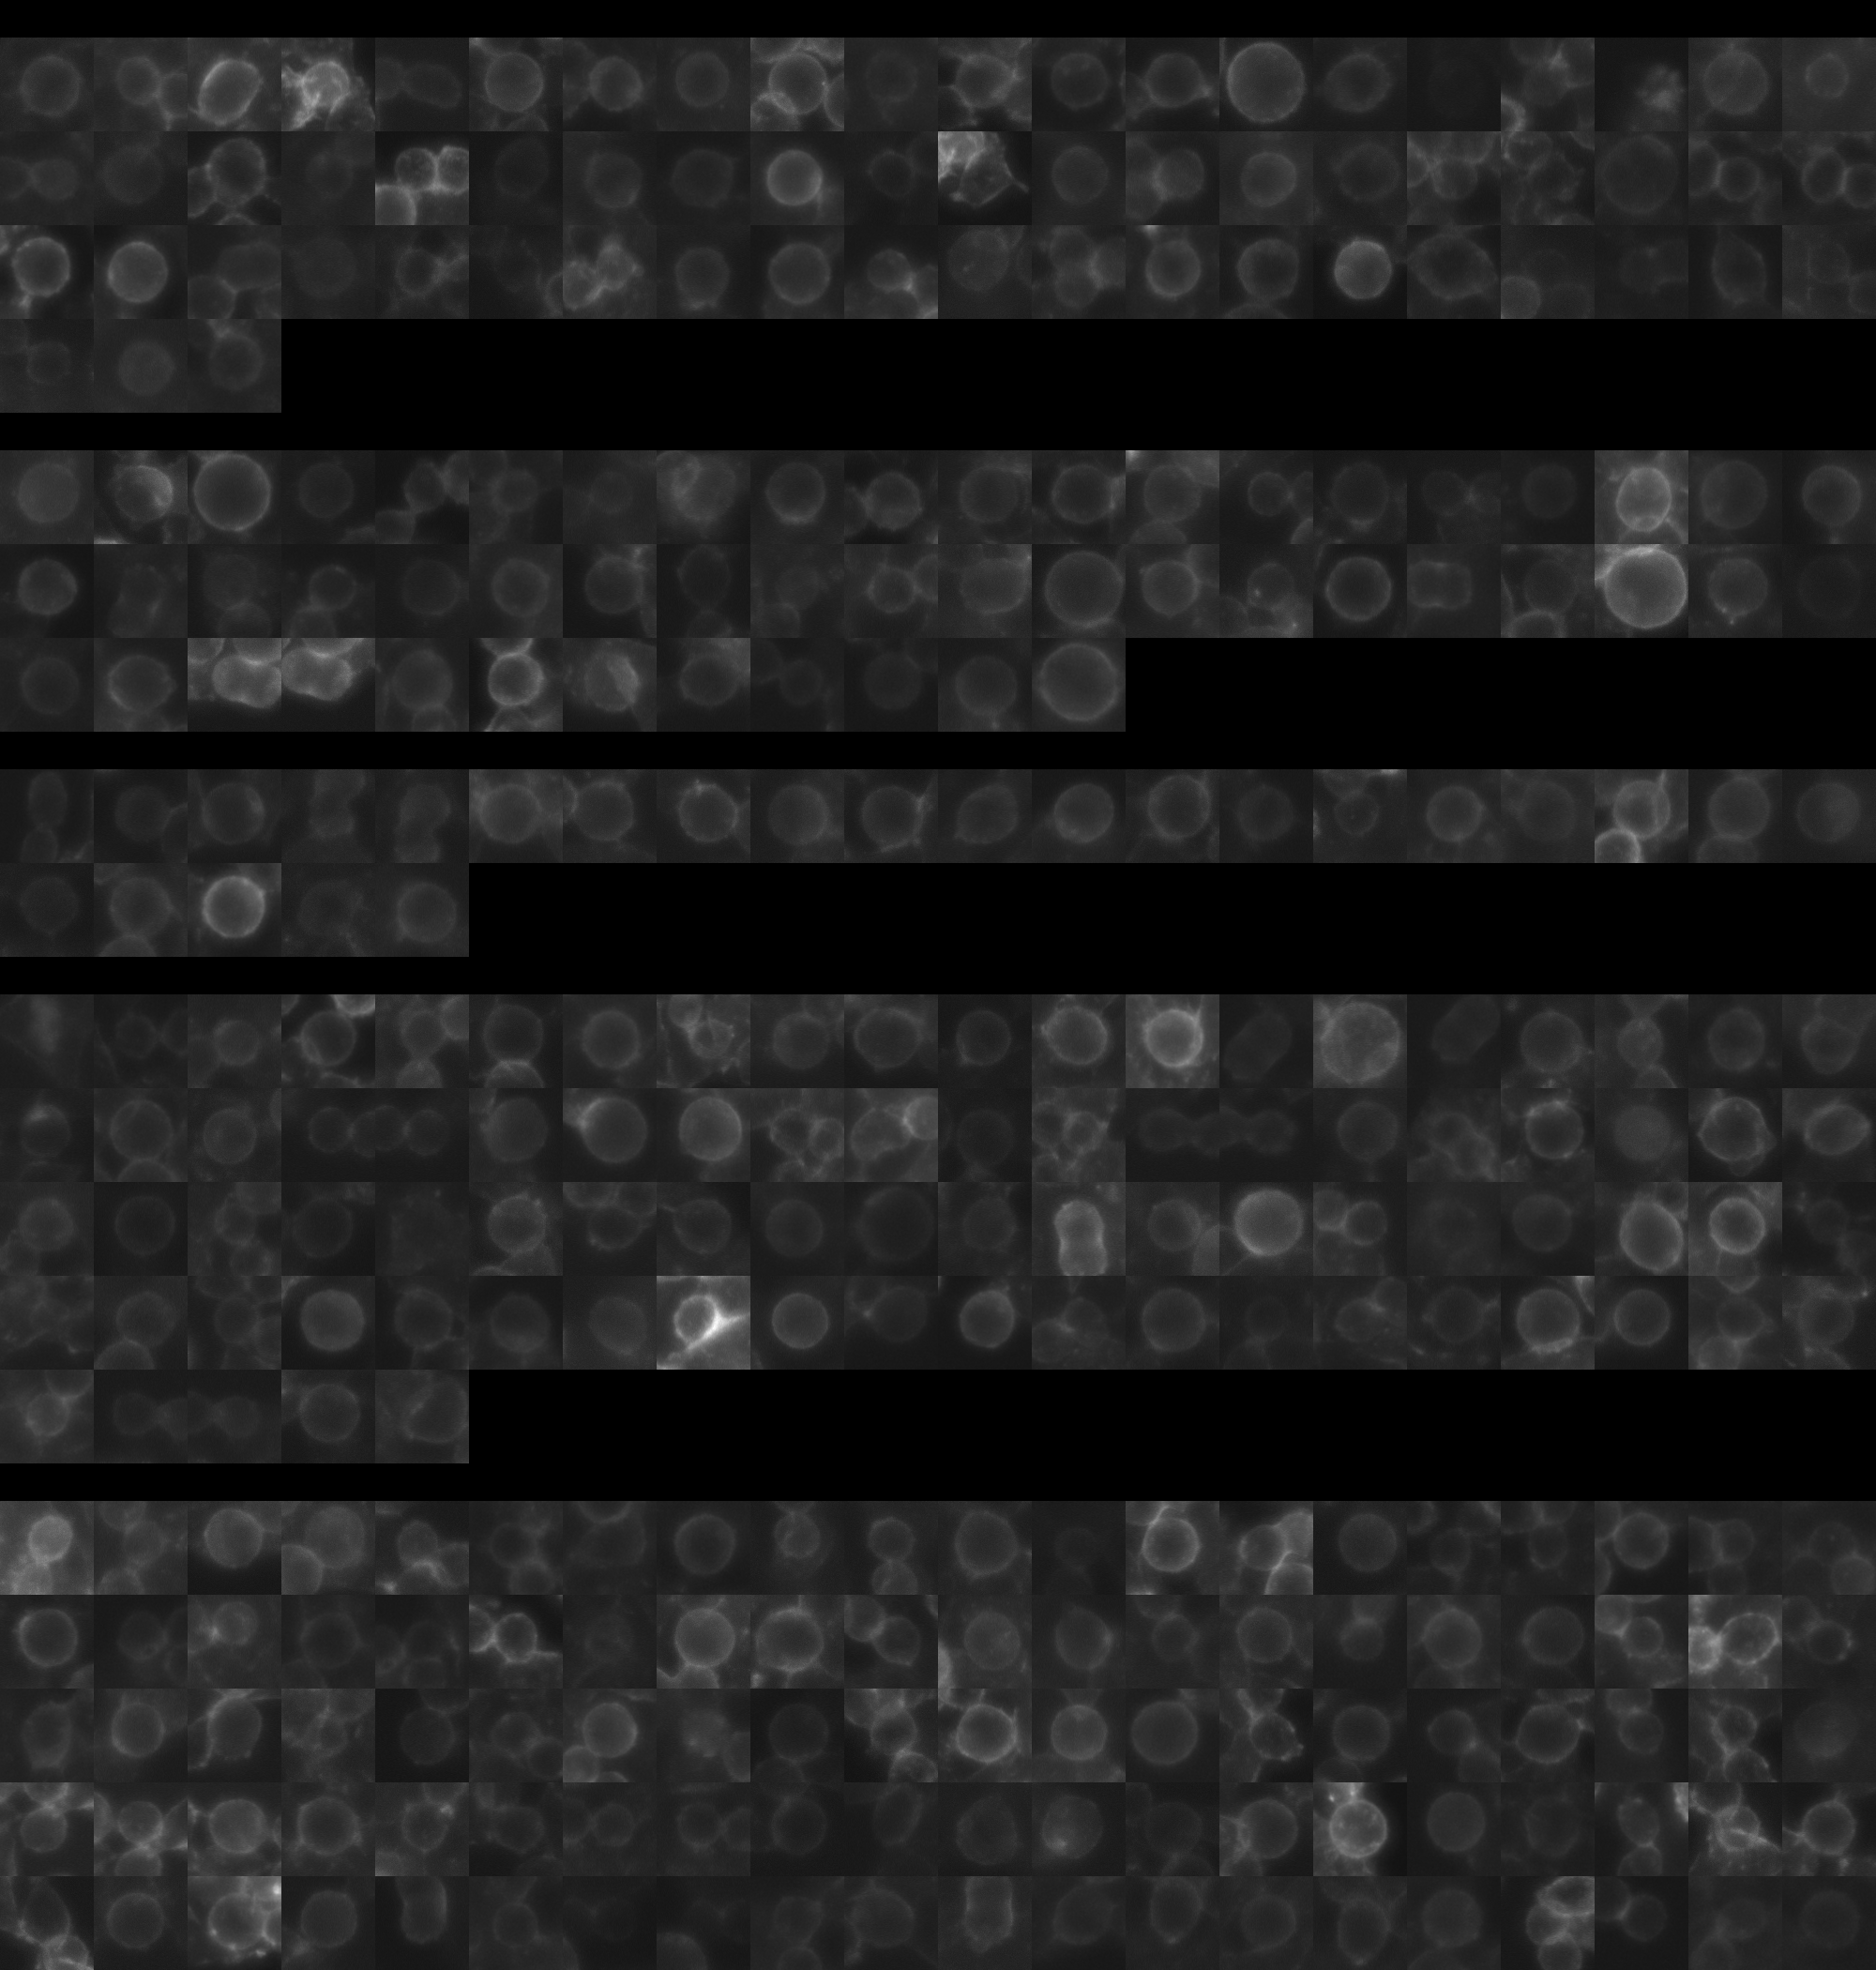
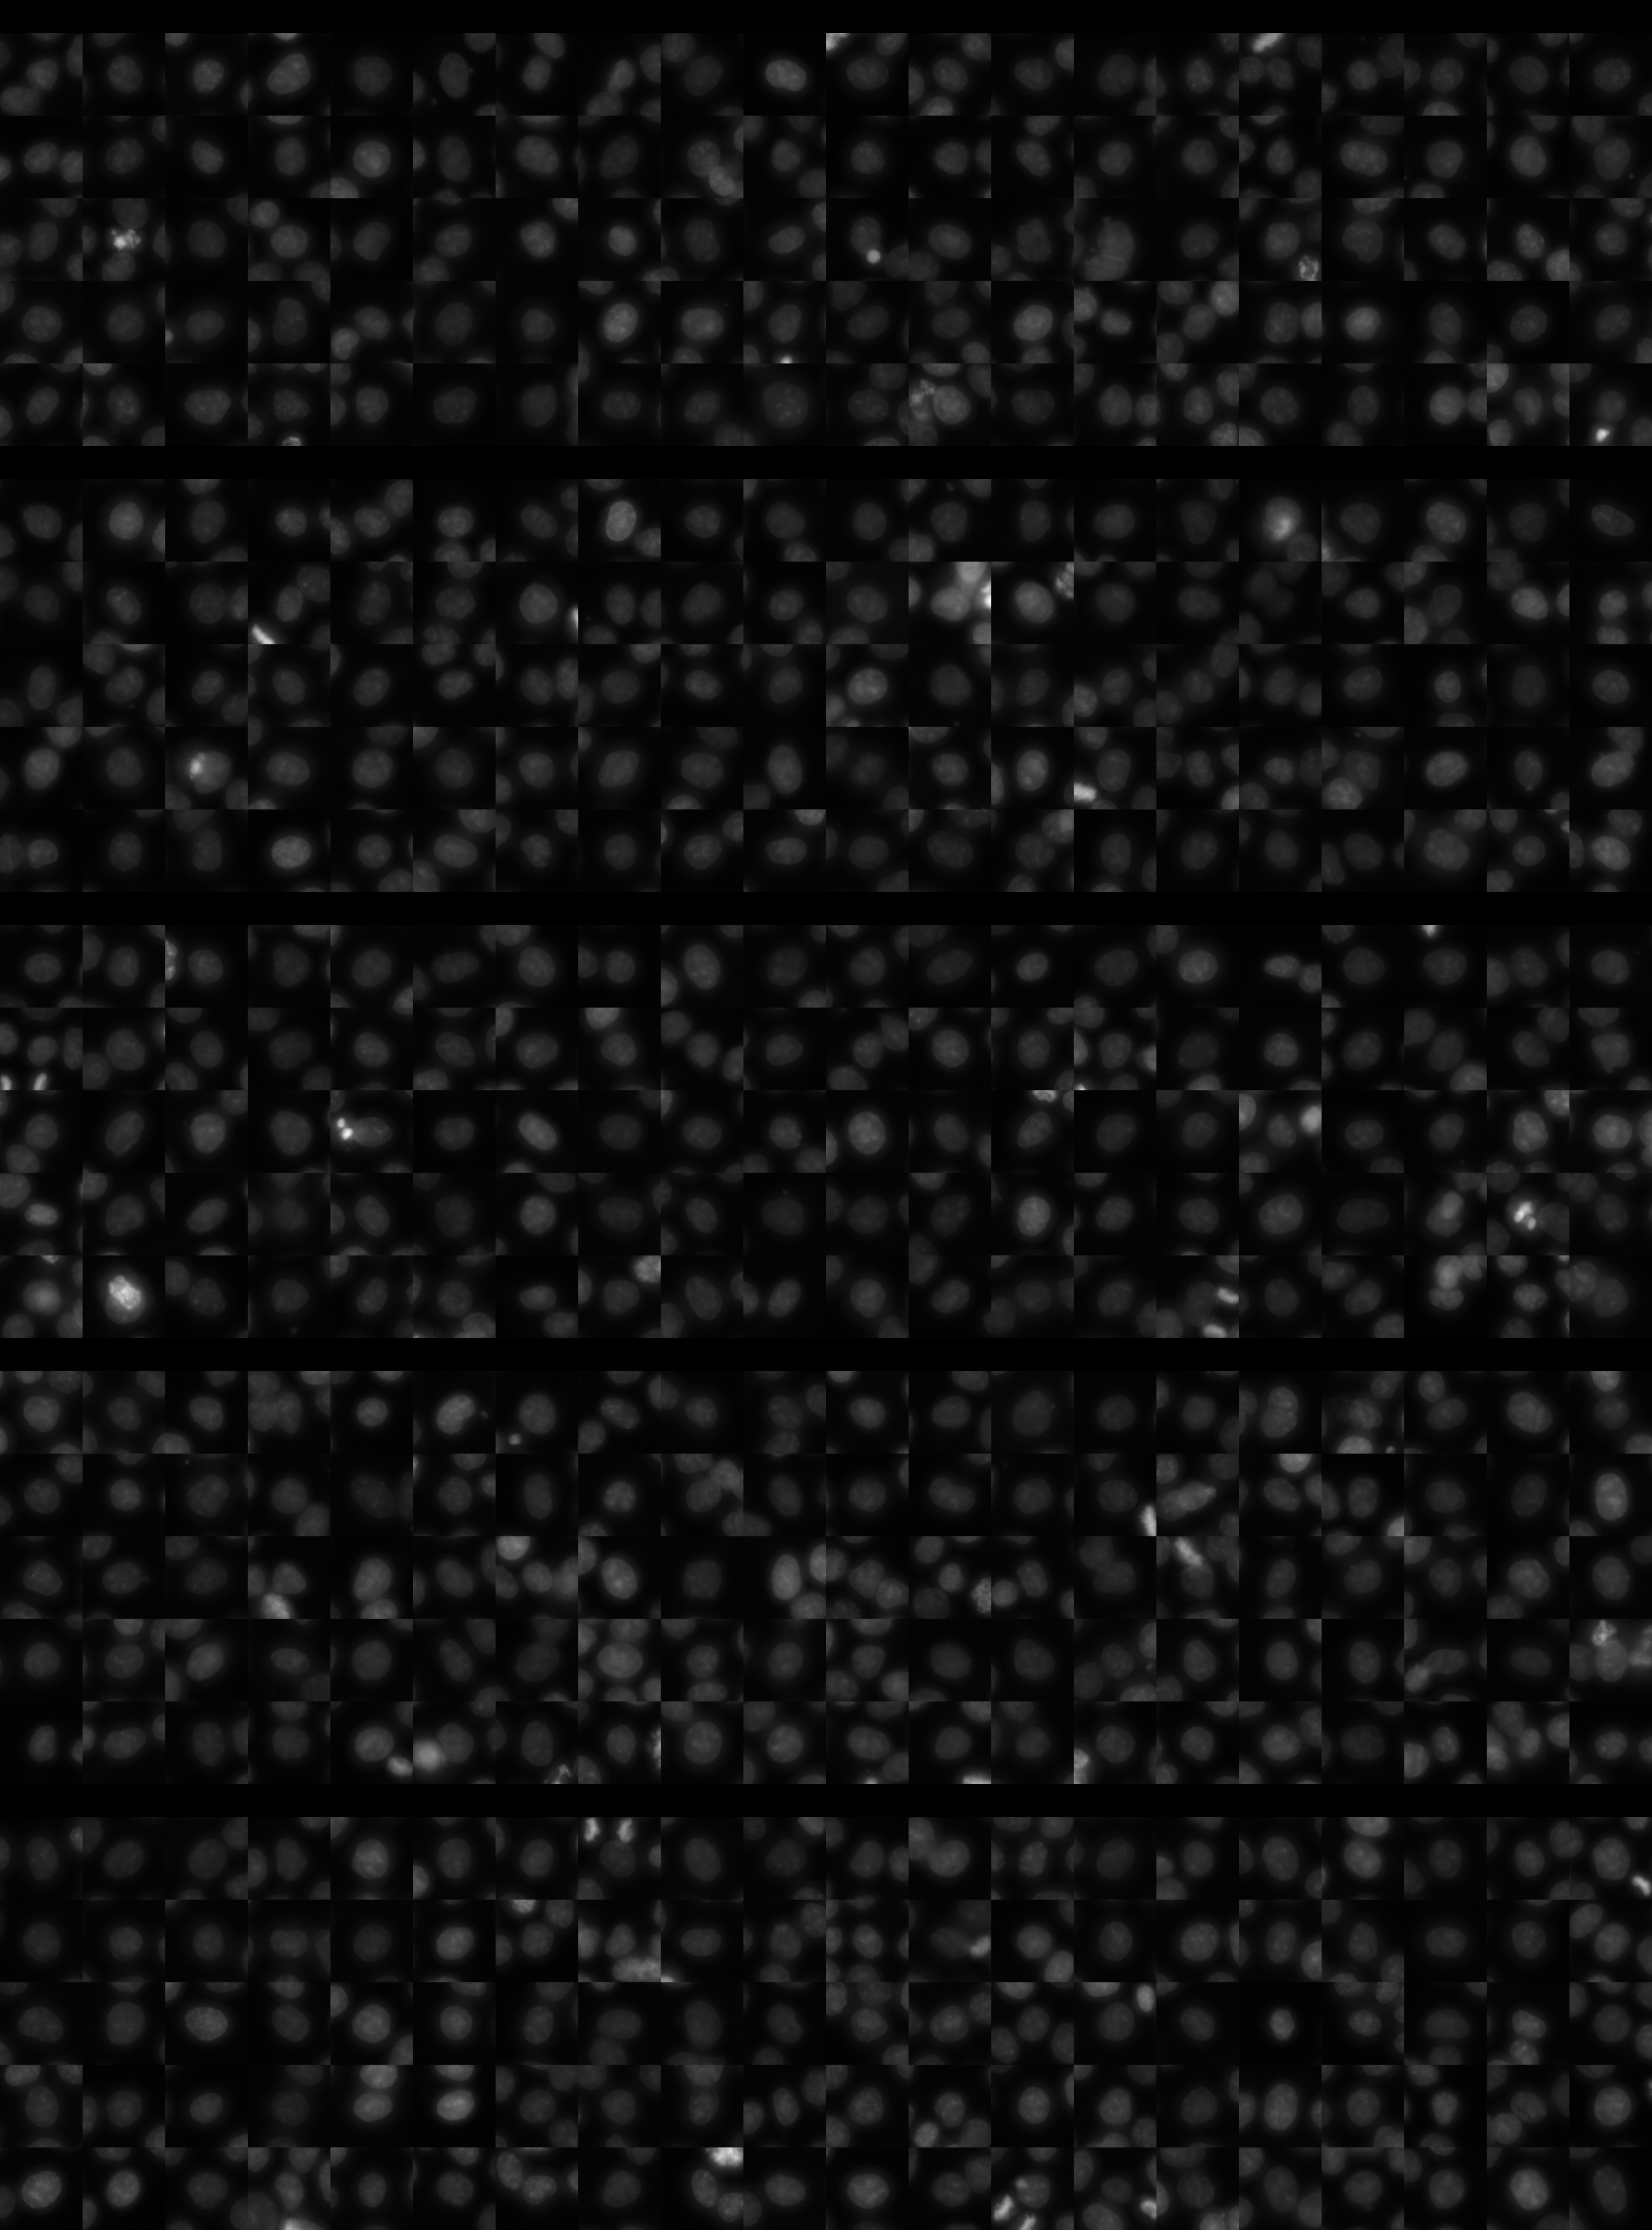
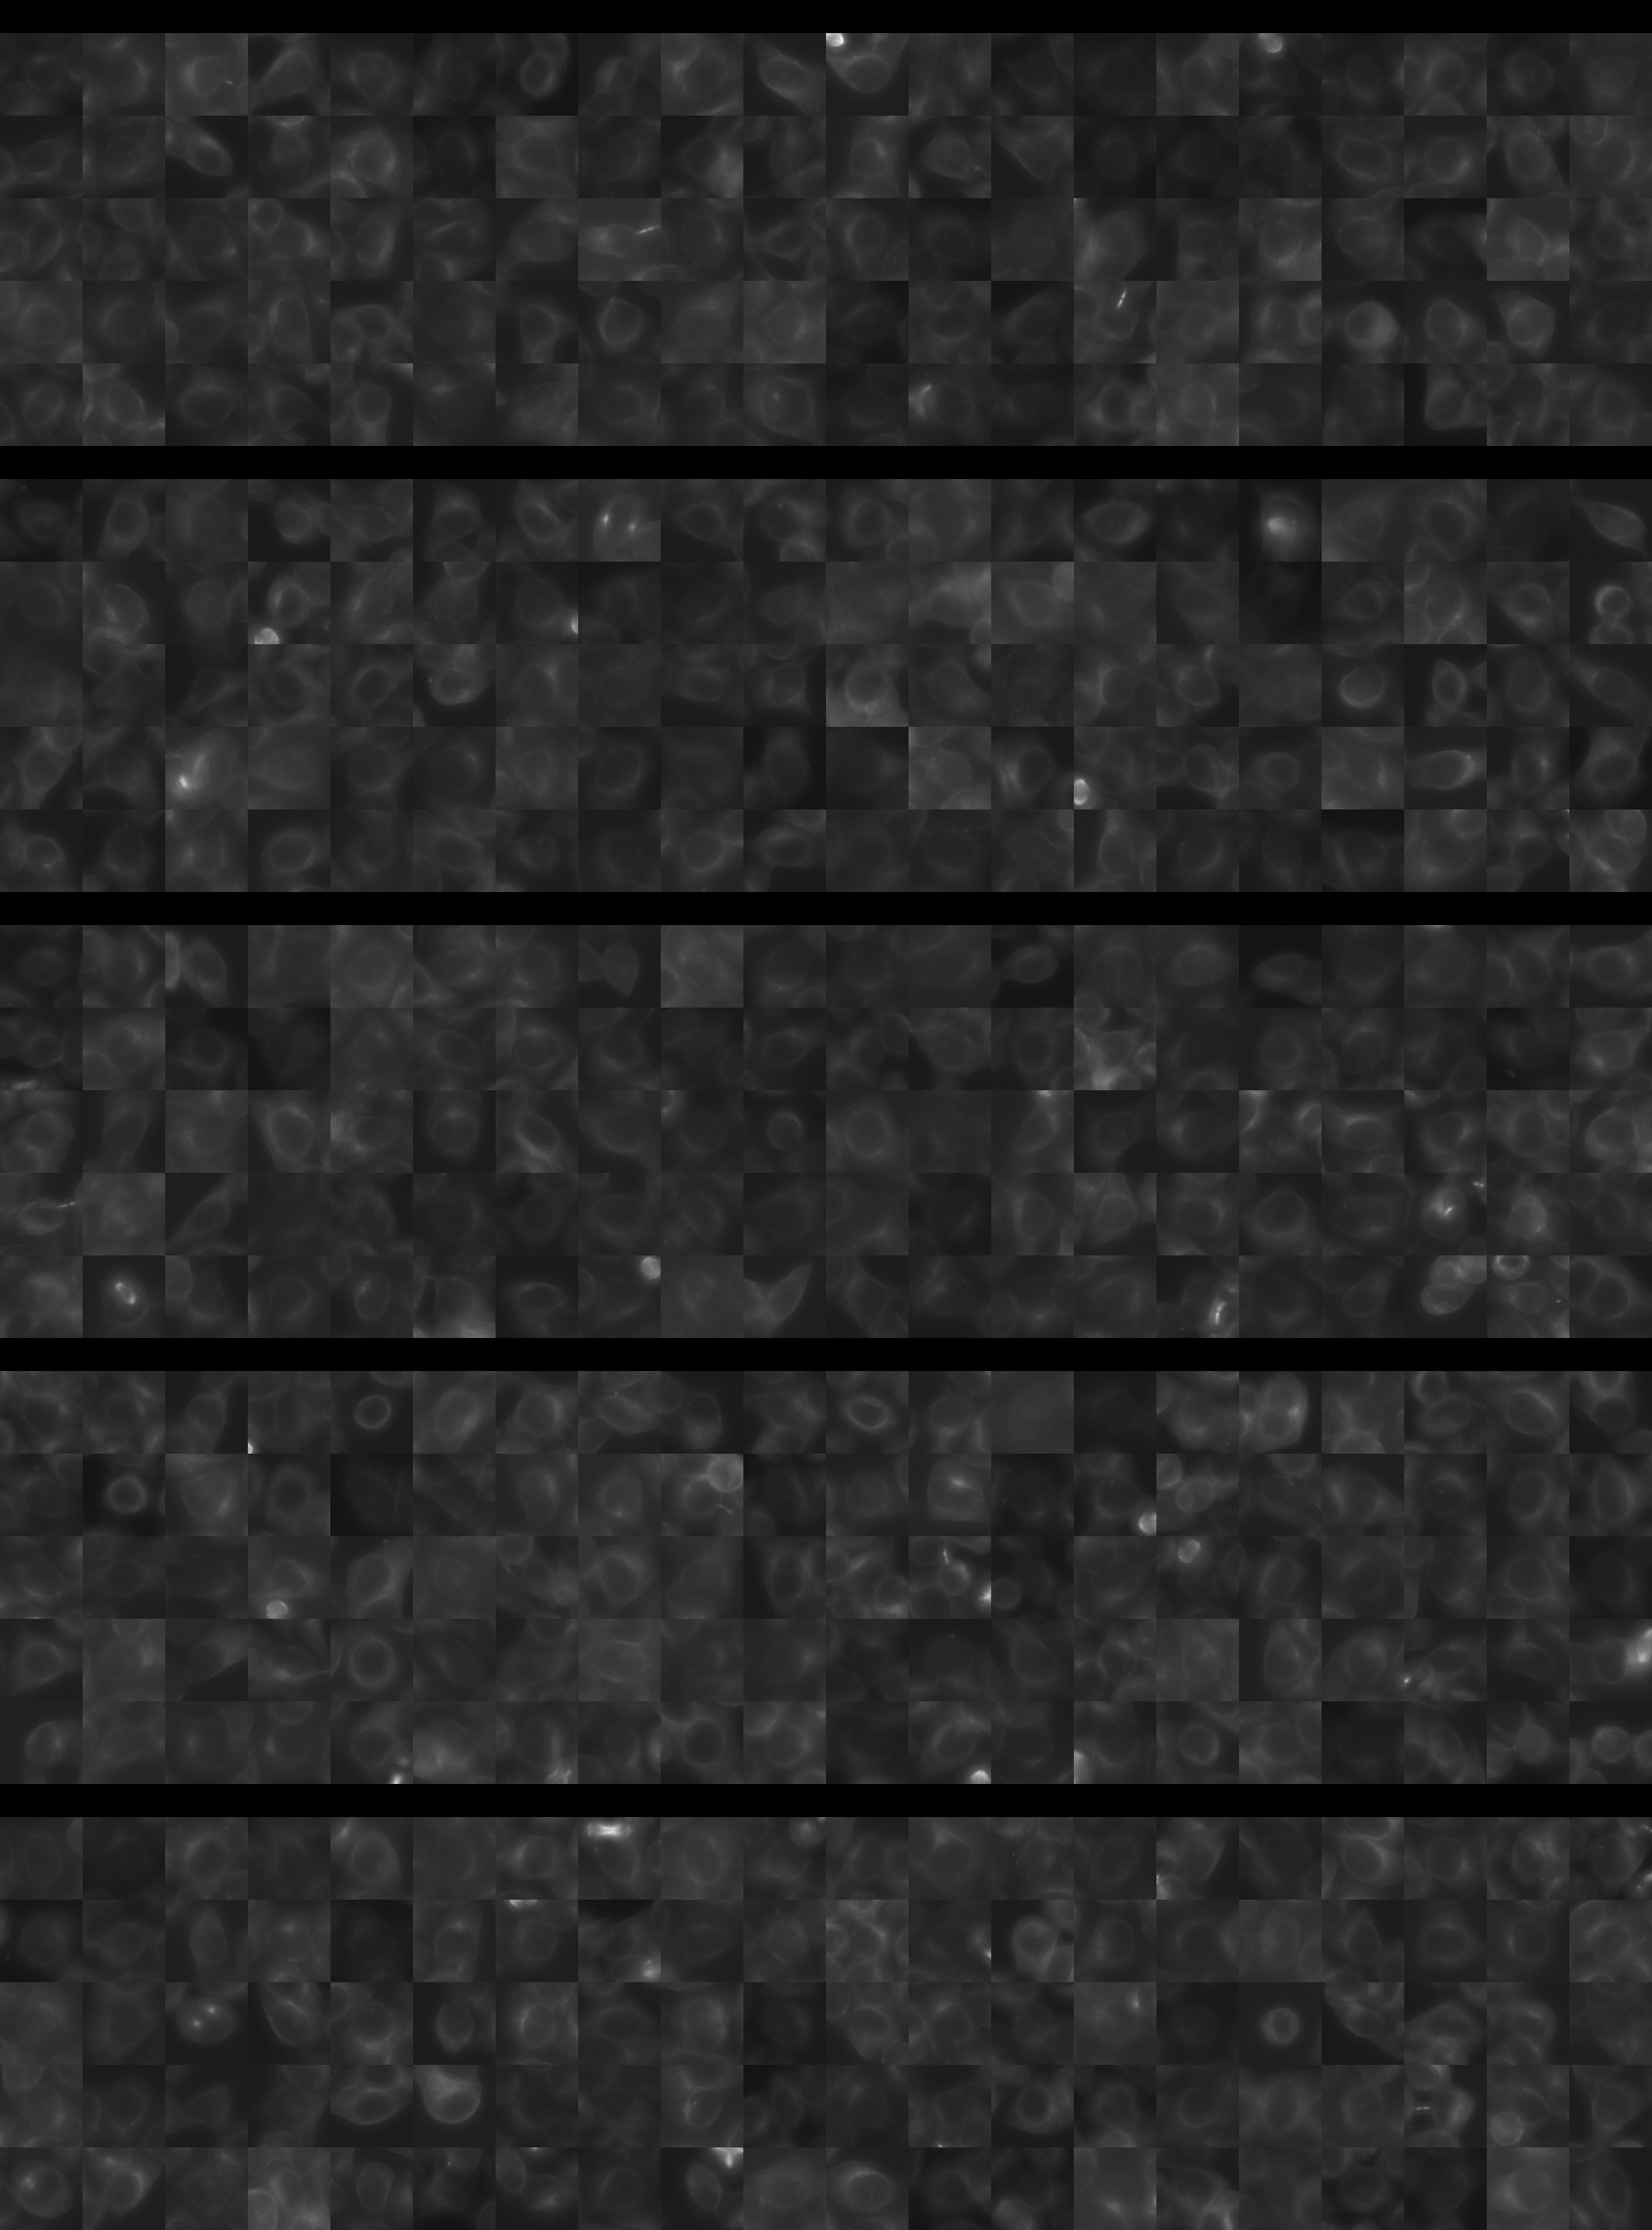
Each montage below shows randomly selected individual cell images for the same target gene separated by sgRNA, along with an example montage of cells expressing a non-targeting negative control sgRNA at the bottom. sgRNA labels in the montages correspond to the numbered sgRNA sequences in the gene info table above. The DNA (blue) and tubulin (green) channels are displayed by default, with gH2AX (grayscale) and actin (yellow) available using the check boxes. Channel brightness, contrast, and opacity are adjustable by clicking the arrow next to the channel name. When only one channel is selected, the display defaults to grayscale. Click the “Zoom” checkbox above the channel controls to enable image zooming (via scrolling) and panning (via click-and-drag).

The cell boxes displayed for this gene are square, 30.36 μm per side for the interphase montage and 30.36 μm per side for the mitotic montage.
Features

Interphase Score Rank FDR q-value
Nucleus DNA Integrated -1.365e-02 3770 of 5322 0.825
Nucleus DNA Mean -2.302e-01 5168 of 5322 1.505e-04
Nucleus gH2AX Mean -2.111e-01 5308 of 5322 1.367e-04
Nucleus DNA - gH2AX Correlation 0.024 562 of 5322 0.479
Nucleus Shape Area 0.171 313 of 5322 7.463e-04
Nucleus Shape Eccentricity 0.117 115 of 5322 4.529e-04
Nucleus Shape Form Factor -2.664e-01 5276 of 5322 2.872e-04
Nucleus Shape Solidity -1.734e-01 5003 of 5322 1.903e-04
Cell DNA Mass Displacement 0.076 452 of 5322 0.074
Cell Tubulin Mean -2.212e-01 5198 of 5322 2.141e-04
Cell Tubulin Mass Displacement 0.033 1160 of 5322 0.497
Cell Actin Mean -7.303e-01 5322 of 5322 1.723e-04
Cell Tubulin - Actin Correlation -2.830e-01 5319 of 5322 2.896e-04
Cell DNA - Tubulin Correlation -2.292e-01 5303 of 5322 1.948e-04
Cell Shape Area 0.101 595 of 5322 0.043
Cell Shape Eccentricity 0.055 450 of 5322 0.263
Mitotic Score Rank FDR q-value
Nucleus DNA Integrated 0.186 1410 of 5322 0.858
Nucleus DNA Mean 0.175 753 of 5322 1.000
Nucleus DNA Mass Displacement -1.647e-01 5090 of 5322 0.999
Nucleus DNA Mean Frac 3 -2.269e-01 5107 of 5322 1.000
Nucleus gH2AX Mean 0.090 1737 of 5322 1.000
Nucleus gH2AX Mean Frac 0 0.180 408 of 5322 1.000
Nucleus Tubulin Mean Frac 0 0.111 1818 of 5322 0.999
Nucleus Tubulin Mean Edge 0.306 286 of 5322 0.743
Nucleus Tubulin Std Edge 0.146 812 of 5322 0.999
Nucleus Shape Area 0.104 2615 of 5322 0.989
Nucleus Shape Eccentricity 0.213 188 of 5322 1.000
Nucleus Shape Form Factor -2.475e-01 4515 of 5322 0.971
Cell Tubulin Mean 0.353 260 of 5322 0.533
Cell Tubulin Mean Frac 3 -3.852e-01 5001 of 5322 0.477
Cell Actin Mean -4.595e-01 5305 of 5322 0.111
Cell Shape Area 0.157 1893 of 5322 0.998
( Reset Zoom )
Brightness
Contrast
Opacity
Brightness
Contrast
Opacity
Brightness
Contrast
Opacity
Brightness
Contrast
Opacity
Brightness
Contrast
Opacity

( Reset Zoom )
Brightness
Contrast
Opacity
Brightness
Contrast
Opacity
Brightness
Contrast
Opacity
Brightness
Contrast
Opacity
Brightness
Contrast
Opacity

MIT Central Accessability