RAD21

Gene symbol: RAD21
Gene: 5885
Uniprot Function: As a member of the cohesin complex, involved in sister chromatid cohesion from the time of DNA replication in S phase to their segregation in mitosis, a function that is essential for proper chromosome segregation, post-replicative DNA repair, and the prevention of inappropriate recombination between repetitive regions (PubMed:11509732). The cohesin complex may also play a role in spindle pole assembly during mitosis (PubMed:11590136). In interphase, cohesins may function in the control of gene expression by binding to numerous sites within the genome (By similarity). May control RUNX1 gene expression (Probable). Binds to and represses APOB gene promoter (PubMed:25575569). May play a role in embryonic gut development, possibly through the regulation of enteric neuron development (By similarity).
Mitotic Index 0.0588
Interphase Cluster: #218 (7 genes)
Mitotic Cluster: #11 (44 genes)
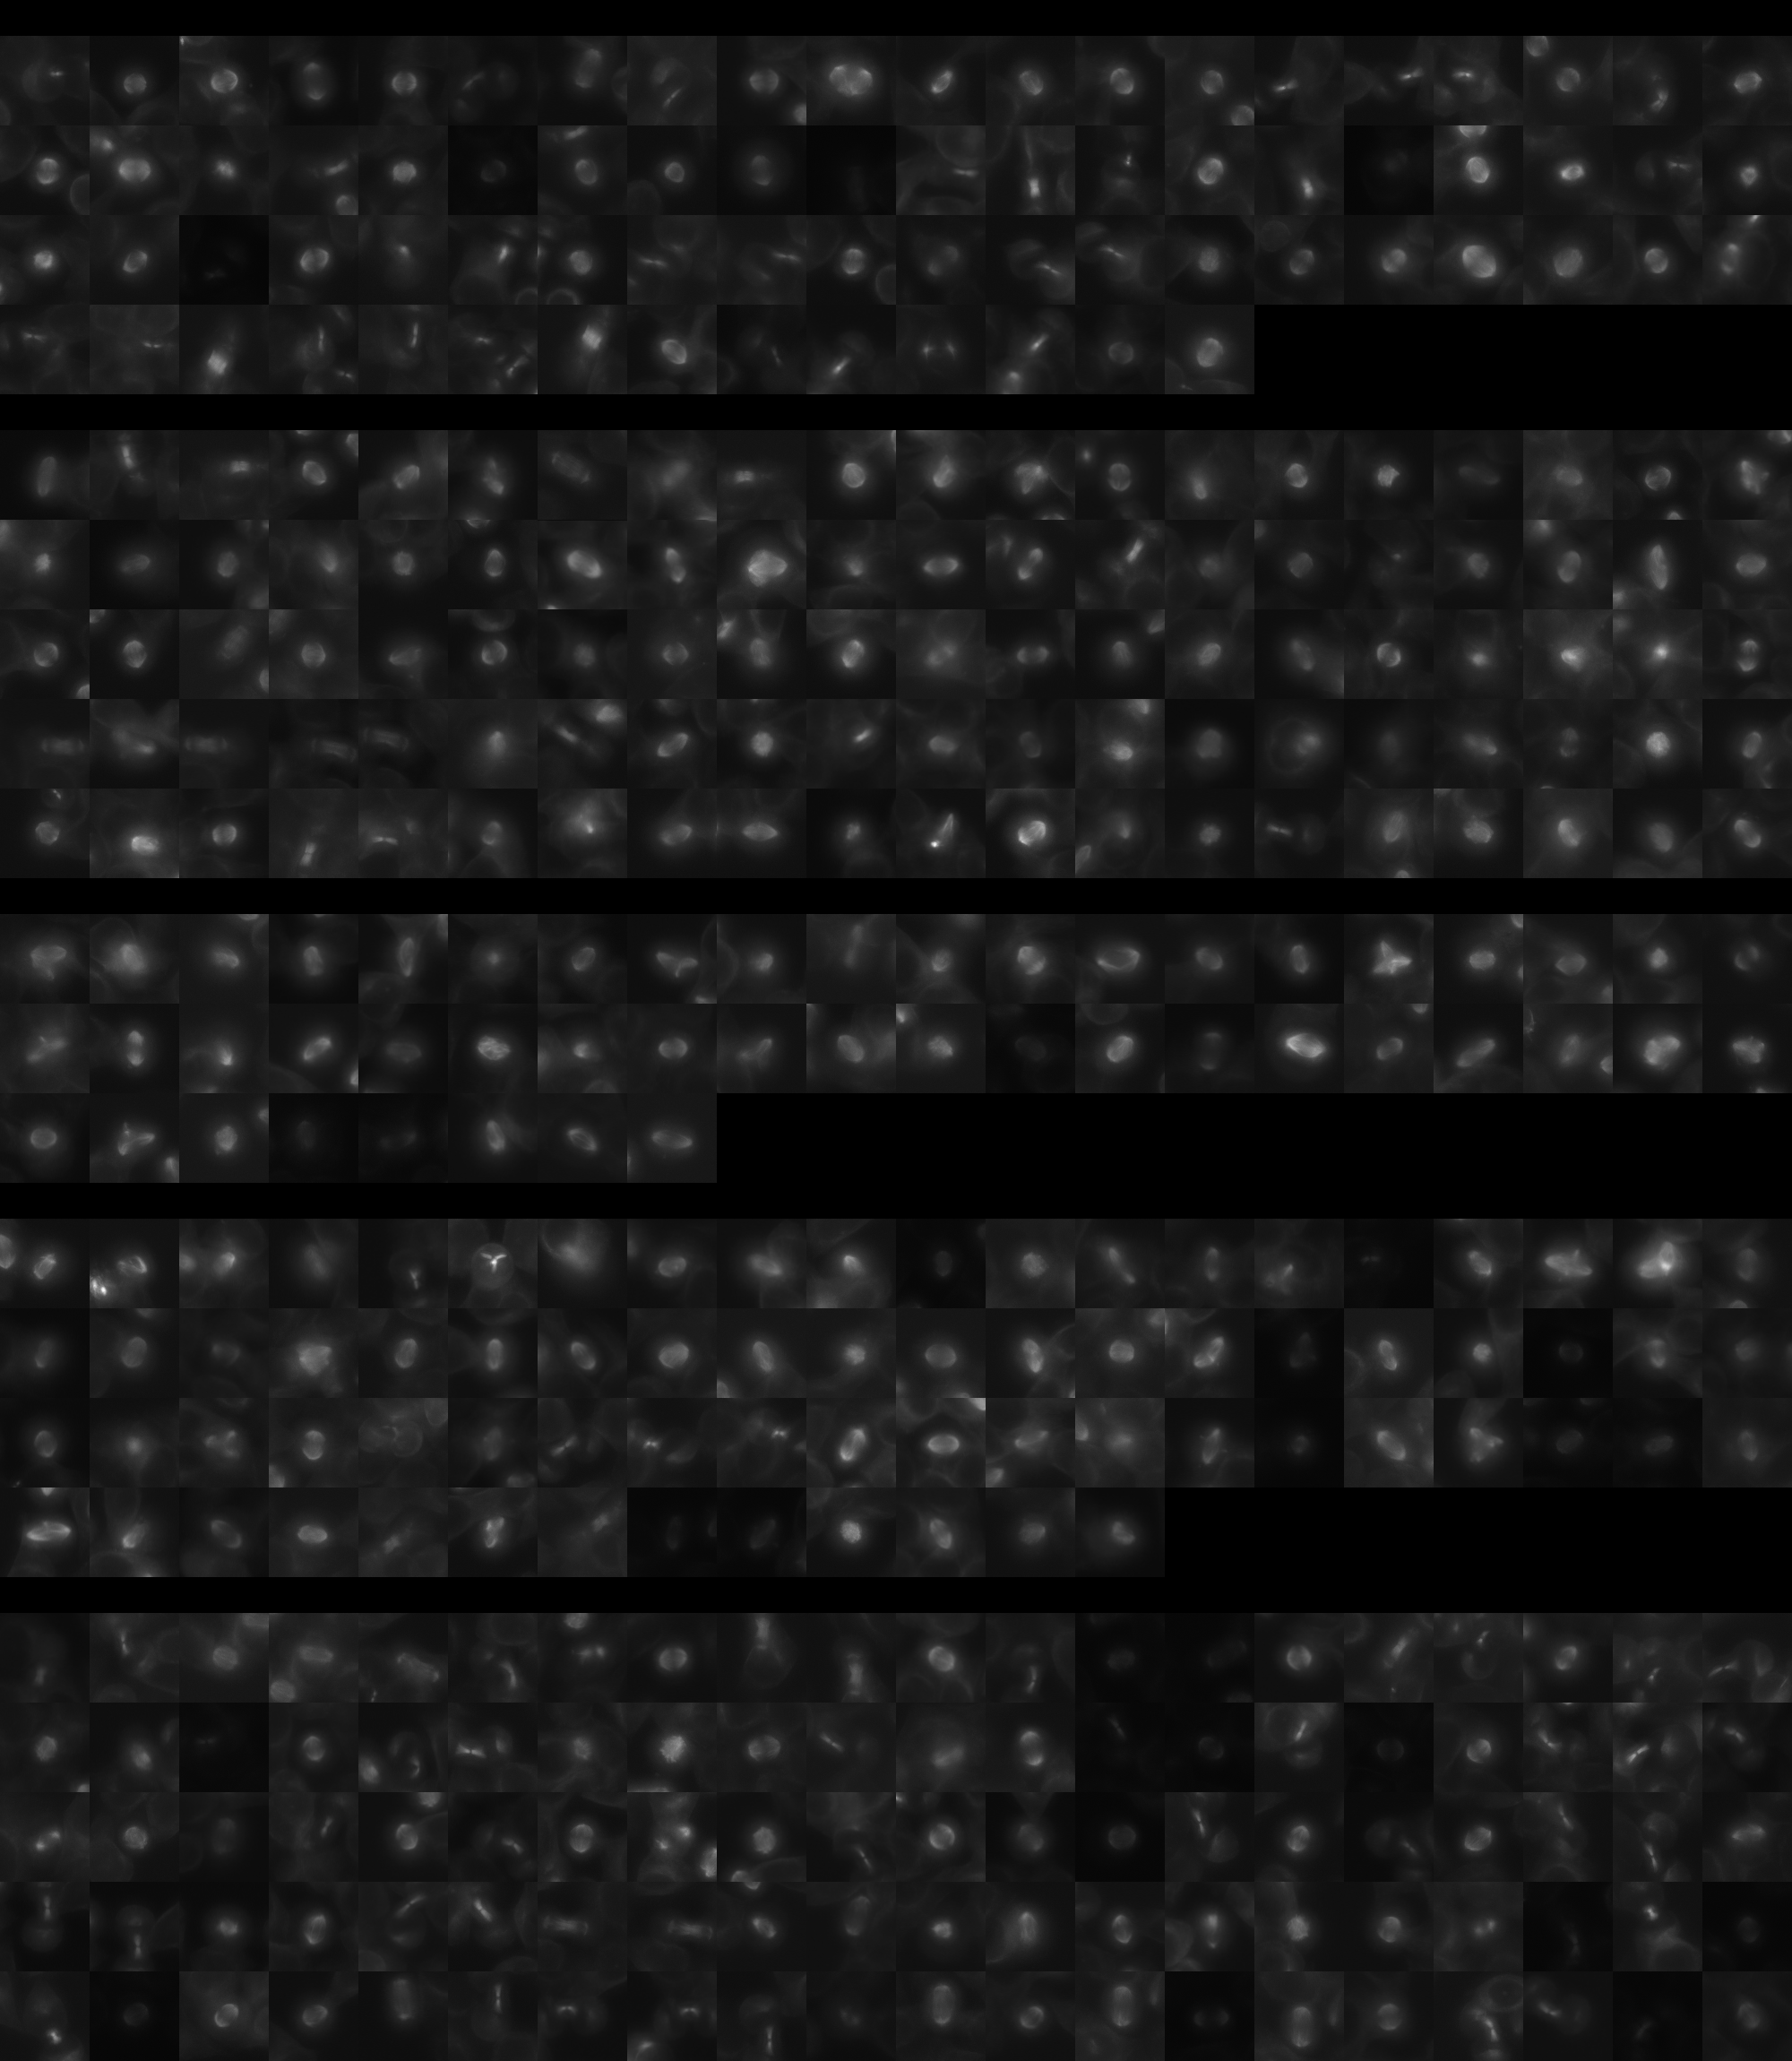
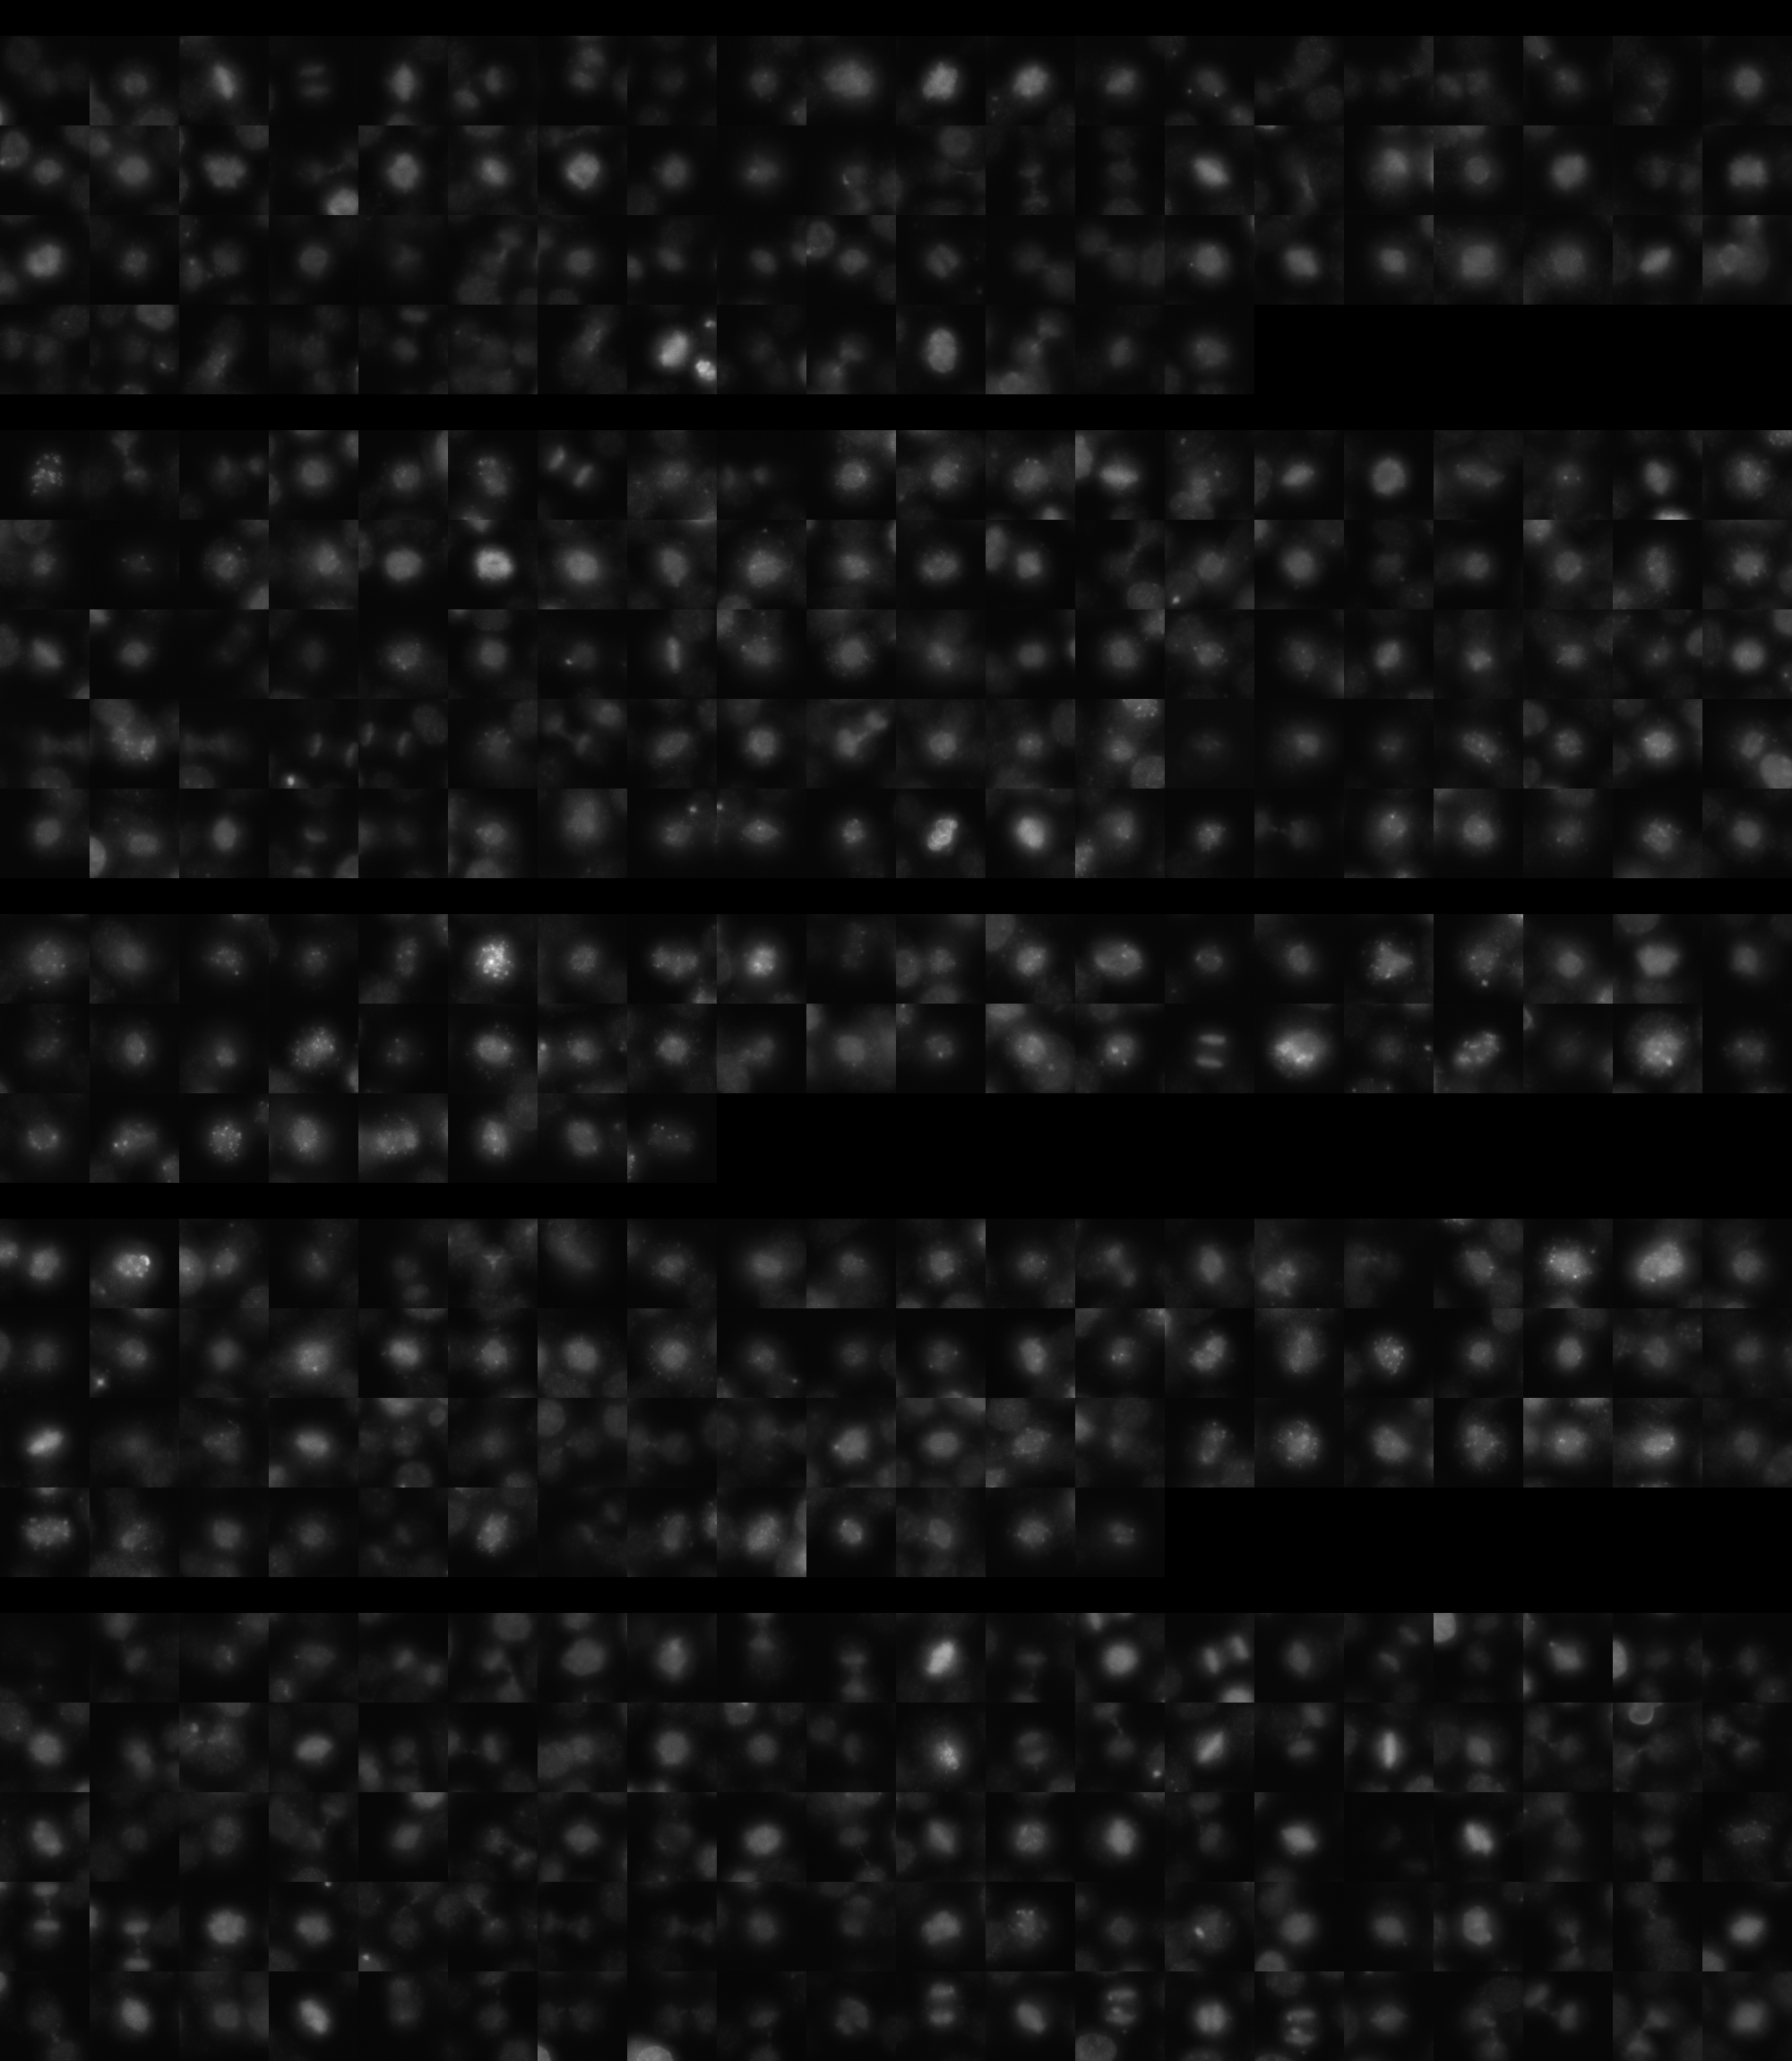
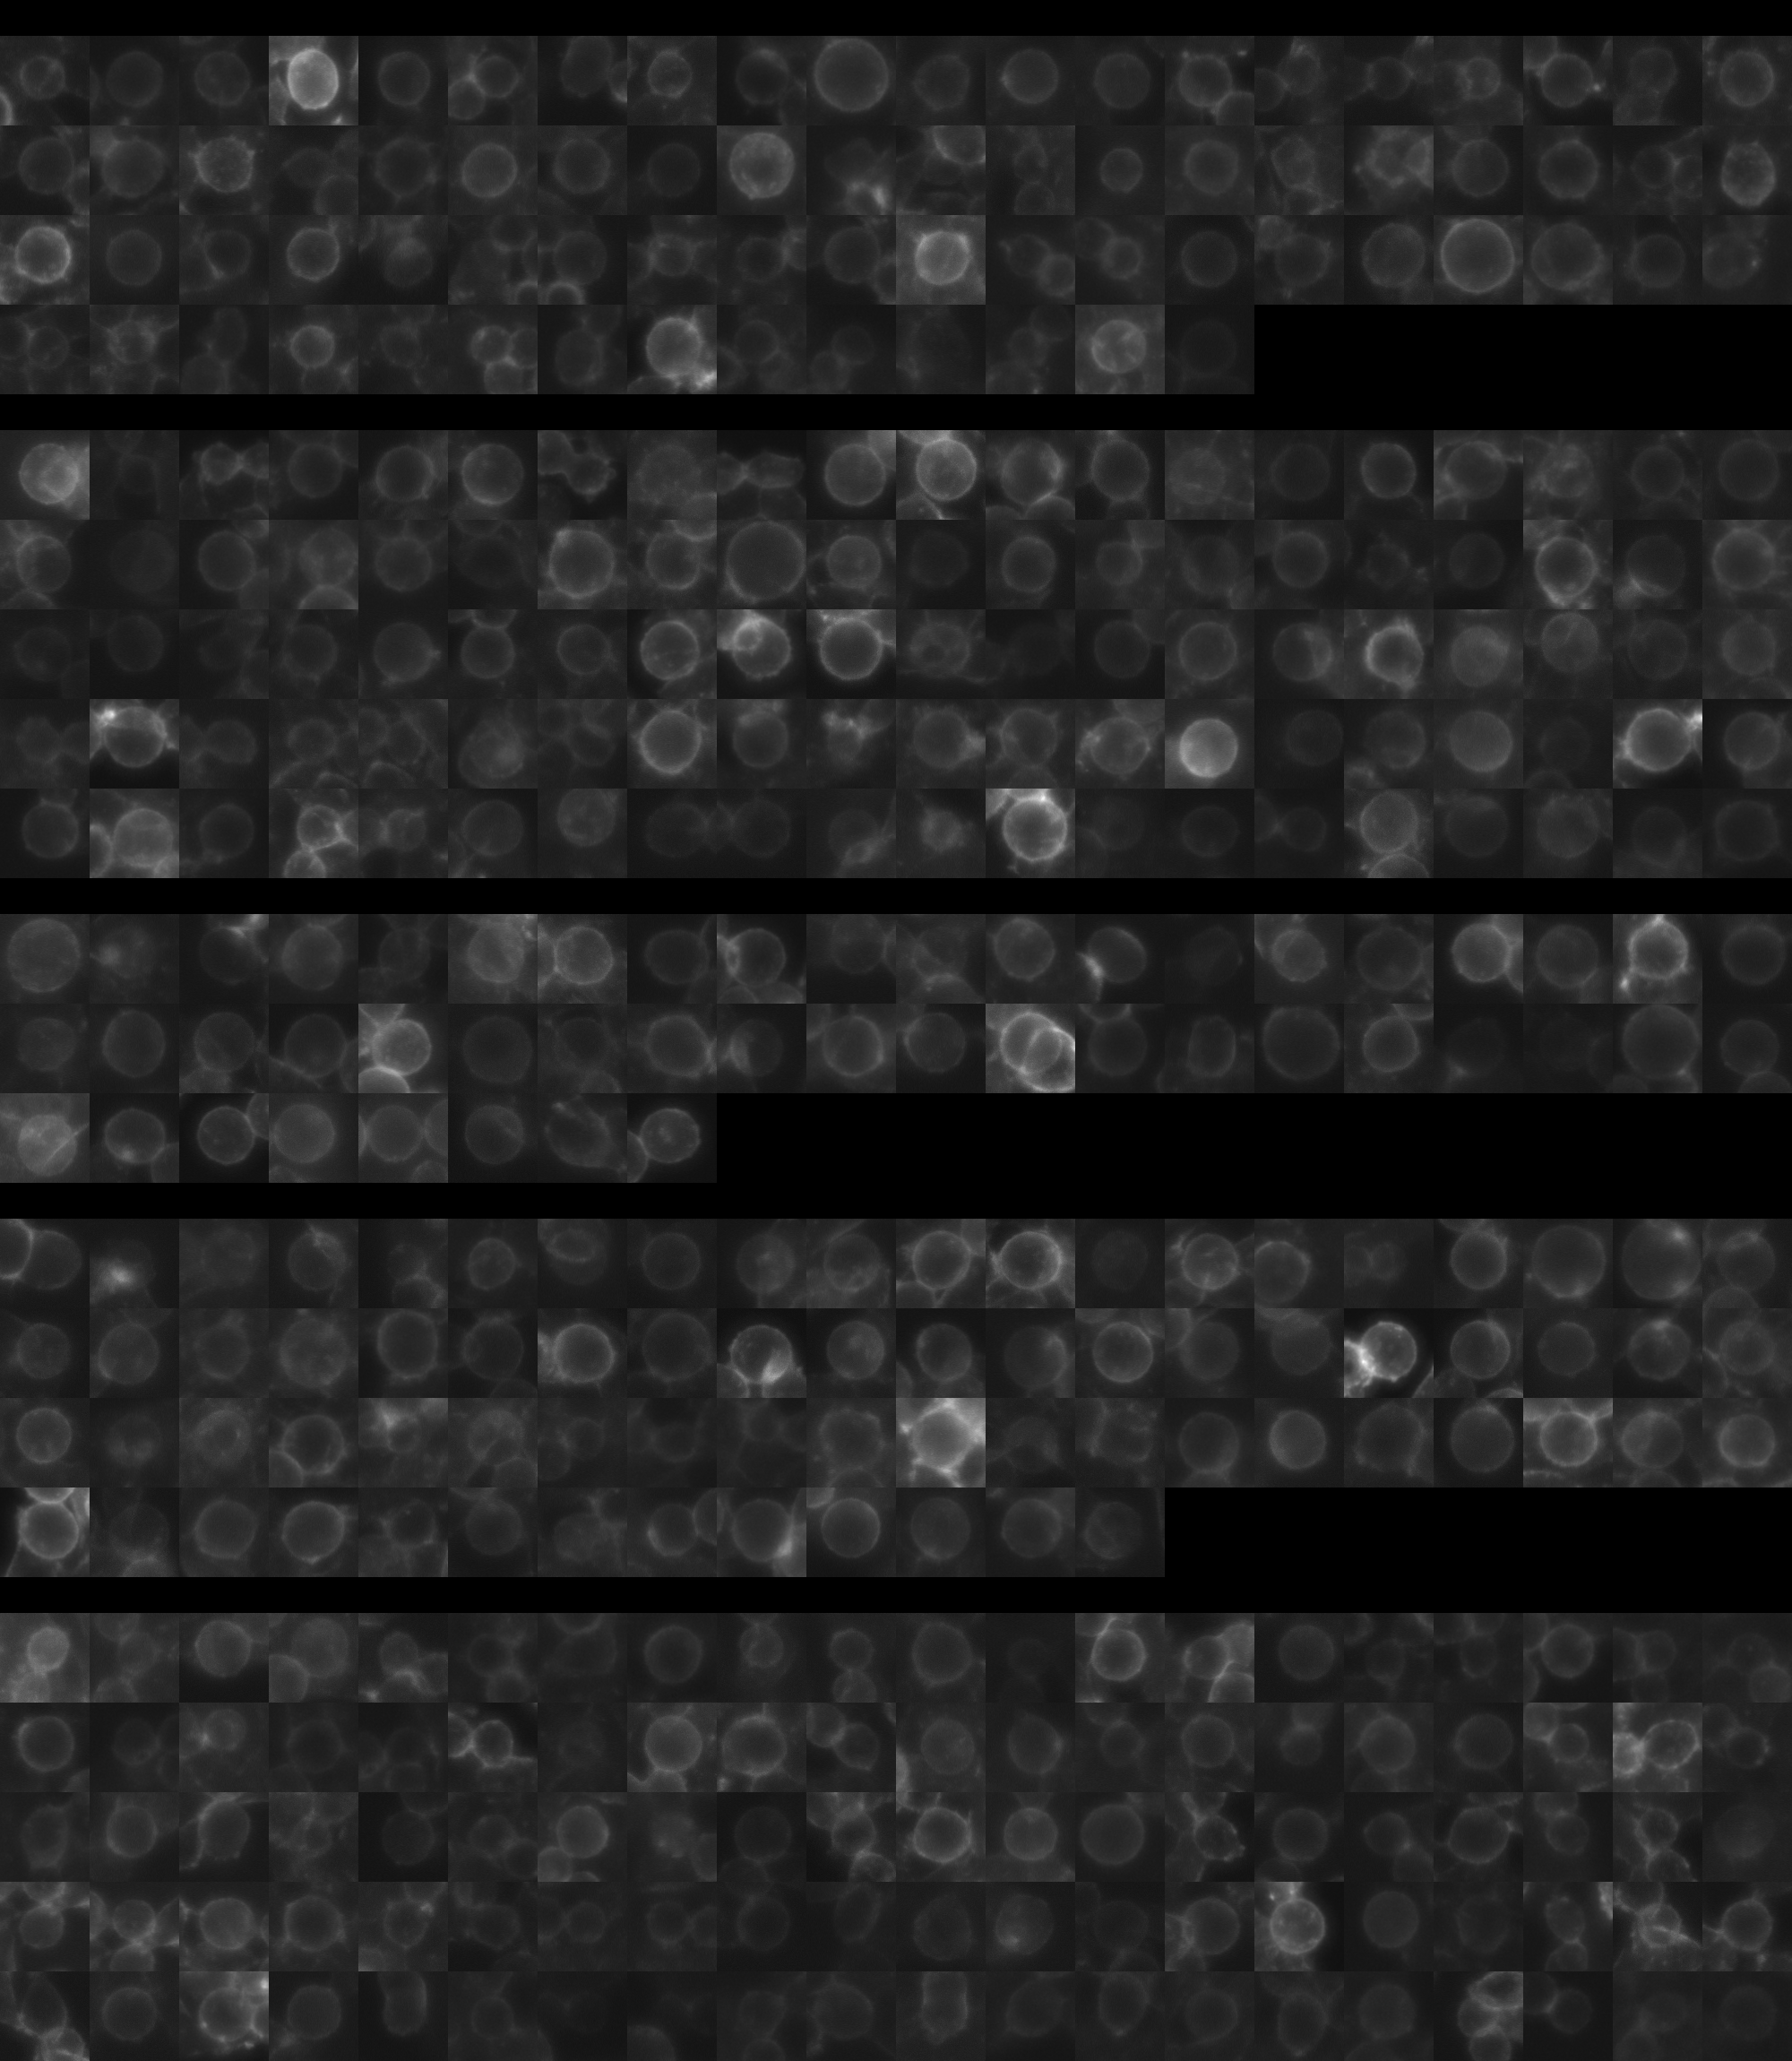
sgRNA 1: AAGTGTTGTTTGATCAGTCA (interphase cells: 2662, mitotic cells: 74)
sgRNA 2: ACATACTCTAAGTCAGGCAG (interphase cells: 1849, mitotic cells: 138)
sgRNA 3: GGAGAGTATCATCTCACCAA (interphase cells: 195, mitotic cells: 48)
sgRNA 4: TCTGTTCAGACTCTAATAGG (interphase cells: 620, mitotic cells: 73)

Interphase Cluster

Mitotic Cluster

Overview

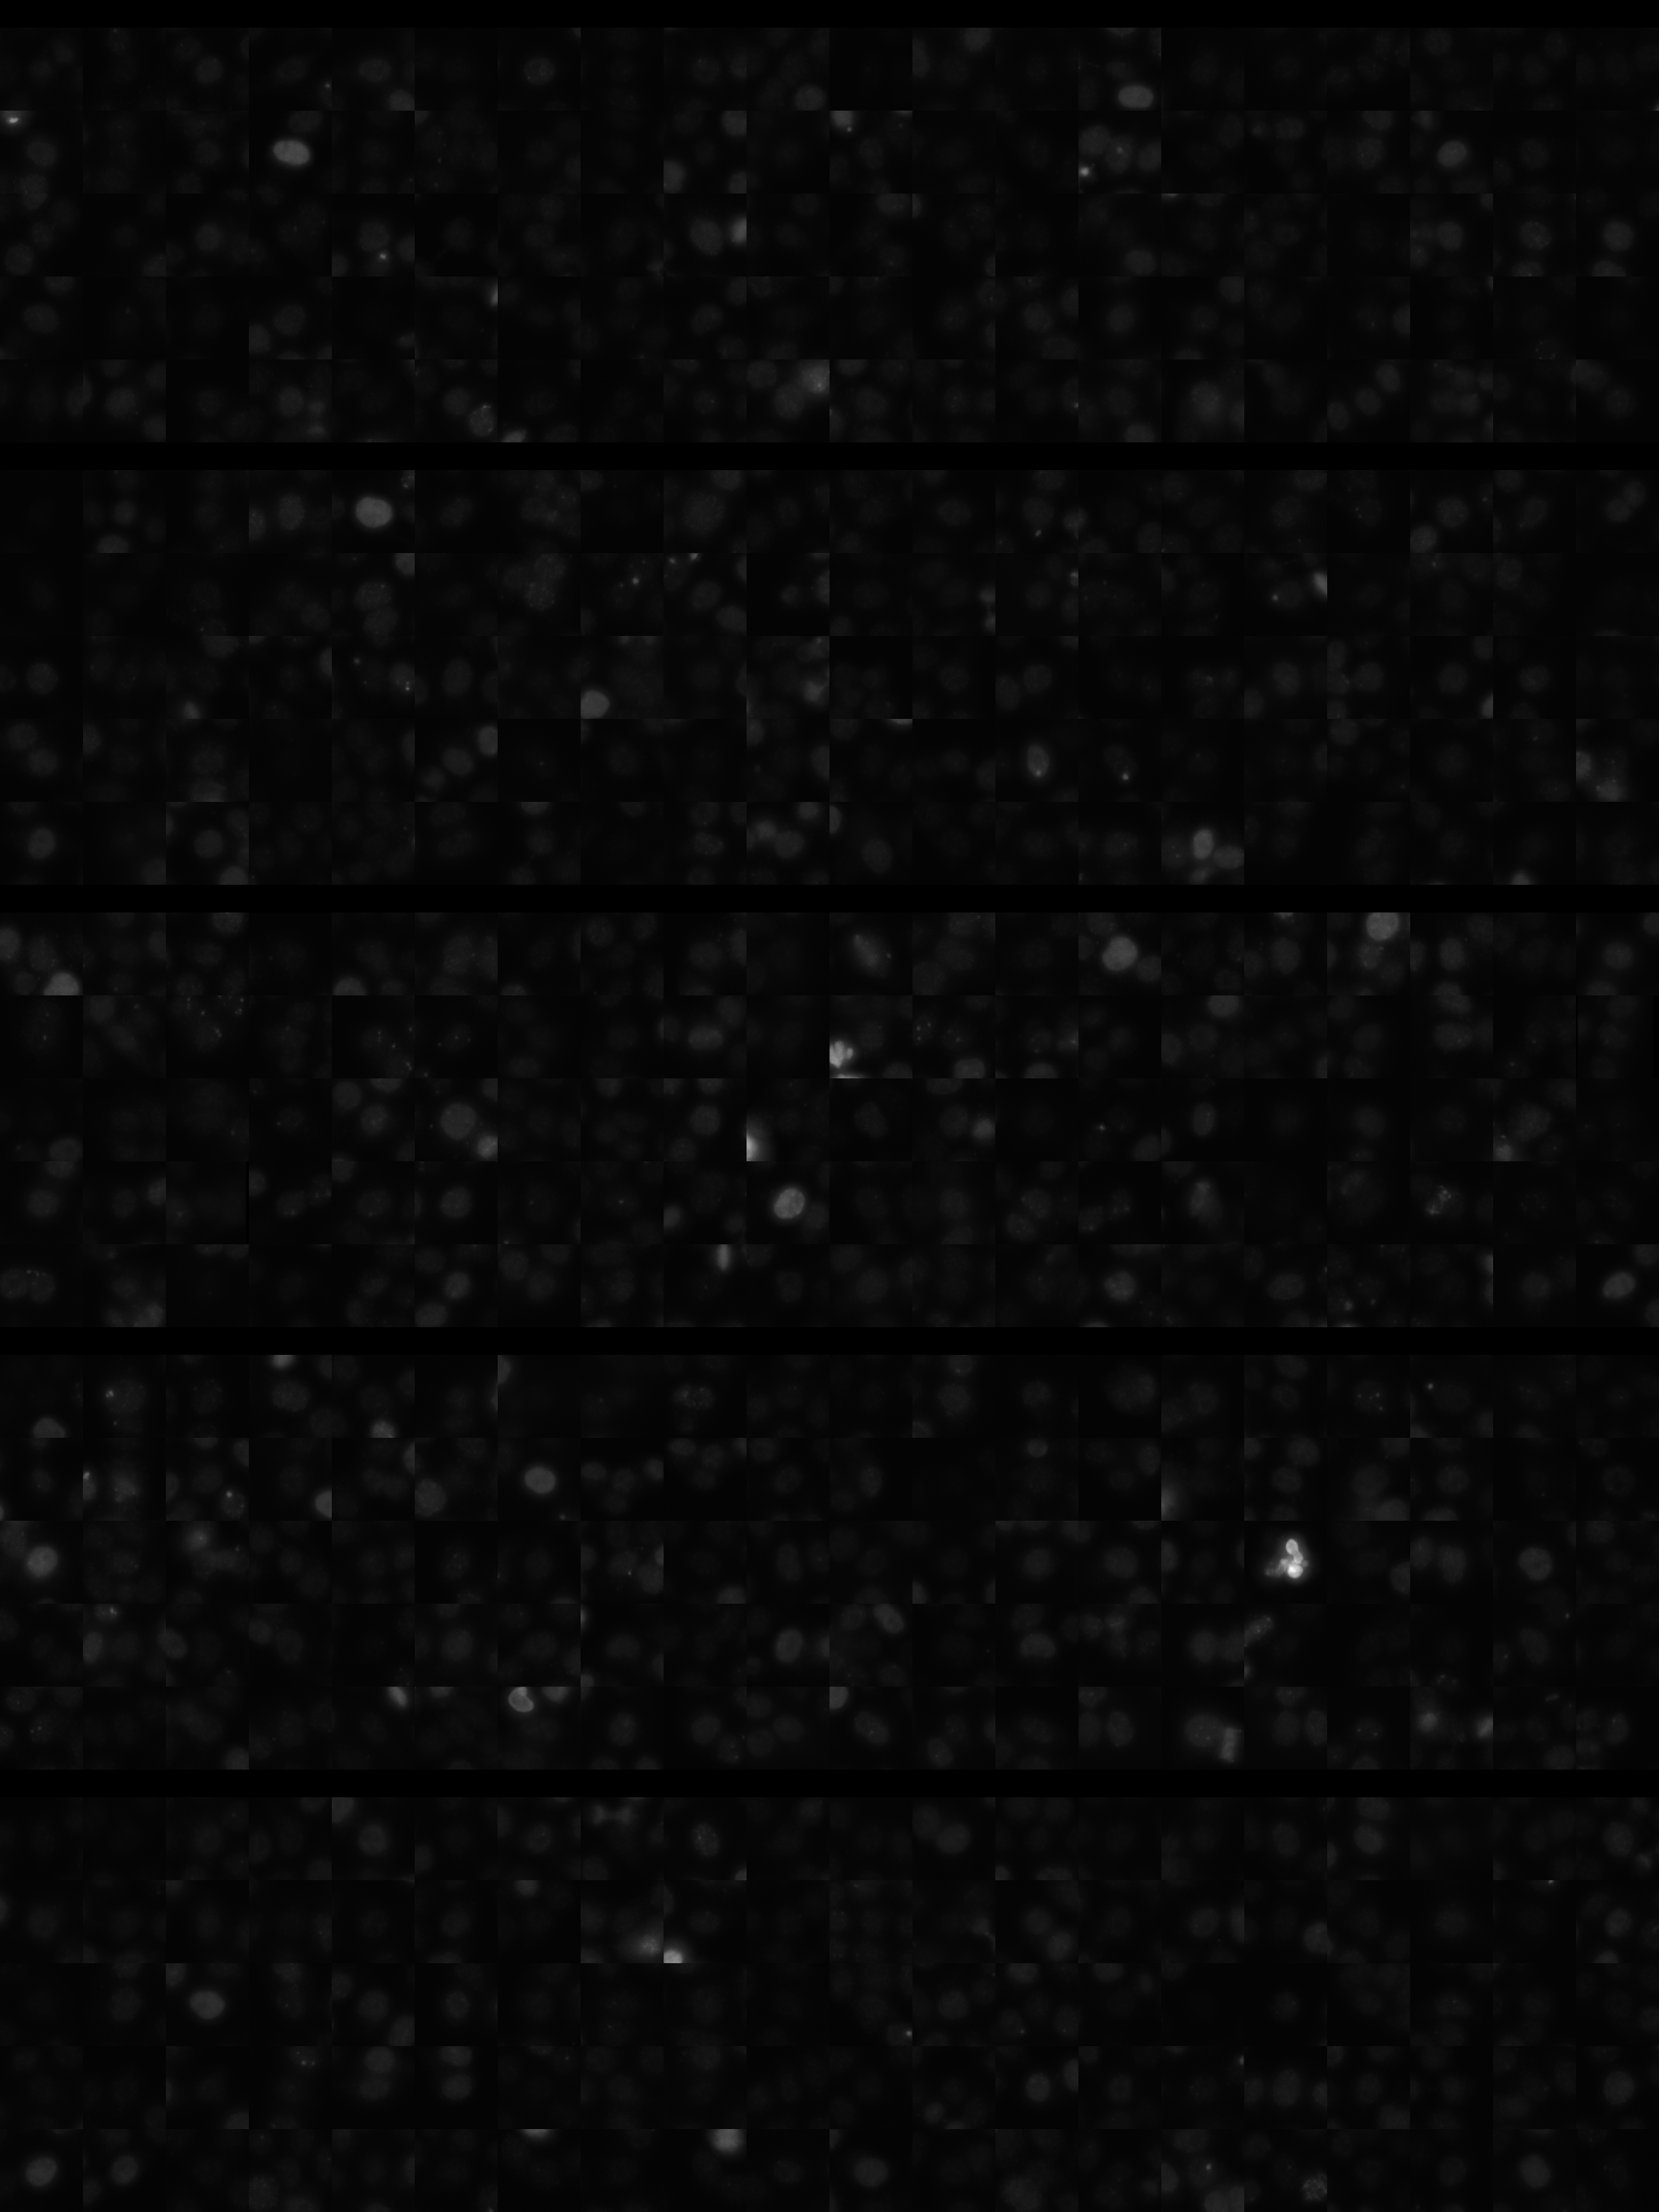
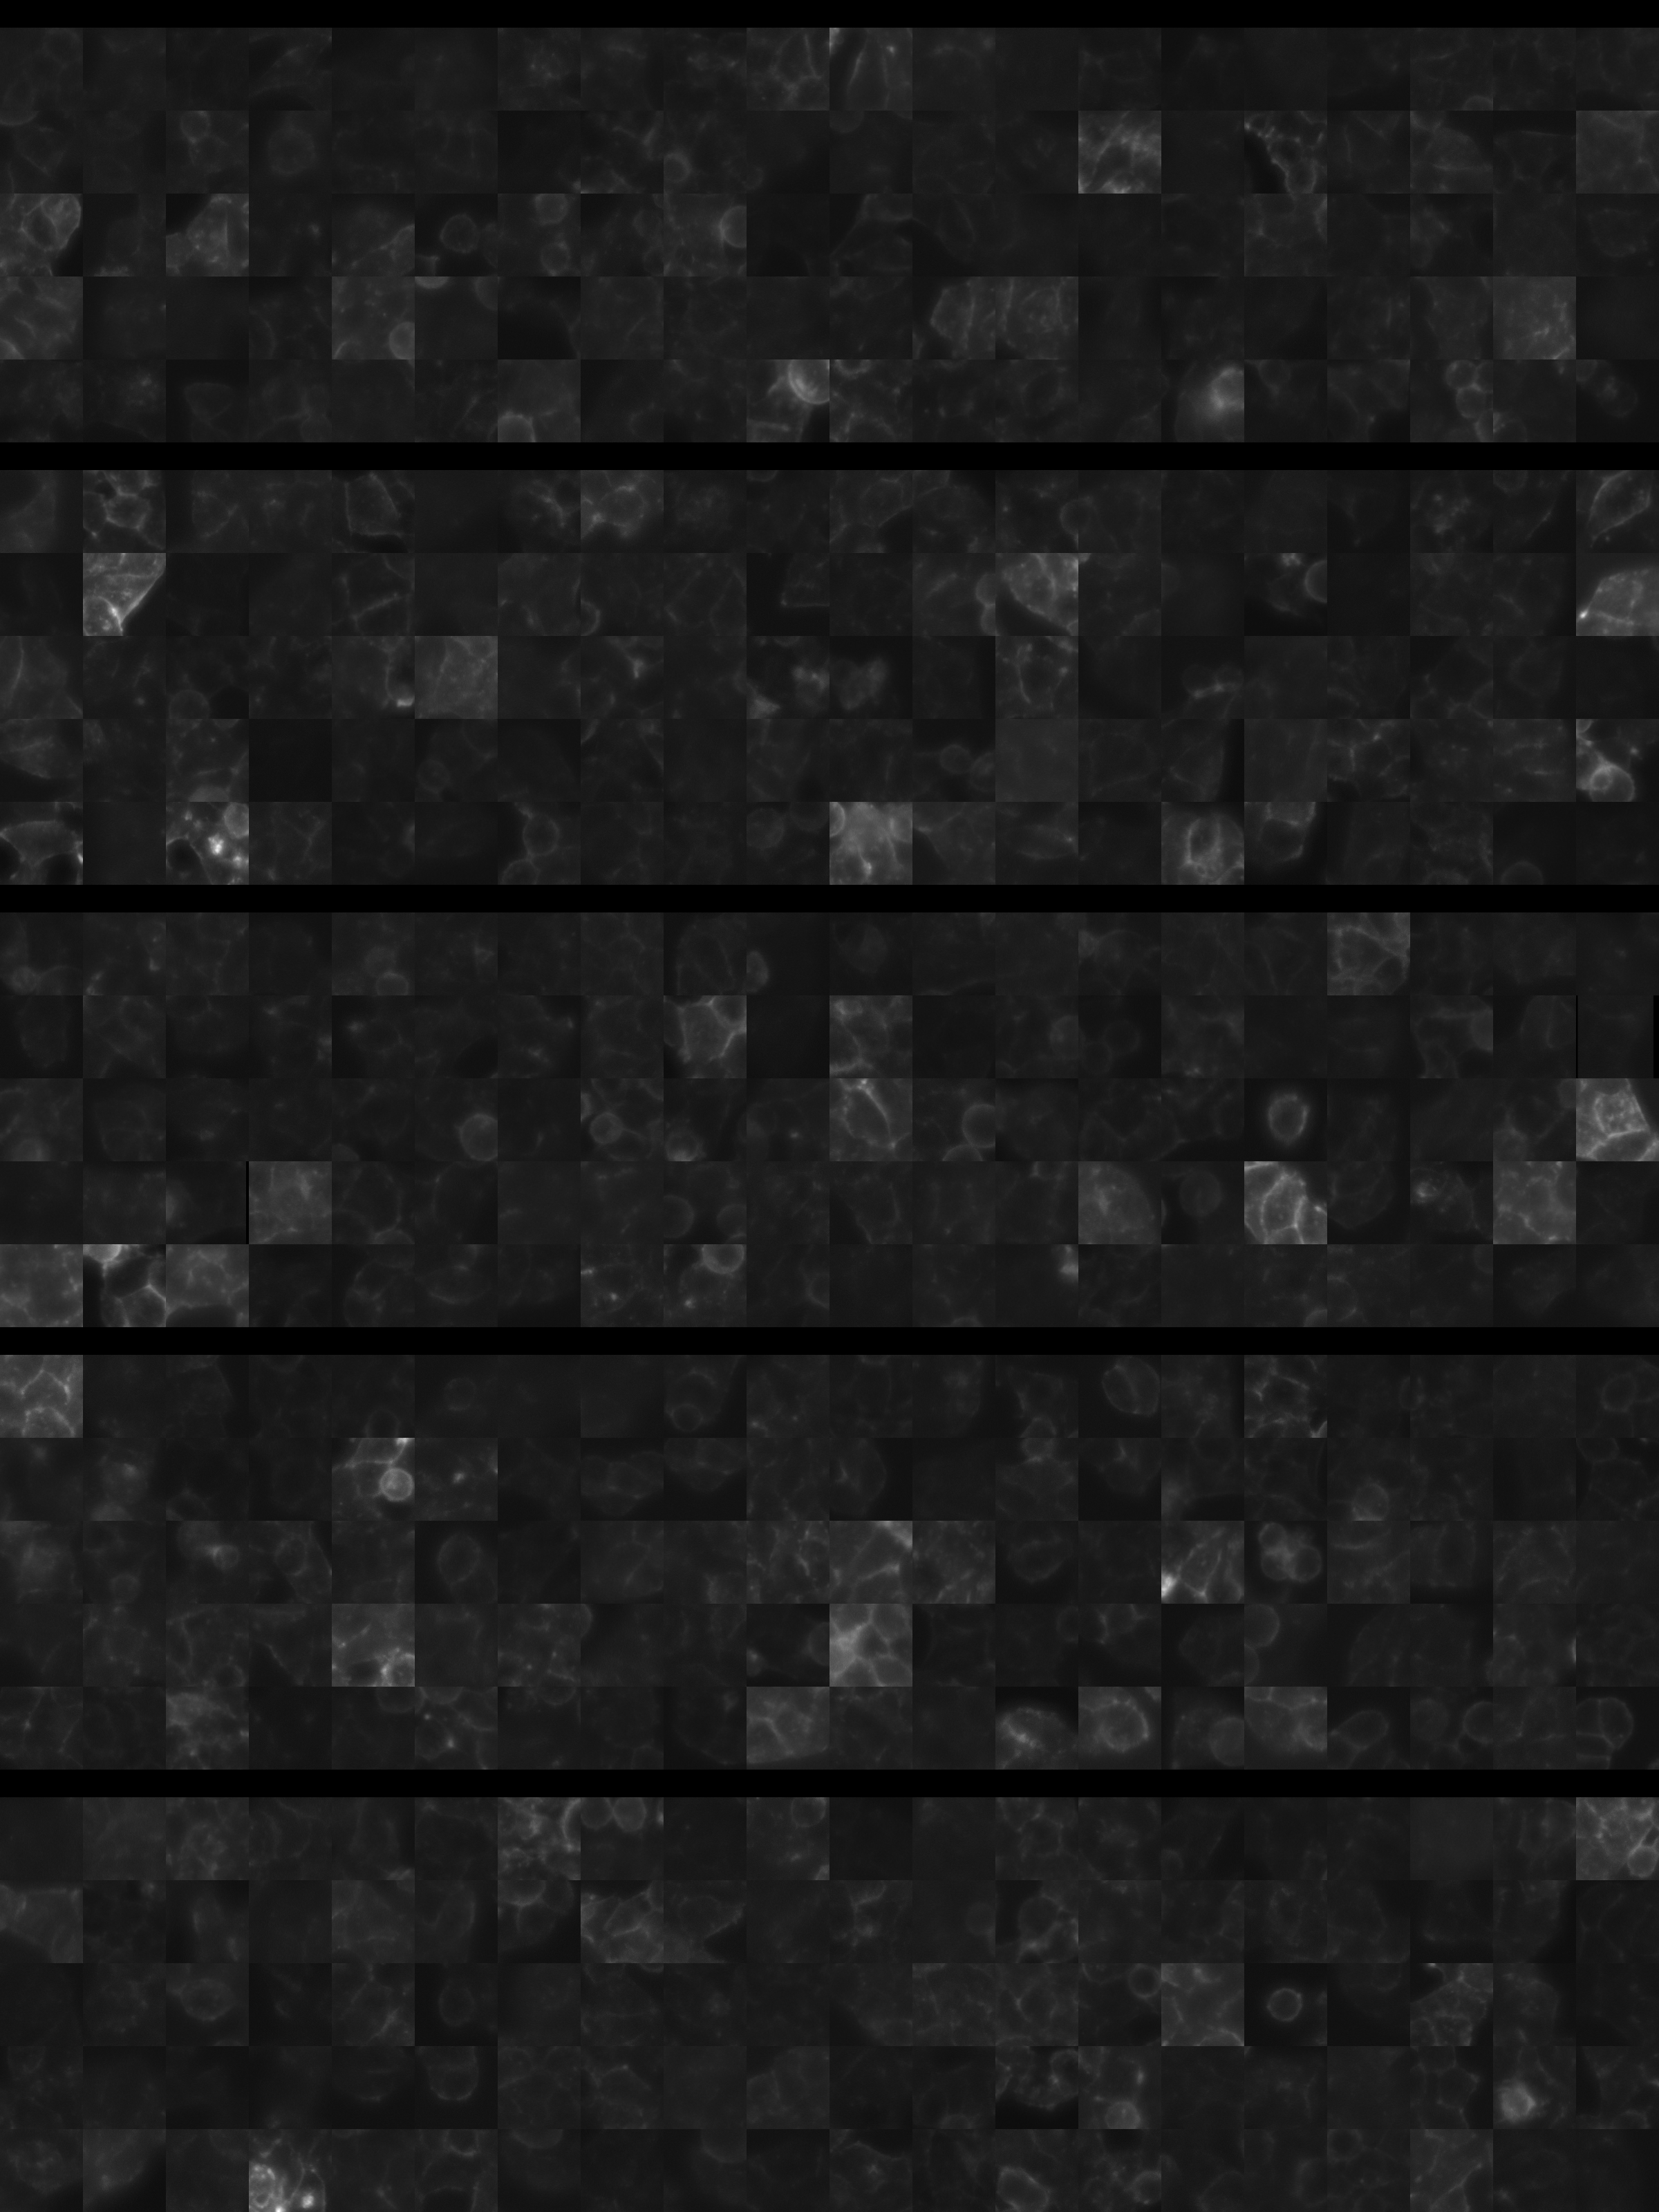
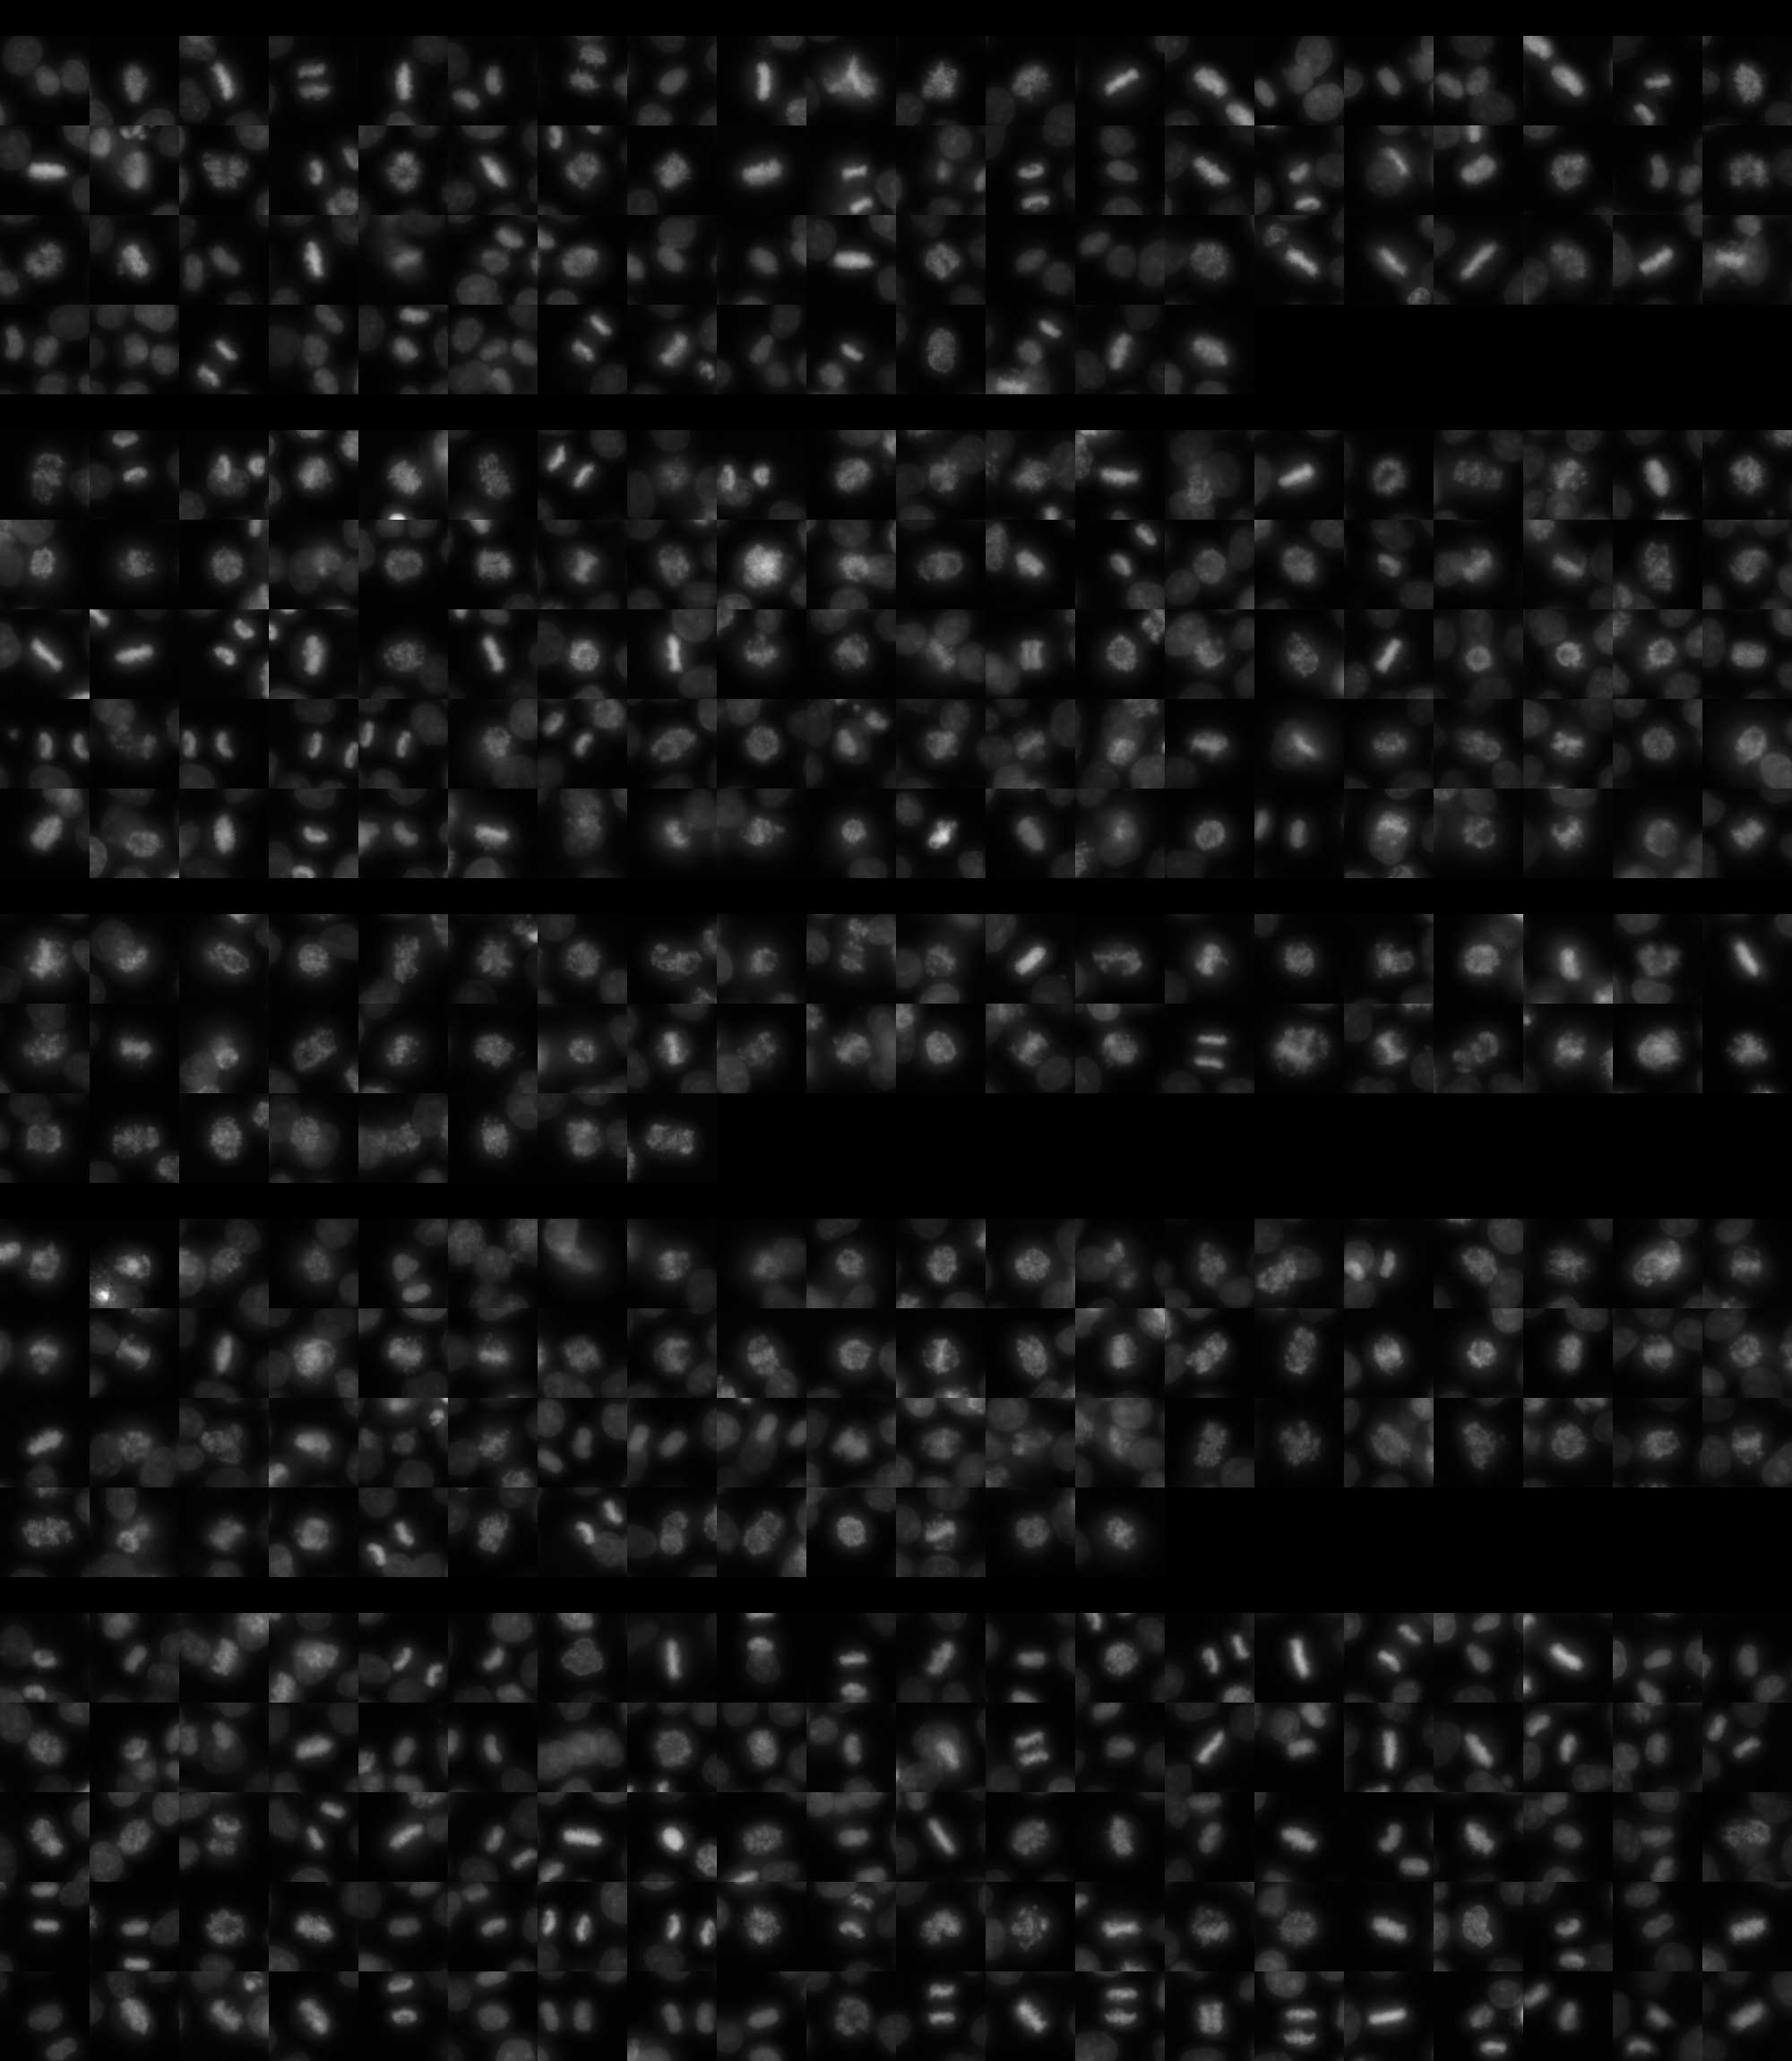
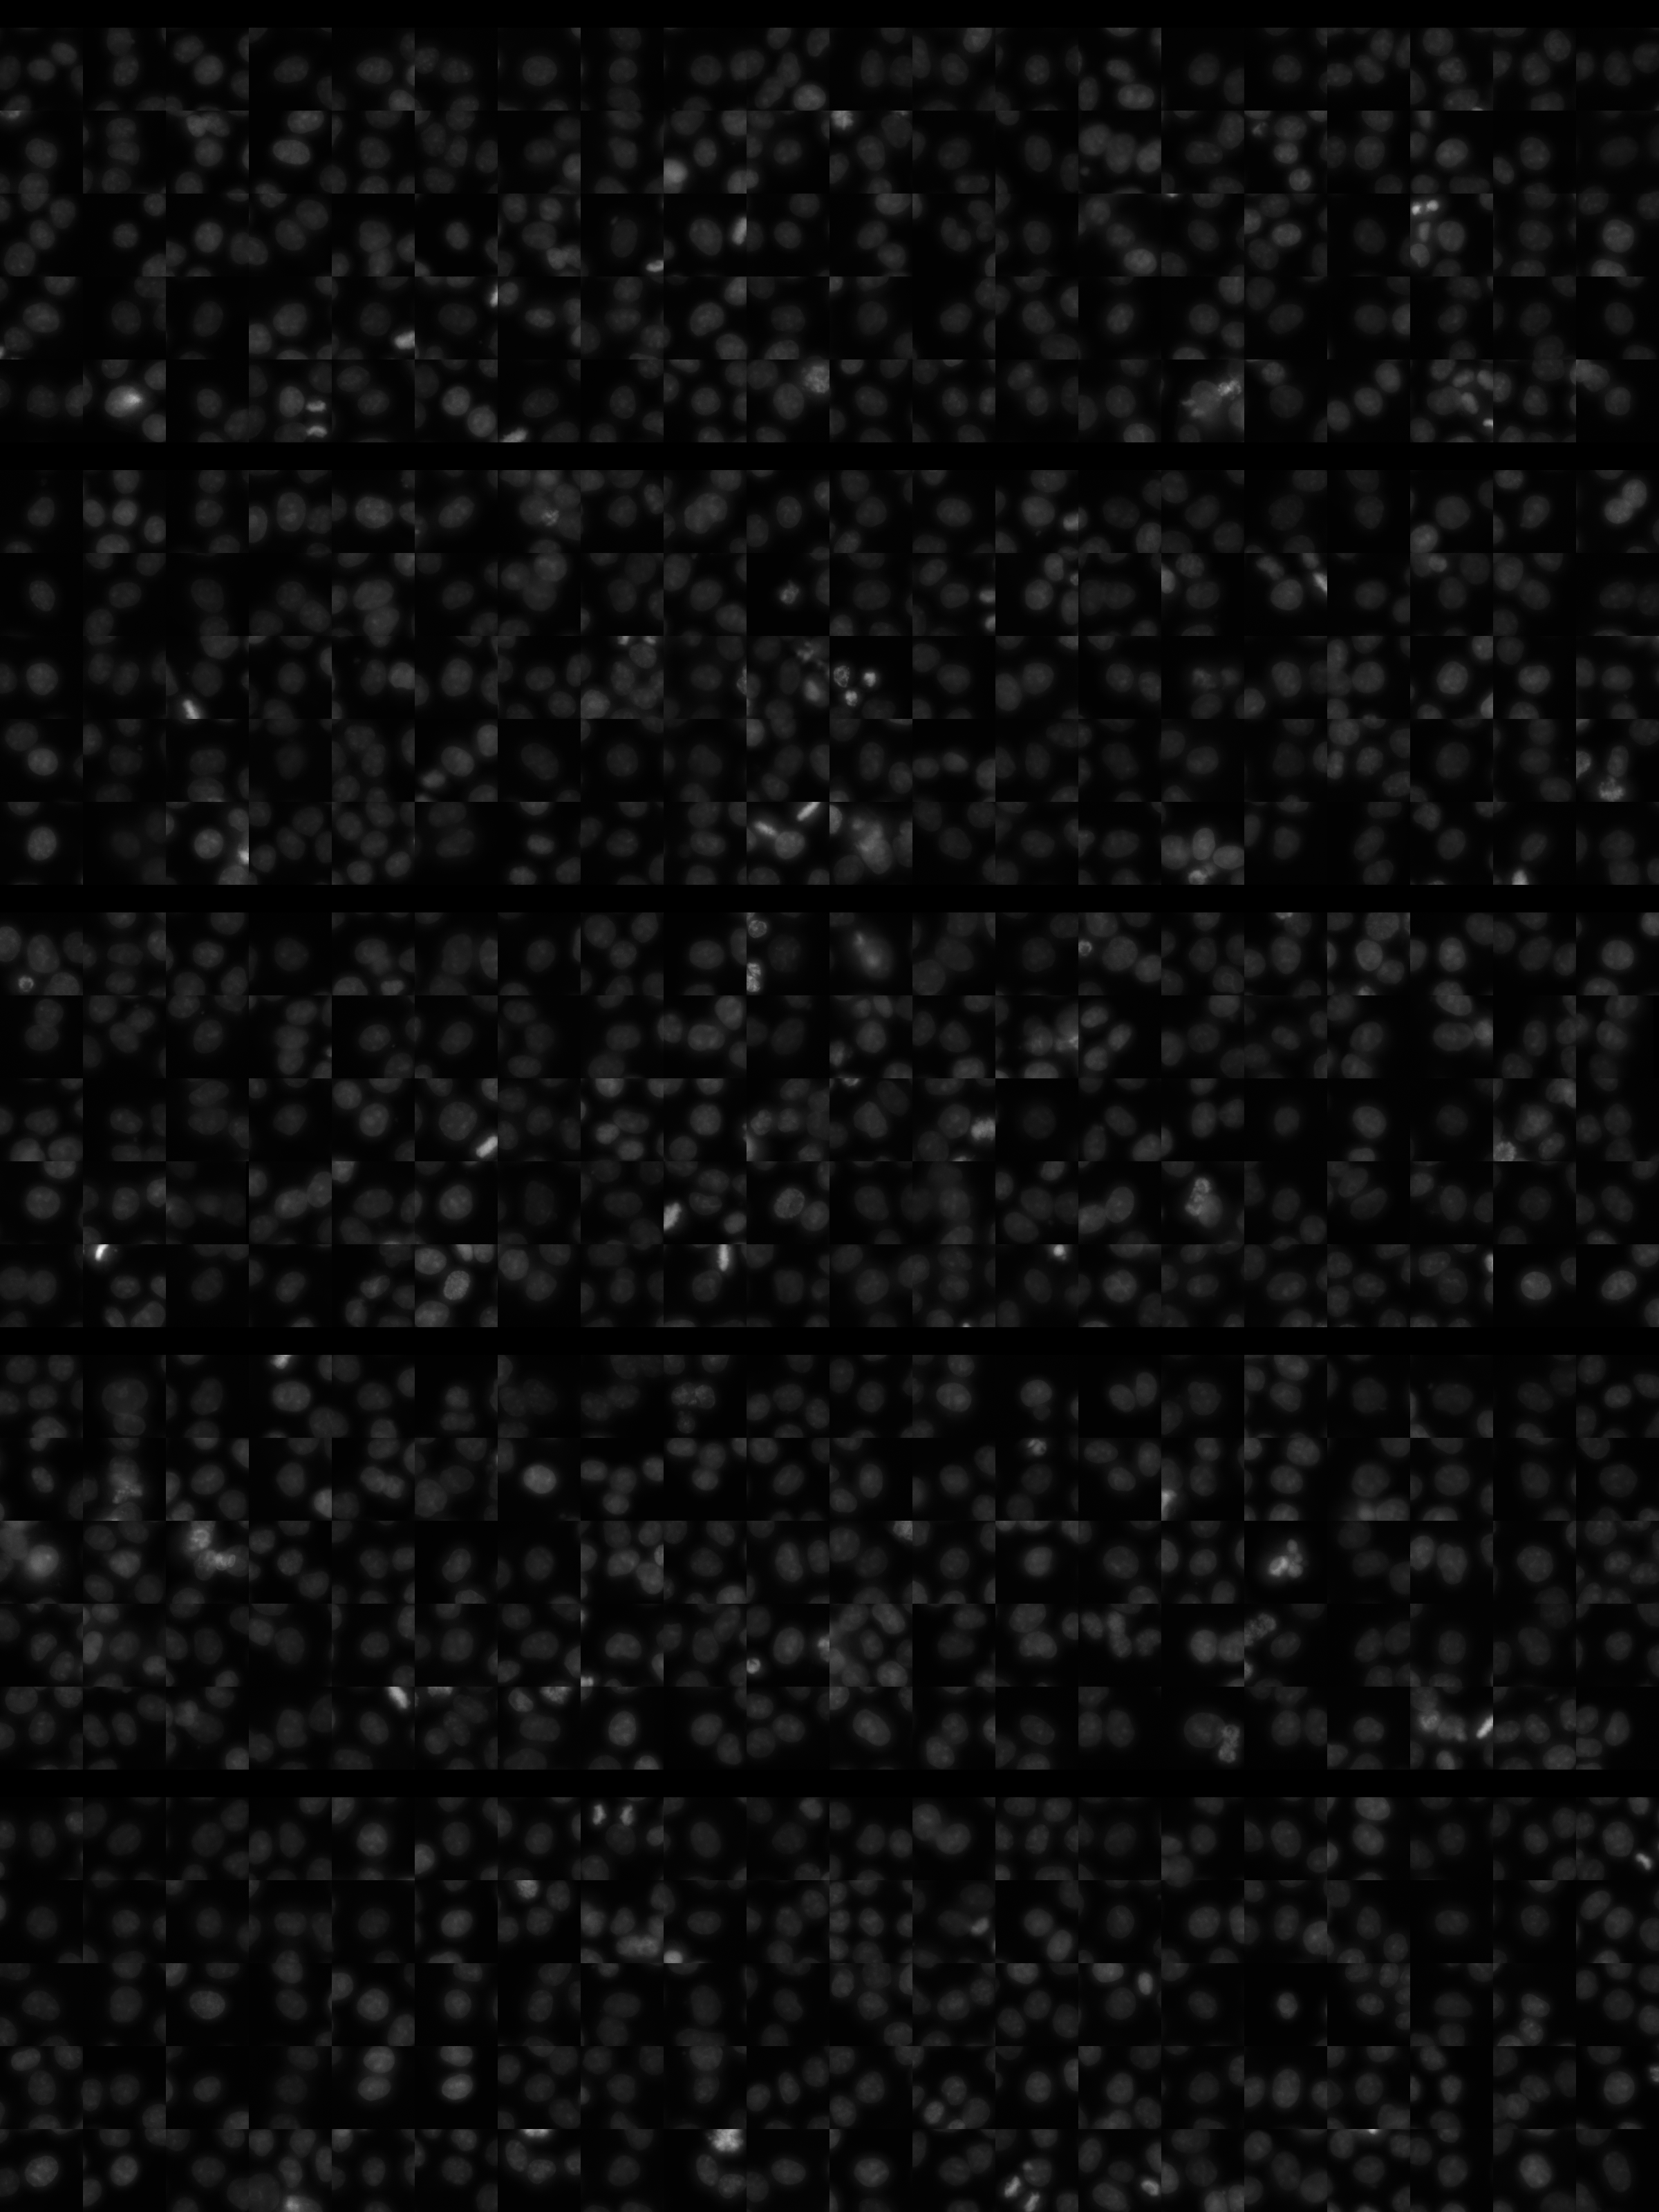
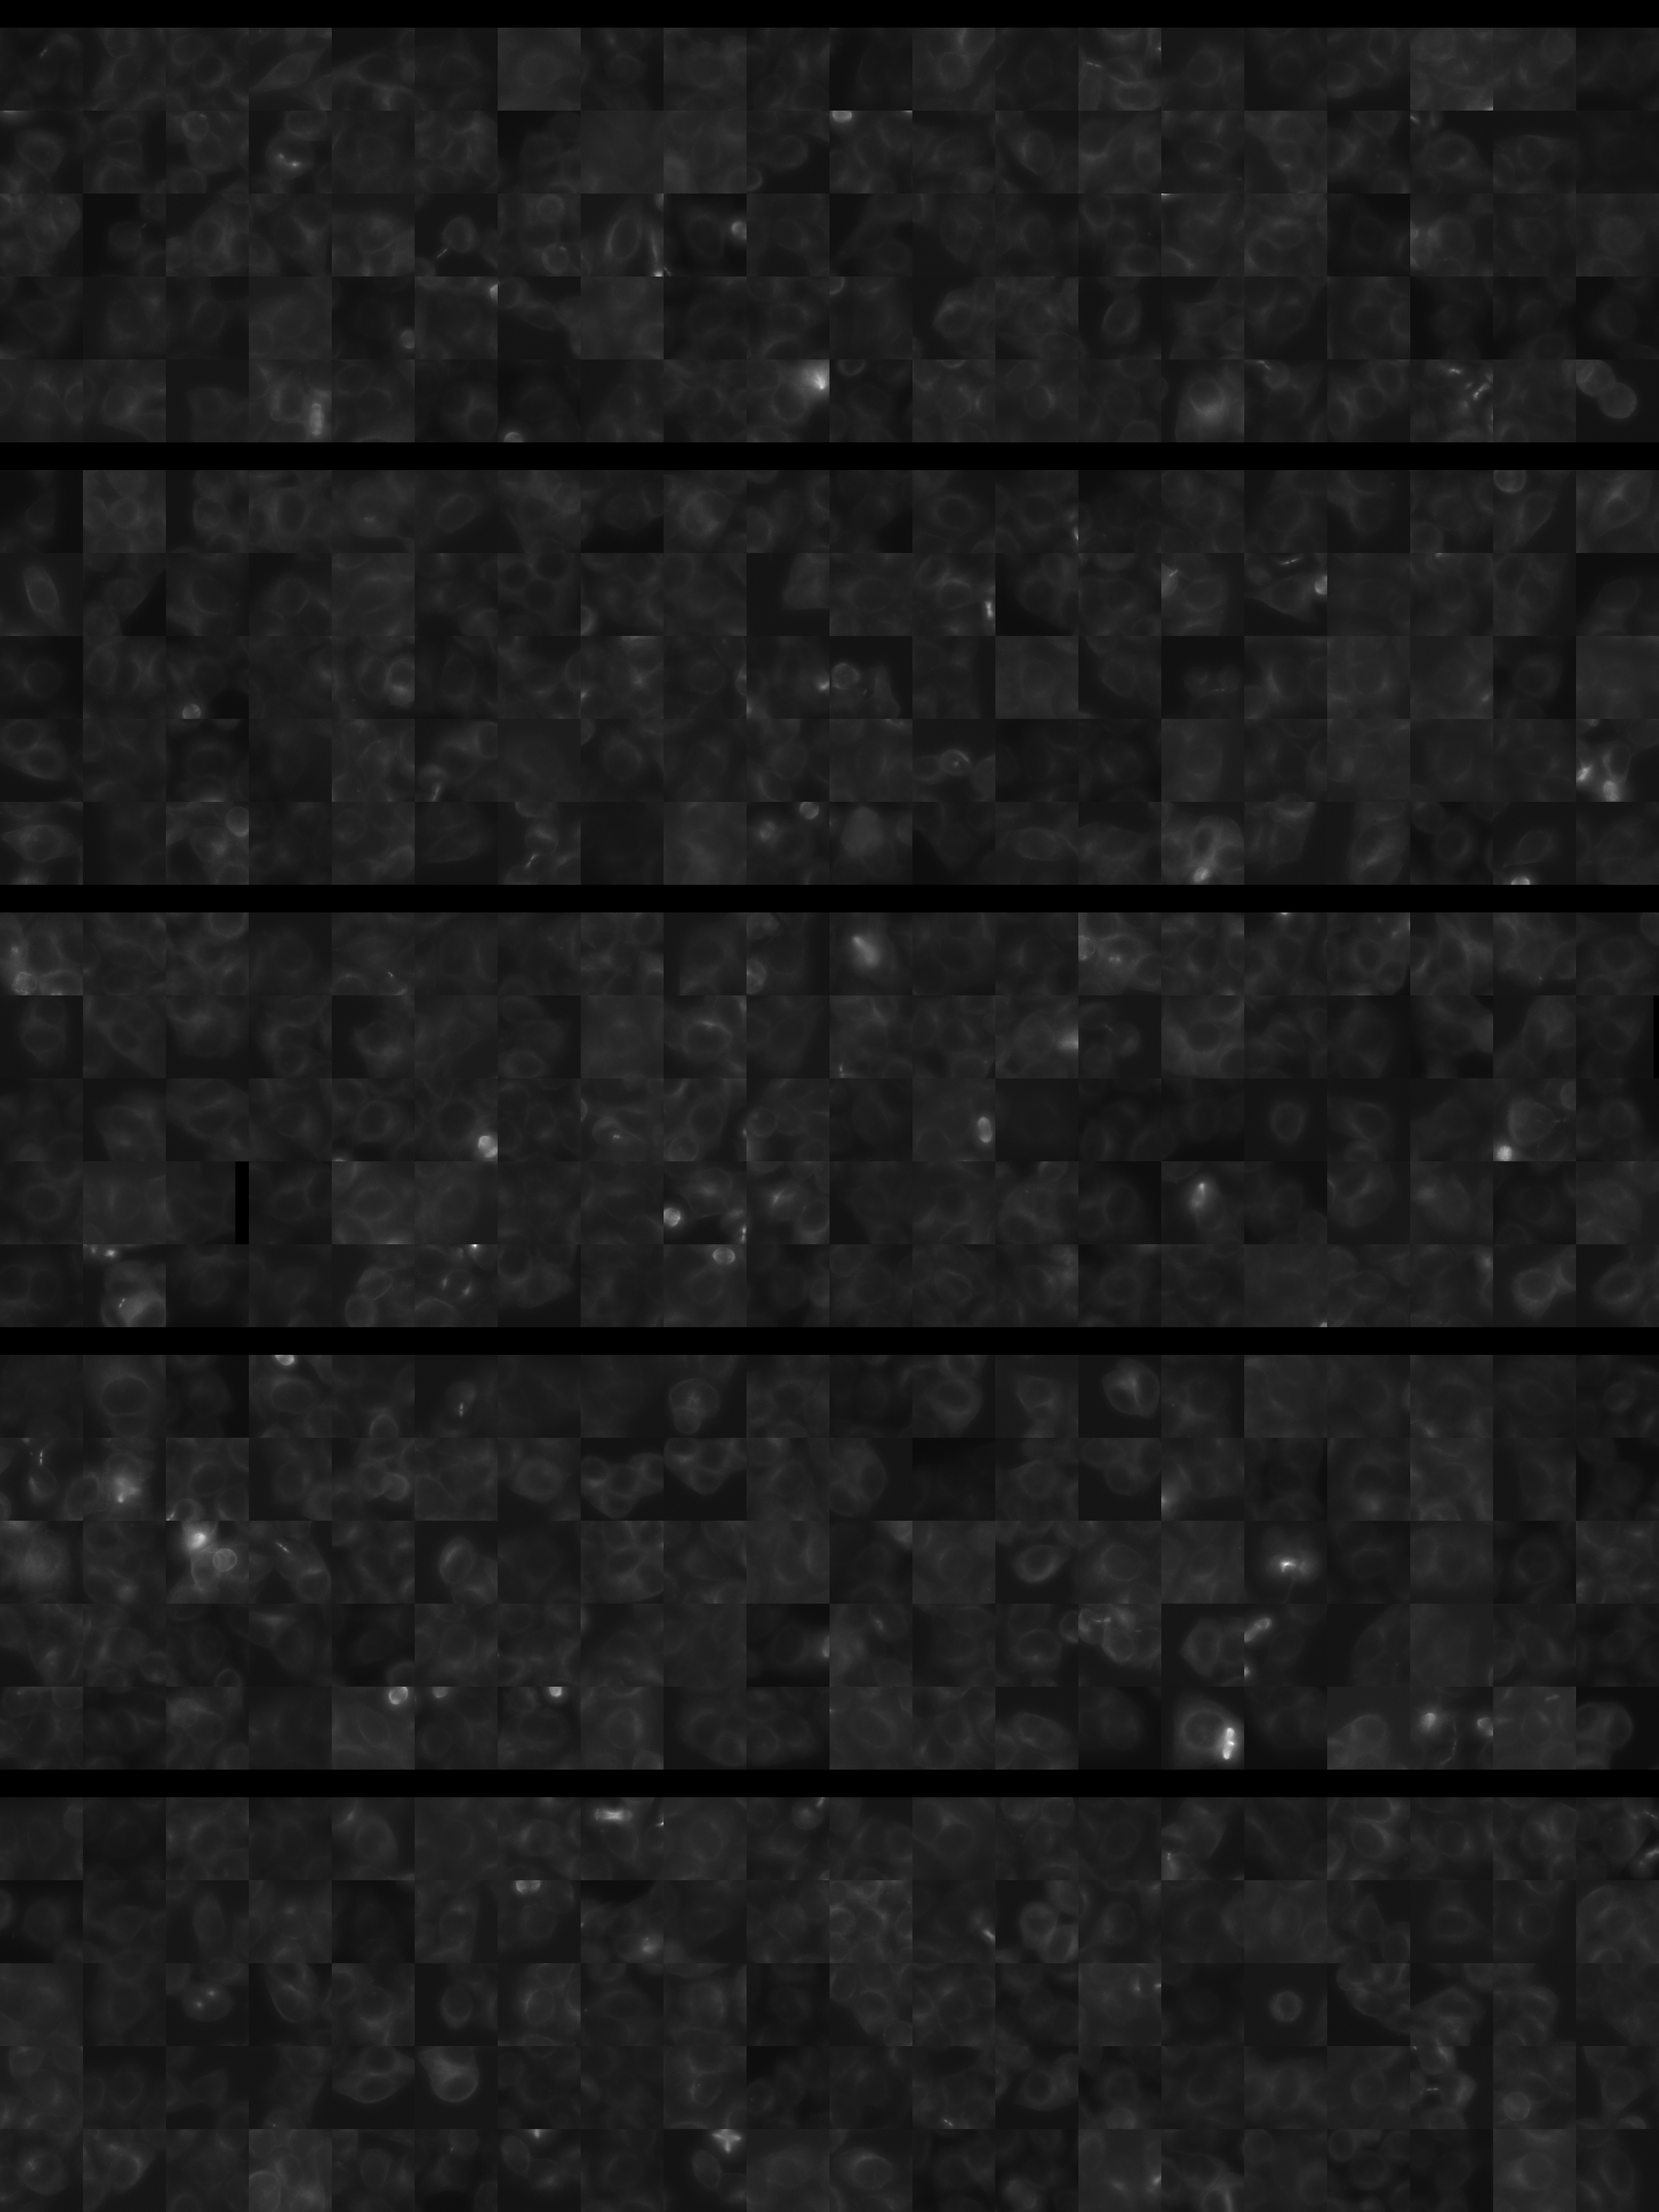
Each montage below shows randomly selected individual cell images for the same target gene separated by sgRNA, along with an example montage of cells expressing a non-targeting negative control sgRNA at the bottom. sgRNA labels in the montages correspond to the numbered sgRNA sequences in the gene info table above. The DNA (blue) and tubulin (green) channels are displayed by default, with gH2AX (grayscale) and actin (yellow) available using the check boxes. Channel brightness, contrast, and opacity are adjustable by clicking the arrow next to the channel name. When only one channel is selected, the display defaults to grayscale. Click the “Zoom” checkbox above the channel controls to enable image zooming (via scrolling) and panning (via click-and-drag).

The cell boxes displayed for this gene are square, 36.43 μm per side for the interphase montage and 30.36 μm per side for the mitotic montage.
Features

Interphase Score Rank FDR q-value
Nucleus DNA Integrated 0.049 1034 of 5322 0.545
Nucleus DNA Mean 0.053 803 of 5322 0.259
Nucleus gH2AX Mean 0.283 315 of 5322 1.367e-04
Nucleus DNA - gH2AX Correlation -1.672e-01 4913 of 5322 1.021e-04
Nucleus Shape Area 0.028 2354 of 5322 0.769
Nucleus Shape Eccentricity 0.188 25 of 5322 4.529e-04
Nucleus Shape Form Factor -8.971e-02 4162 of 5322 0.051
Nucleus Shape Solidity -6.397e-02 3291 of 5322 0.116
Cell DNA Mass Displacement 0.144 84 of 5322 0.001
Cell Tubulin Mean 0.152 270 of 5322 2.141e-04
Cell Tubulin Mass Displacement 0.076 293 of 5322 0.094
Cell Actin Mean 0.050 1553 of 5322 0.389
Cell Tubulin - Actin Correlation 0.019 2689 of 5322 0.752
Cell DNA - Tubulin Correlation -3.578e-01 5316 of 5322 1.948e-04
Cell Shape Area -8.467e-02 4714 of 5322 0.064
Cell Shape Eccentricity 0.028 1569 of 5322 0.762
Mitotic Score Rank FDR q-value
Nucleus DNA Integrated 0.353 363 of 5322 0.323
Nucleus DNA Mean -1.262e-01 4535 of 5322 1.000
Nucleus DNA Mass Displacement 0.347 148 of 5322 0.999
Nucleus DNA Mean Frac 3 0.707 9 of 5322 0.018
Nucleus gH2AX Mean 0.491 85 of 5322 0.219
Nucleus gH2AX Mean Frac 0 -7.243e-02 3390 of 5322 1.000
Nucleus Tubulin Mean Frac 0 0.531 71 of 5322 0.026
Nucleus Tubulin Mean Edge 0.362 161 of 5322 0.368
Nucleus Tubulin Std Edge -4.175e-01 5104 of 5322 0.057
Nucleus Shape Area 0.722 108 of 5322 0.001
Nucleus Shape Eccentricity -6.523e-01 5256 of 5322 0.040
Nucleus Shape Form Factor -4.791e-01 5173 of 5322 0.187
Cell Tubulin Mean 1.088 5 of 5322 0.004
Cell Tubulin Mean Frac 3 -5.087e-01 5193 of 5322 0.061
Cell Actin Mean 0.547 64 of 5322 0.050
Cell Shape Area 0.333 541 of 5322 0.646
( Reset Zoom )
Brightness
Contrast
Opacity
Brightness
Contrast
Opacity
Brightness
Contrast
Opacity
Brightness
Contrast
Opacity
Brightness
Contrast
Opacity

( Reset Zoom )
Brightness
Contrast
Opacity
Brightness
Contrast
Opacity
Brightness
Contrast
Opacity
Brightness
Contrast
Opacity
Brightness
Contrast
Opacity

MIT Central Accessability