PTP4A1

Gene symbol: PTP4A1
Gene: 7803
Uniprot Function: Protein tyrosine phosphatase which stimulates progression from G1 into S phase during mitosis. May play a role in the development and maintenance of differentiating epithelial tissues. Enhances cell proliferation, cell motility and invasive activity, and promotes cancer metastasis.
Mitotic Index 0.0251
Interphase Cluster: #220 (6 genes)
Mitotic Cluster: #147 (19 genes)
sgRNA 1: GTTAAATACTTACAAGAACA (interphase cells: 2306, mitotic cells: 69)
sgRNA 2: TATGTGACTTCCACAGGAGC (interphase cells: 1165, mitotic cells: 25)
sgRNA 3: TGAACAGCAATACAACAACC (interphase cells: 2028, mitotic cells: 59)
sgRNA 4: TTAACCAGTCATCAACAATC (interphase cells: 2110, mitotic cells: 43)

Interphase Cluster

Mitotic Cluster

Overview

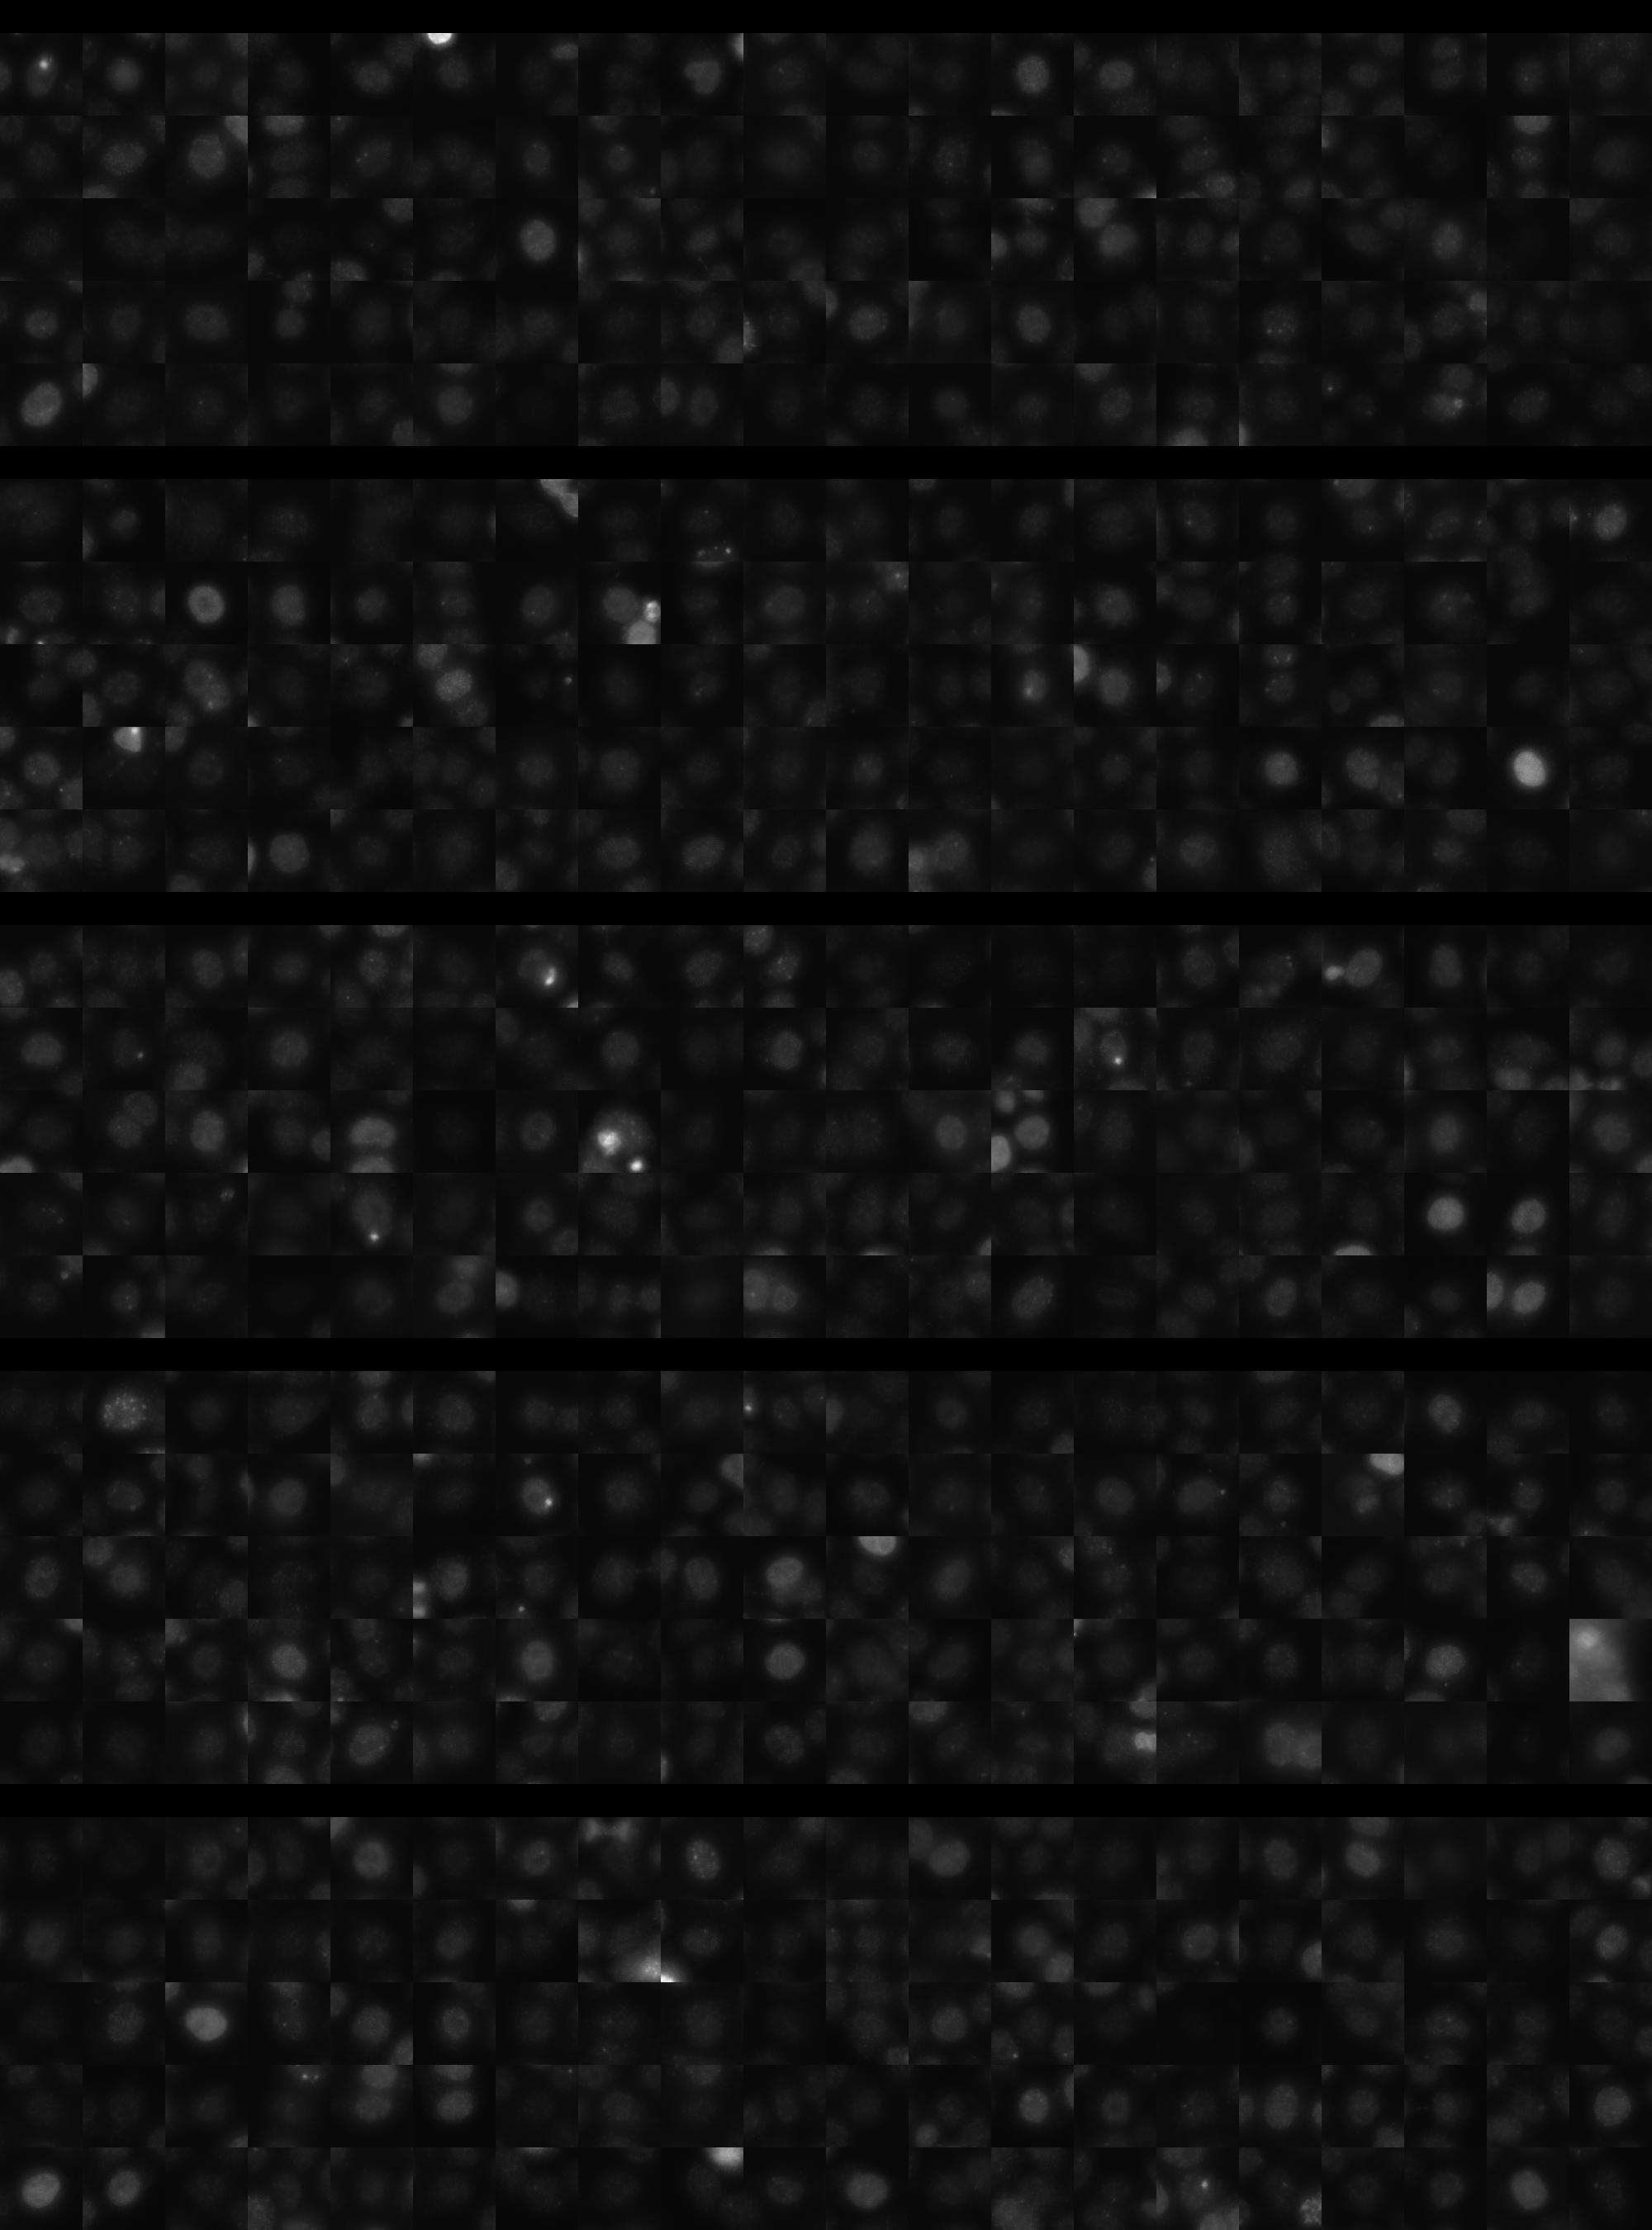
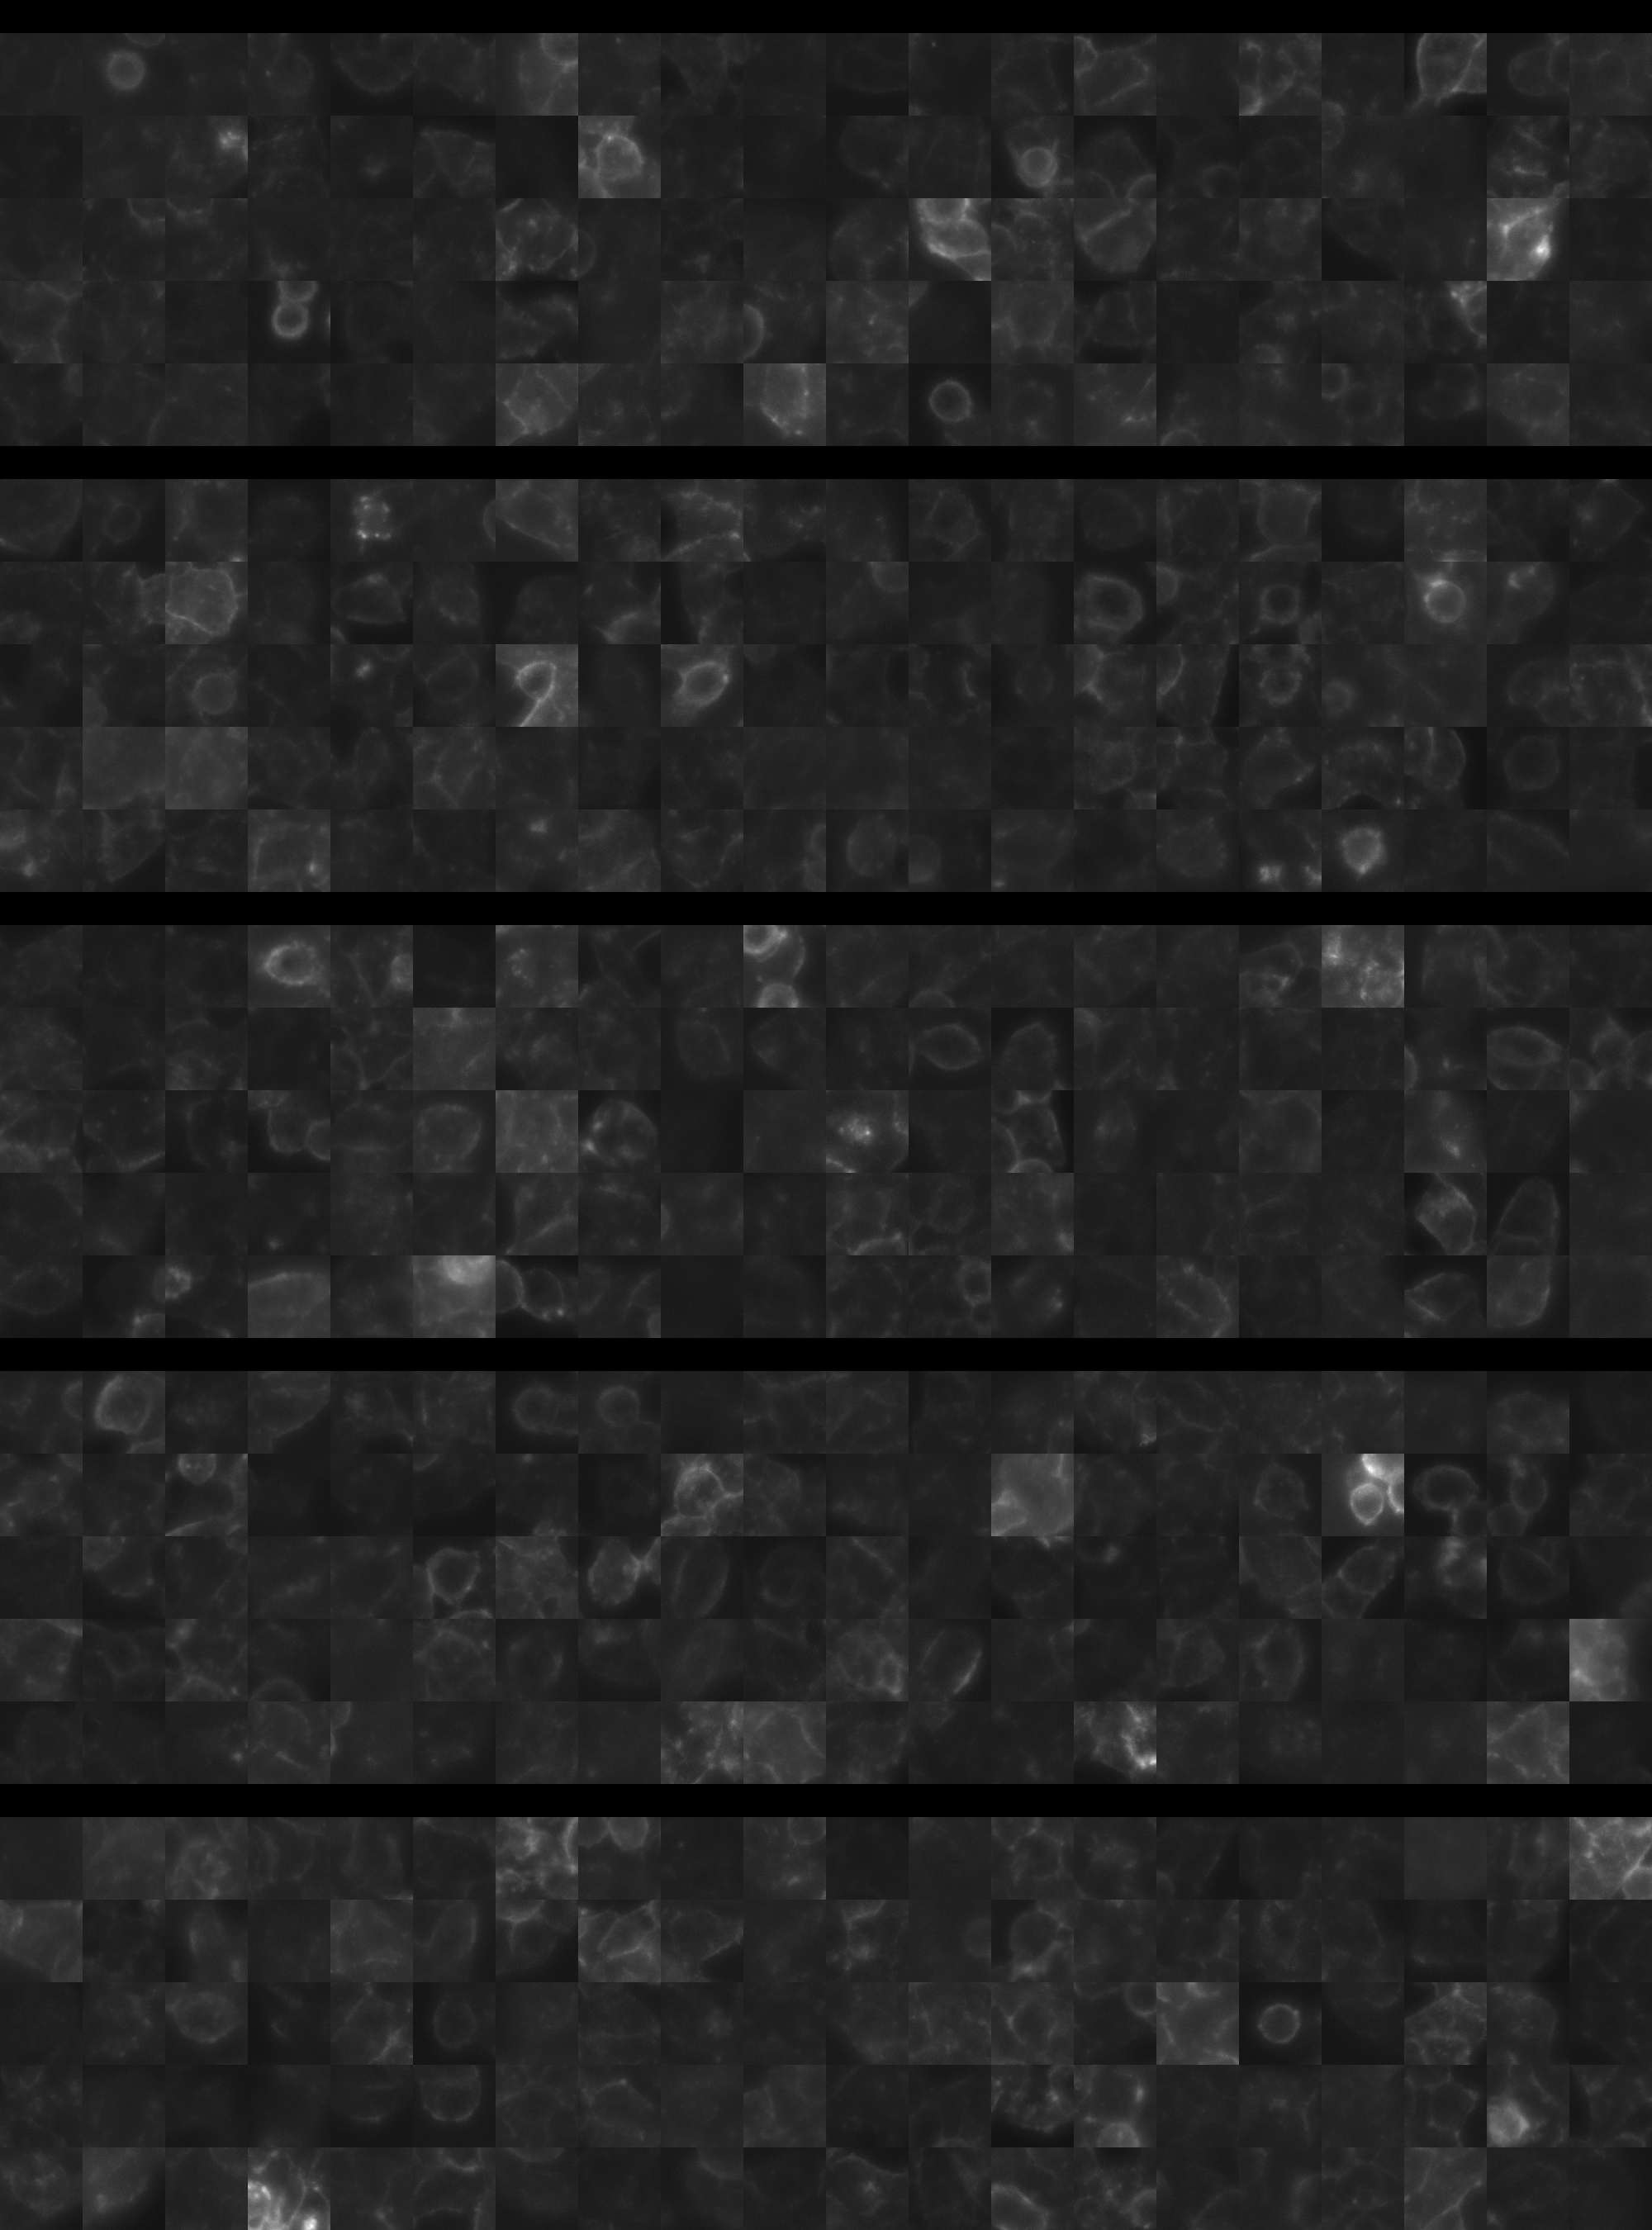
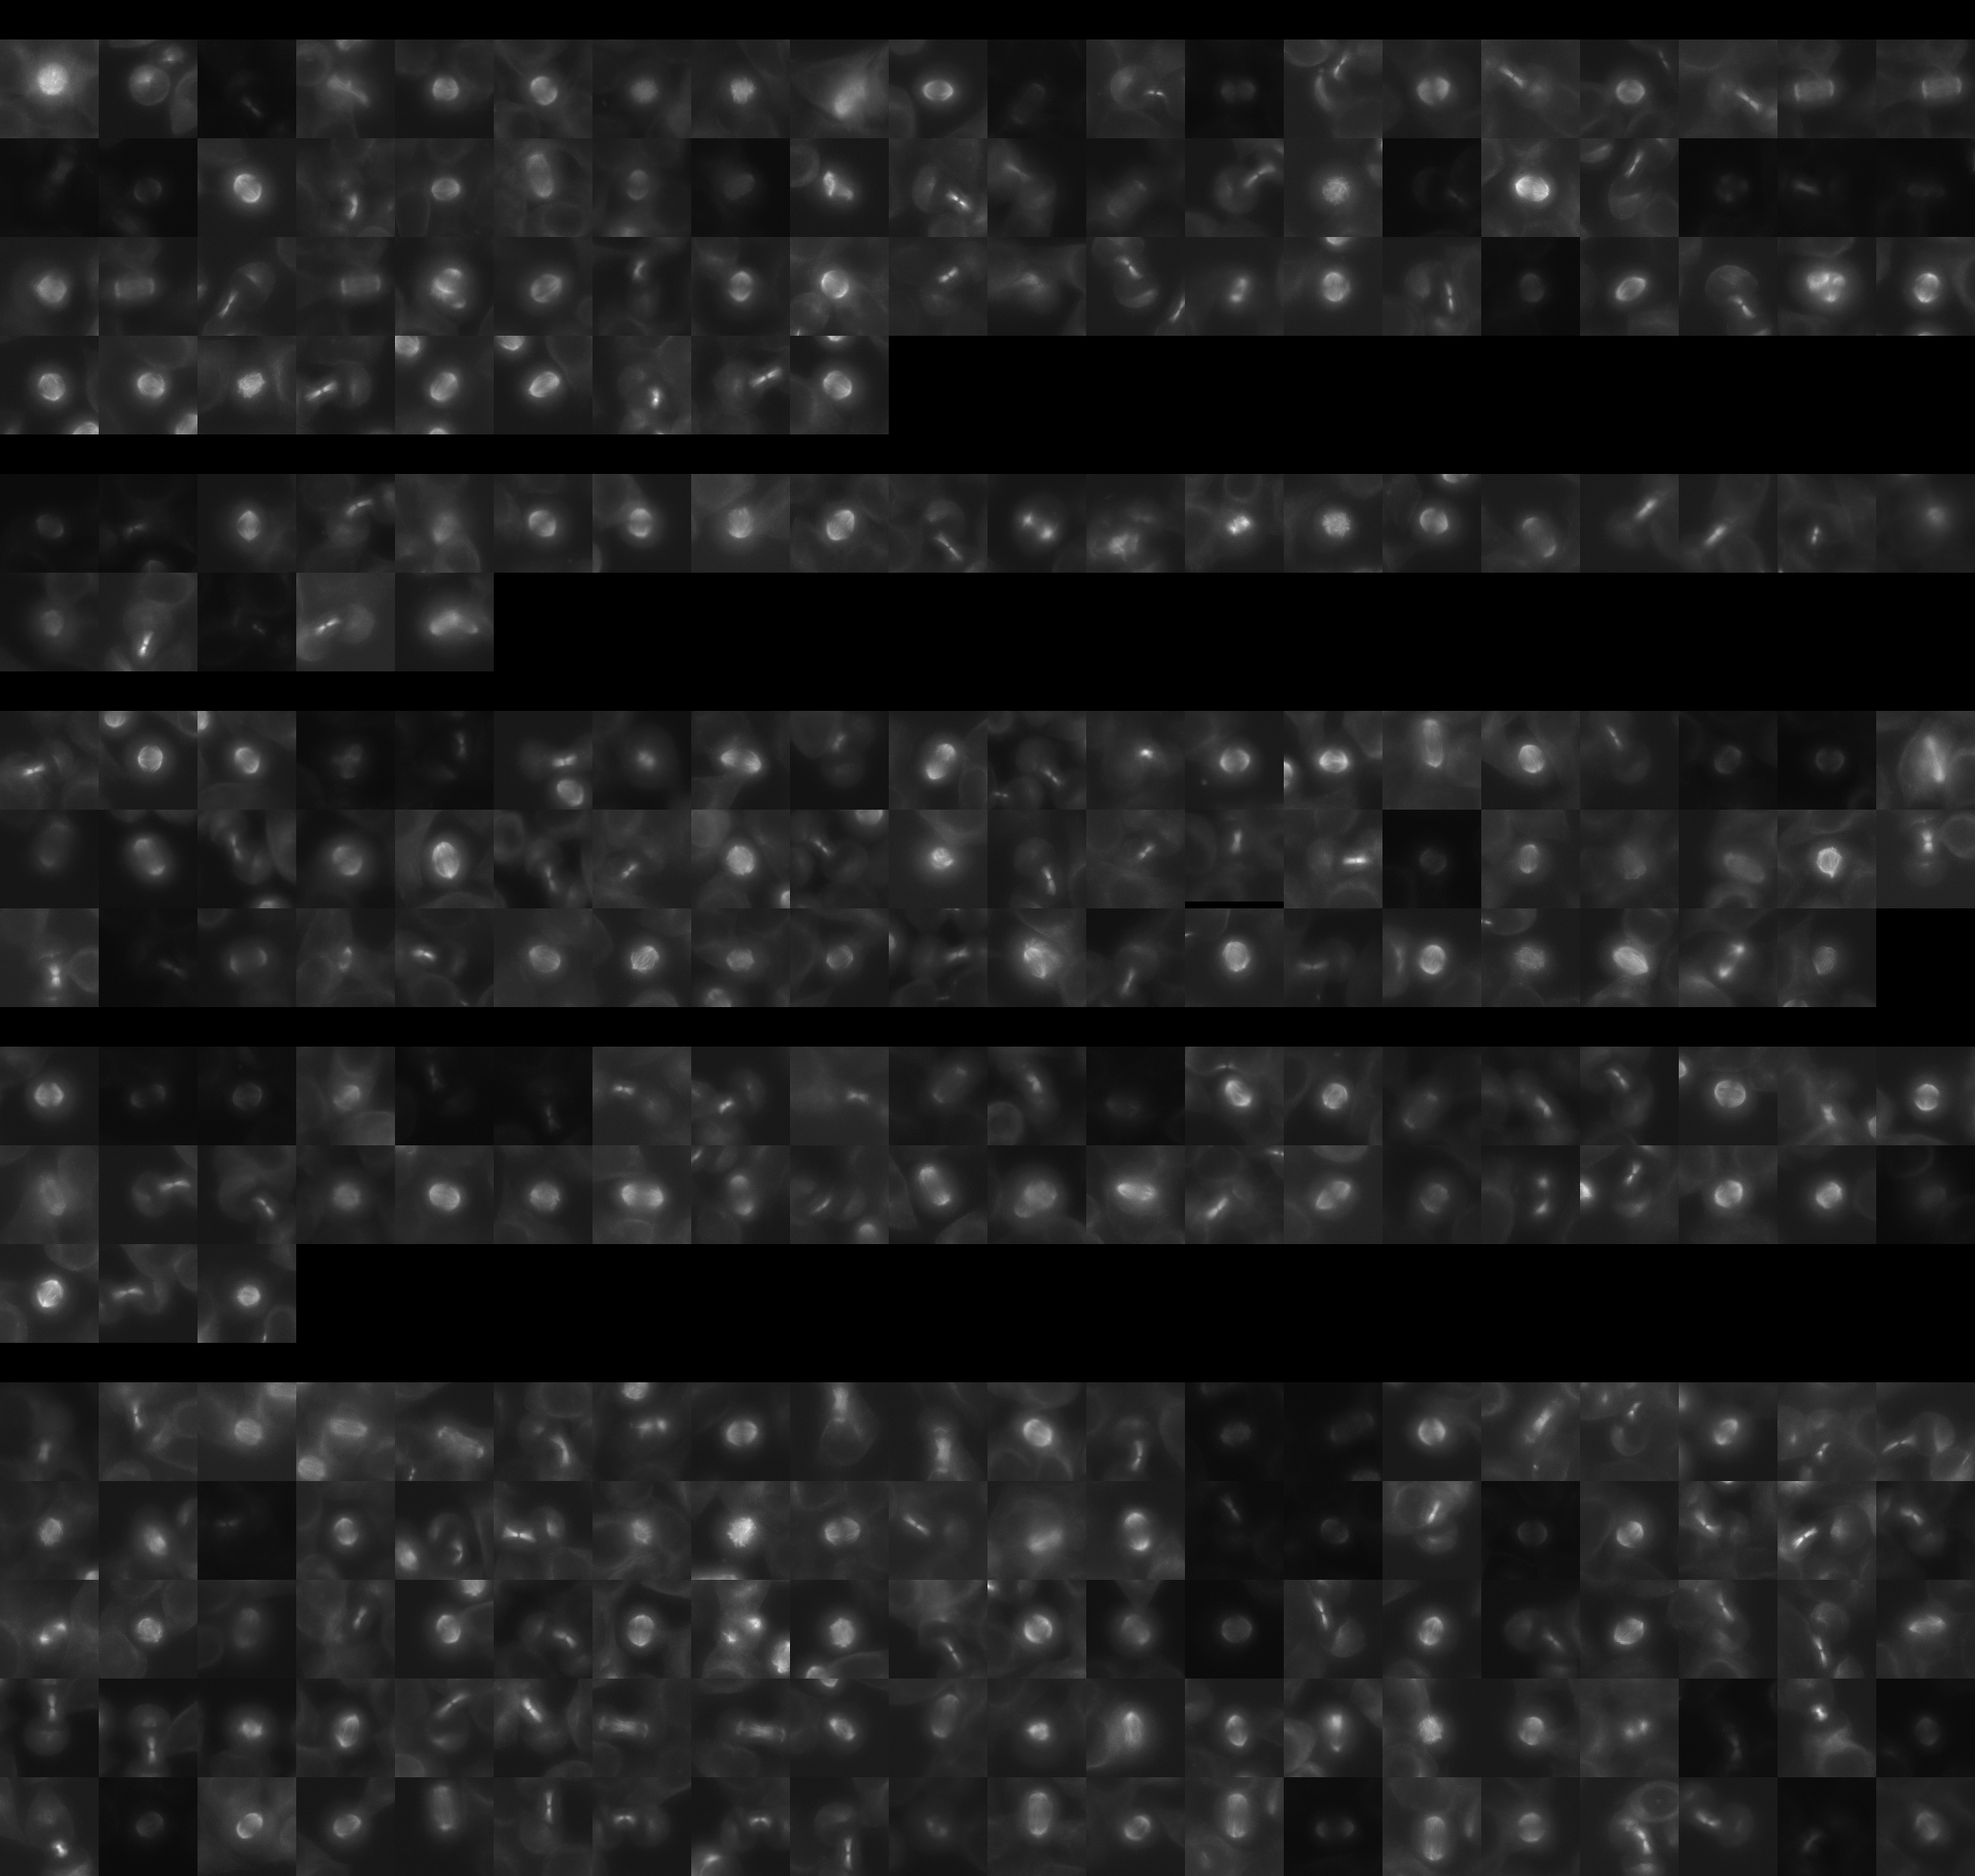
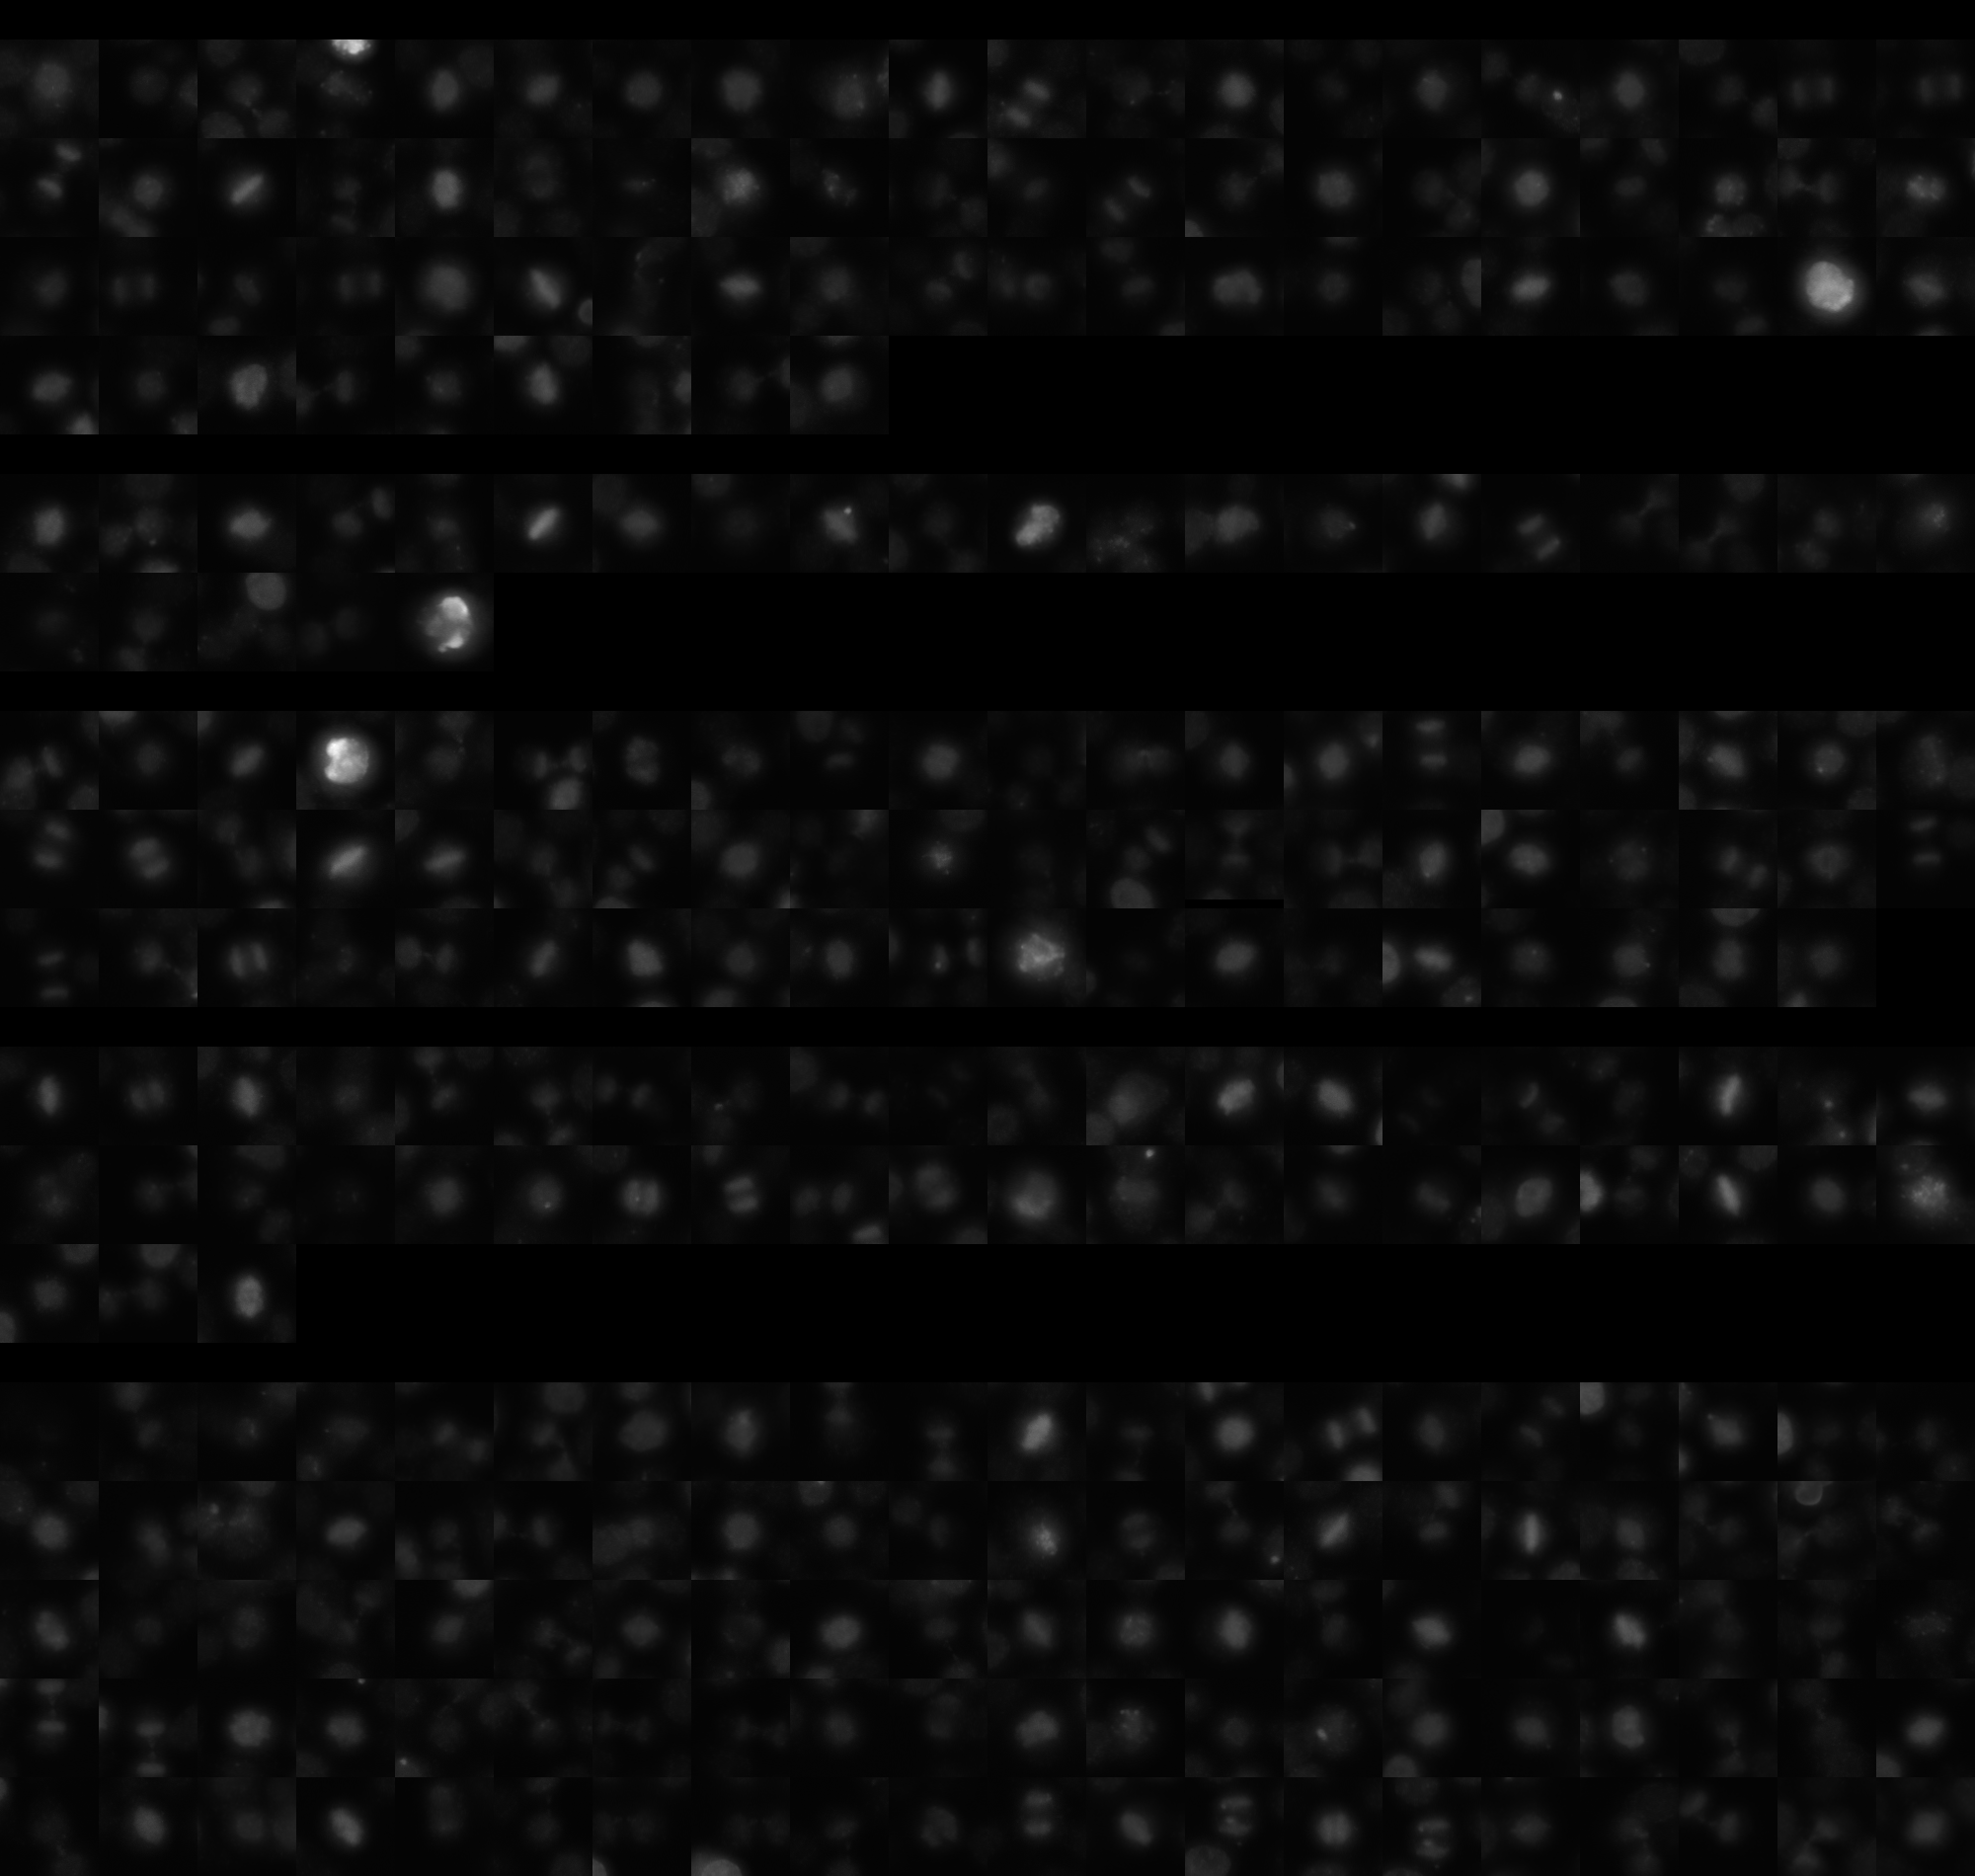
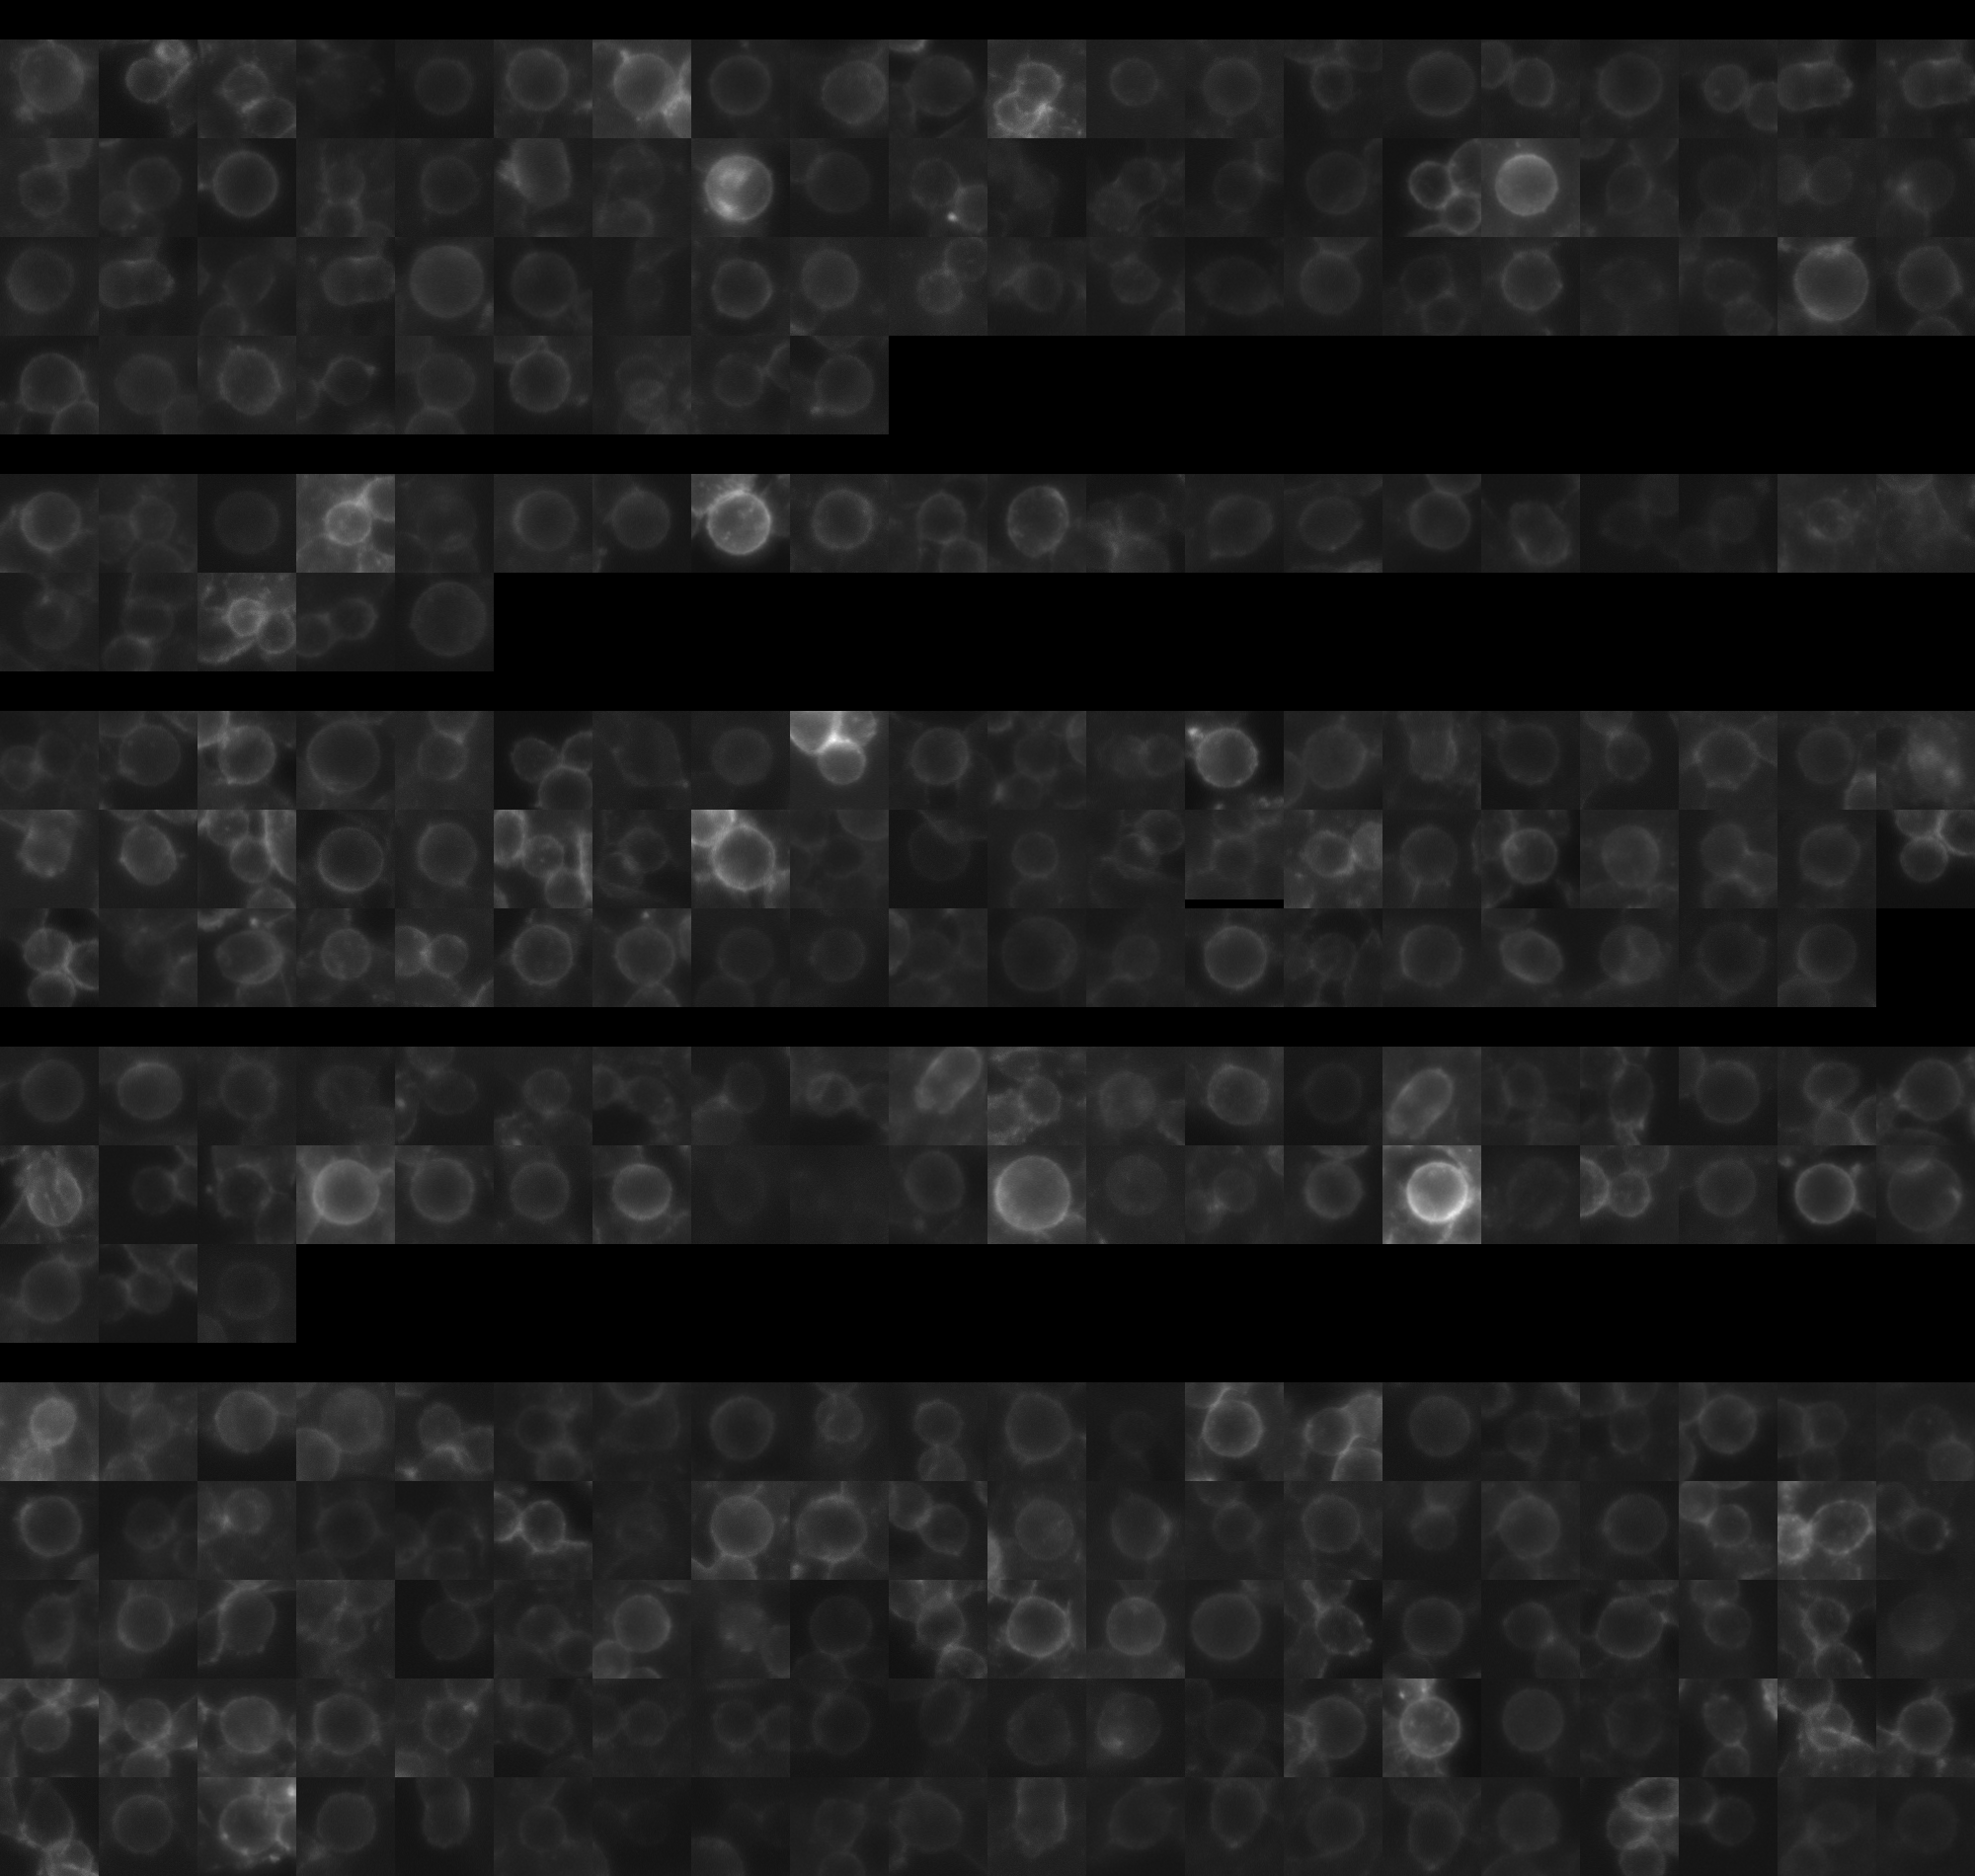
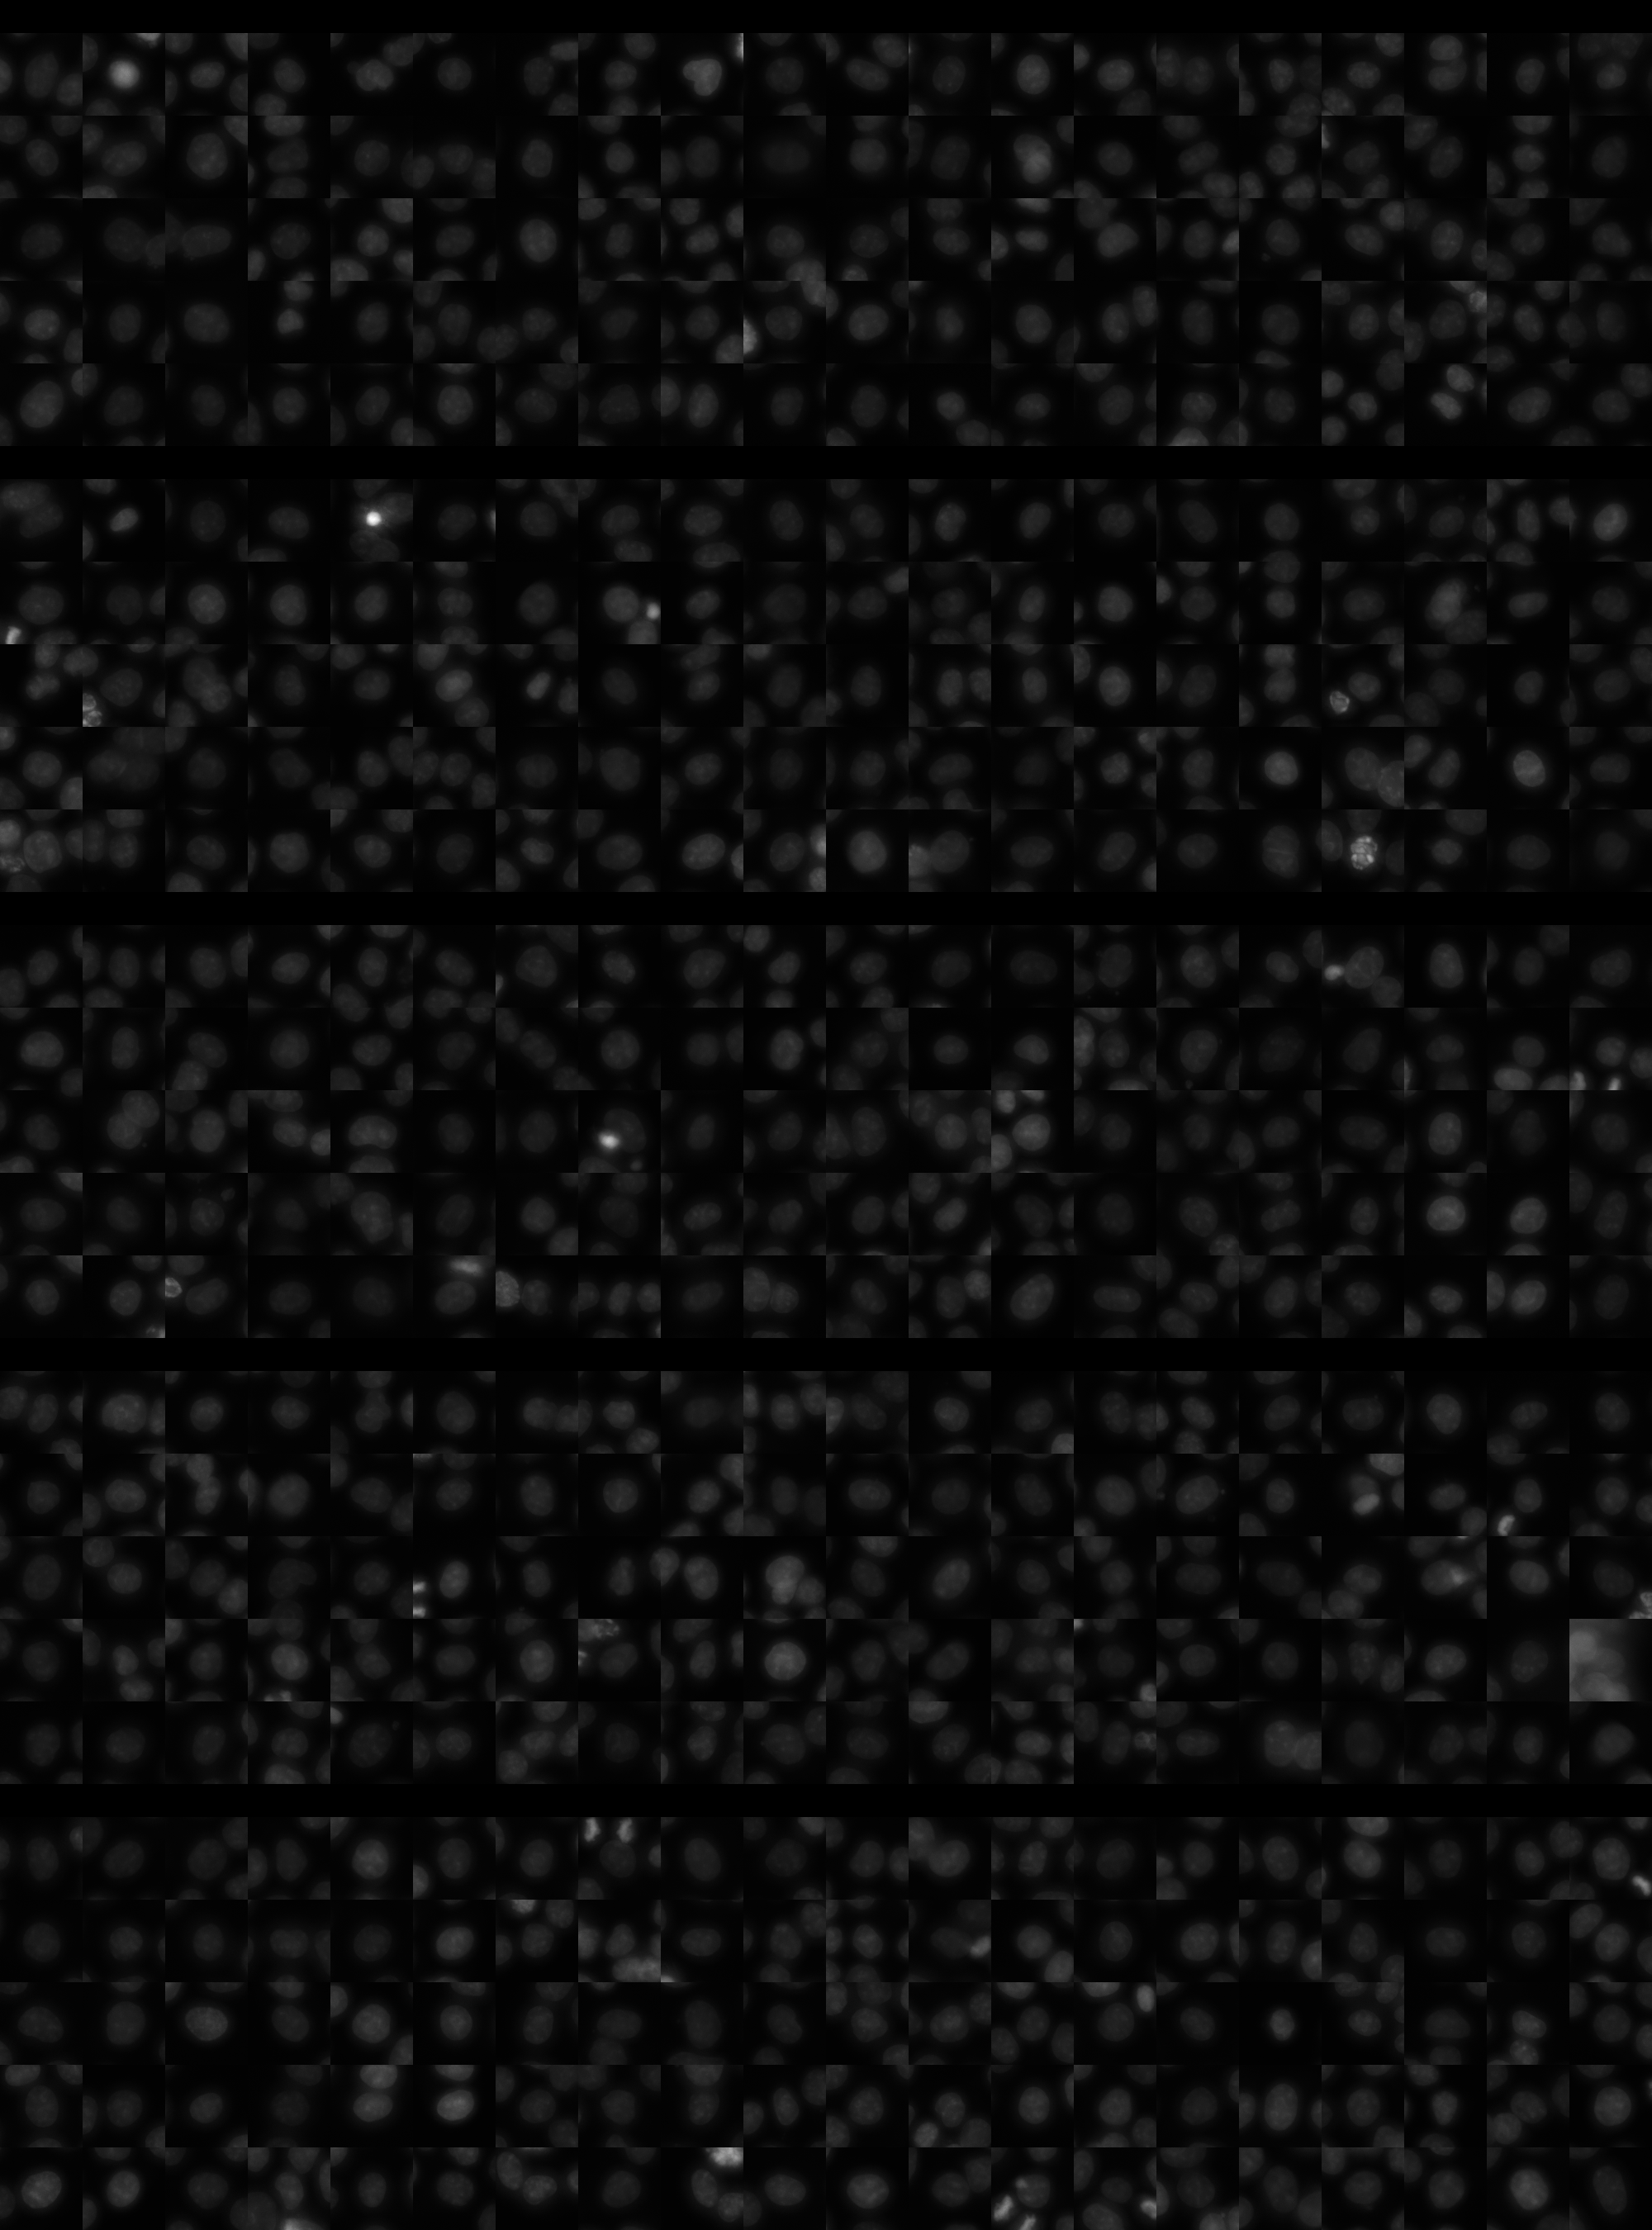
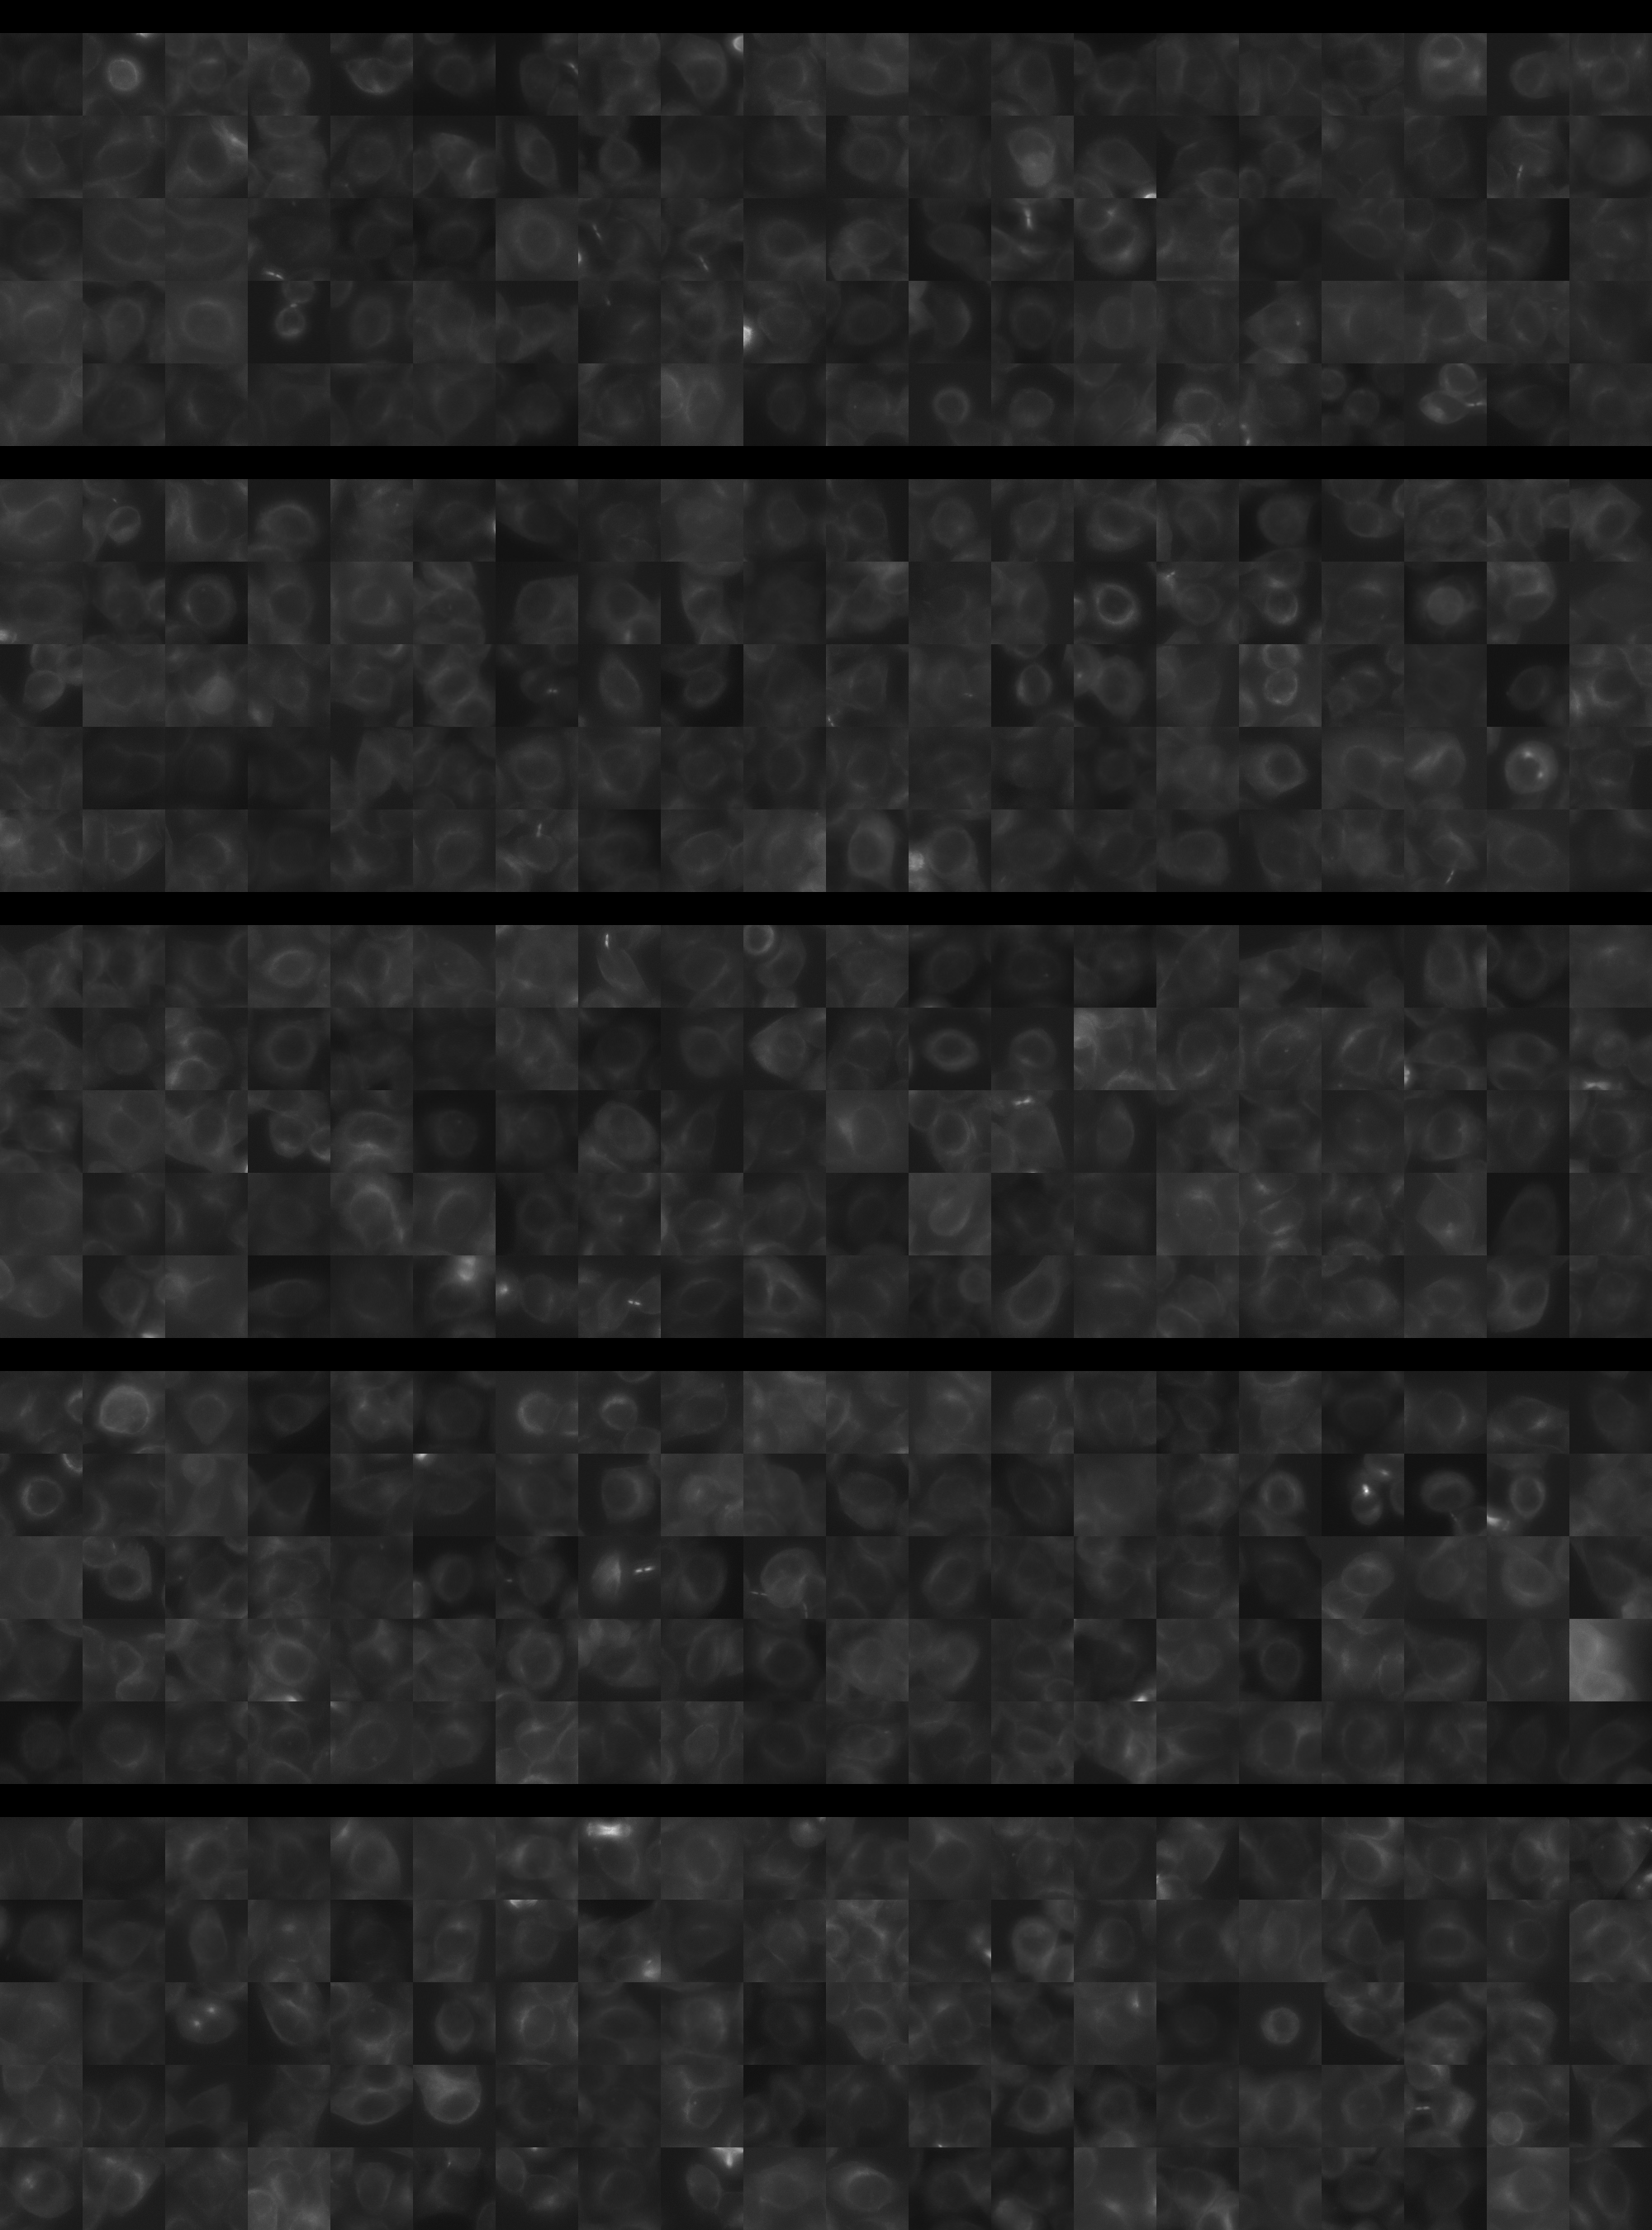
Each montage below shows randomly selected individual cell images for the same target gene separated by sgRNA, along with an example montage of cells expressing a non-targeting negative control sgRNA at the bottom. sgRNA labels in the montages correspond to the numbered sgRNA sequences in the gene info table above. The DNA (blue) and tubulin (green) channels are displayed by default, with gH2AX (grayscale) and actin (yellow) available using the check boxes. Channel brightness, contrast, and opacity are adjustable by clicking the arrow next to the channel name. When only one channel is selected, the display defaults to grayscale. Click the “Zoom” checkbox above the channel controls to enable image zooming (via scrolling) and panning (via click-and-drag).

The cell boxes displayed for this gene are square, 30.36 μm per side for the interphase montage and 30.36 μm per side for the mitotic montage.
Features

Interphase Score Rank FDR q-value
Nucleus DNA Integrated -2.839e-02 4350 of 5322 0.611
Nucleus DNA Mean -5.053e-02 3604 of 5322 0.229
Nucleus gH2AX Mean -3.266e-02 4960 of 5322 0.310
Nucleus DNA - gH2AX Correlation -4.568e-02 2248 of 5322 0.093
Nucleus Shape Area -2.601e-03 3387 of 5322 0.885
Nucleus Shape Eccentricity 0.145 61 of 5322 4.529e-04
Nucleus Shape Form Factor -1.107e-01 4579 of 5322 0.005
Nucleus Shape Solidity -1.189e-01 4592 of 5322 7.581e-04
Cell DNA Mass Displacement 0.012 3672 of 5322 0.889
Cell Tubulin Mean -1.364e-01 5045 of 5322 5.888e-04
Cell Tubulin Mass Displacement -1.286e-01 5201 of 5322 3.984e-04
Cell Actin Mean -6.251e-02 4563 of 5322 0.176
Cell Tubulin - Actin Correlation 0.070 936 of 5322 0.058
Cell DNA - Tubulin Correlation 0.227 279 of 5322 1.948e-04
Cell Shape Area 0.011 2829 of 5322 0.979
Cell Shape Eccentricity 0.002 3526 of 5322 0.980
Mitotic Score Rank FDR q-value
Nucleus DNA Integrated -1.094e-02 4067 of 5322 0.996
Nucleus DNA Mean -1.805e-01 4887 of 5322 1.000
Nucleus DNA Mass Displacement 0.151 1248 of 5322 0.999
Nucleus DNA Mean Frac 3 0.002 3093 of 5322 1.000
Nucleus gH2AX Mean 0.162 1016 of 5322 1.000
Nucleus gH2AX Mean Frac 0 -2.032e-02 2591 of 5322 1.000
Nucleus Tubulin Mean Frac 0 -5.657e-02 4251 of 5322 0.999
Nucleus Tubulin Mean Edge -2.120e-01 4926 of 5322 0.948
Nucleus Tubulin Std Edge -8.044e-02 3671 of 5322 0.999
Nucleus Shape Area 0.052 3325 of 5322 0.990
Nucleus Shape Eccentricity 0.027 1679 of 5322 1.000
Nucleus Shape Form Factor -2.377e-01 4445 of 5322 0.976
Cell Tubulin Mean -1.036e-01 4595 of 5322 0.997
Cell Tubulin Mean Frac 3 -2.204e-02 1947 of 5322 0.999
Cell Actin Mean -6.231e-02 4010 of 5322 0.997
Cell Shape Area 0.078 2914 of 5322 0.998
( Reset Zoom )
Brightness
Contrast
Opacity
Brightness
Contrast
Opacity
Brightness
Contrast
Opacity
Brightness
Contrast
Opacity
Brightness
Contrast
Opacity

( Reset Zoom )
Brightness
Contrast
Opacity
Brightness
Contrast
Opacity
Brightness
Contrast
Opacity
Brightness
Contrast
Opacity
Brightness
Contrast
Opacity

MIT Central Accessability