PRRC2C

Gene symbol: PRRC2C
Gene: 23215
Uniprot Function: Required for efficient formation of stress granules.
Mitotic Index 0.0228
Interphase Cluster: #33 (34 genes)
Mitotic Cluster: #116 (23 genes)
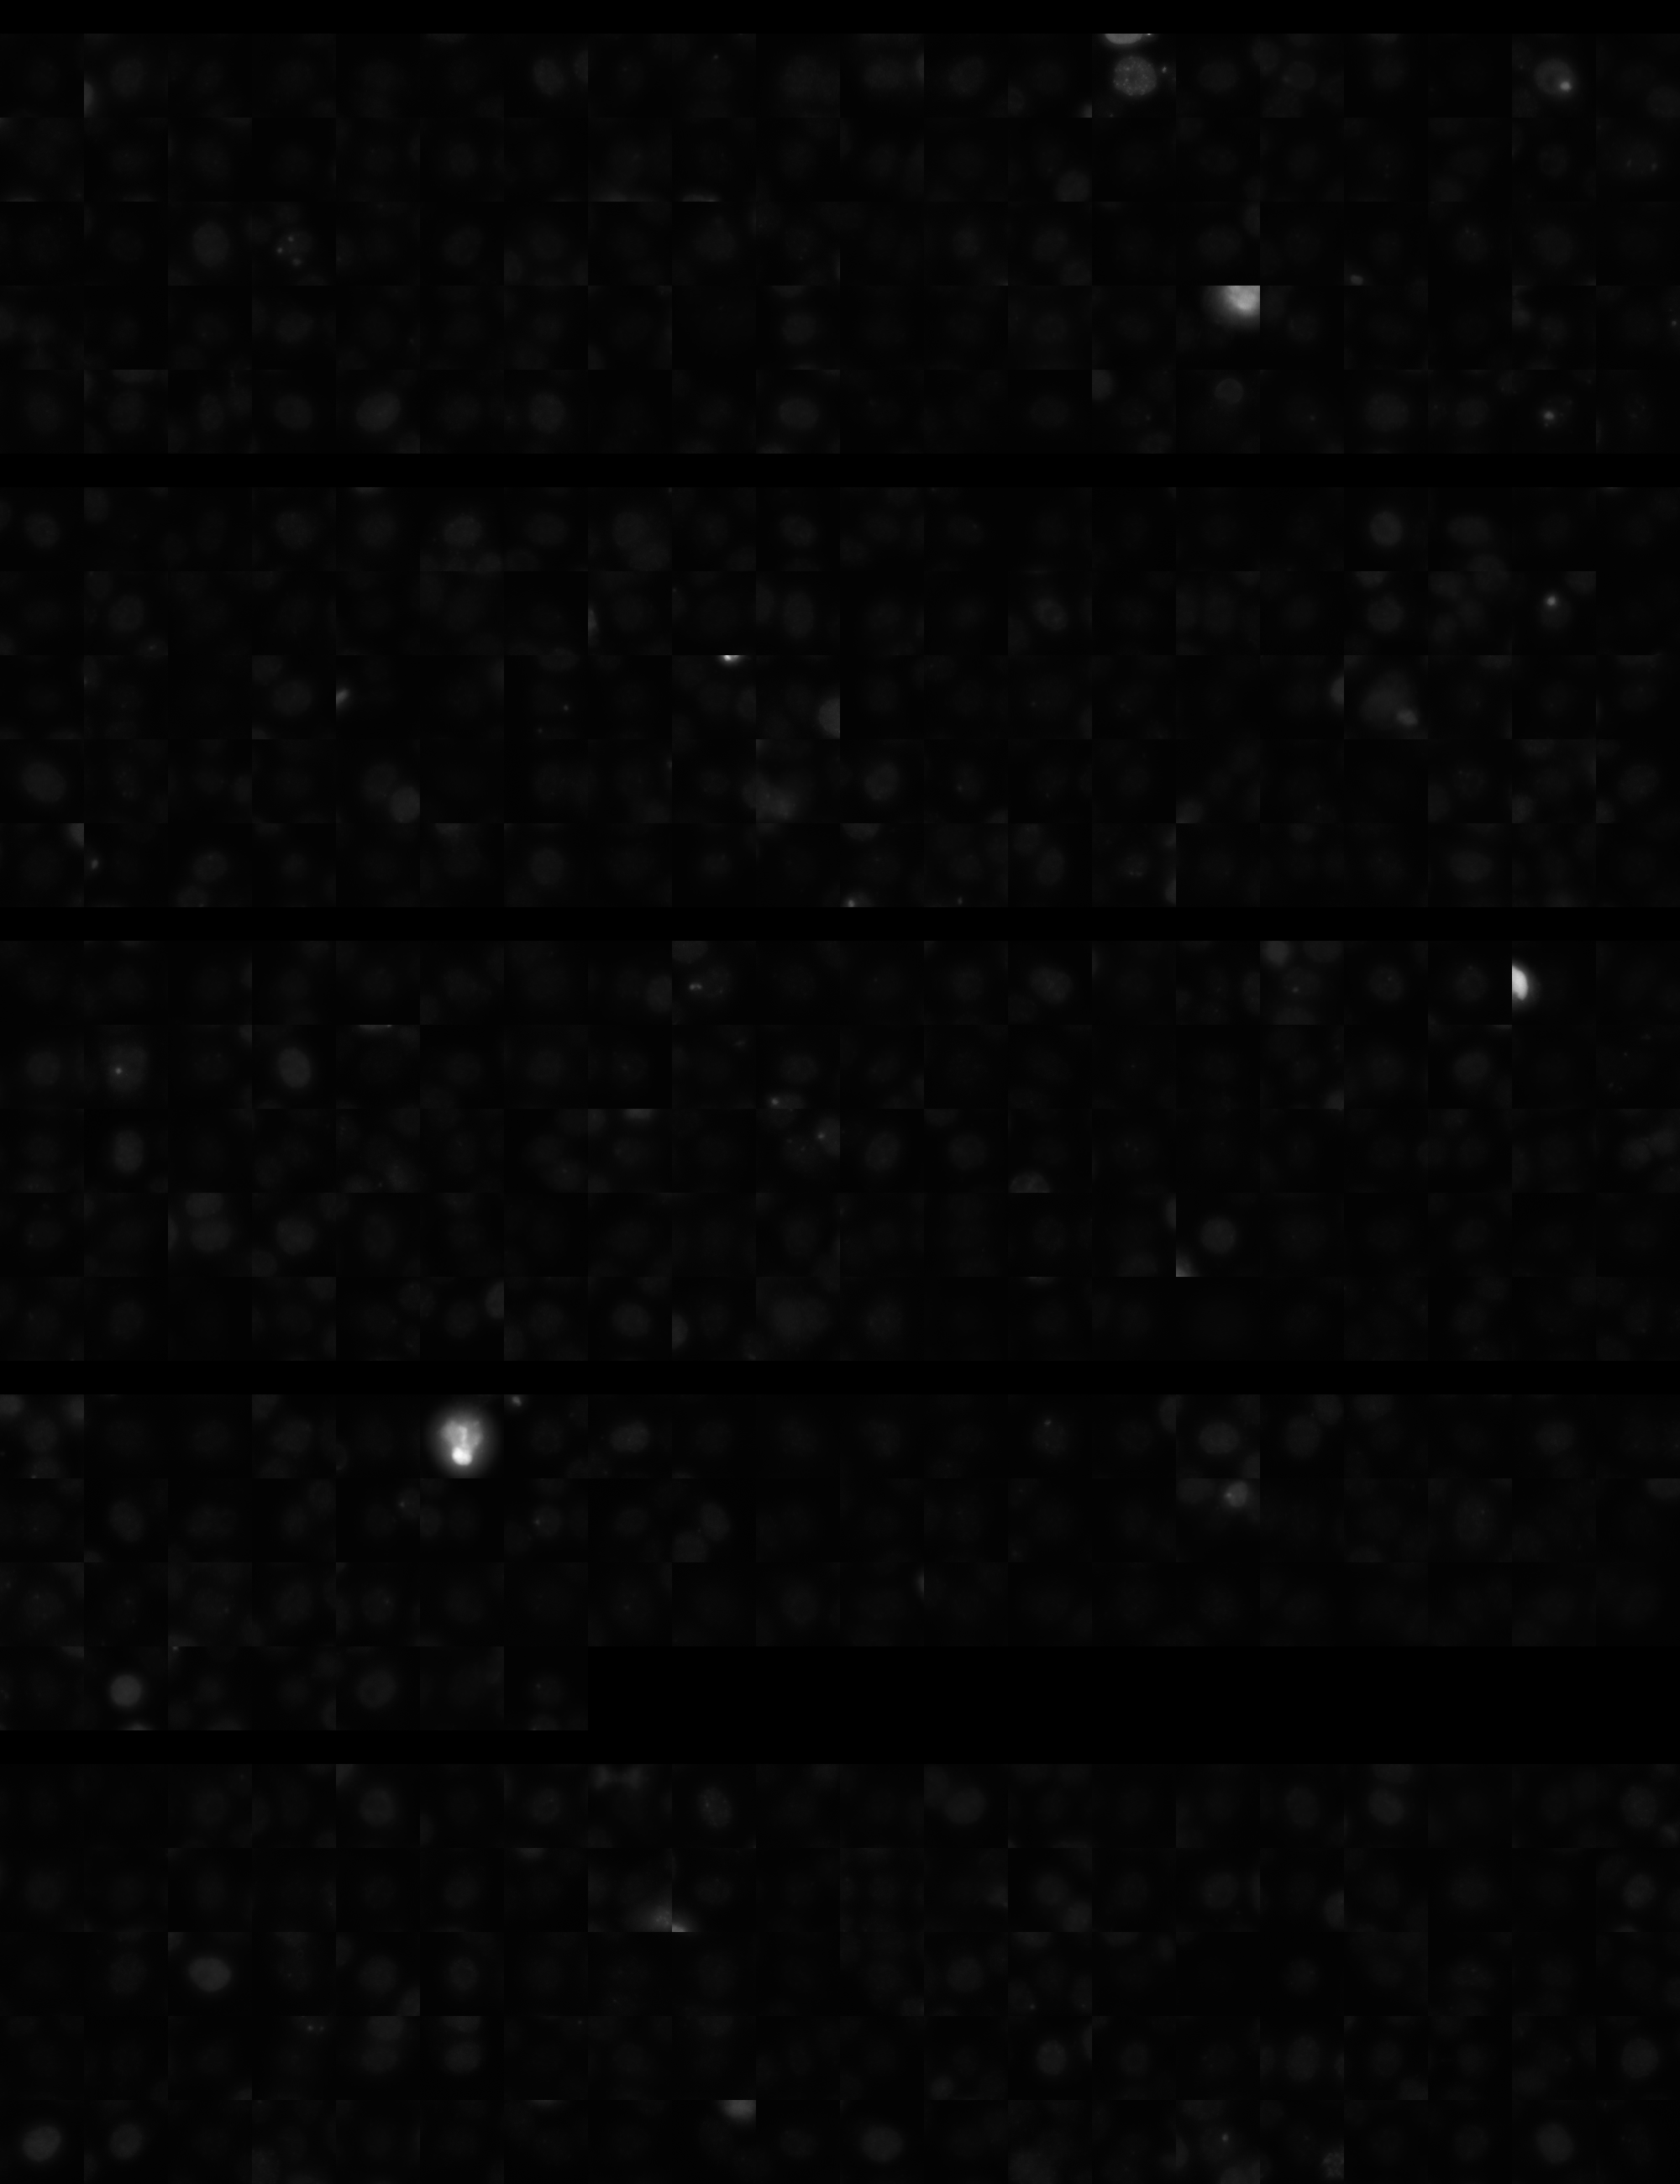
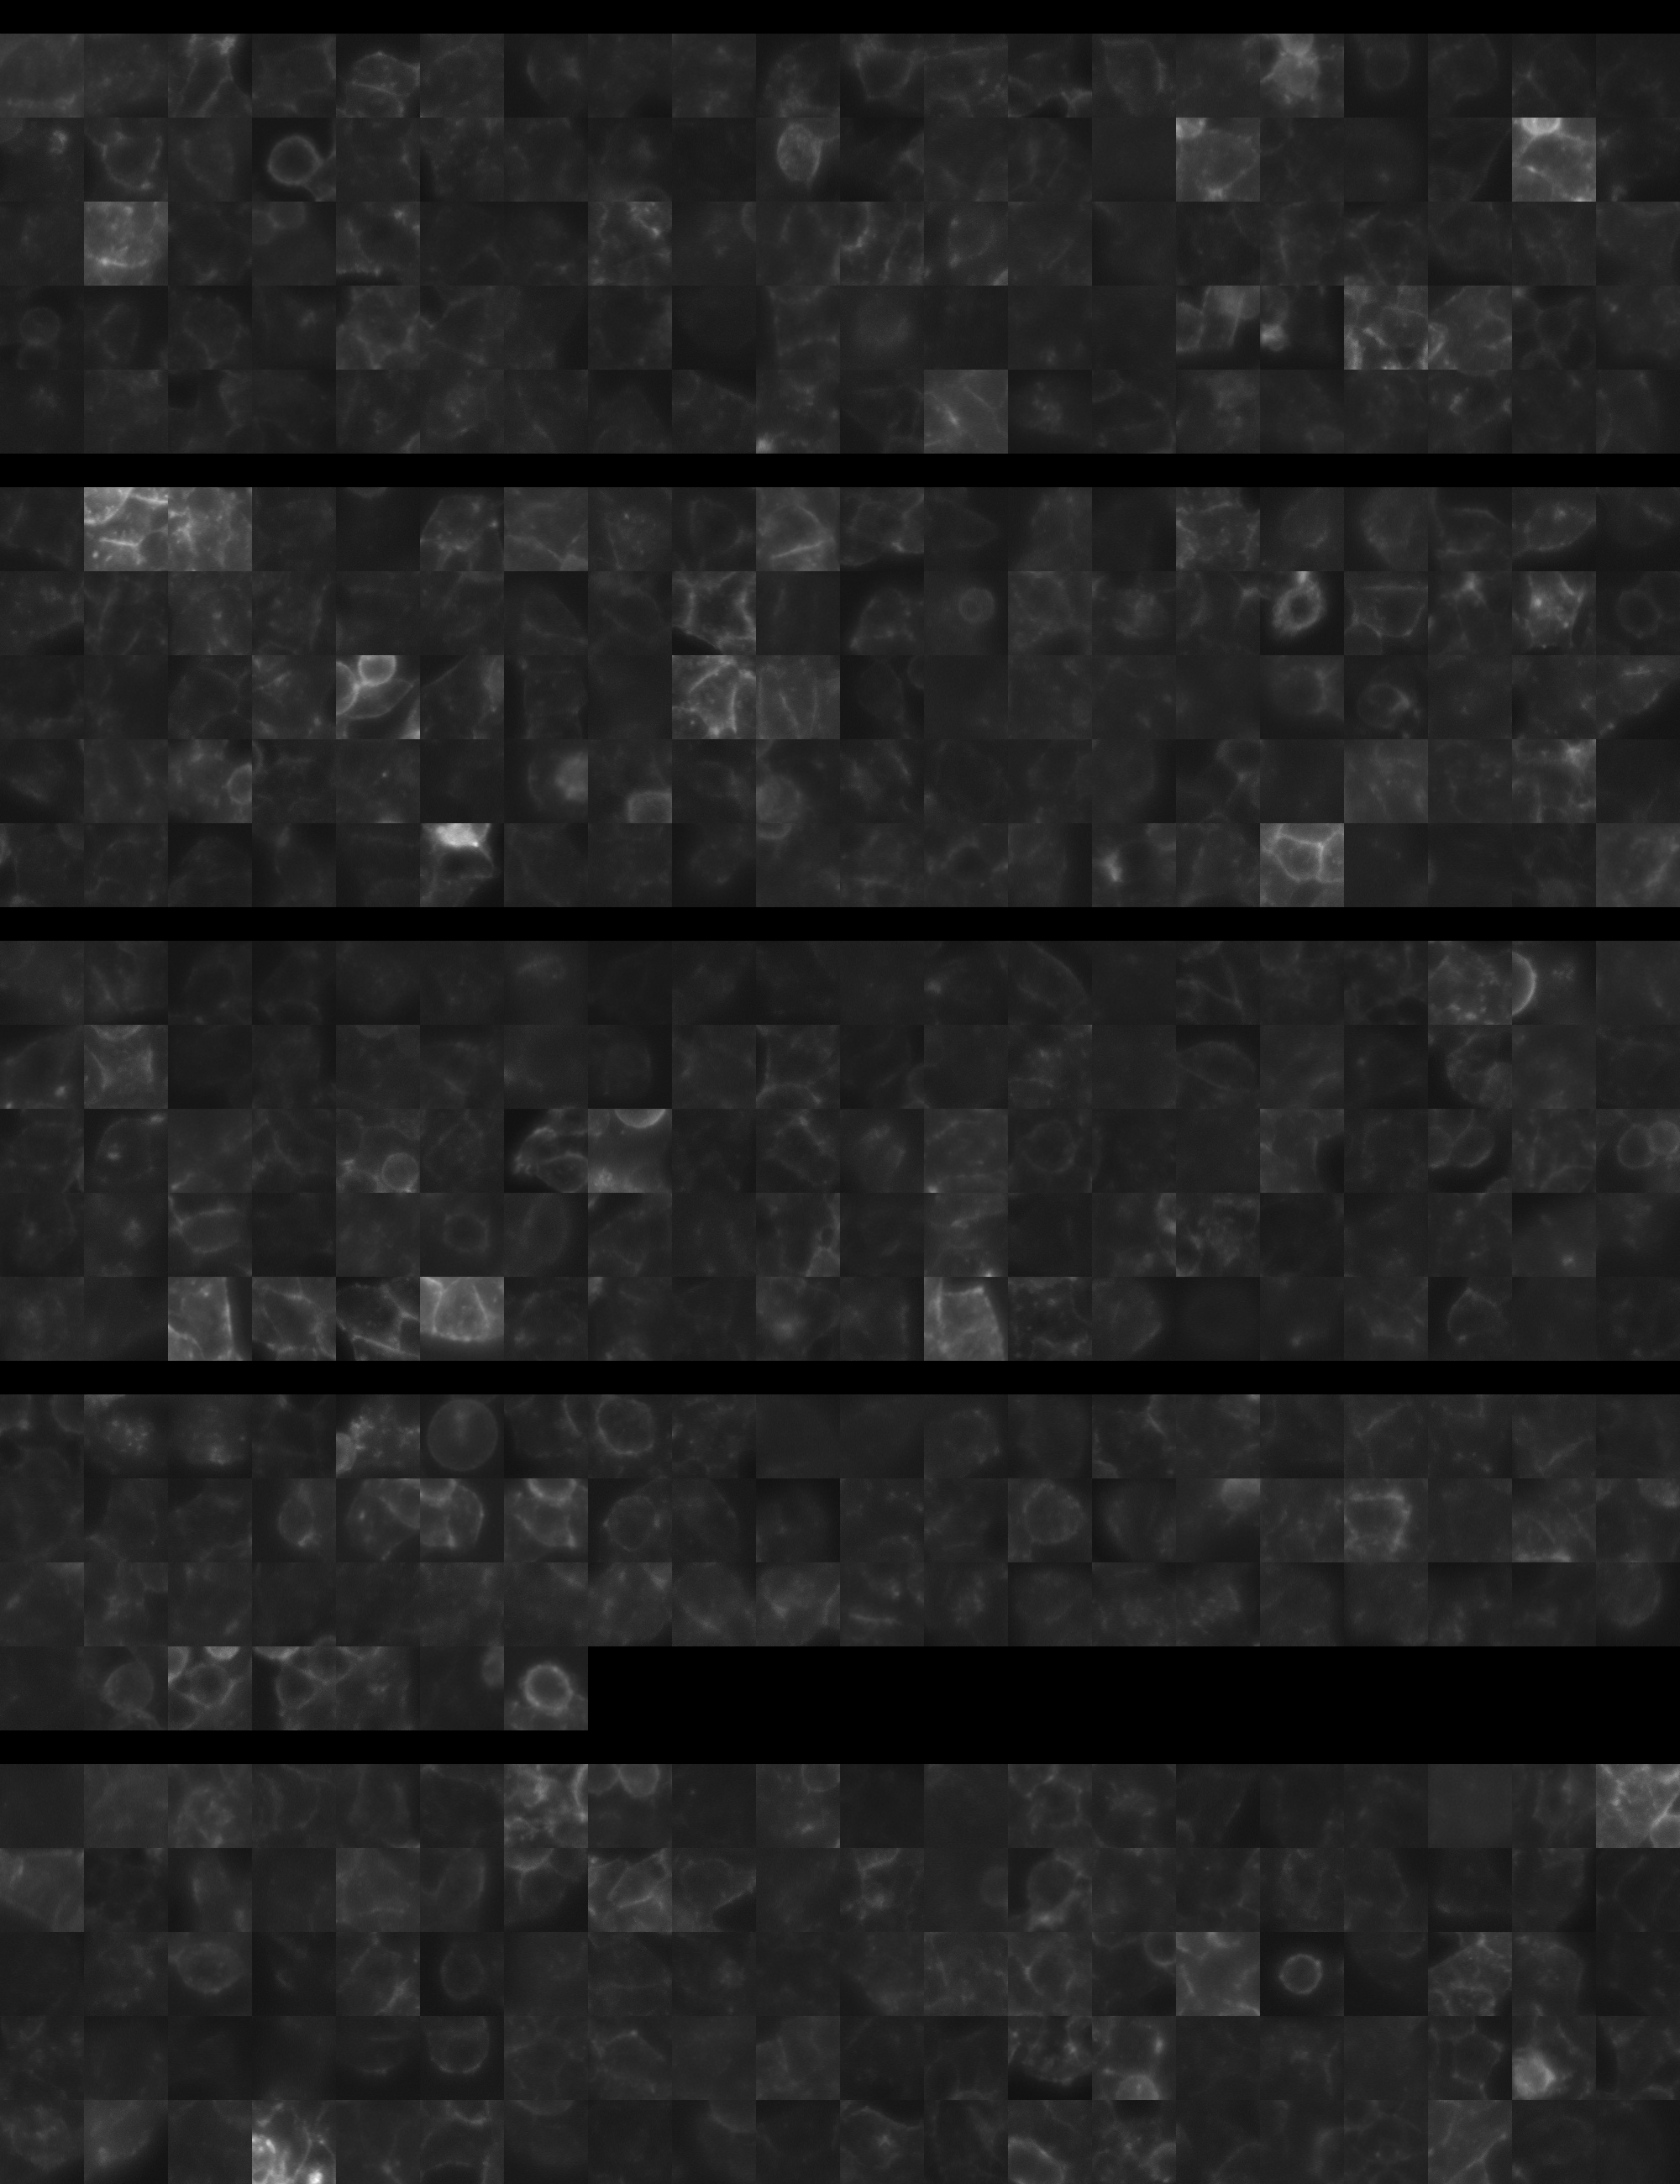
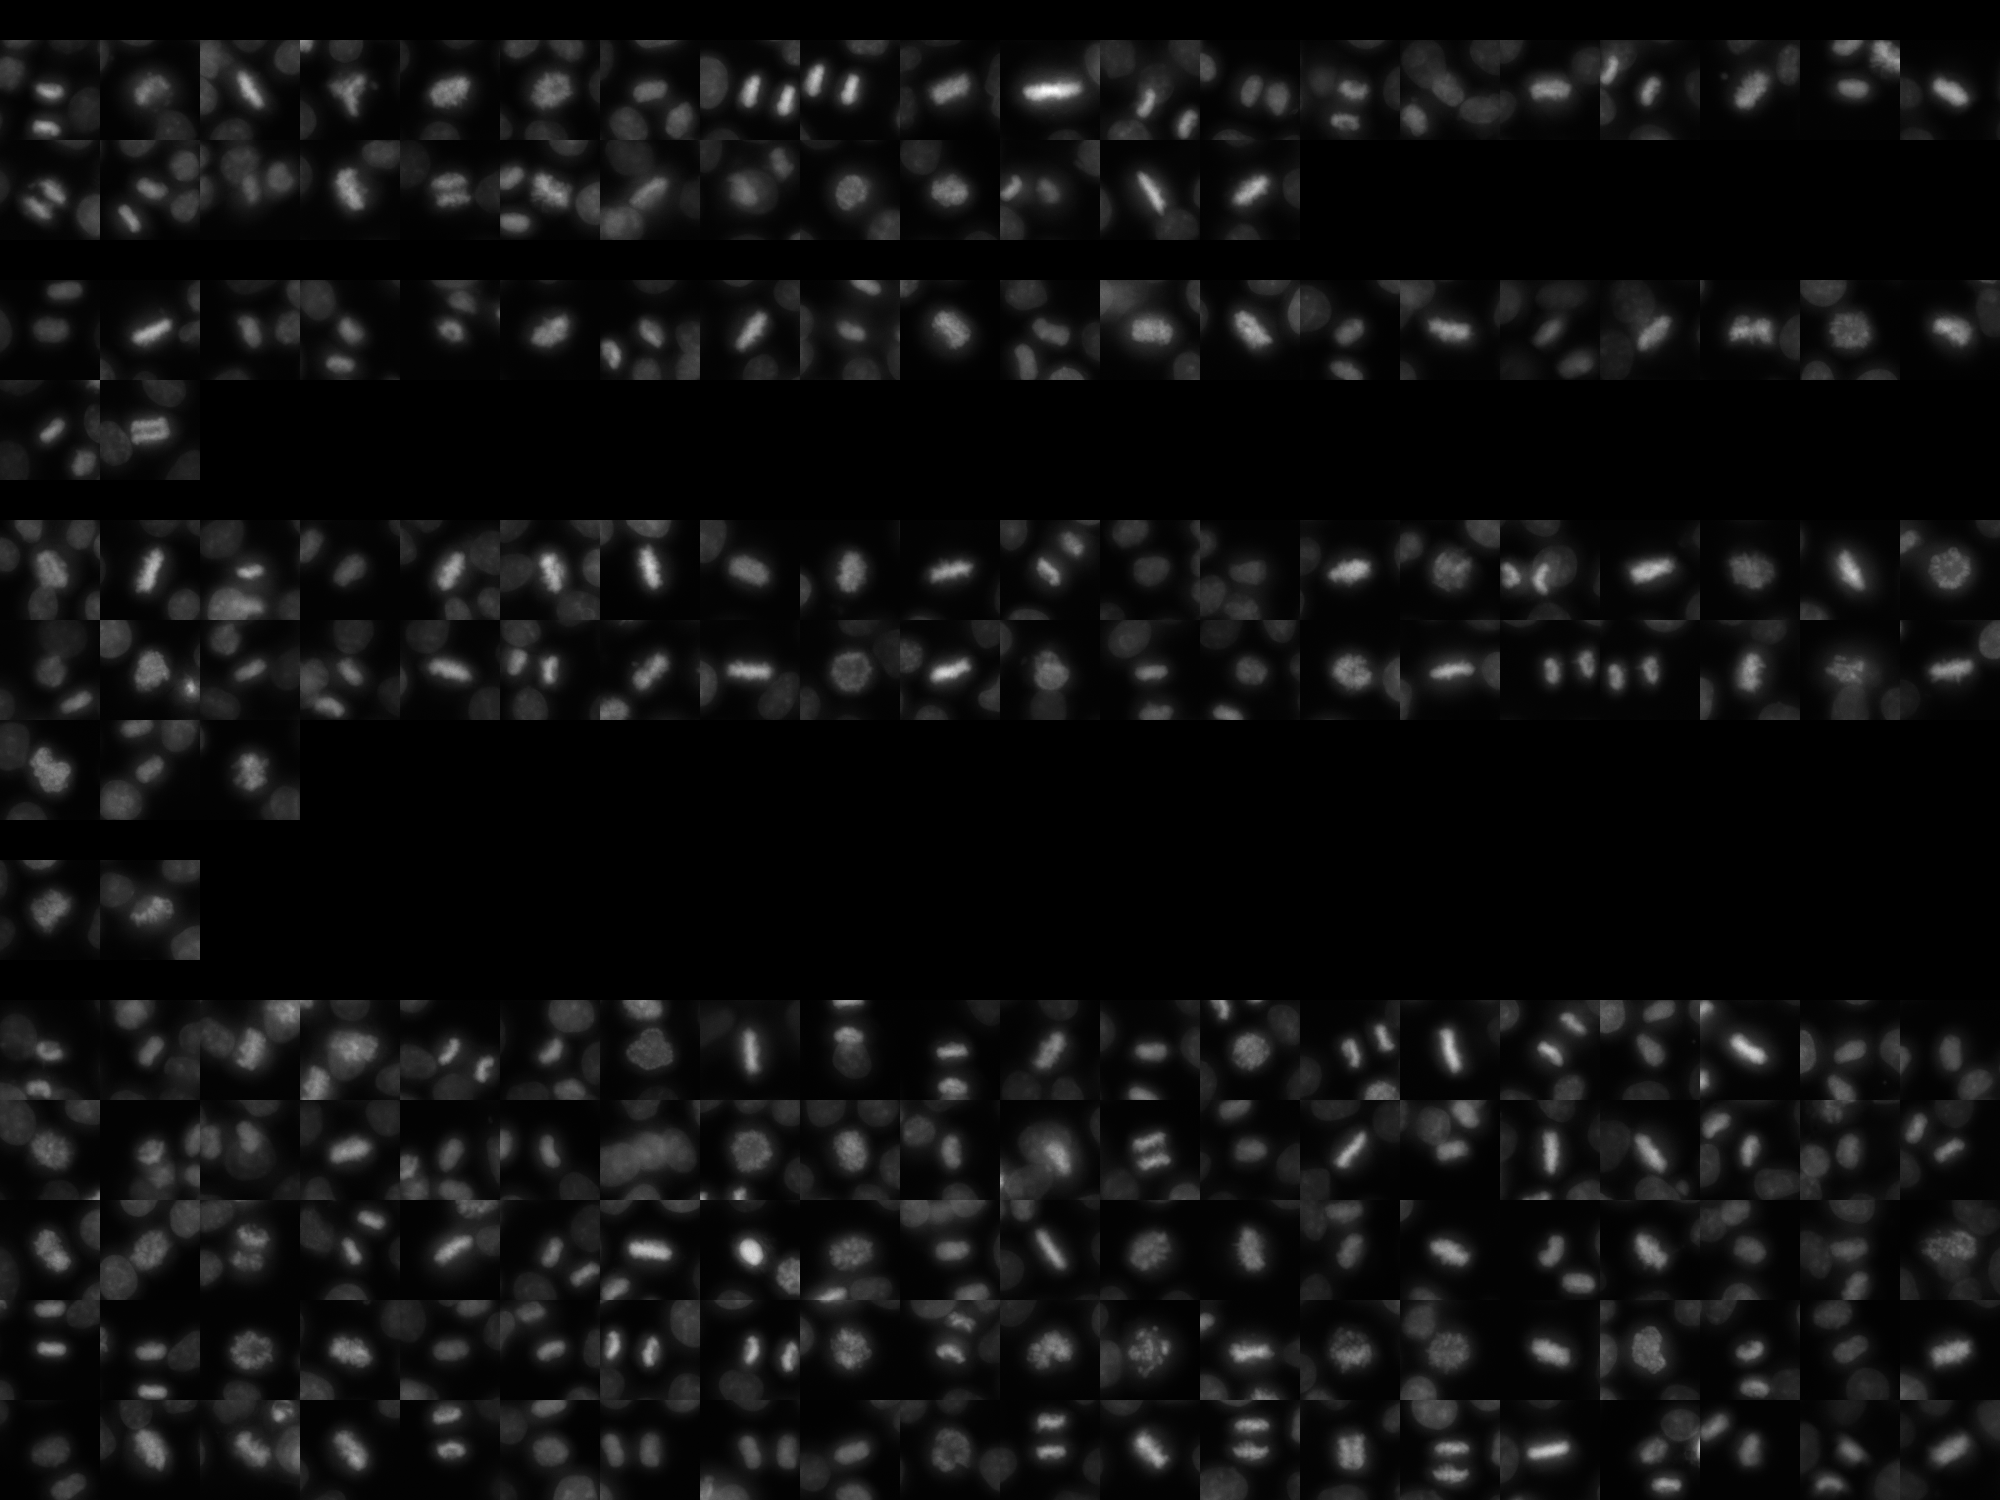
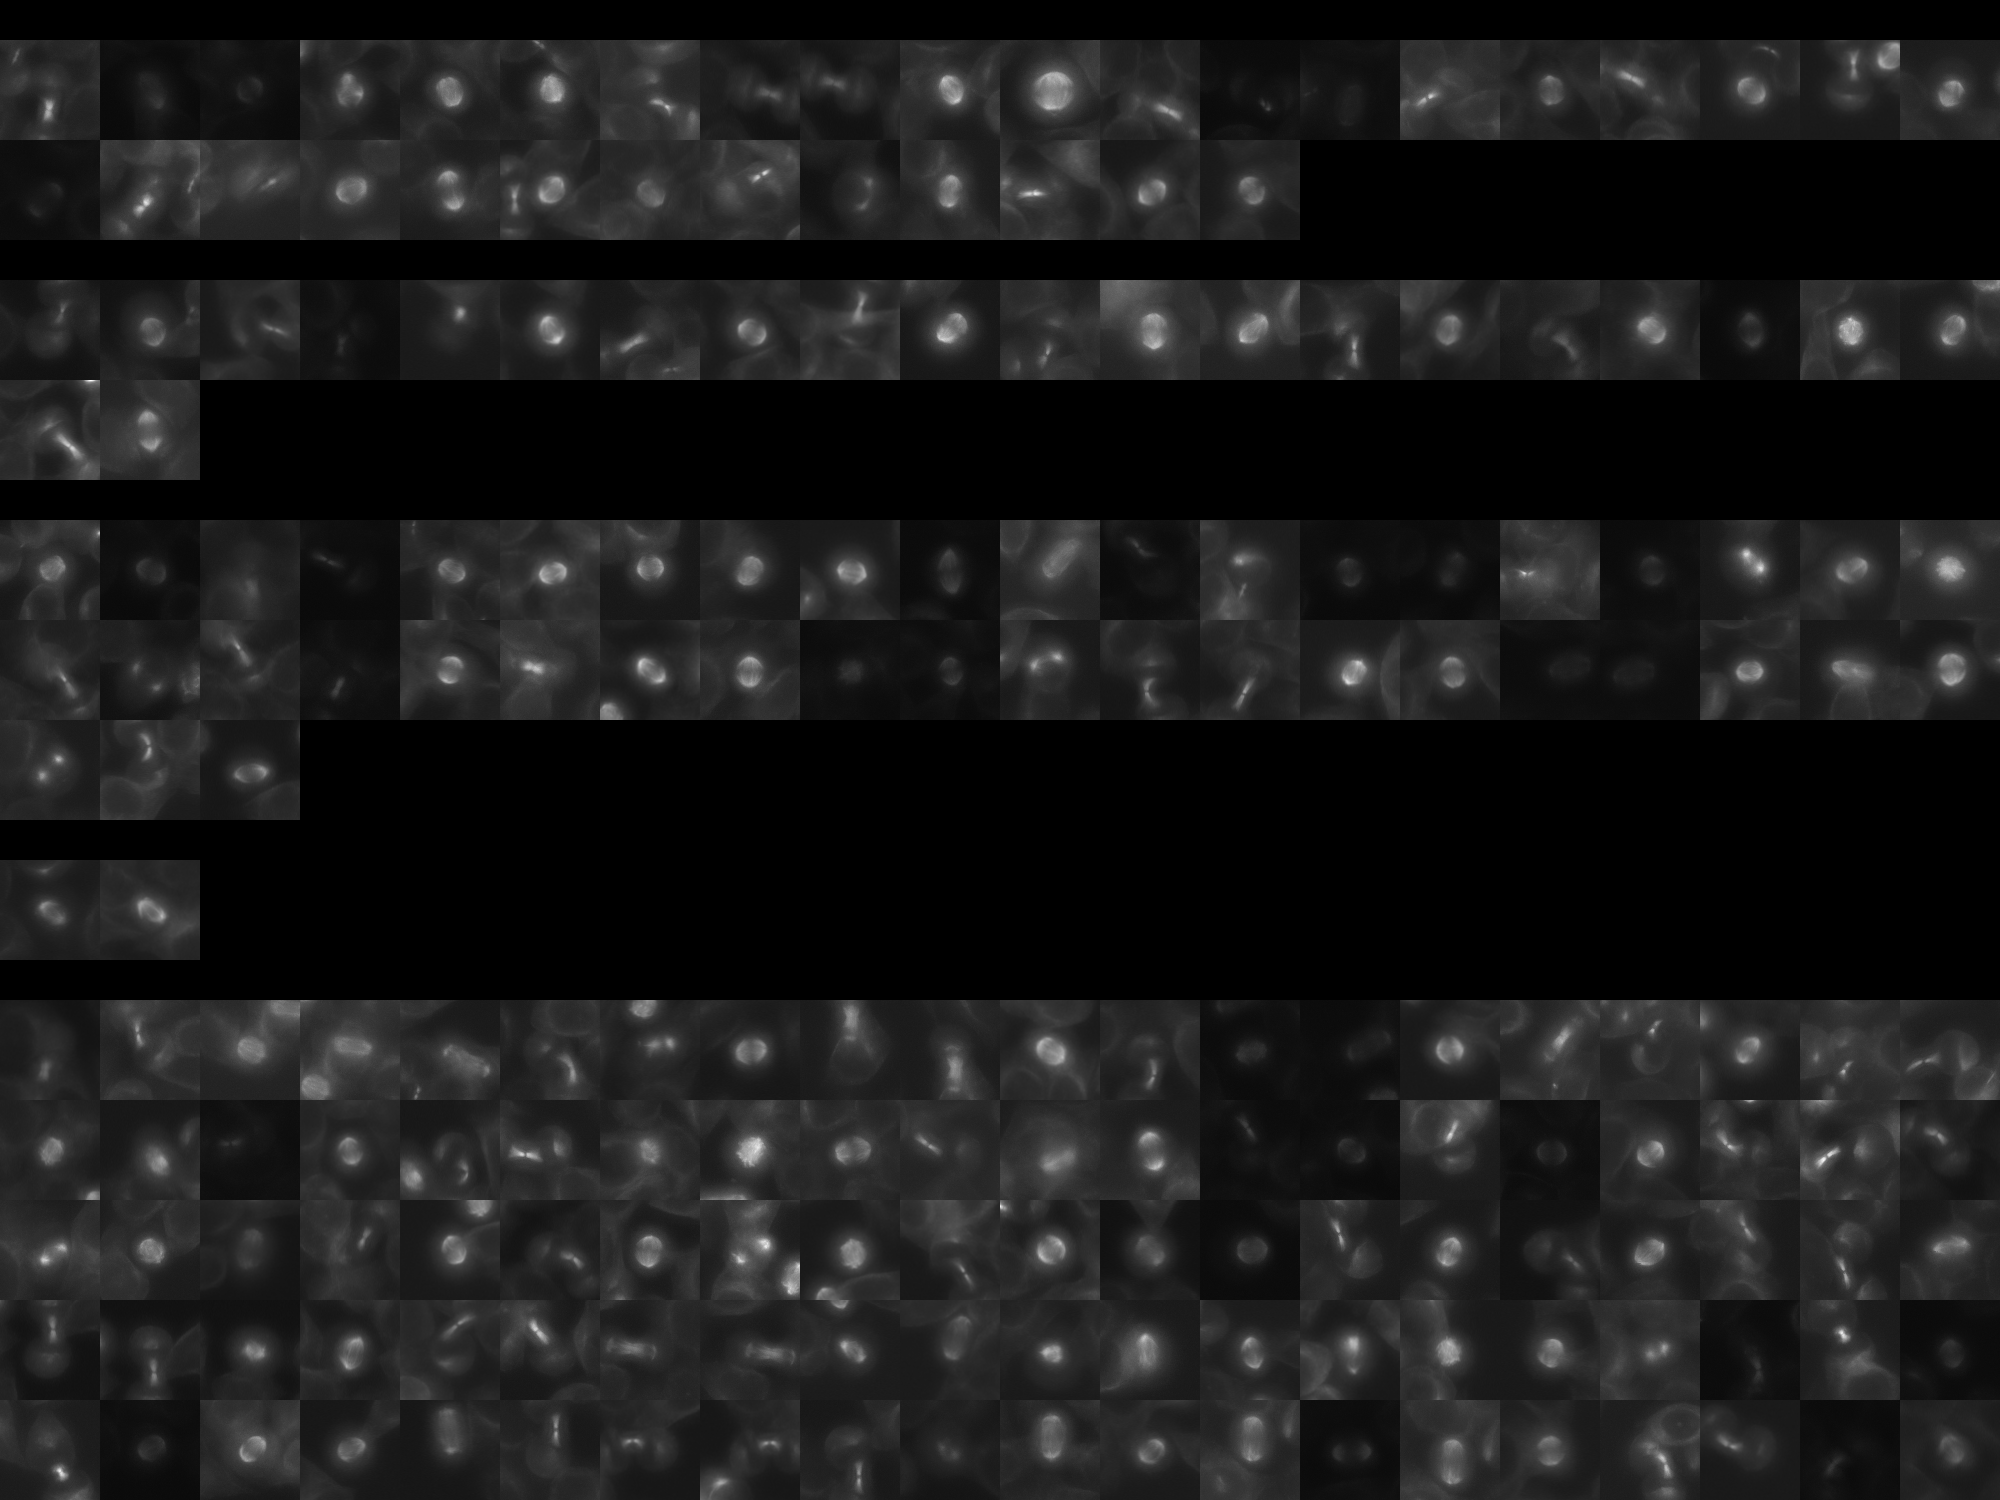
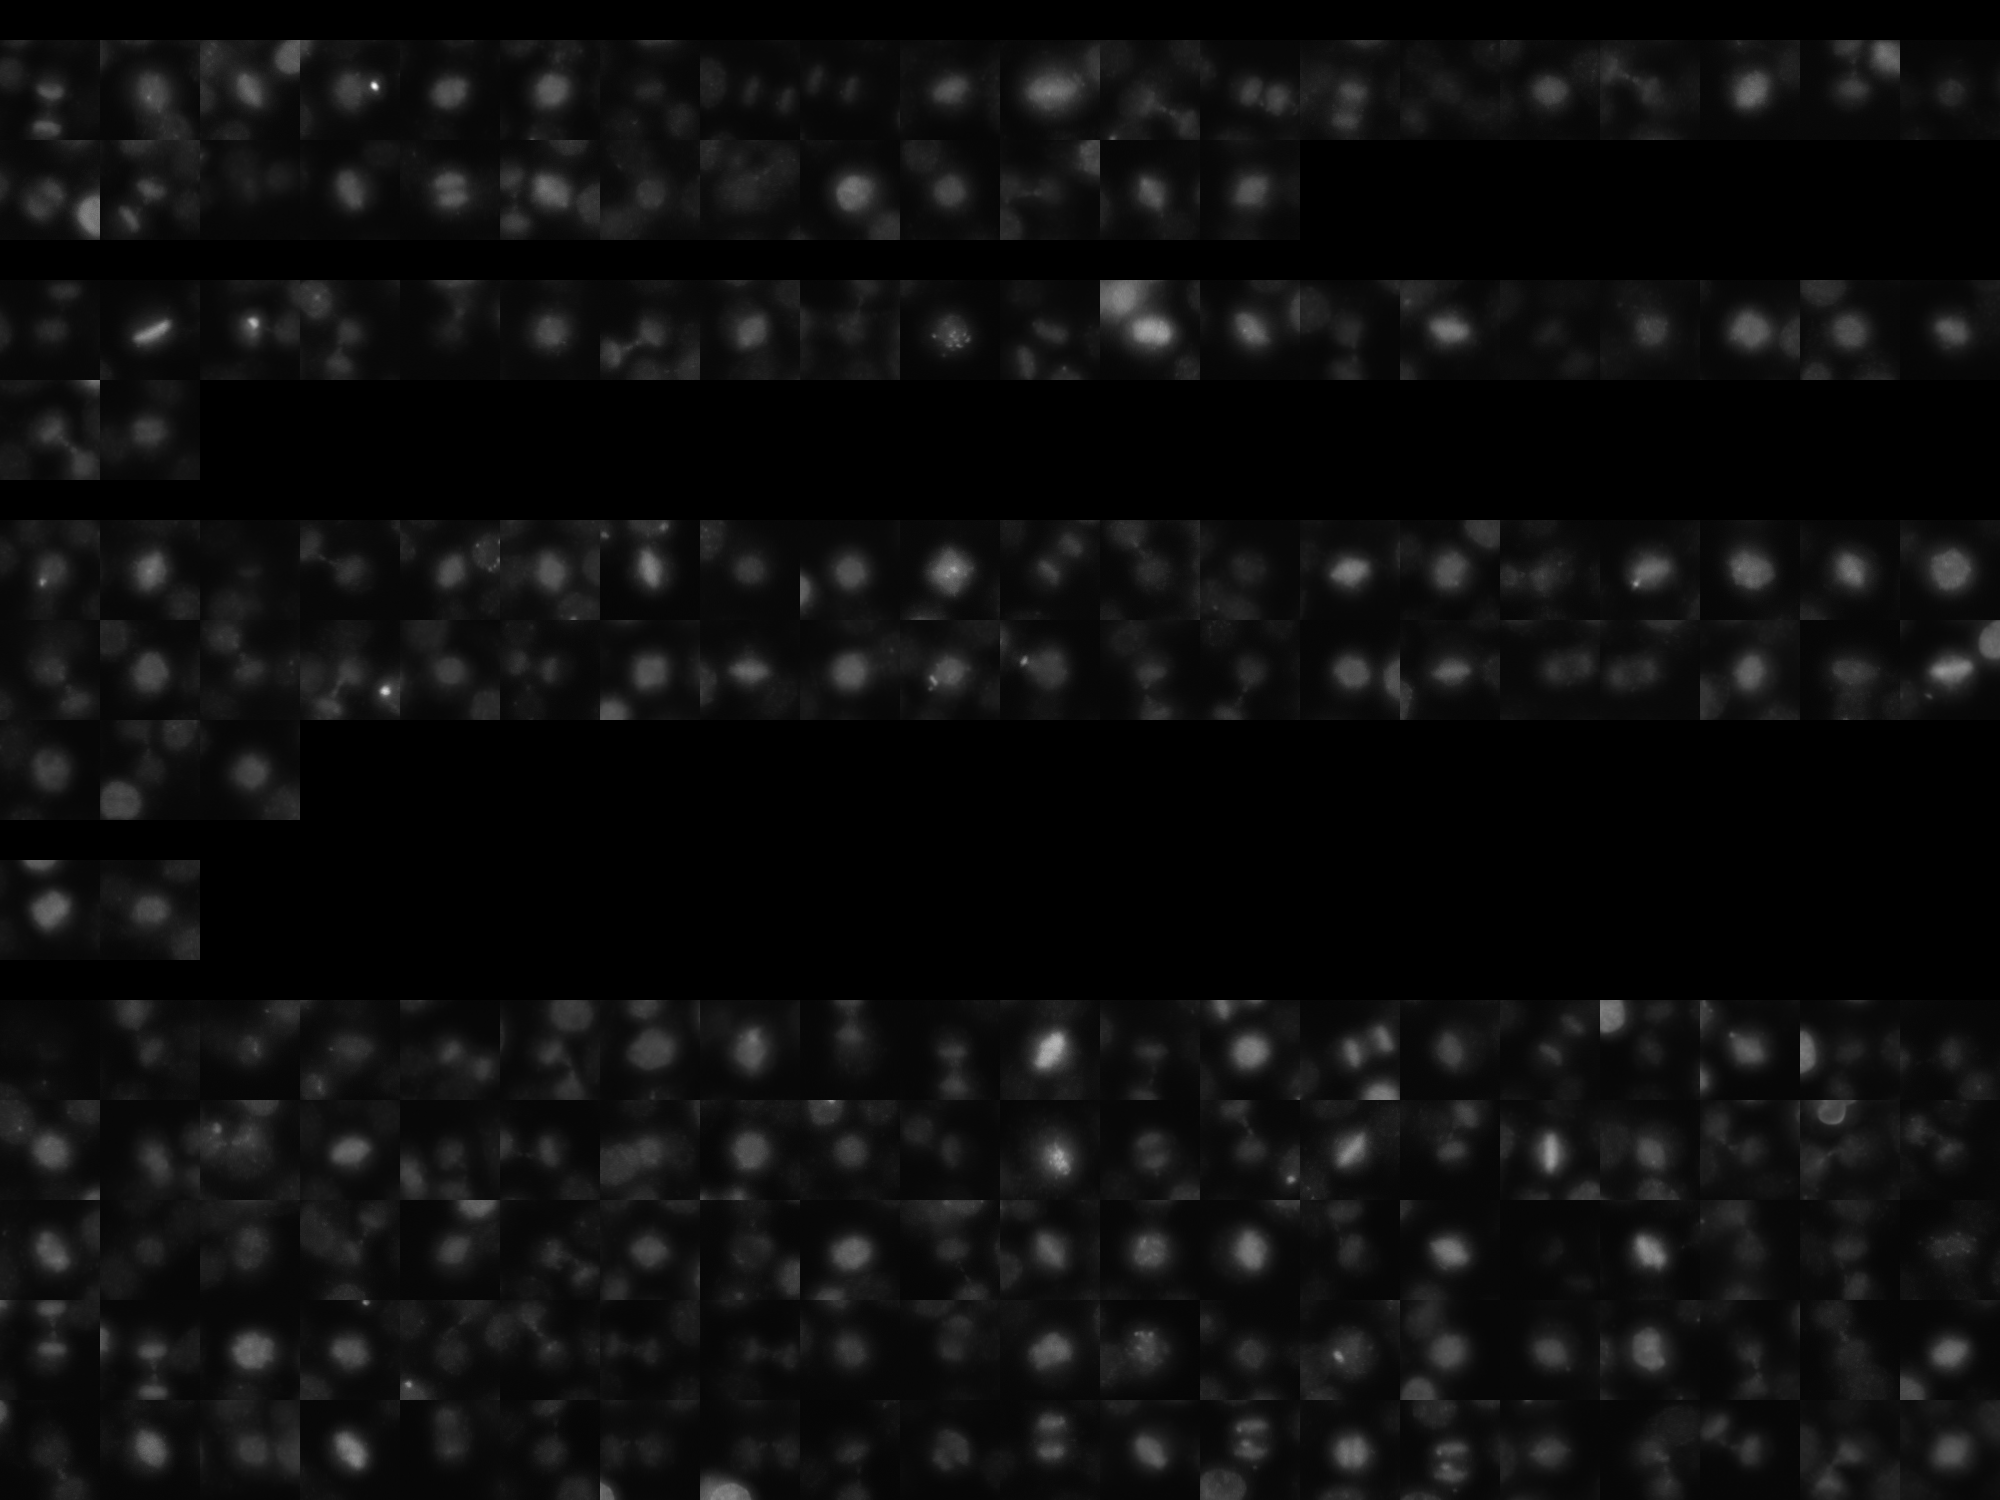
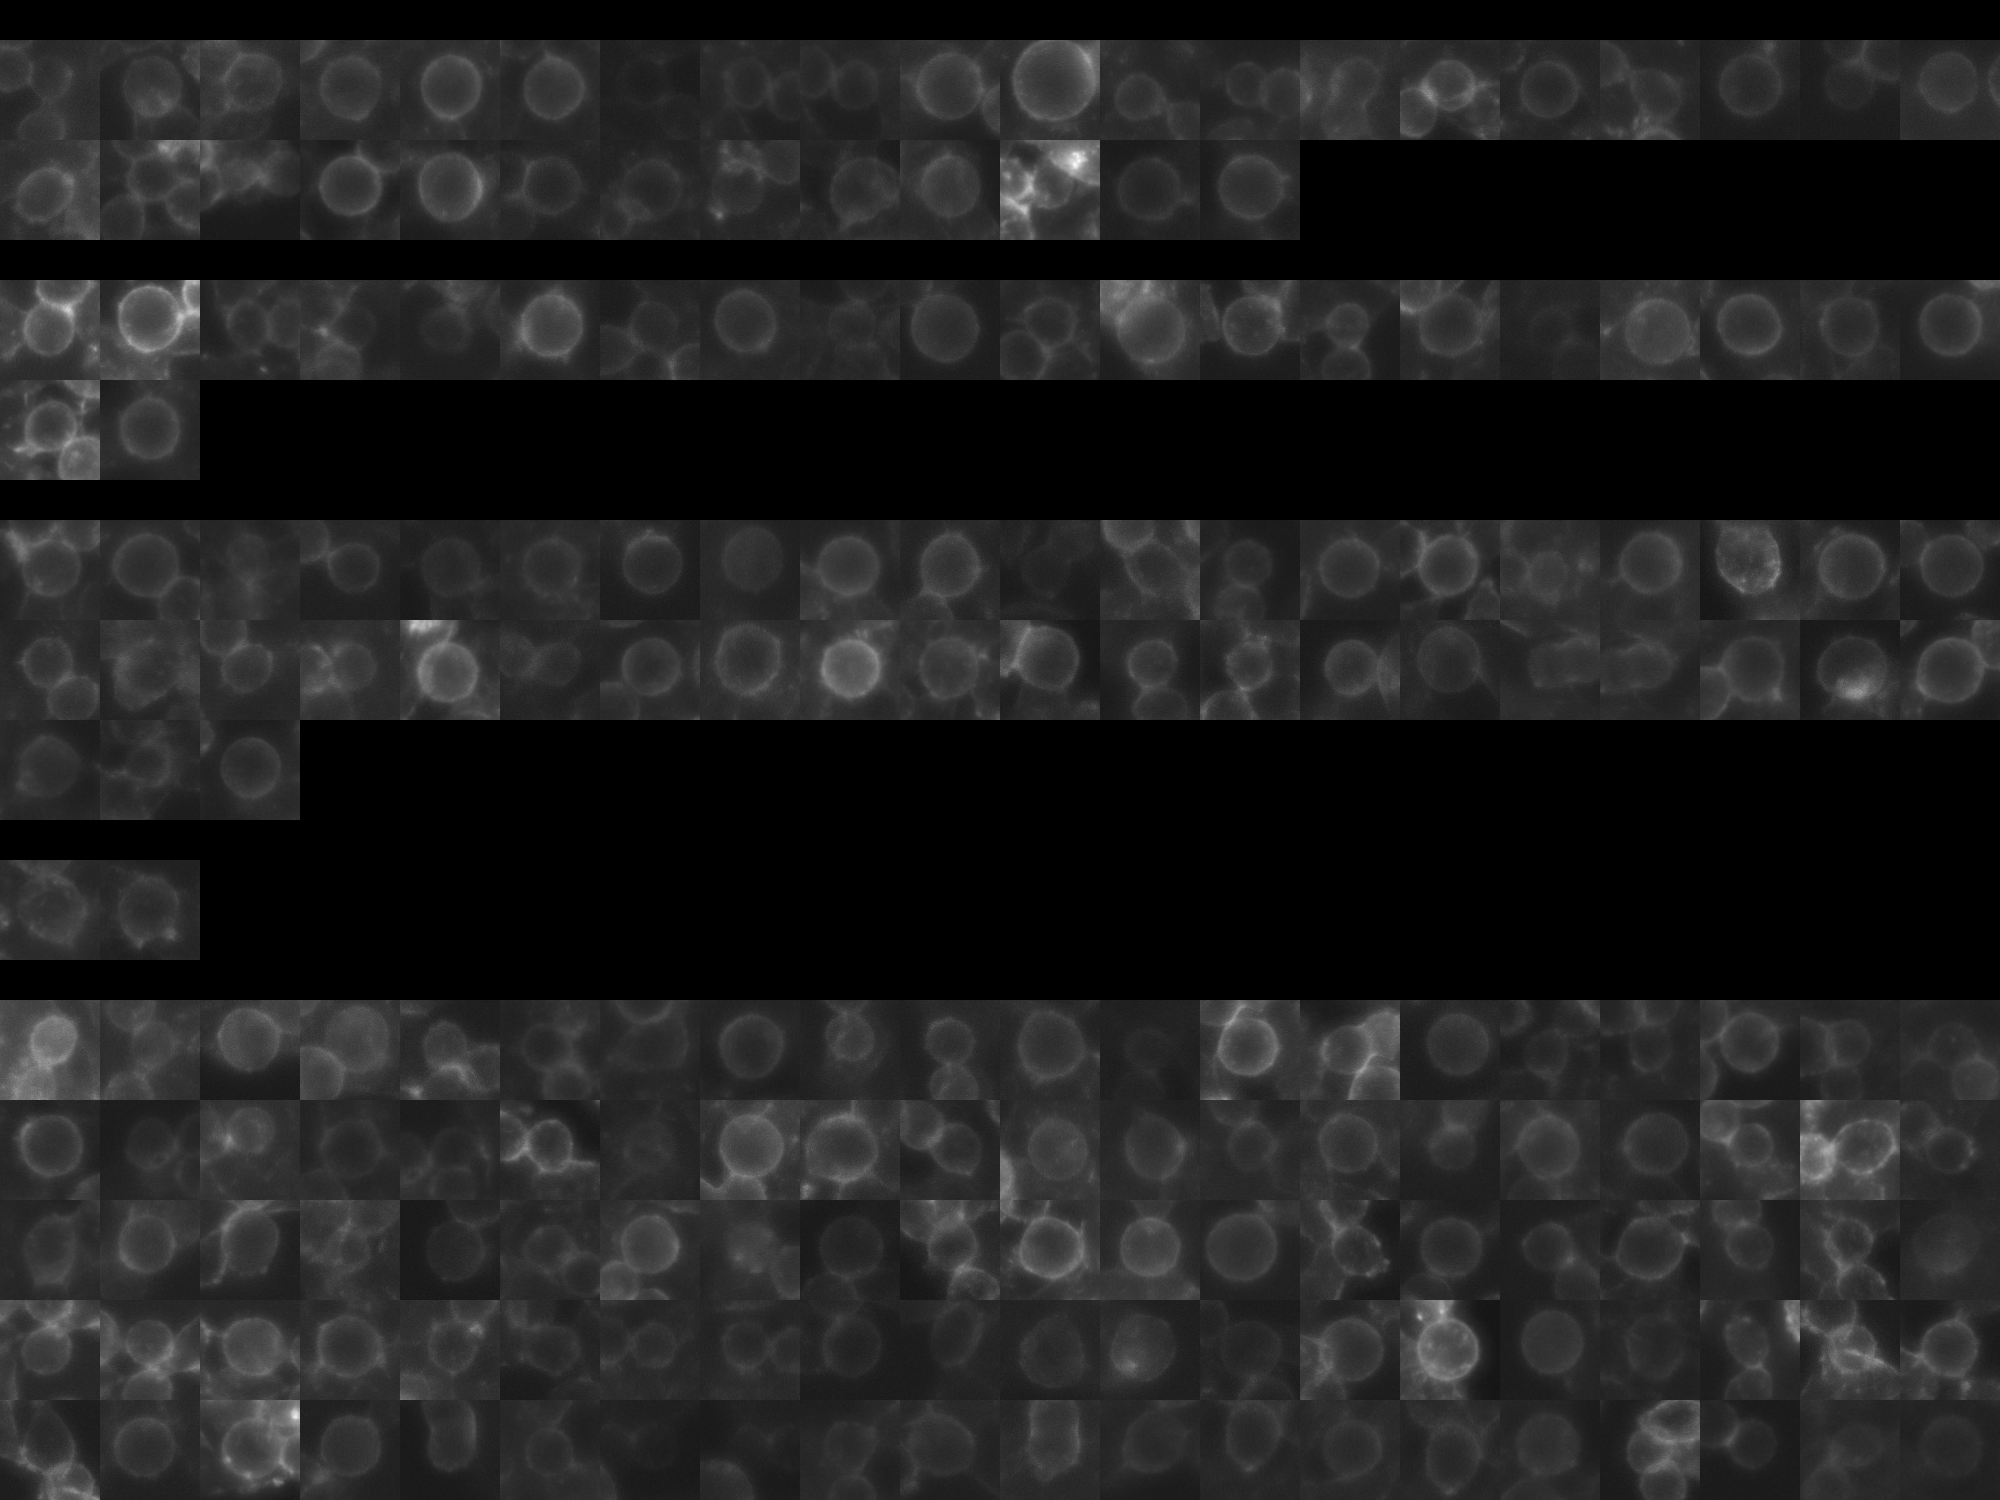
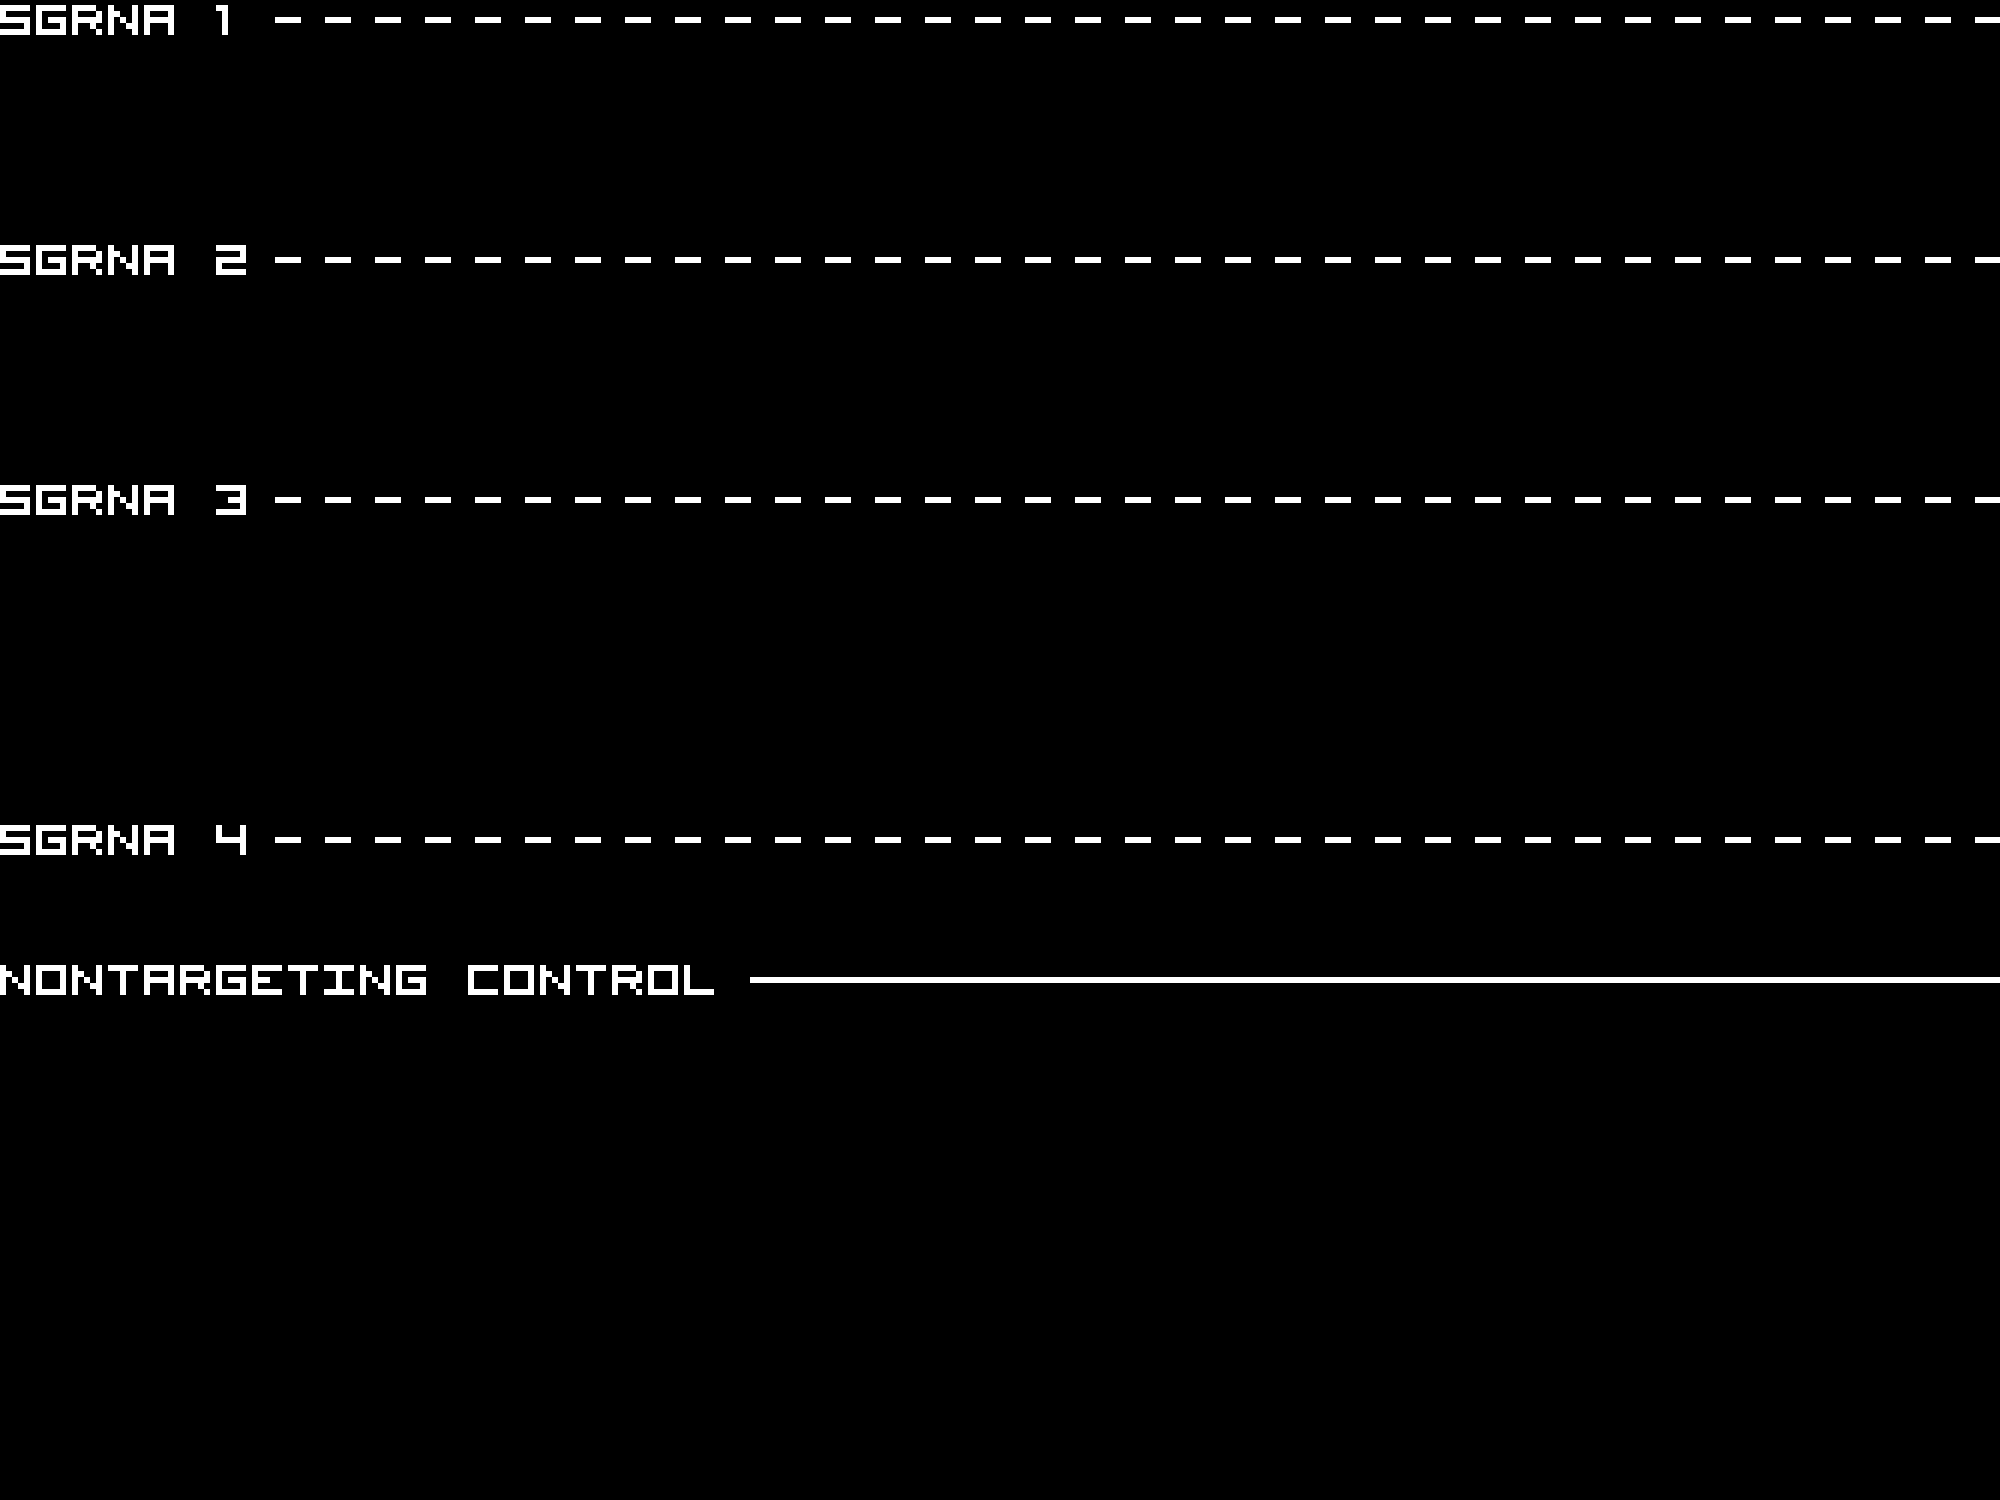
sgRNA 1: ATTGTACCTAAAGATGGCAC (interphase cells: 1104, mitotic cells: 33)
sgRNA 2: CATCATTCGAGGATCCATGT (interphase cells: 1555, mitotic cells: 22)
sgRNA 3: CTTAGCCGTCTAAATCGAGG (interphase cells: 1551, mitotic cells: 43)
sgRNA 4: TCTAAATCAGAAACTCGTTG (interphase cells: 67, mitotic cells: 2)

Interphase Cluster

Mitotic Cluster

Overview

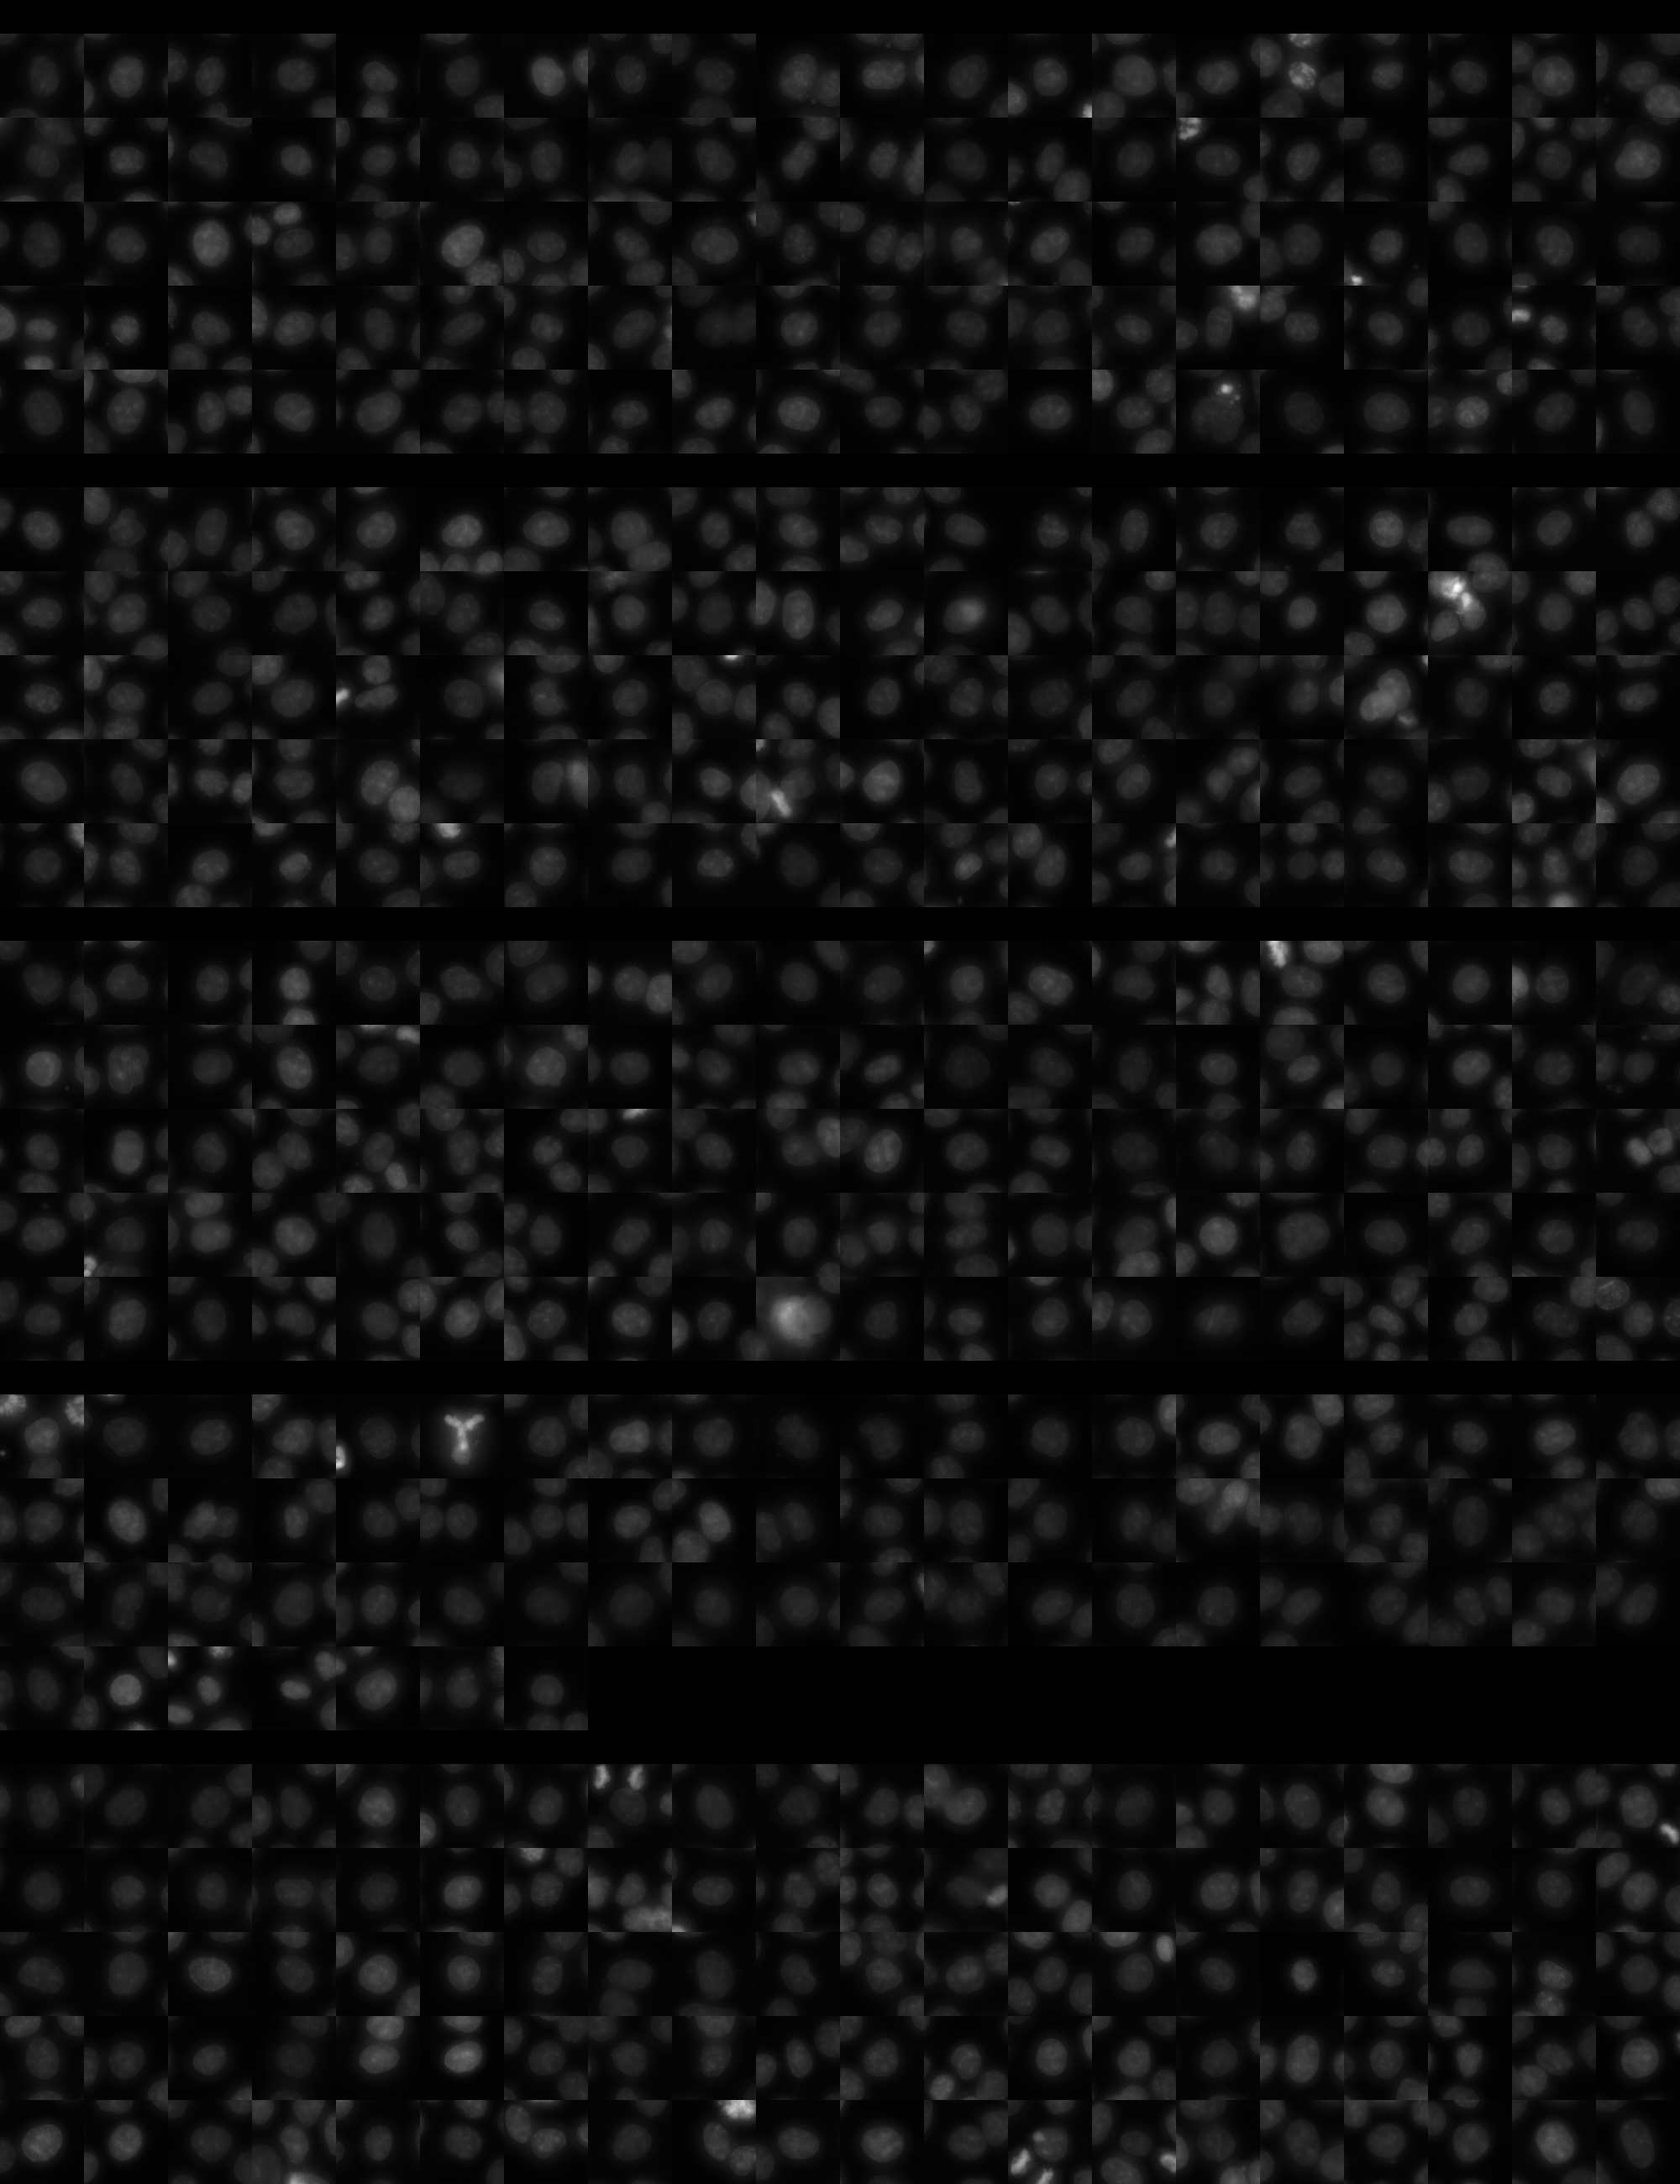
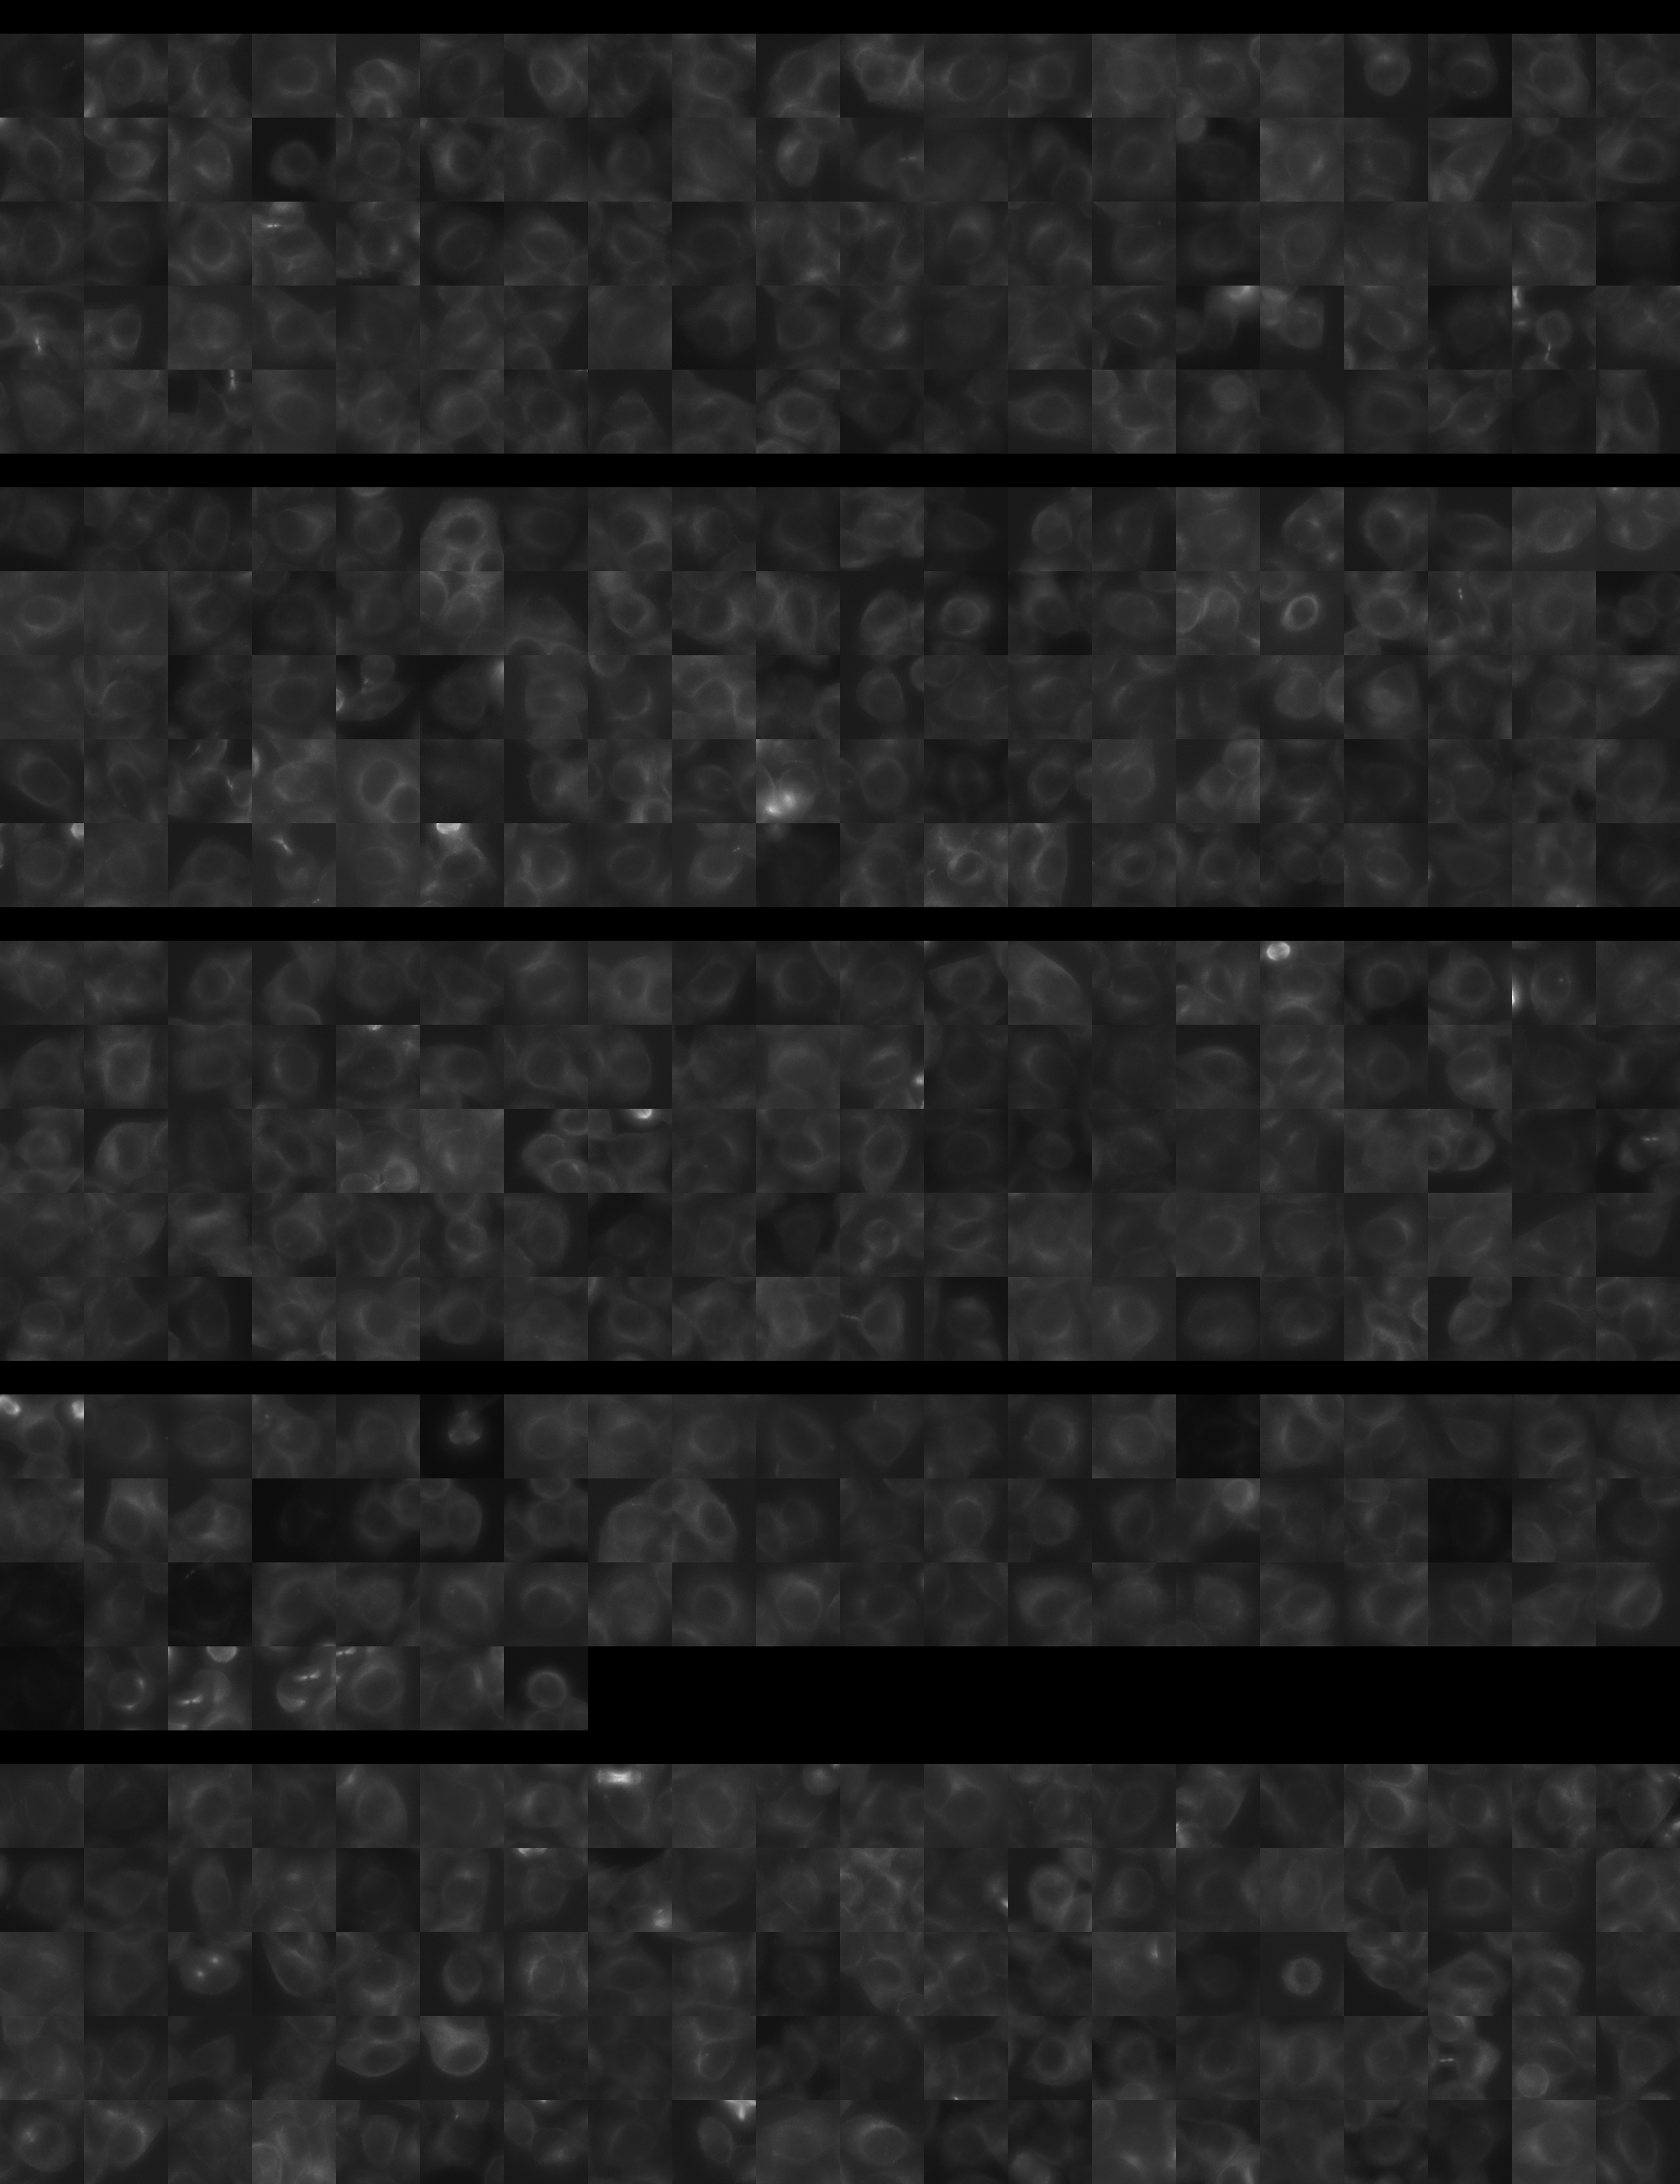
Each montage below shows randomly selected individual cell images for the same target gene separated by sgRNA, along with an example montage of cells expressing a non-targeting negative control sgRNA at the bottom. sgRNA labels in the montages correspond to the numbered sgRNA sequences in the gene info table above. The DNA (blue) and tubulin (green) channels are displayed by default, with gH2AX (grayscale) and actin (yellow) available using the check boxes. Channel brightness, contrast, and opacity are adjustable by clicking the arrow next to the channel name. When only one channel is selected, the display defaults to grayscale. Click the “Zoom” checkbox above the channel controls to enable image zooming (via scrolling) and panning (via click-and-drag).

The cell boxes displayed for this gene are square, 30.36 μm per side for the interphase montage and 30.36 μm per side for the mitotic montage.
Features

Interphase Score Rank FDR q-value
Nucleus DNA Integrated 0.061 790 of 5322 0.454
Nucleus DNA Mean 0.013 1600 of 5322 0.812
Nucleus gH2AX Mean 0.180 709 of 5322 0.001
Nucleus DNA - gH2AX Correlation -1.203e-01 4407 of 5322 0.002
Nucleus Shape Area 0.018 2692 of 5322 0.897
Nucleus Shape Eccentricity -1.558e-02 4054 of 5322 0.853
Nucleus Shape Form Factor -2.481e-02 1498 of 5322 0.674
Nucleus Shape Solidity -1.637e-02 1159 of 5322 0.745
Cell DNA Mass Displacement 0.014 3530 of 5322 0.904
Cell Tubulin Mean 0.075 710 of 5322 0.136
Cell Tubulin Mass Displacement 0.052 575 of 5322 0.379
Cell Actin Mean 0.094 883 of 5322 0.091
Cell Tubulin - Actin Correlation 0.109 507 of 5322 0.028
Cell DNA - Tubulin Correlation 0.069 1457 of 5322 0.150
Cell Shape Area 0.042 1765 of 5322 0.665
Cell Shape Eccentricity 0.014 2551 of 5322 0.915
Mitotic Score Rank FDR q-value
Nucleus DNA Integrated 0.034 3472 of 5322 0.996
Nucleus DNA Mean 0.252 364 of 5322 1.000
Nucleus DNA Mass Displacement -1.333e-01 4937 of 5322 0.999
Nucleus DNA Mean Frac 3 -6.061e-02 3979 of 5322 1.000
Nucleus gH2AX Mean 0.317 304 of 5322 1.000
Nucleus gH2AX Mean Frac 0 0.053 1506 of 5322 1.000
Nucleus Tubulin Mean Frac 0 -1.236e-01 4843 of 5322 0.999
Nucleus Tubulin Mean Edge 0.145 1315 of 5322 0.999
Nucleus Tubulin Std Edge 0.288 177 of 5322 0.999
Nucleus Shape Area -2.591e-02 4222 of 5322 0.990
Nucleus Shape Eccentricity -9.716e-02 3535 of 5322 1.000
Nucleus Shape Form Factor -3.843e-02 1939 of 5322 0.998
Cell Tubulin Mean -4.379e-02 4053 of 5322 0.997
Cell Tubulin Mean Frac 3 -2.598e-02 1990 of 5322 0.999
Cell Actin Mean -3.146e-02 3655 of 5322 0.997
Cell Shape Area 0.228 1143 of 5322 0.994
( Reset Zoom )
Brightness
Contrast
Opacity
Brightness
Contrast
Opacity
Brightness
Contrast
Opacity
Brightness
Contrast
Opacity
Brightness
Contrast
Opacity

( Reset Zoom )
Brightness
Contrast
Opacity
Brightness
Contrast
Opacity
Brightness
Contrast
Opacity
Brightness
Contrast
Opacity
Brightness
Contrast
Opacity

MIT Central Accessability