POLR3H

Gene symbol: POLR3H
Gene: 171568
Uniprot Function: DNA-dependent RNA polymerase catalyzes the transcription of DNA into RNA using the four ribonucleoside triphosphates as substrates. Specific peripheric component of RNA polymerase III which synthesizes small RNAs, such as 5S rRNA and tRNAs. Plays a key role in sensing and limiting infection by intracellular bacteria and DNA viruses. Acts as nuclear and cytosolic DNA sensor involved in innate immune response. Can sense non-self dsDNA that serves as template for transcription into dsRNA. The non-self RNA polymerase III transcripts, such as Epstein-Barr virus-encoded RNAs (EBERs) induce type I interferon and NF- Kappa-B through the RIG-I pathway (By similarity).
Mitotic Index 0.0278
Interphase Cluster: #221 (4 genes)
Mitotic Cluster: #30 (33 genes)
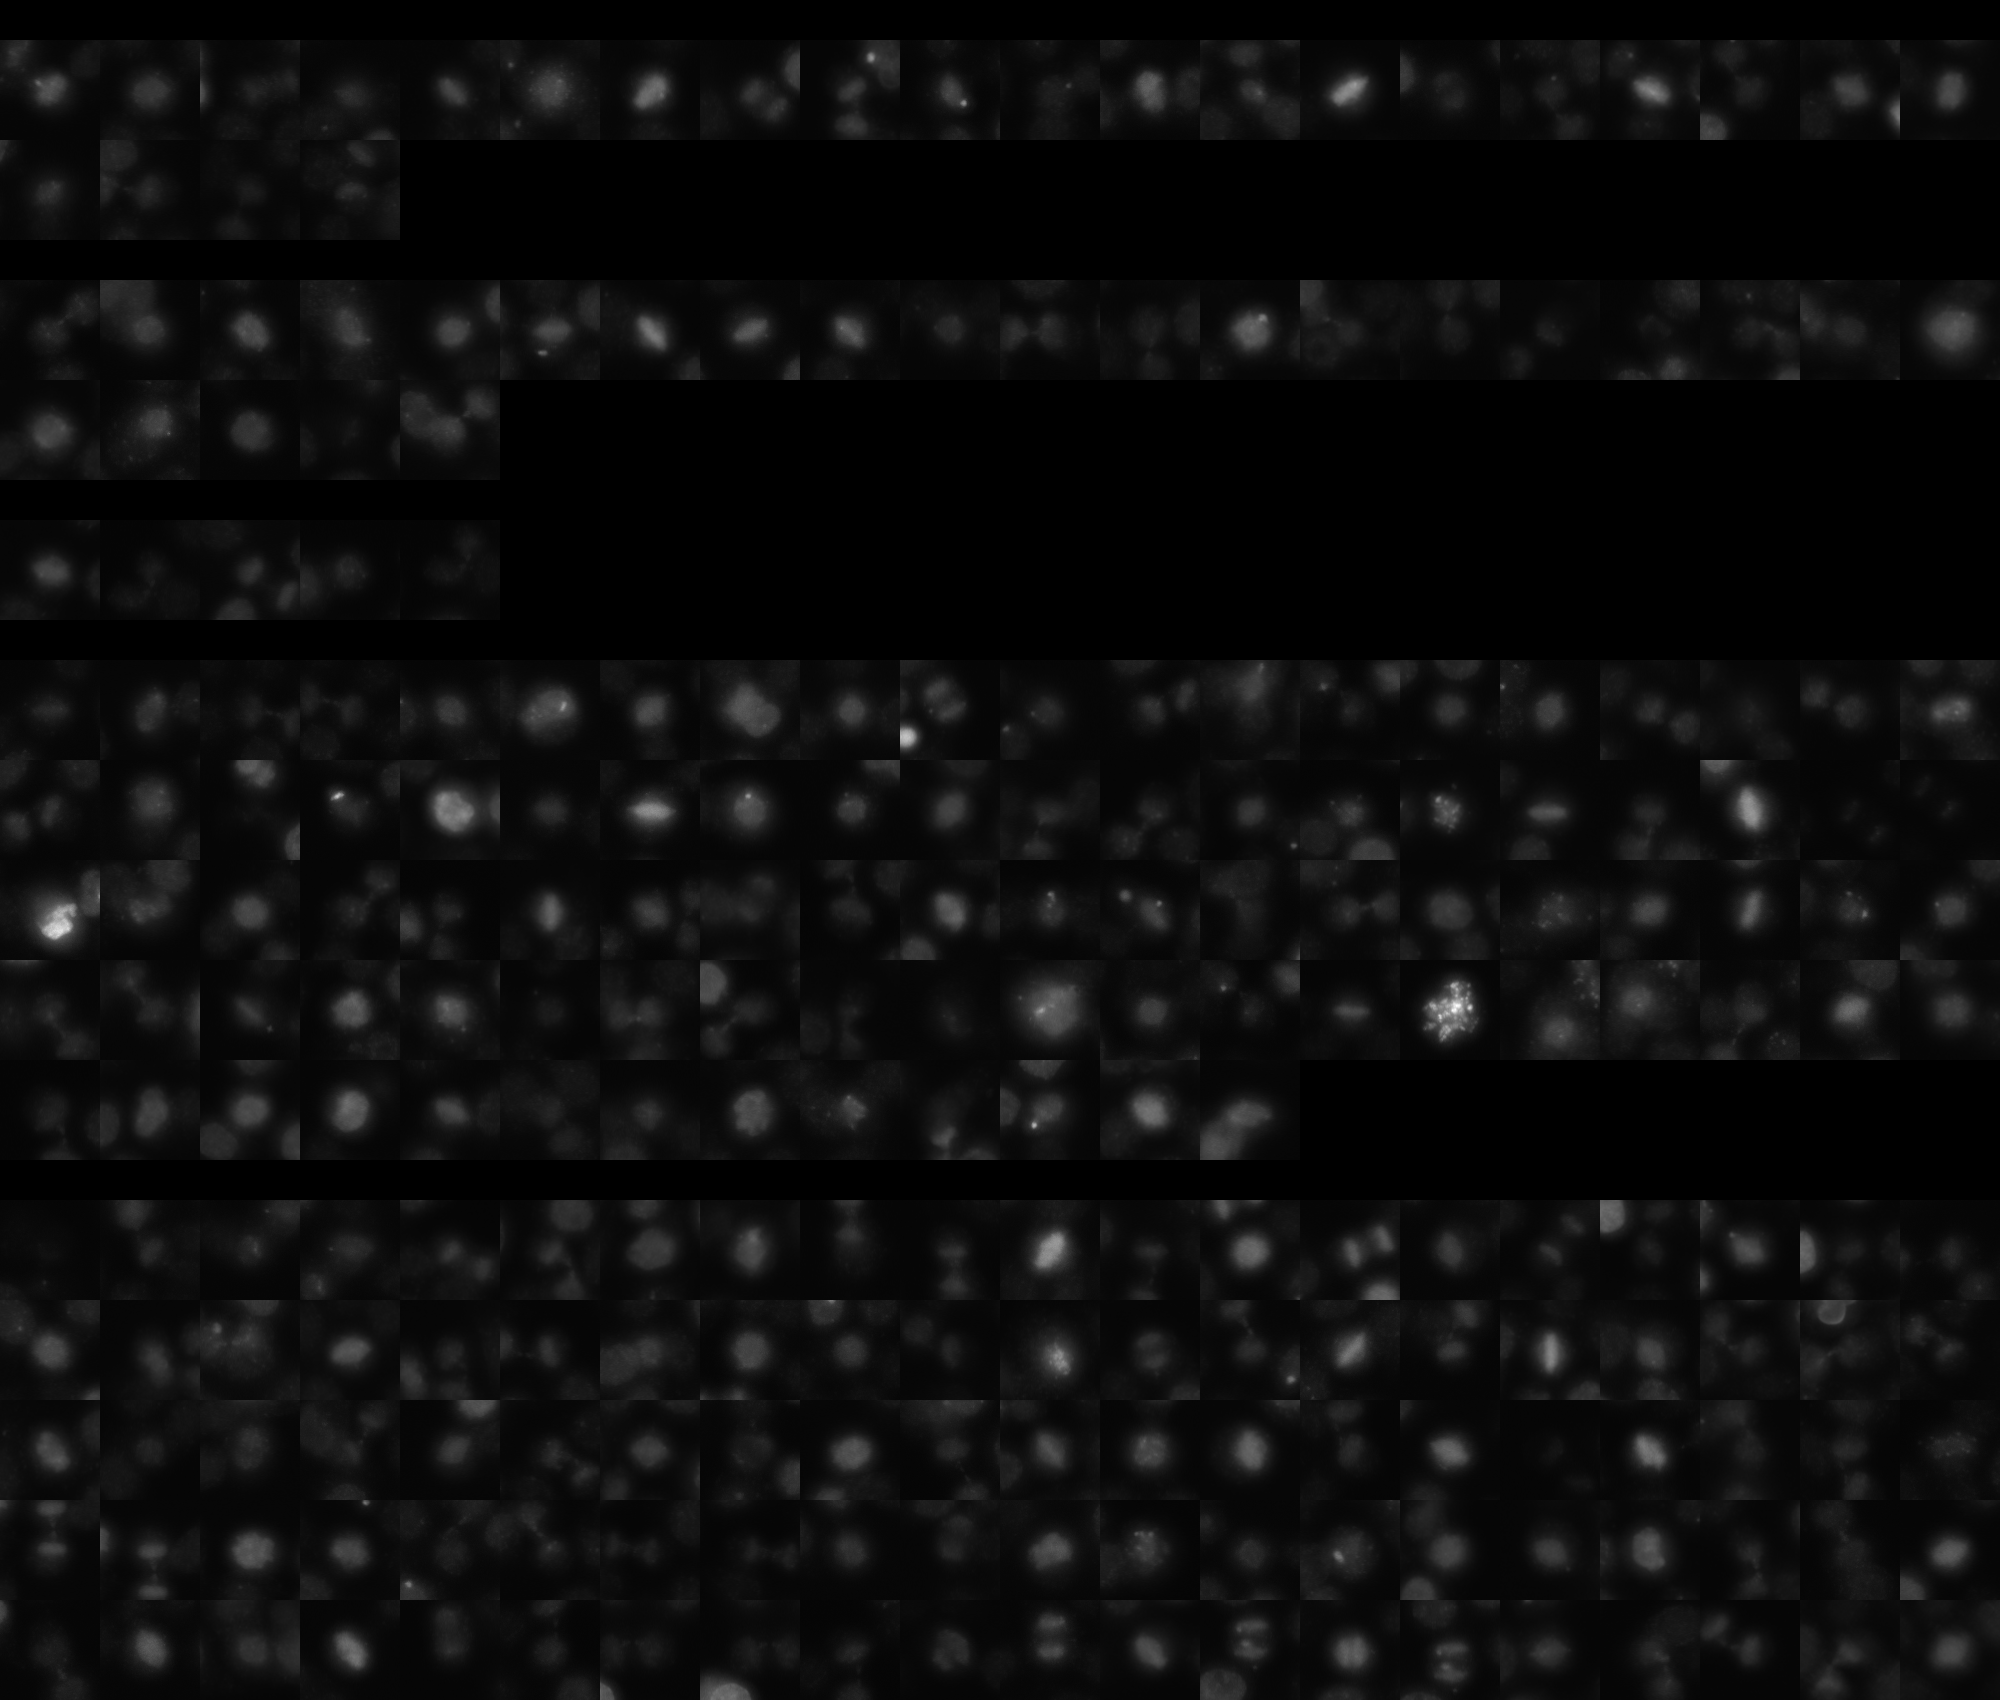
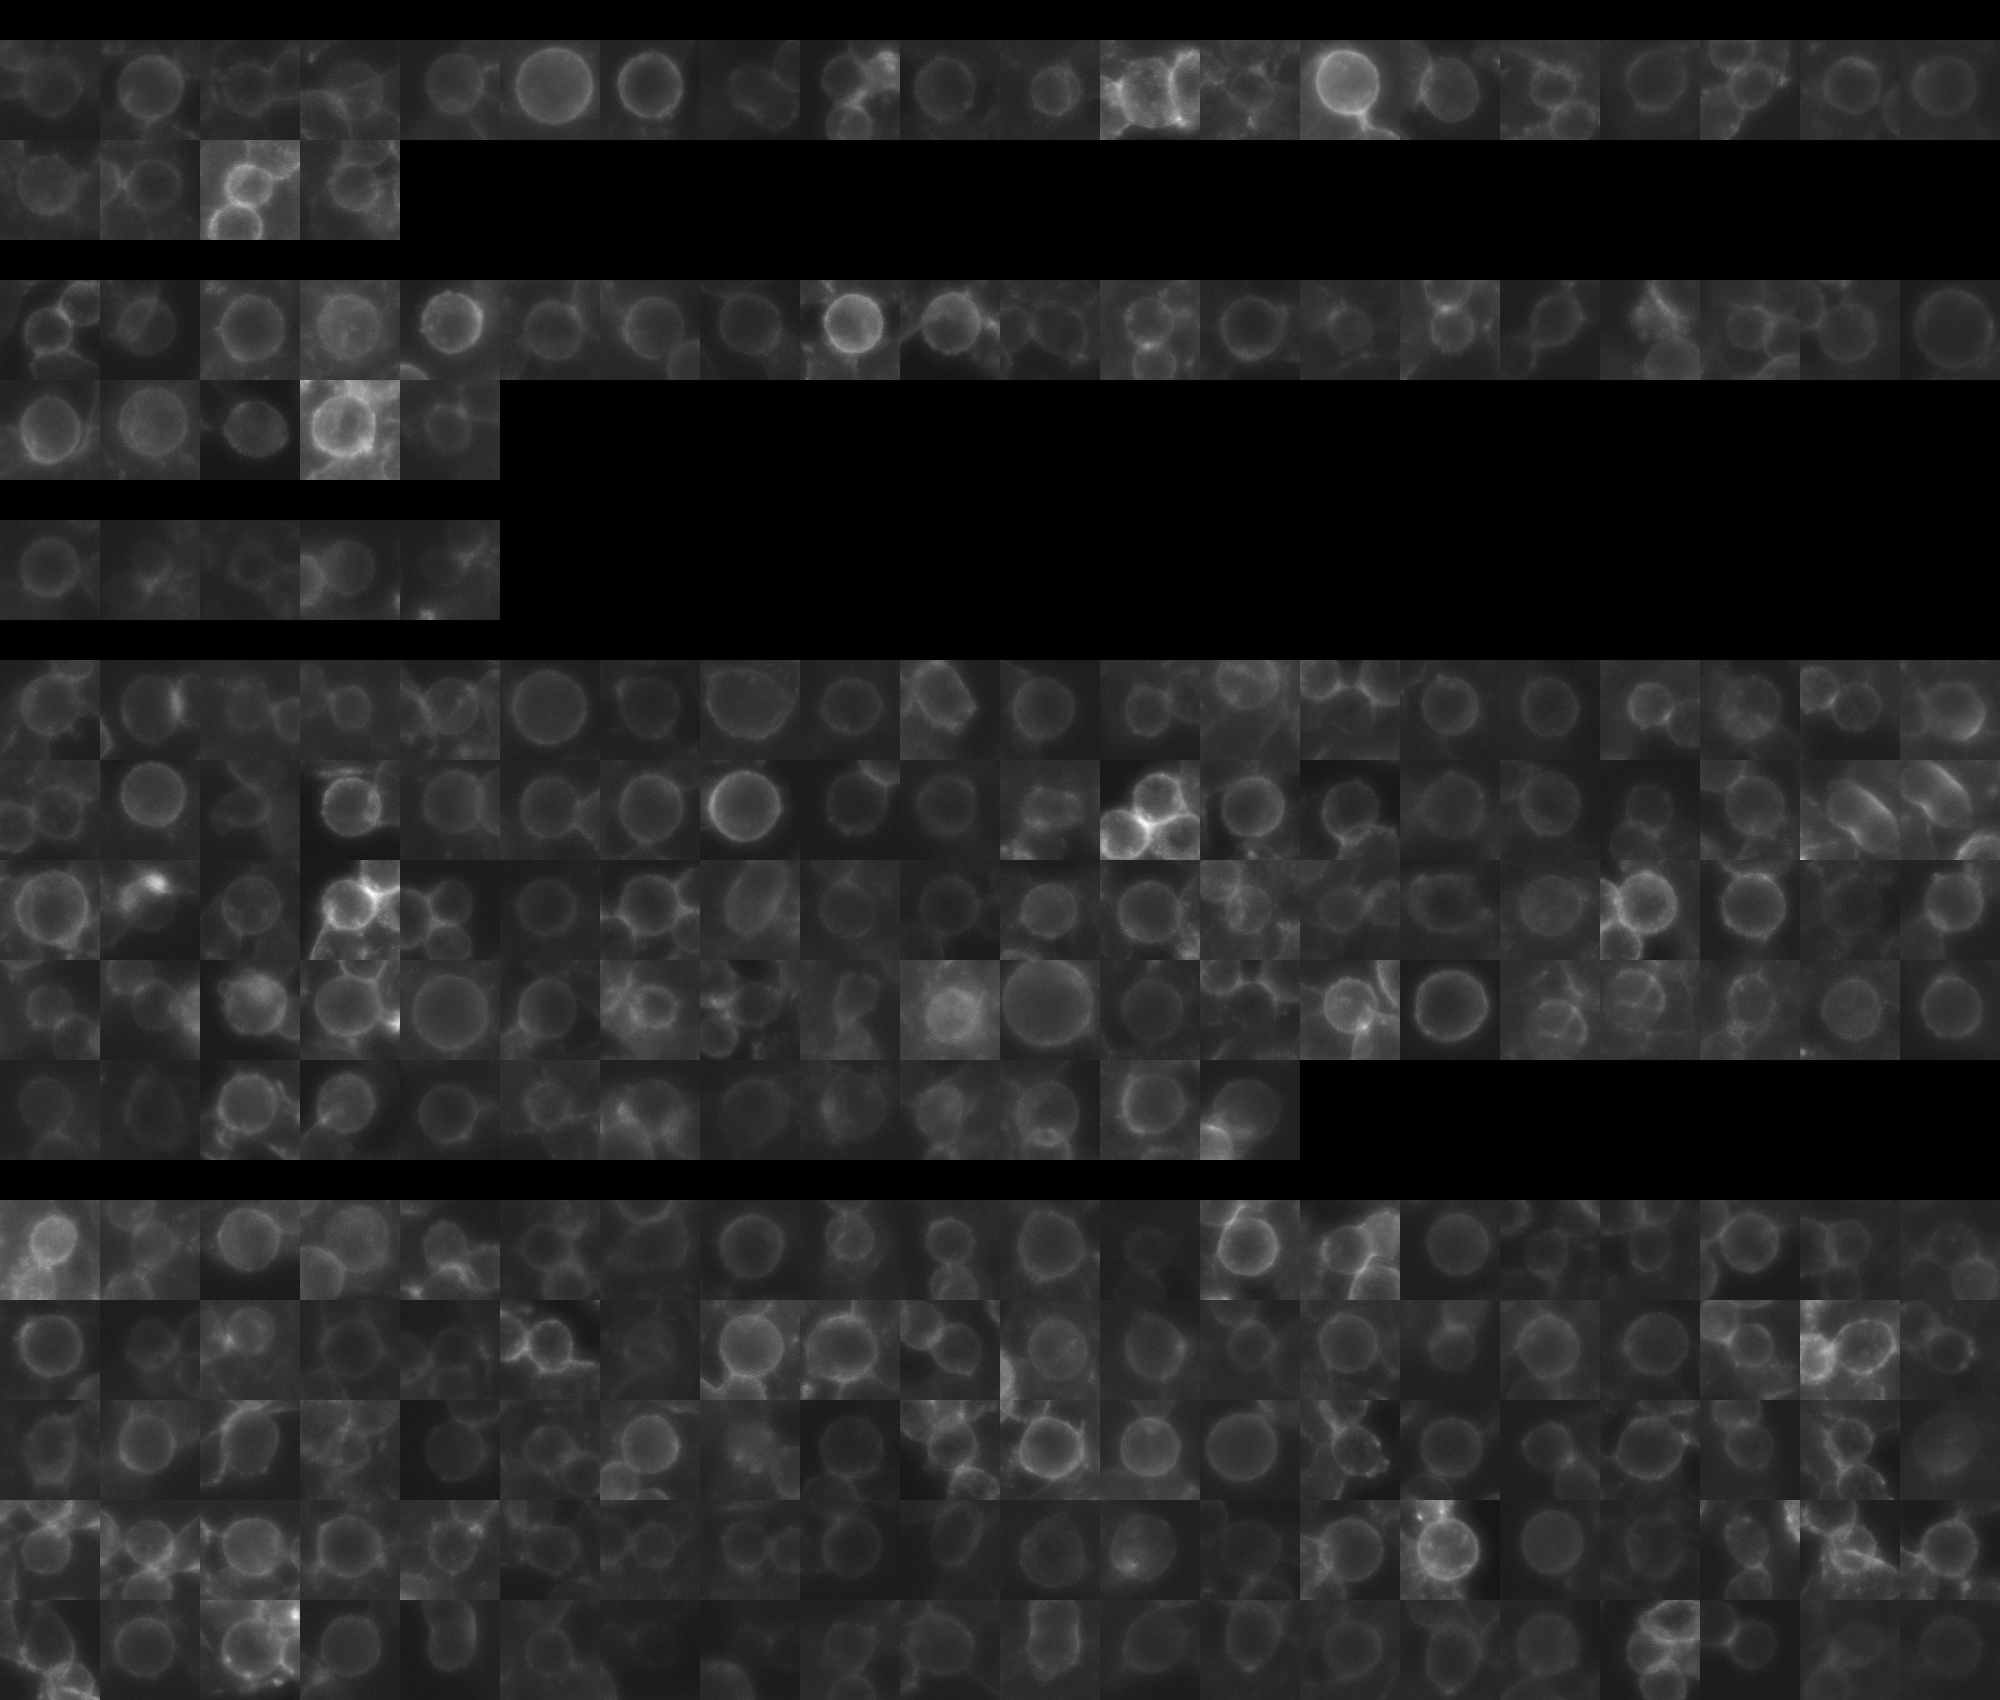
sgRNA 1: ATGCAGGTCGTGTACAACGT (interphase cells: 1175, mitotic cells: 24)
sgRNA 2: GCCATCCCCAGGGAATACAT (interphase cells: 1196, mitotic cells: 25)
sgRNA 3: GCTCAACGACTCCATTGCCG (interphase cells: 172, mitotic cells: 5)
sgRNA 4: TCCTCTCAAACTGCCAAGGG (interphase cells: 2598, mitotic cells: 93)

Interphase Cluster

Mitotic Cluster

Overview

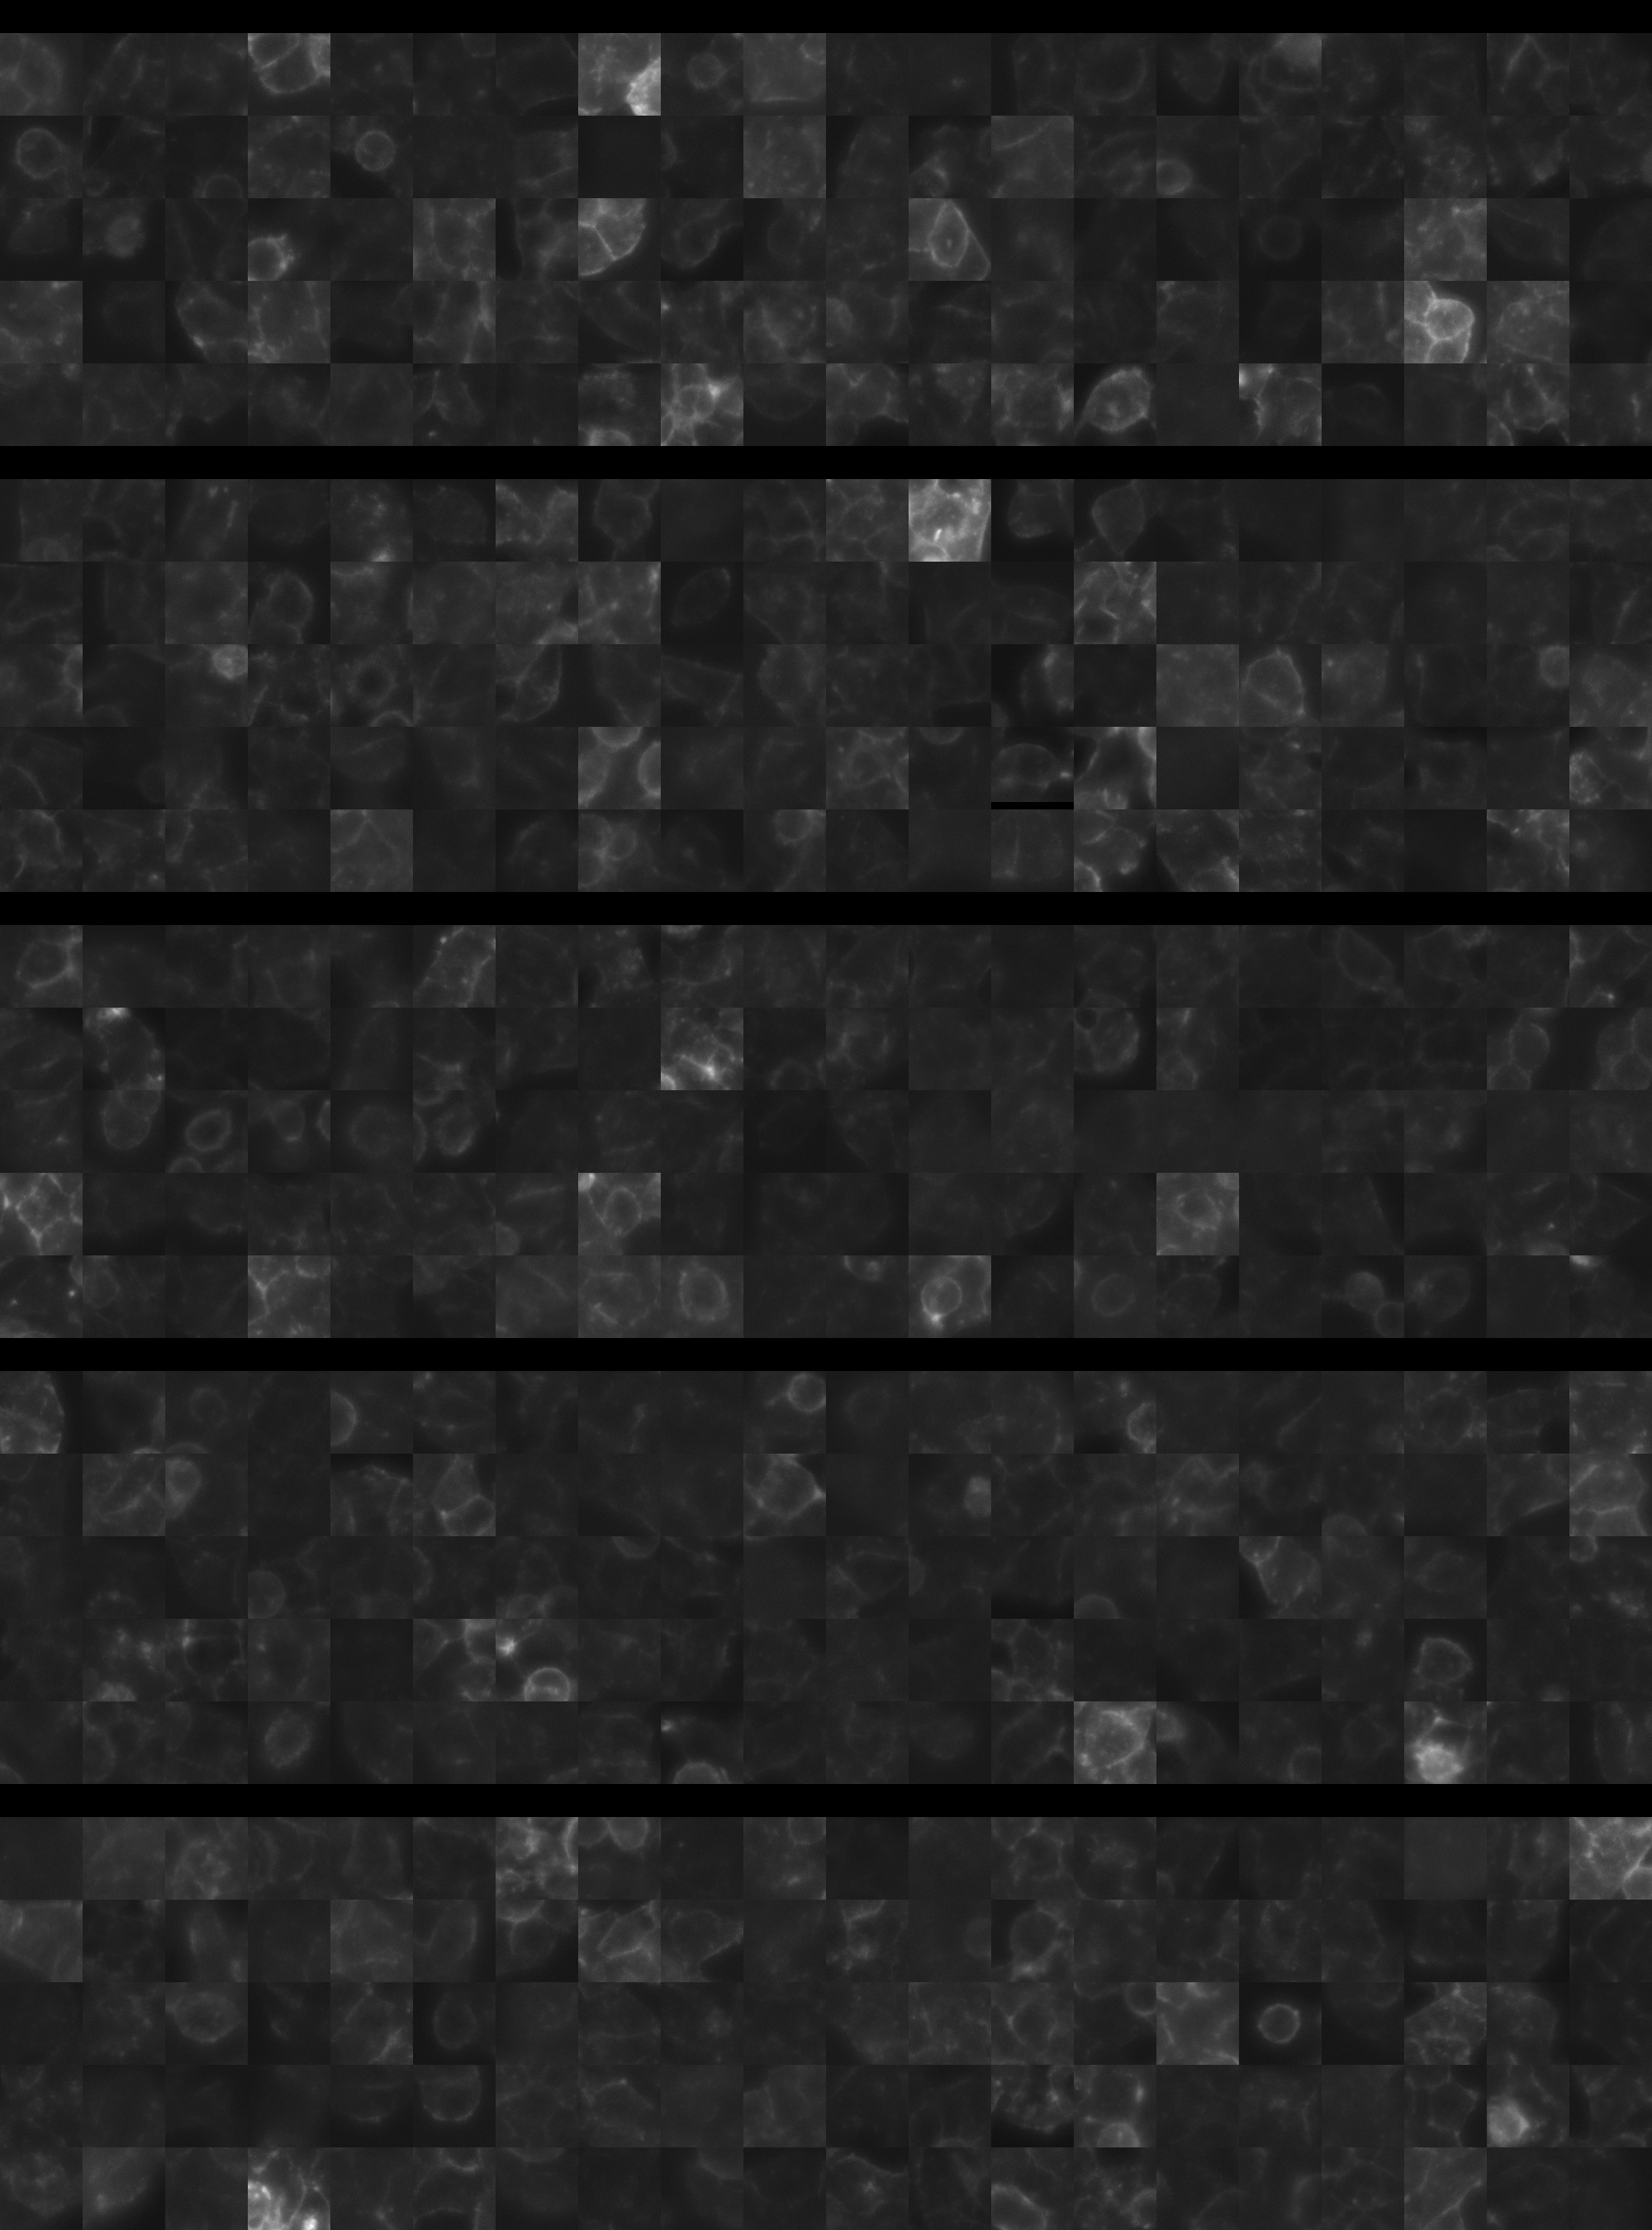
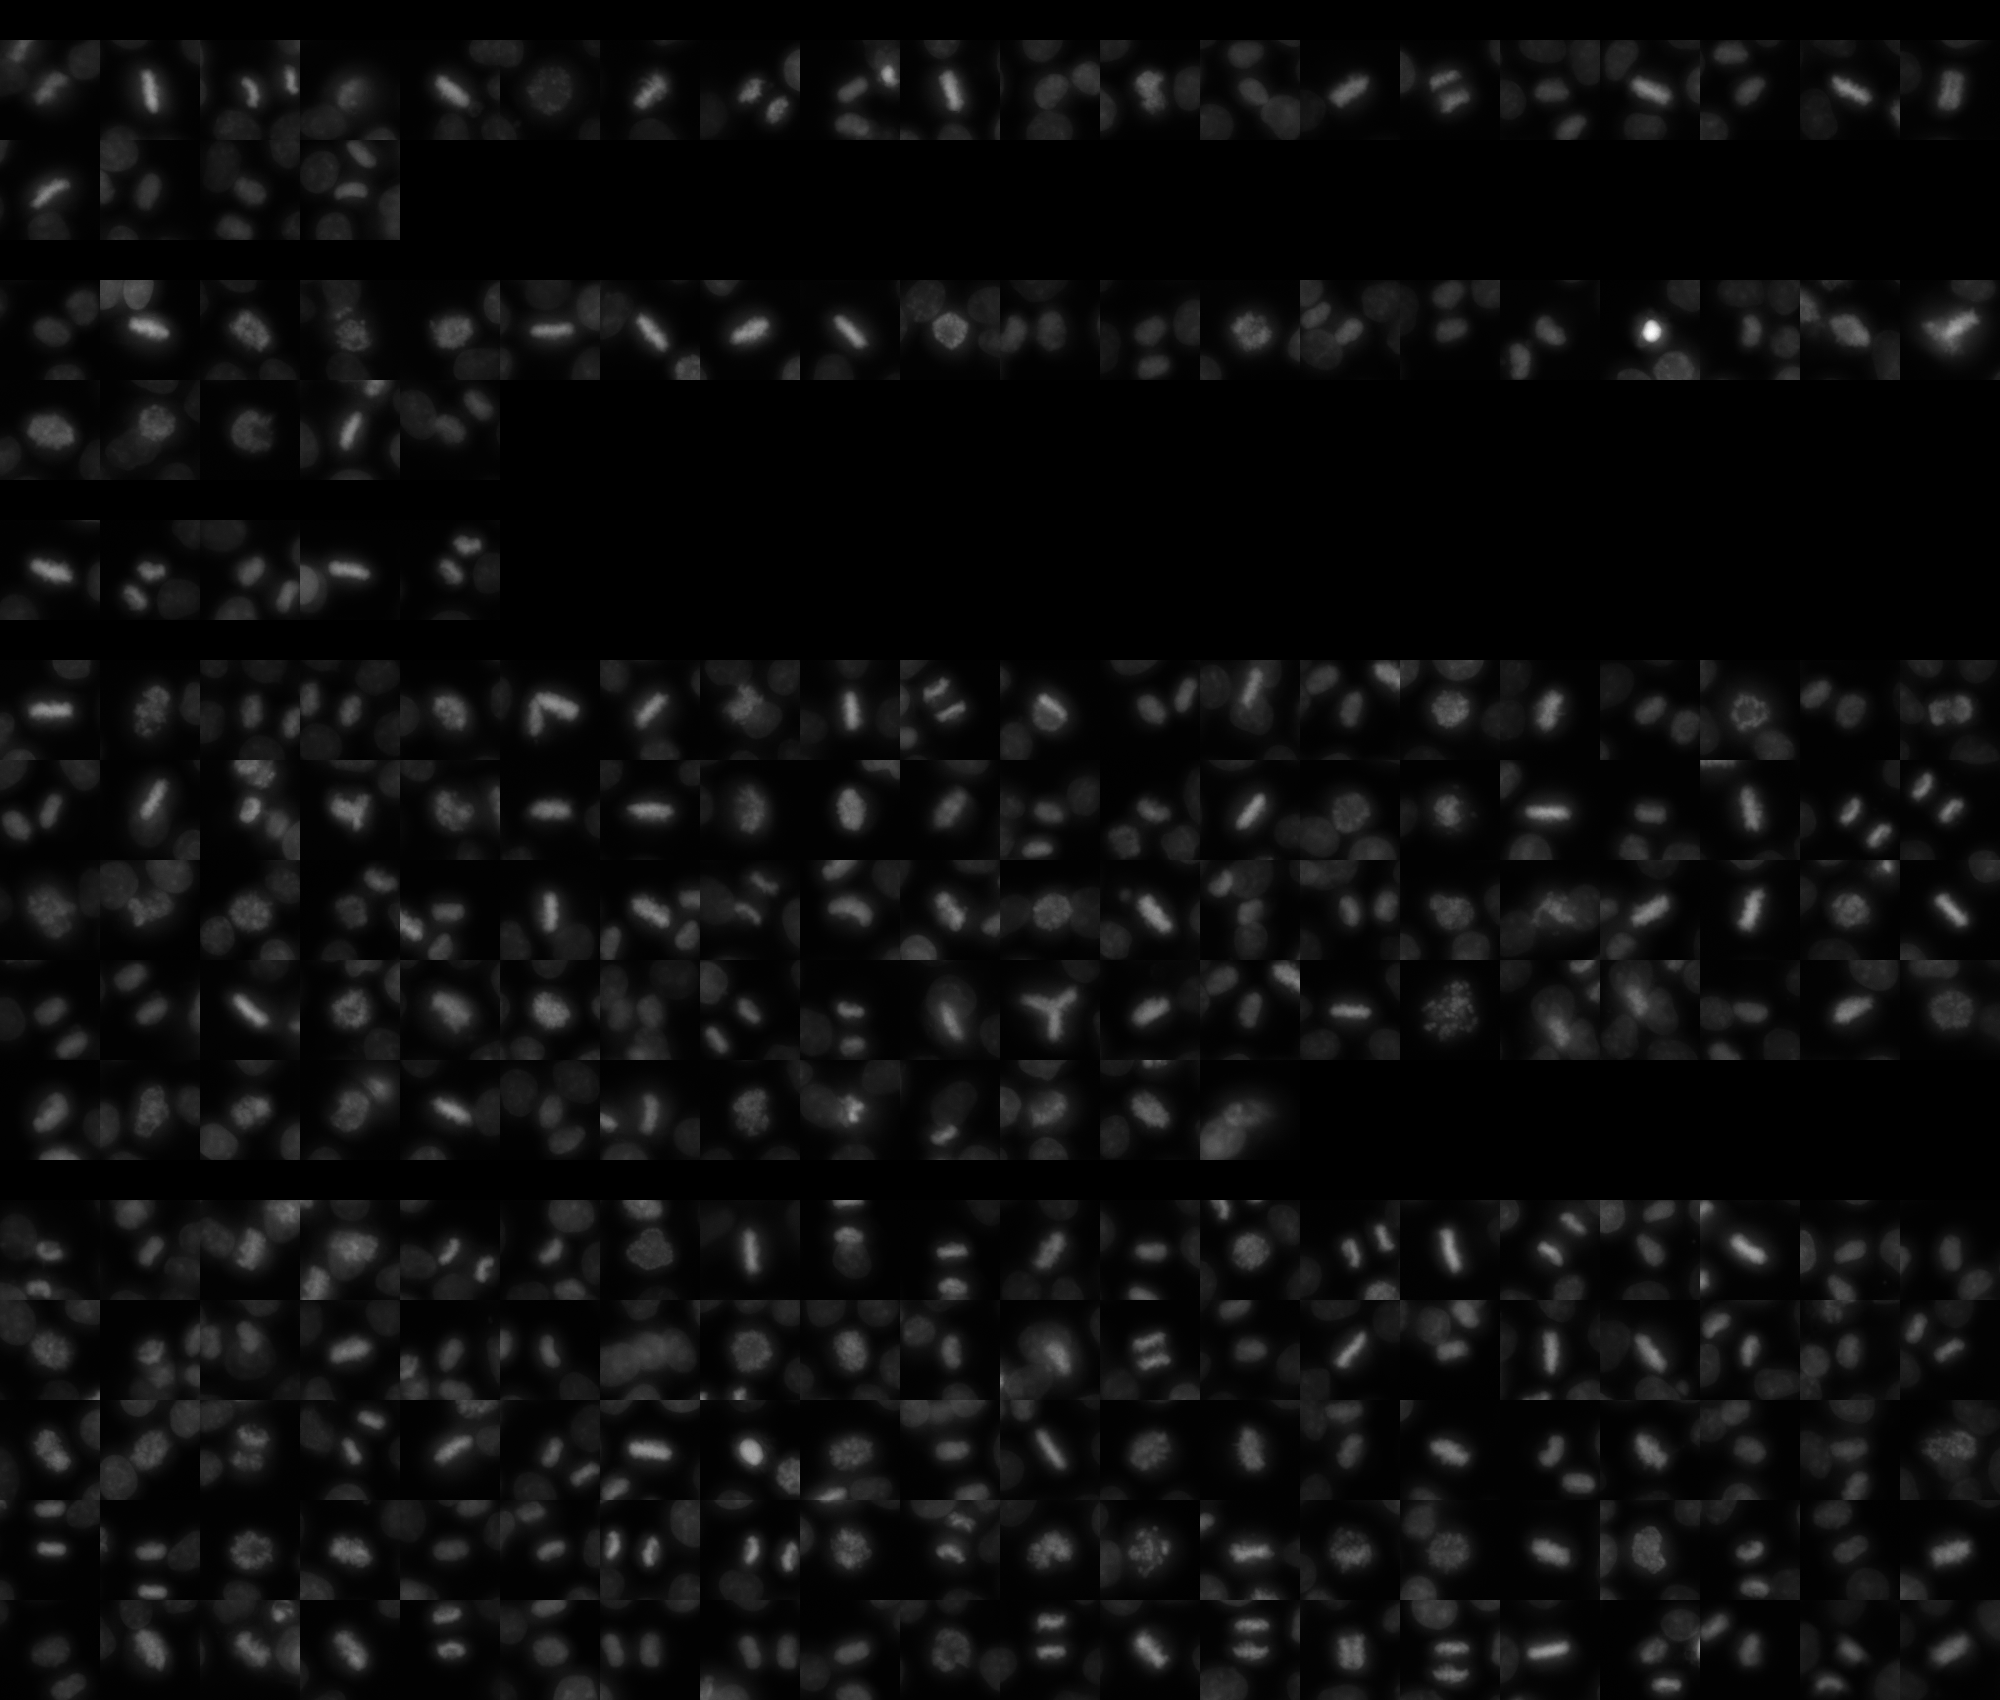
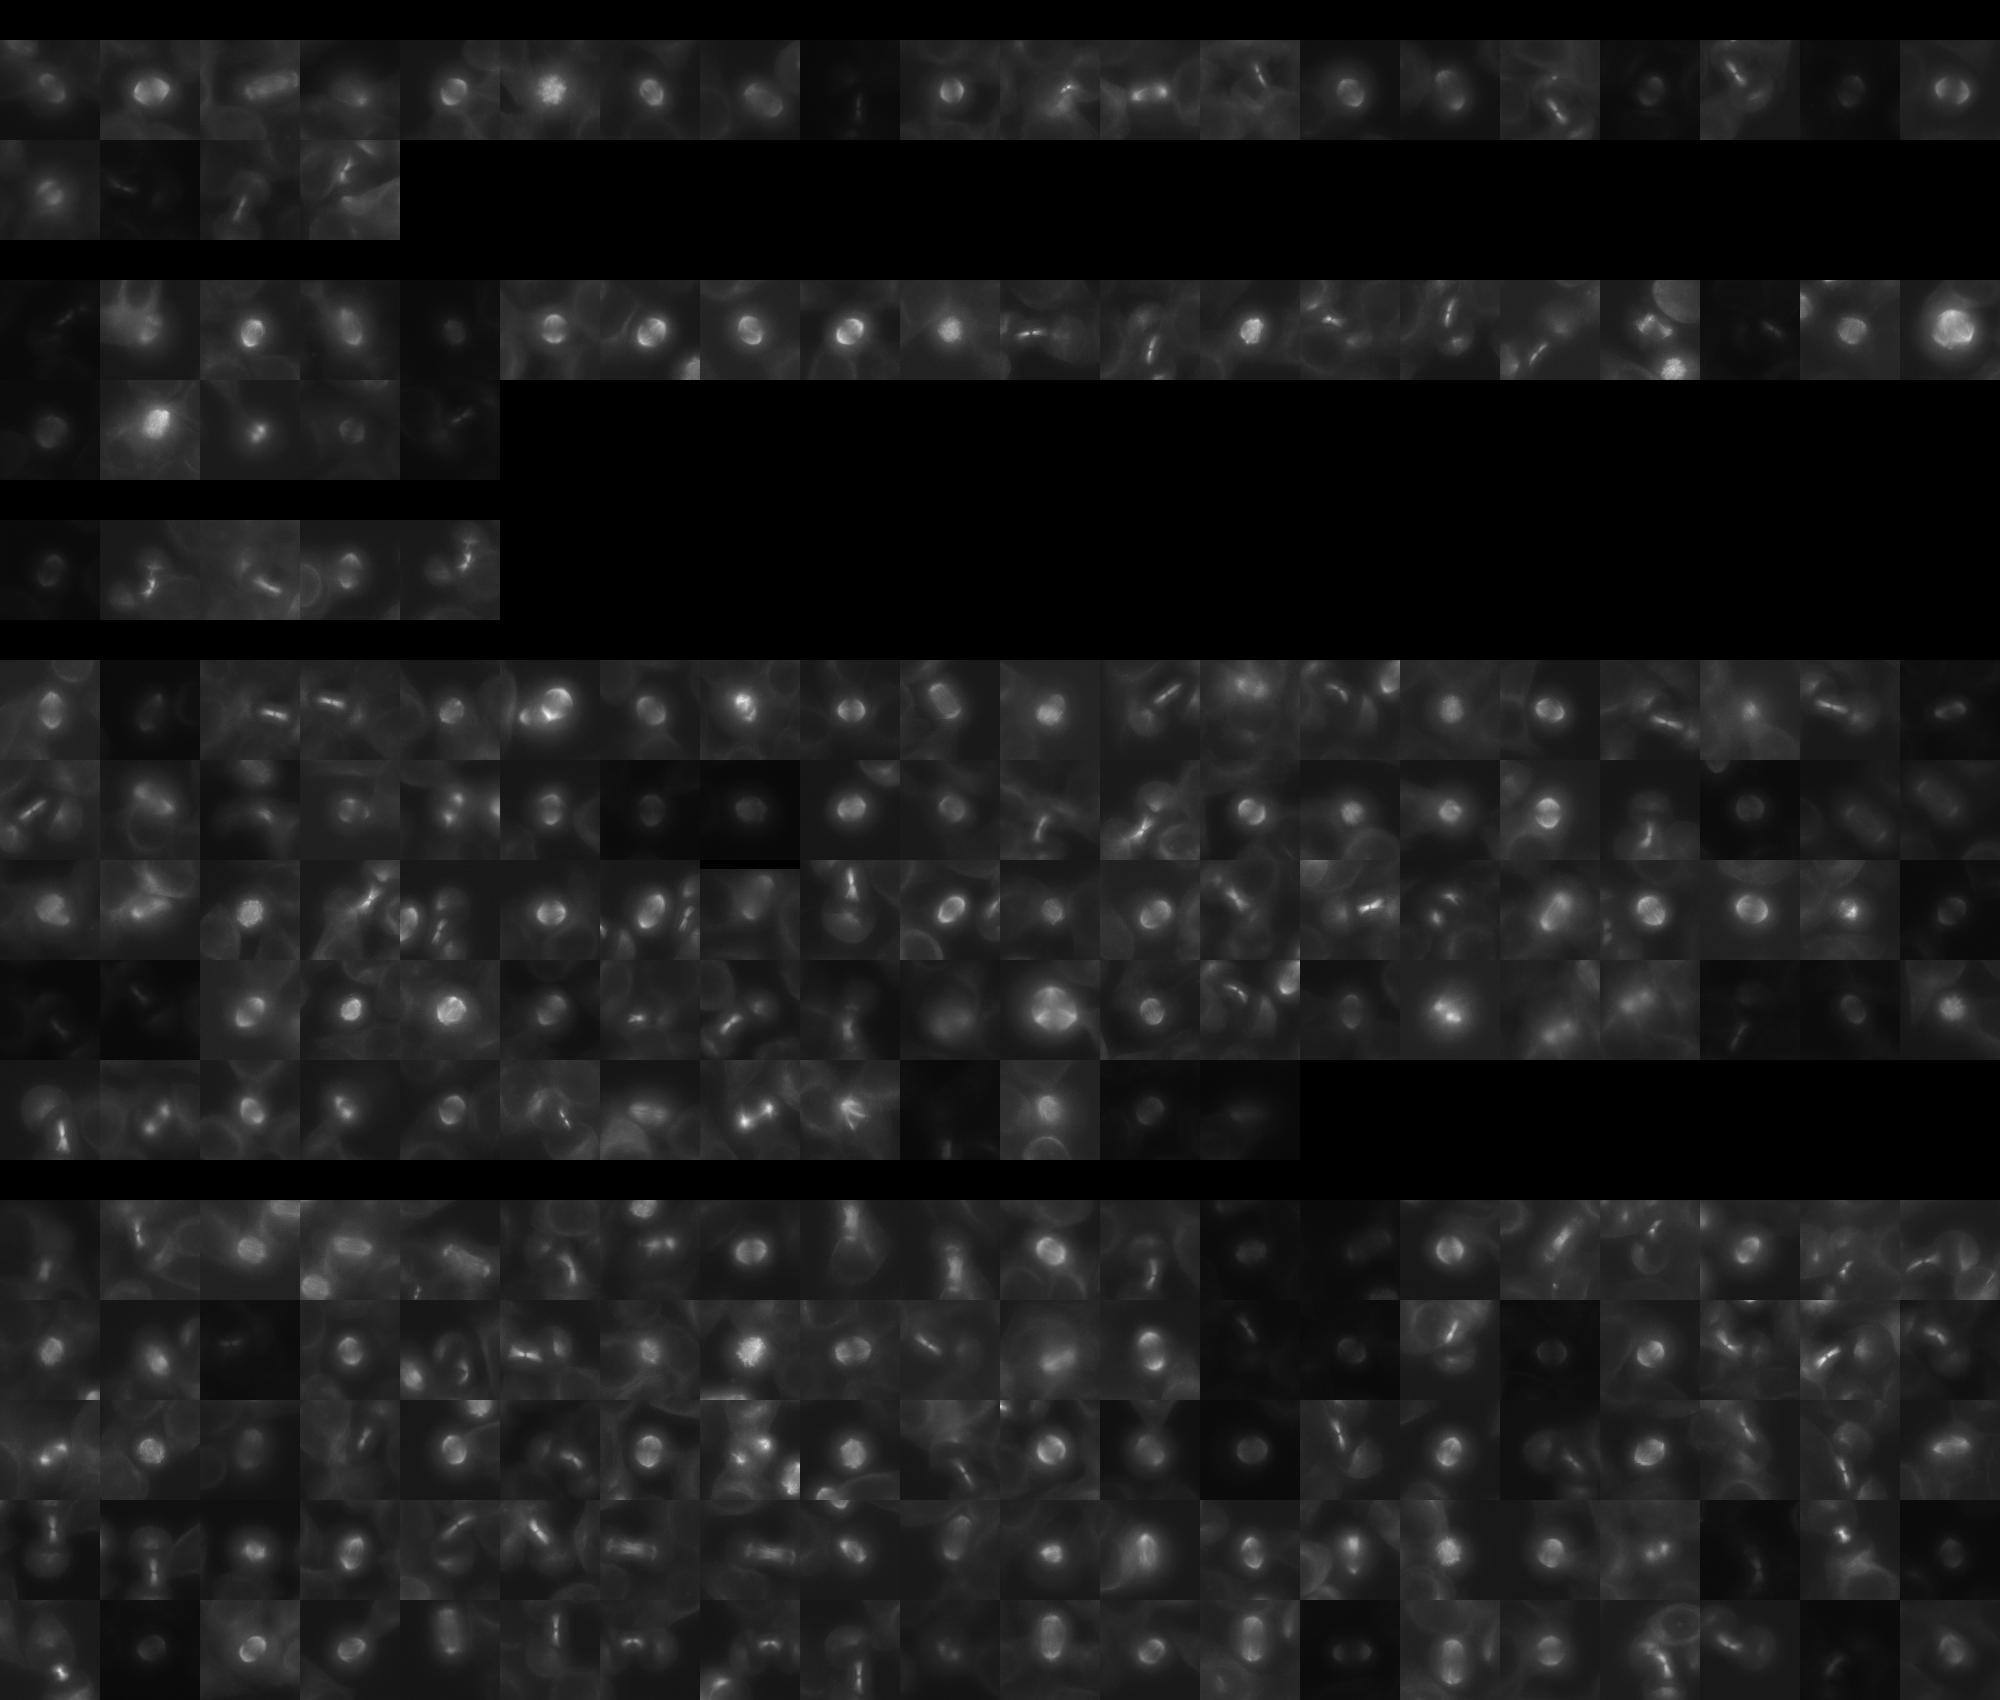
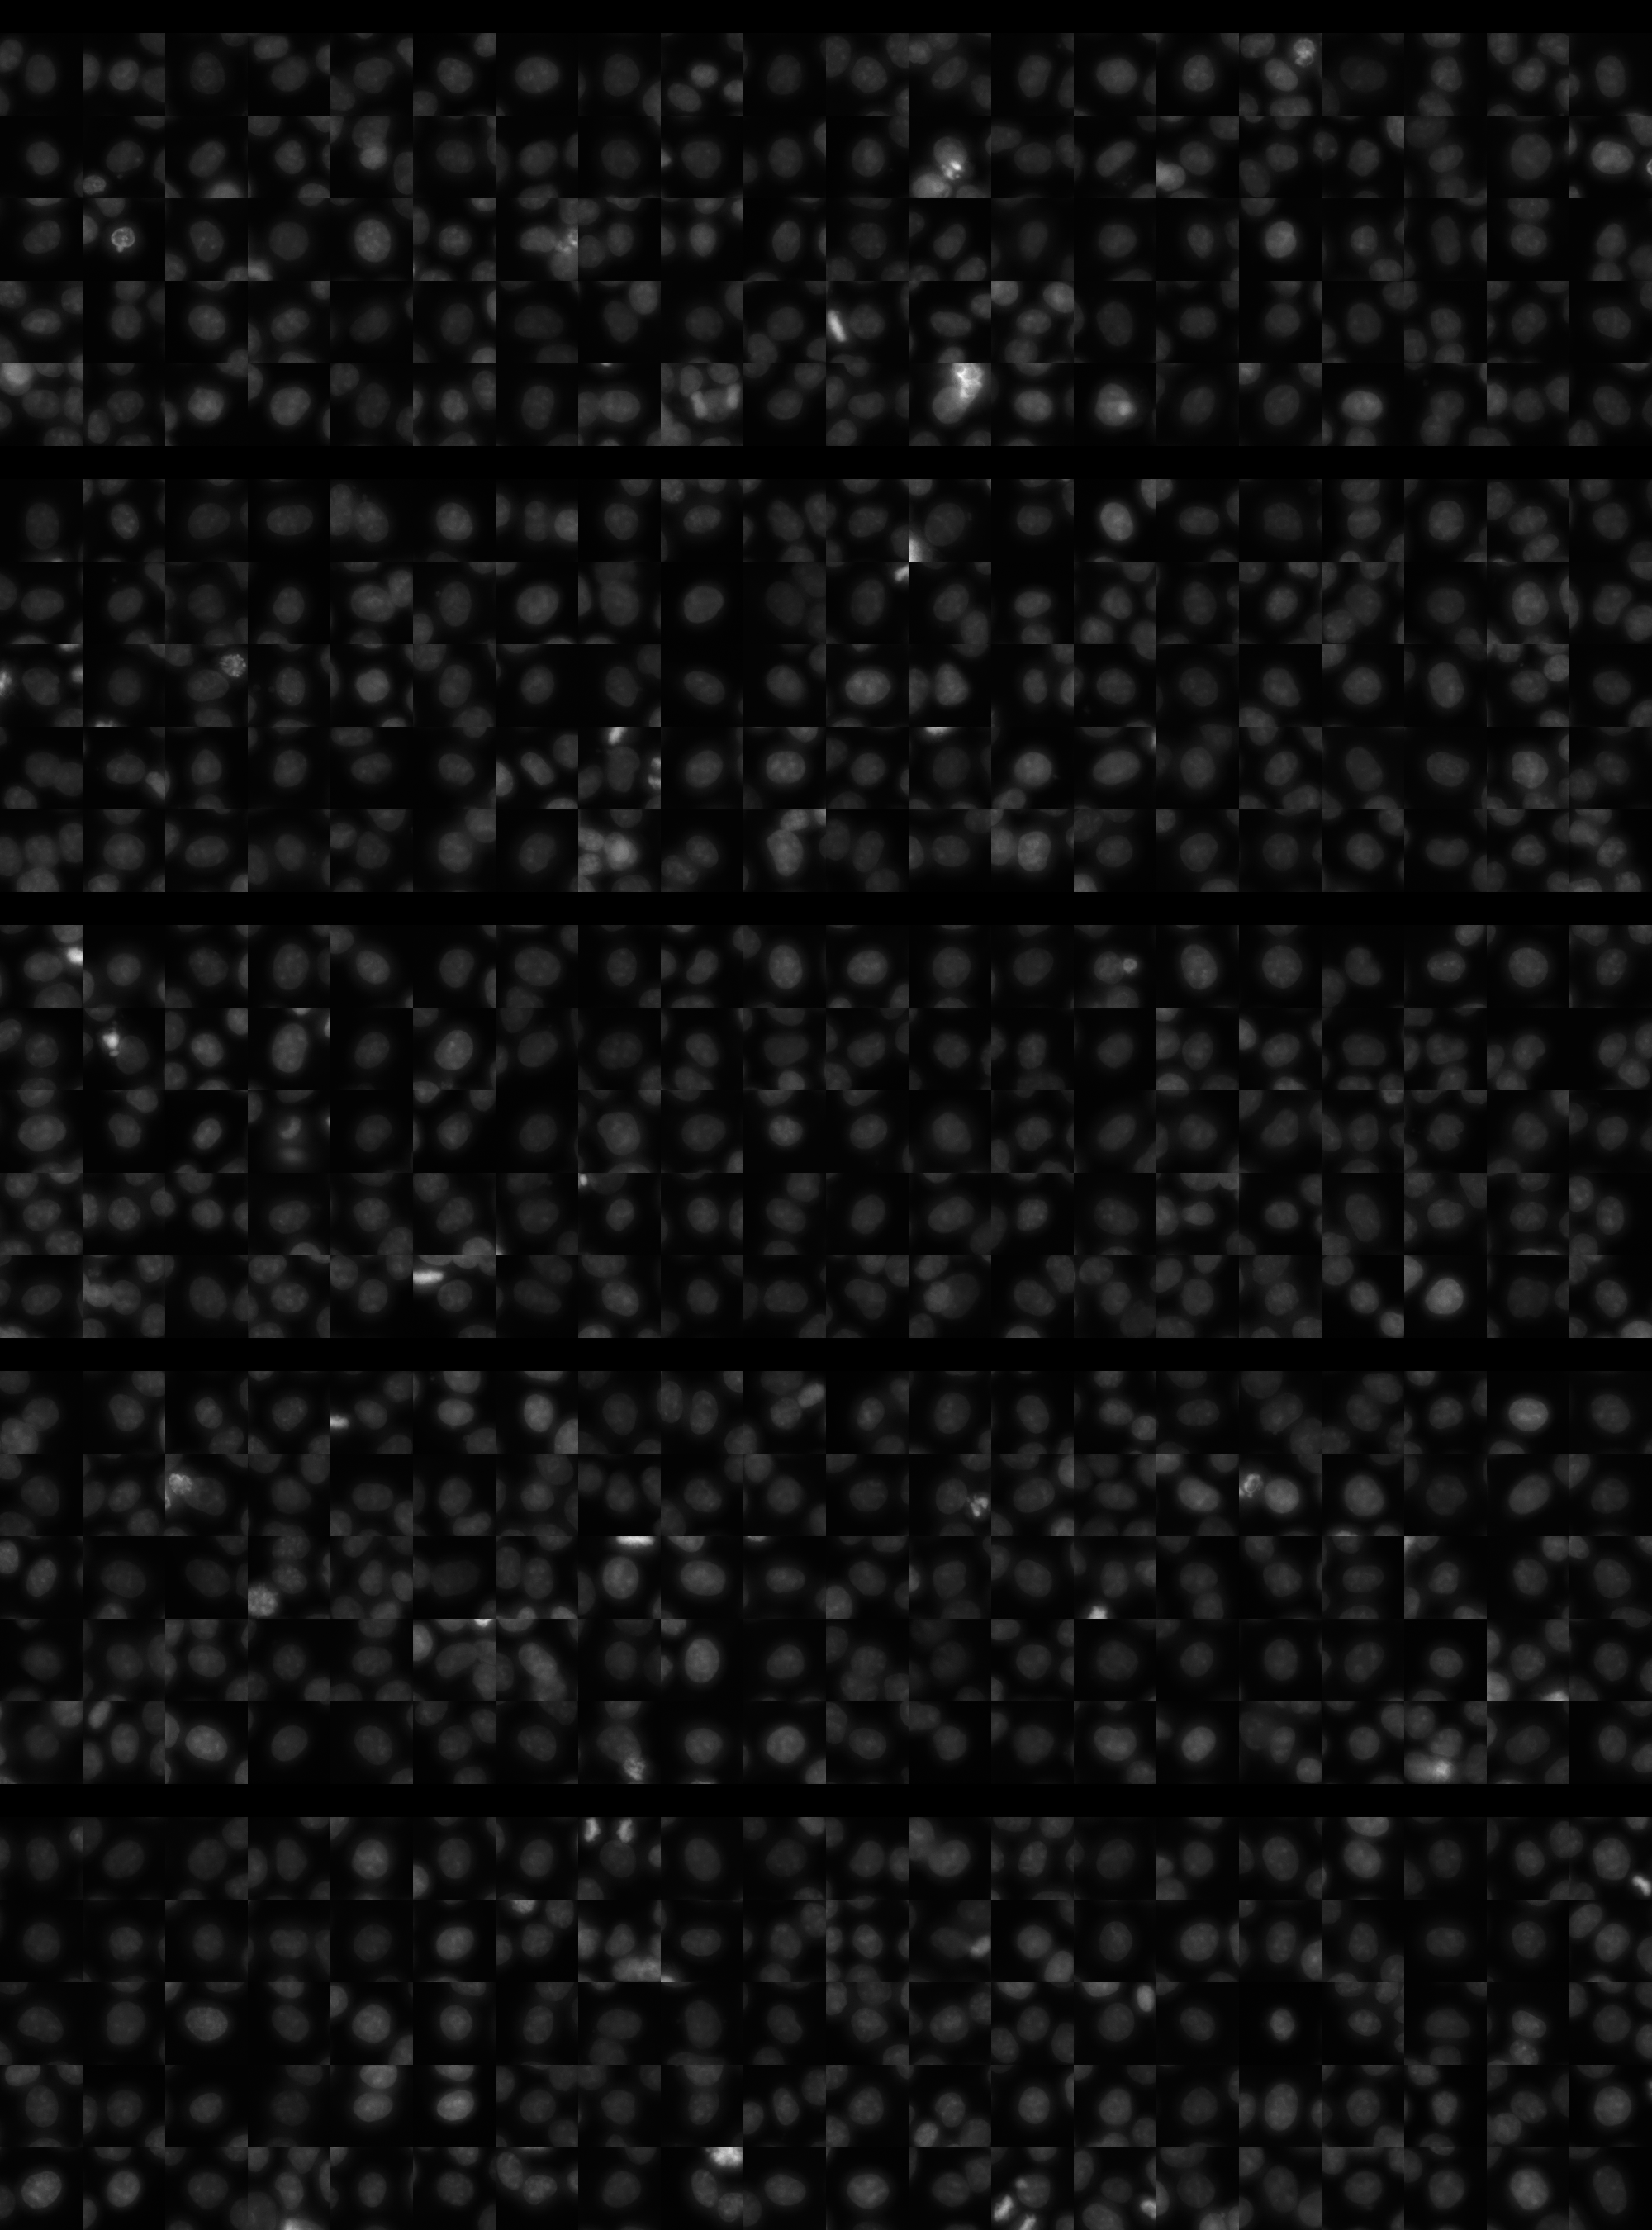
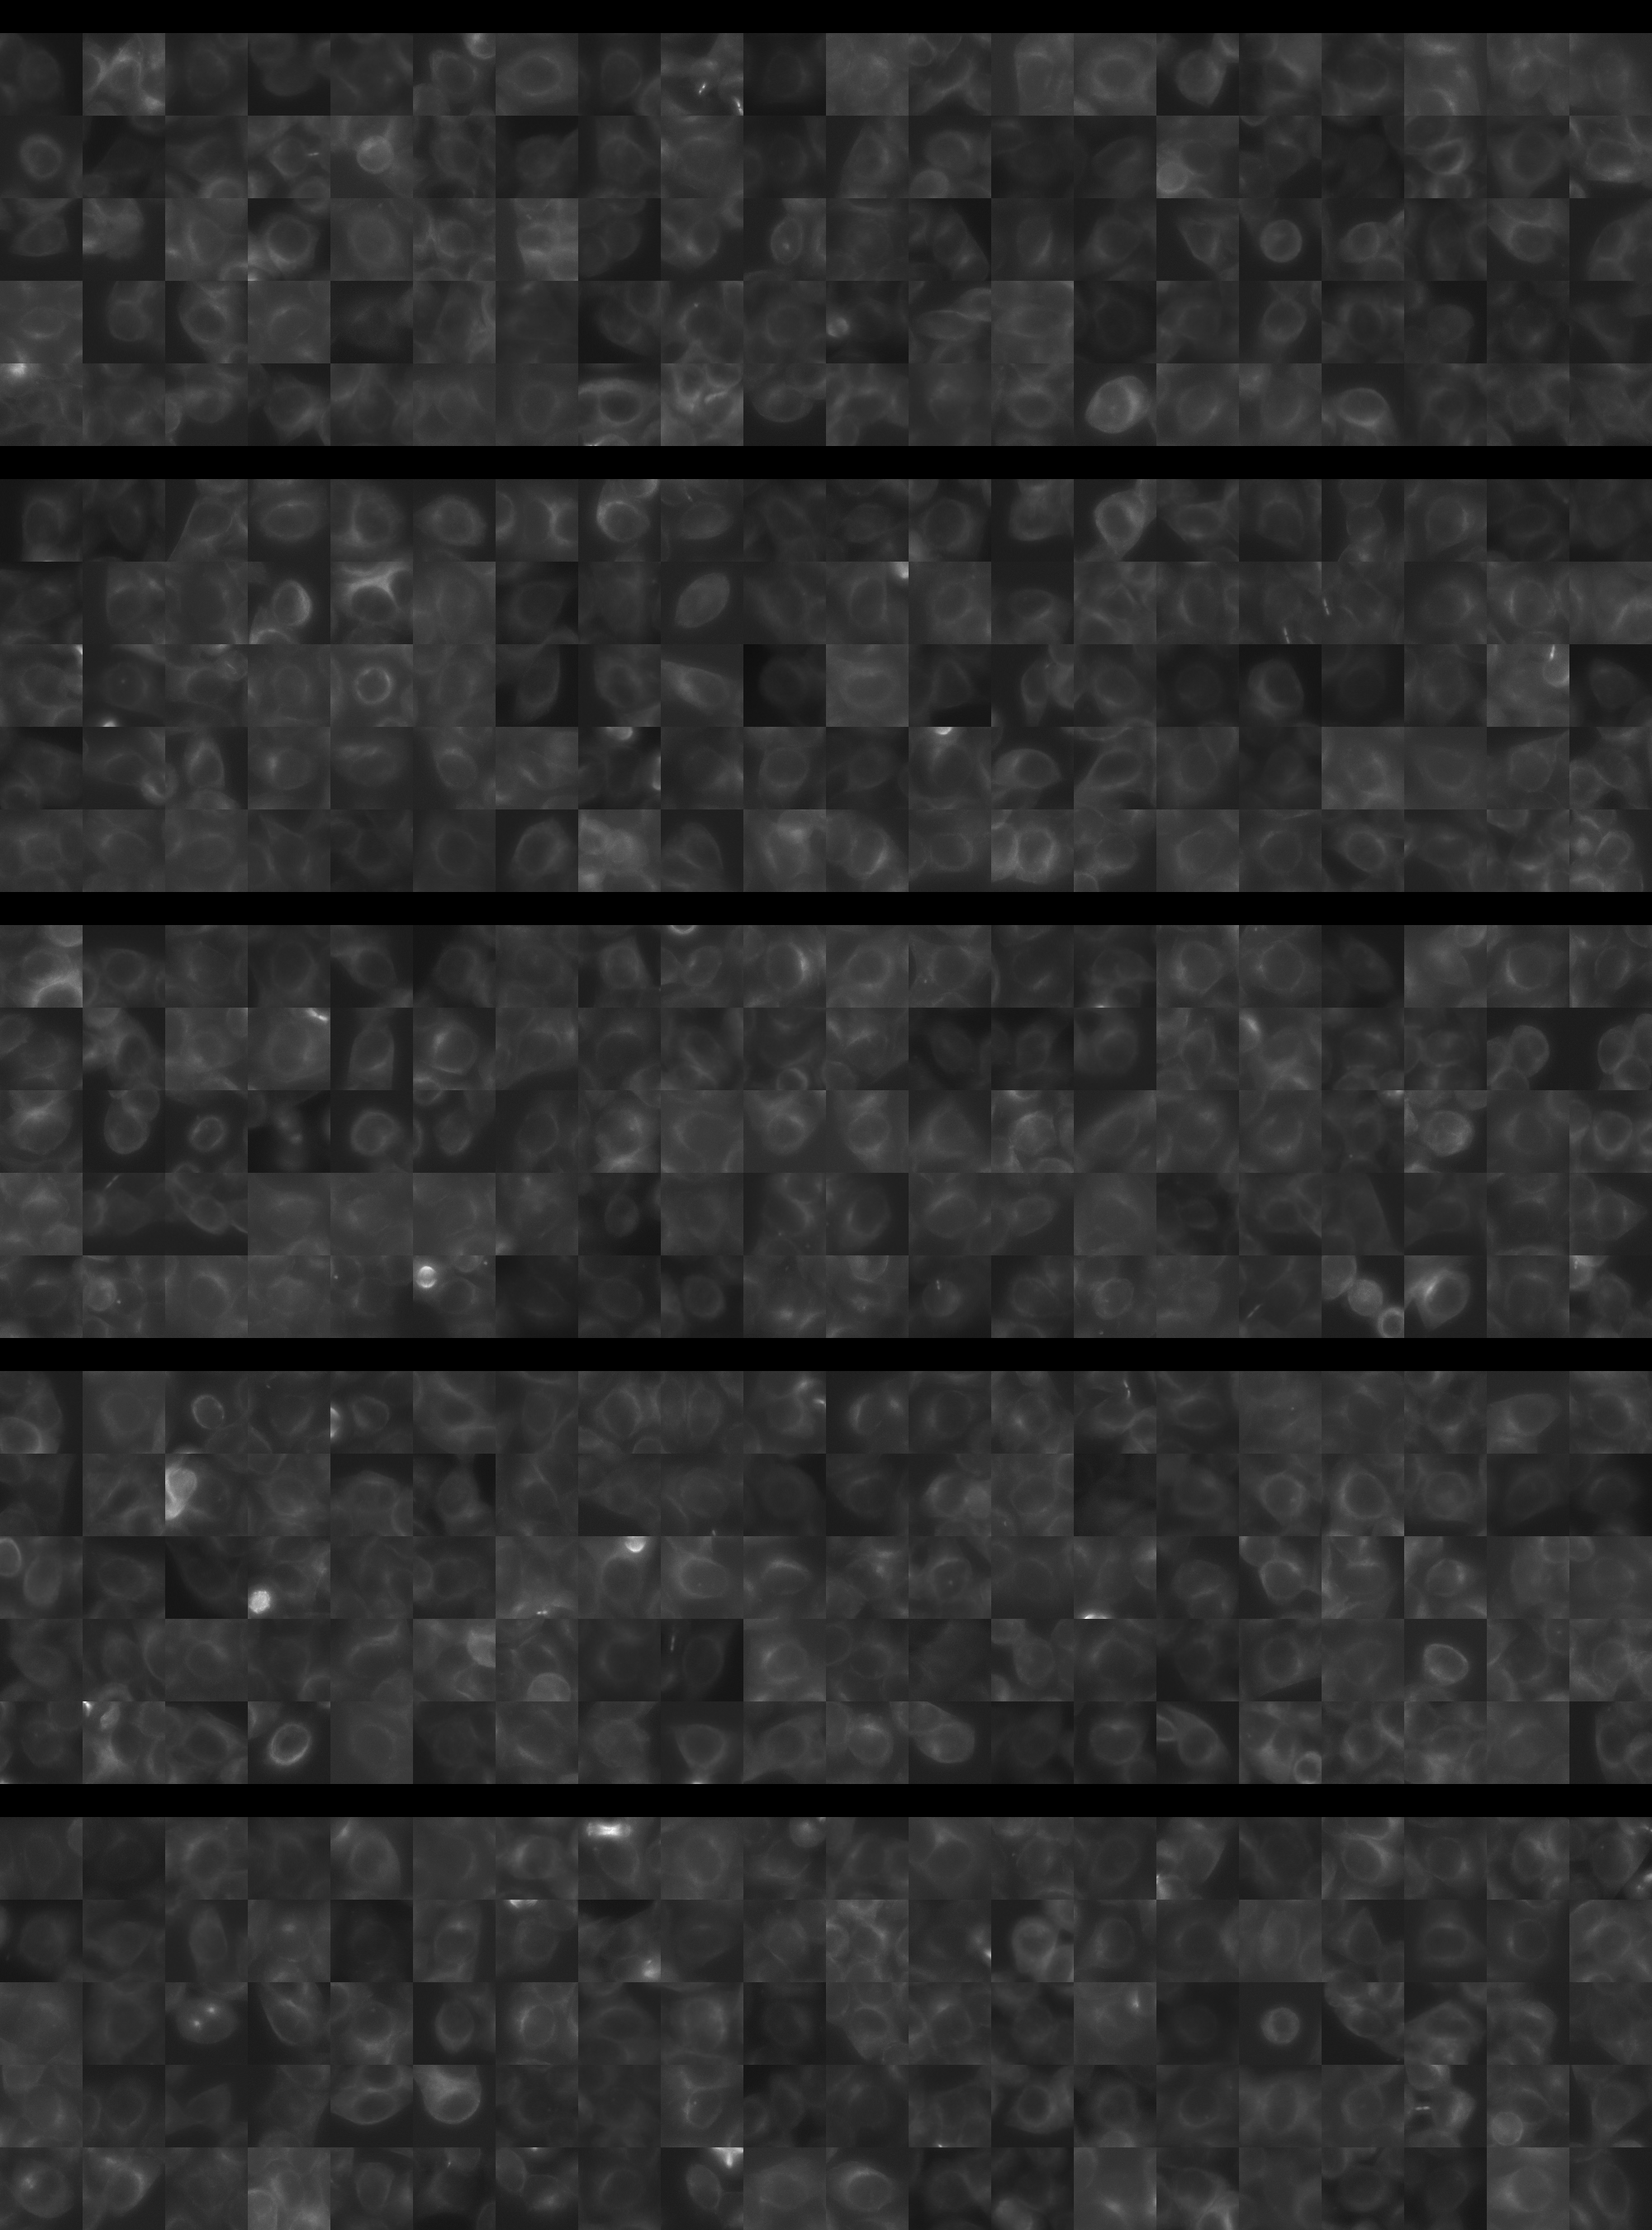
Each montage below shows randomly selected individual cell images for the same target gene separated by sgRNA, along with an example montage of cells expressing a non-targeting negative control sgRNA at the bottom. sgRNA labels in the montages correspond to the numbered sgRNA sequences in the gene info table above. The DNA (blue) and tubulin (green) channels are displayed by default, with gH2AX (grayscale) and actin (yellow) available using the check boxes. Channel brightness, contrast, and opacity are adjustable by clicking the arrow next to the channel name. When only one channel is selected, the display defaults to grayscale. Click the “Zoom” checkbox above the channel controls to enable image zooming (via scrolling) and panning (via click-and-drag).

The cell boxes displayed for this gene are square, 30.36 μm per side for the interphase montage and 30.36 μm per side for the mitotic montage.
Features

Interphase Score Rank FDR q-value
Nucleus DNA Integrated -8.792e-02 5208 of 5322 0.058
Nucleus DNA Mean -3.102e-03 2075 of 5322 0.992
Nucleus gH2AX Mean -1.457e-02 4805 of 5322 0.715
Nucleus DNA - gH2AX Correlation -1.517e-01 4782 of 5322 1.021e-04
Nucleus Shape Area -7.748e-02 4720 of 5322 0.092
Nucleus Shape Eccentricity 0.085 316 of 5322 0.047
Nucleus Shape Form Factor -5.124e-02 2741 of 5322 0.273
Nucleus Shape Solidity -9.257e-02 4144 of 5322 0.018
Cell DNA Mass Displacement 0.003 4187 of 5322 0.999
Cell Tubulin Mean 0.010 2387 of 5322 0.855
Cell Tubulin Mass Displacement 0.043 766 of 5322 0.457
Cell Actin Mean -1.250e-01 5051 of 5322 0.008
Cell Tubulin - Actin Correlation 0.068 970 of 5322 0.136
Cell DNA - Tubulin Correlation 0.022 2960 of 5322 0.687
Cell Shape Area -9.882e-02 4789 of 5322 0.030
Cell Shape Eccentricity -1.314e-02 4500 of 5322 0.933
Mitotic Score Rank FDR q-value
Nucleus DNA Integrated 0.179 1477 of 5322 0.927
Nucleus DNA Mean 0.066 1935 of 5322 1.000
Nucleus DNA Mass Displacement 0.042 2828 of 5322 0.999
Nucleus DNA Mean Frac 3 0.199 619 of 5322 1.000
Nucleus gH2AX Mean -4.787e-02 3618 of 5322 1.000
Nucleus gH2AX Mean Frac 0 -3.011e-01 5177 of 5322 1.000
Nucleus Tubulin Mean Frac 0 -8.763e-02 4582 of 5322 0.999
Nucleus Tubulin Mean Edge 0.205 774 of 5322 0.996
Nucleus Tubulin Std Edge 0.017 2318 of 5322 0.999
Nucleus Shape Area 0.075 2992 of 5322 0.990
Nucleus Shape Eccentricity 0.028 1663 of 5322 1.000
Nucleus Shape Form Factor 0.064 658 of 5322 0.998
Cell Tubulin Mean 0.035 3021 of 5322 0.998
Cell Tubulin Mean Frac 3 0.038 1269 of 5322 0.999
Cell Actin Mean -9.064e-02 4310 of 5322 0.997
Cell Shape Area 0.067 3054 of 5322 0.998
( Reset Zoom )
Brightness
Contrast
Opacity
Brightness
Contrast
Opacity
Brightness
Contrast
Opacity
Brightness
Contrast
Opacity
Brightness
Contrast
Opacity

( Reset Zoom )
Brightness
Contrast
Opacity
Brightness
Contrast
Opacity
Brightness
Contrast
Opacity
Brightness
Contrast
Opacity
Brightness
Contrast
Opacity

MIT Central Accessability