PLK4

Gene symbol: PLK4
Gene: 10733
Uniprot Function: Serine/threonine-protein kinase that plays a central role in centriole duplication. Able to trigger procentriole formation on the surface of the parental centriole cylinder, leading to the recruitment of centriole biogenesis proteins such as SASS6, CENPJ/CPAP, CCP110, CEP135 and gamma-tubulin. When overexpressed, it is able to induce centrosome amplification through the simultaneous generation of multiple procentrioles adjoining each parental centriole during S phase. Phosphorylates 'Ser-151' of FBXW5 during the G1/S transition, leading to inhibit FBXW5 ability to ubiquitinate SASS6. Its central role in centriole replication suggests a possible role in tumorigenesis, centrosome aberrations being frequently observed in tumors. Also involved in deuterosome-mediated centriole amplification in multiciliated that can generate more than 100 centrioles. Also involved in trophoblast differentiation by phosphorylating HAND1, leading to disrupt the interaction between HAND1 and MDFIC and activate HAND1. Phosphorylates CDC25C and CHEK2. Required for the recruitment of STIL to the centriole and for STIL-mediated centriole amplification (PubMed:22020124). Phosphorylates CEP131 at 'Ser-78' and PCM1 at 'Ser-372' which is essential for proper organization and integrity of centriolar satellites (PubMed:30804208).
Mitotic Index 0.0465
Interphase Cluster: #115 (22 genes)
Mitotic Cluster: #109 (23 genes)
sgRNA 1: ACTGTGTCAGTGTCGAAGGG (interphase cells: 2048, mitotic cells: 82)
sgRNA 2: CAGAGGAATAAGCTCTACGA (interphase cells: 403, mitotic cells: 26)
sgRNA 3: CGATTCTGATAACCCCATGG (interphase cells: 1003, mitotic cells: 49)
sgRNA 4: TTCTCATGGTATACTACACC (interphase cells: 828, mitotic cells: 52)

Interphase Cluster

Mitotic Cluster

Overview

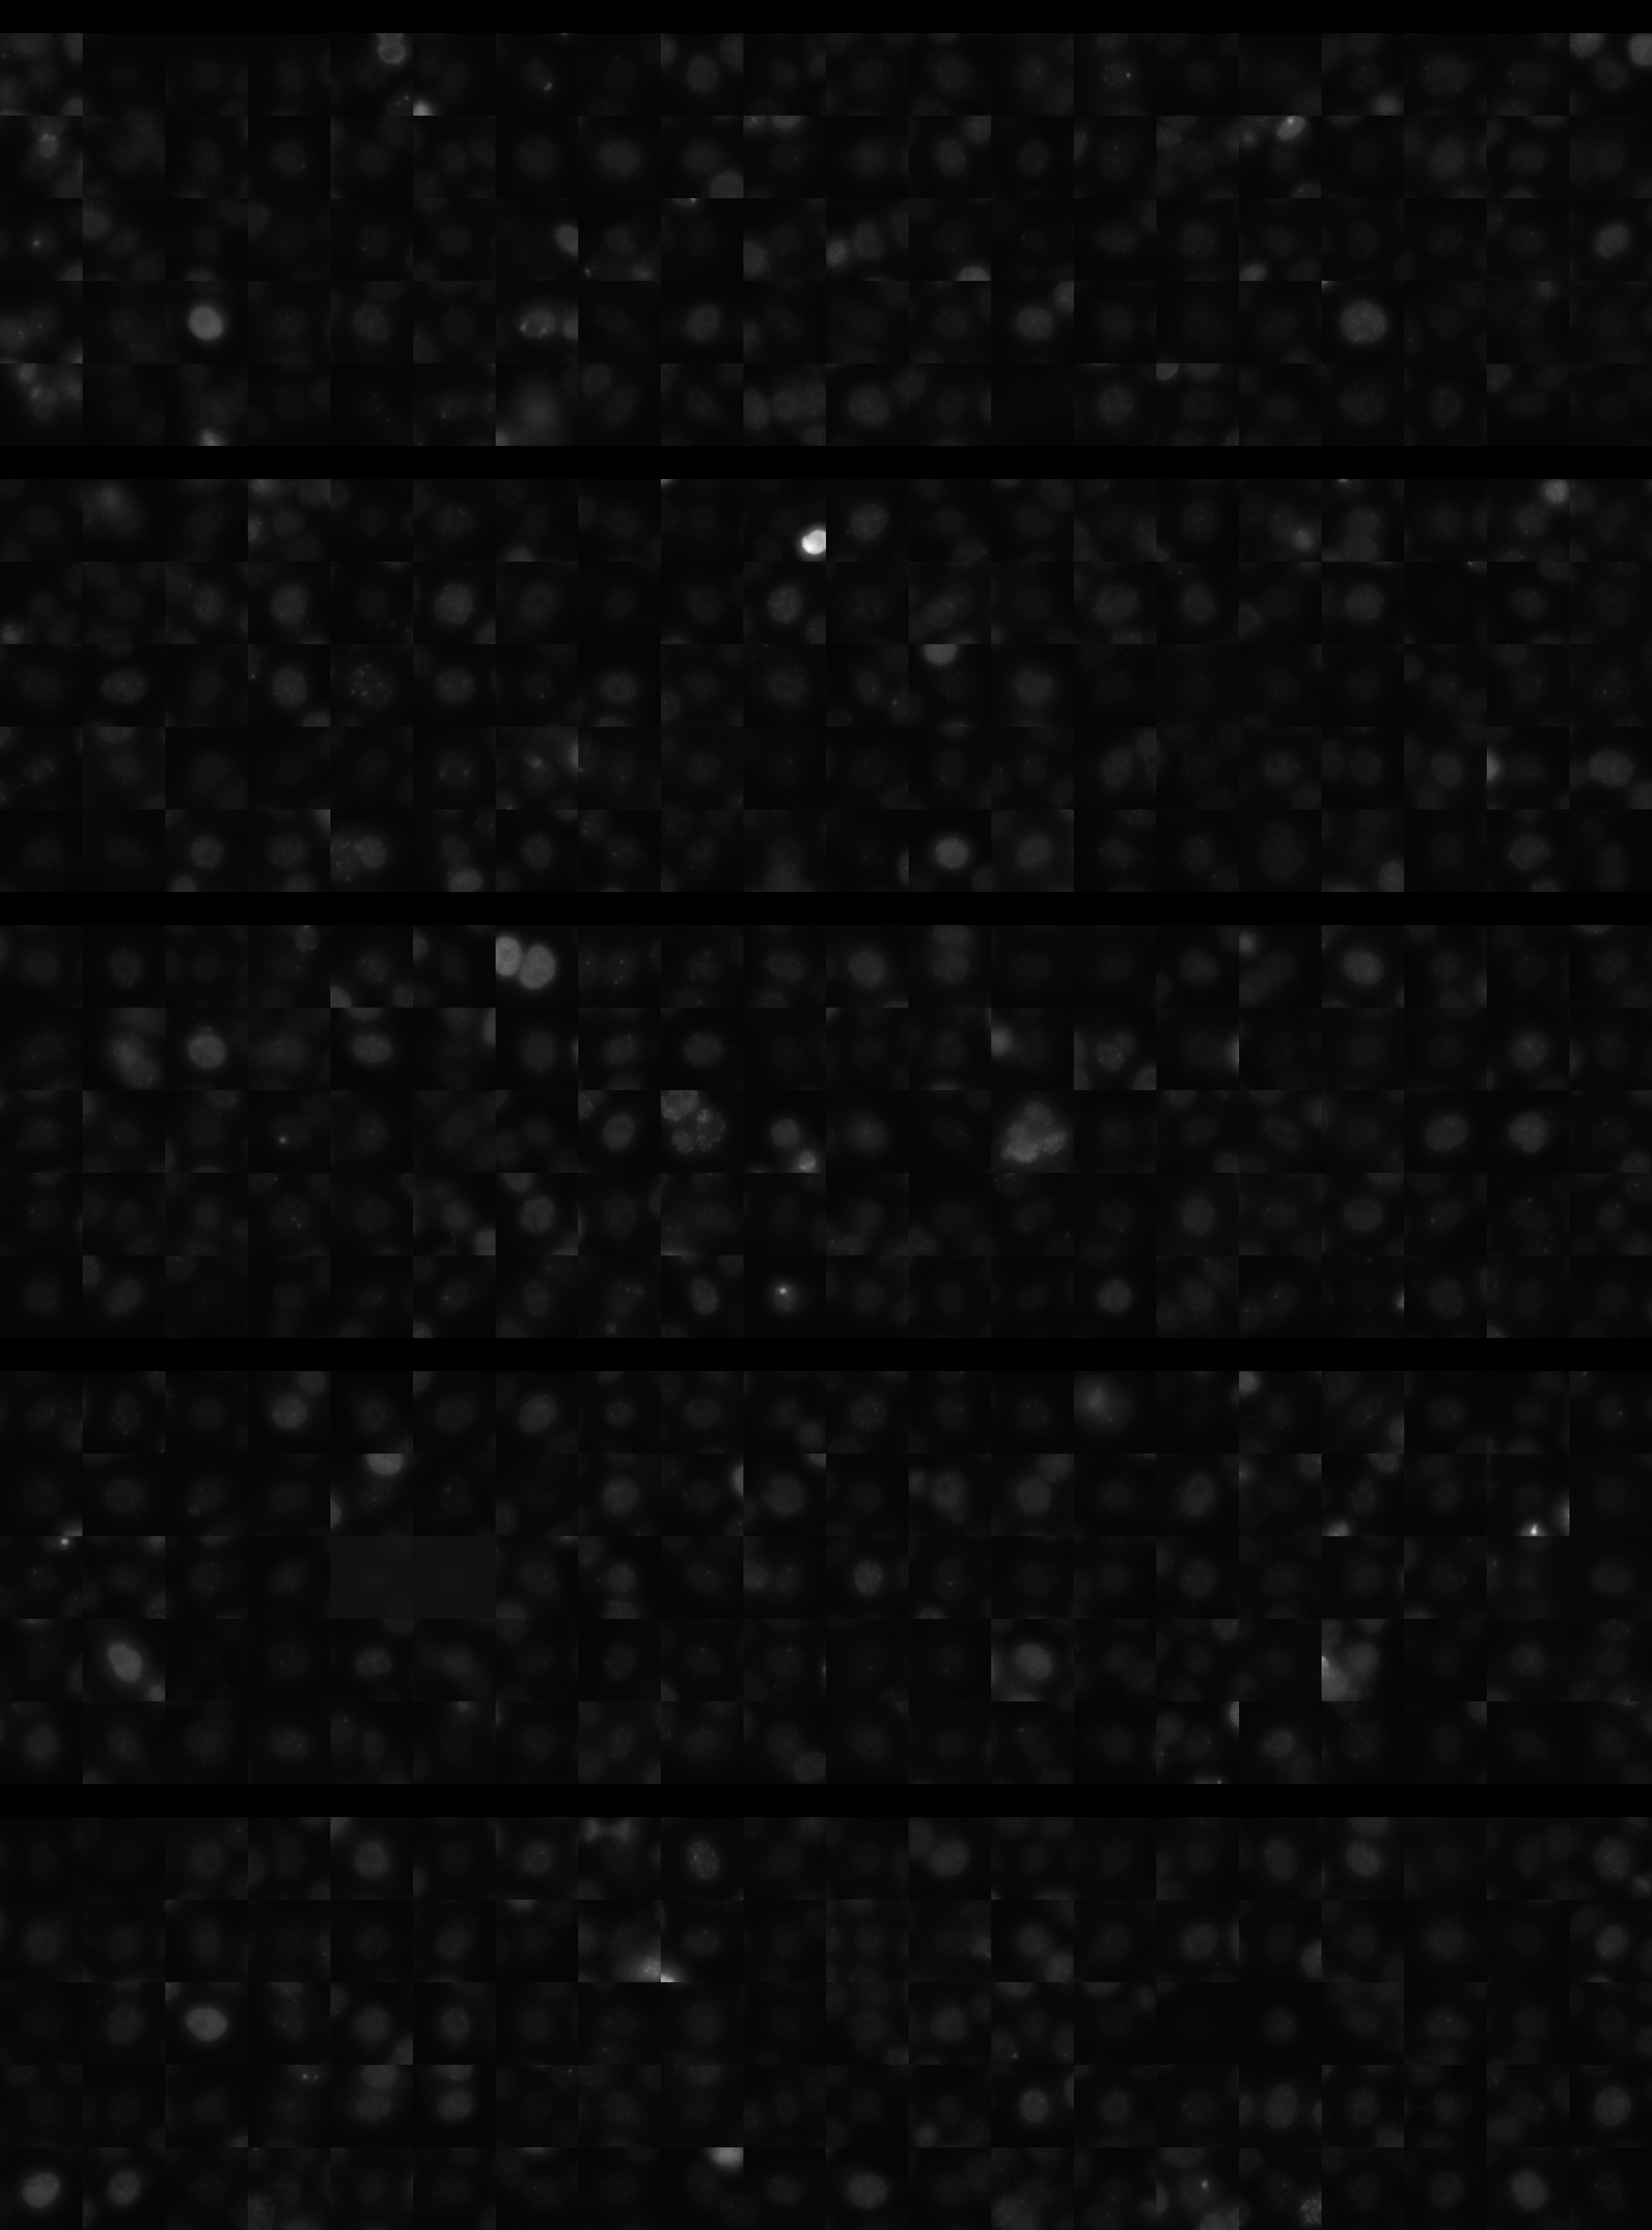
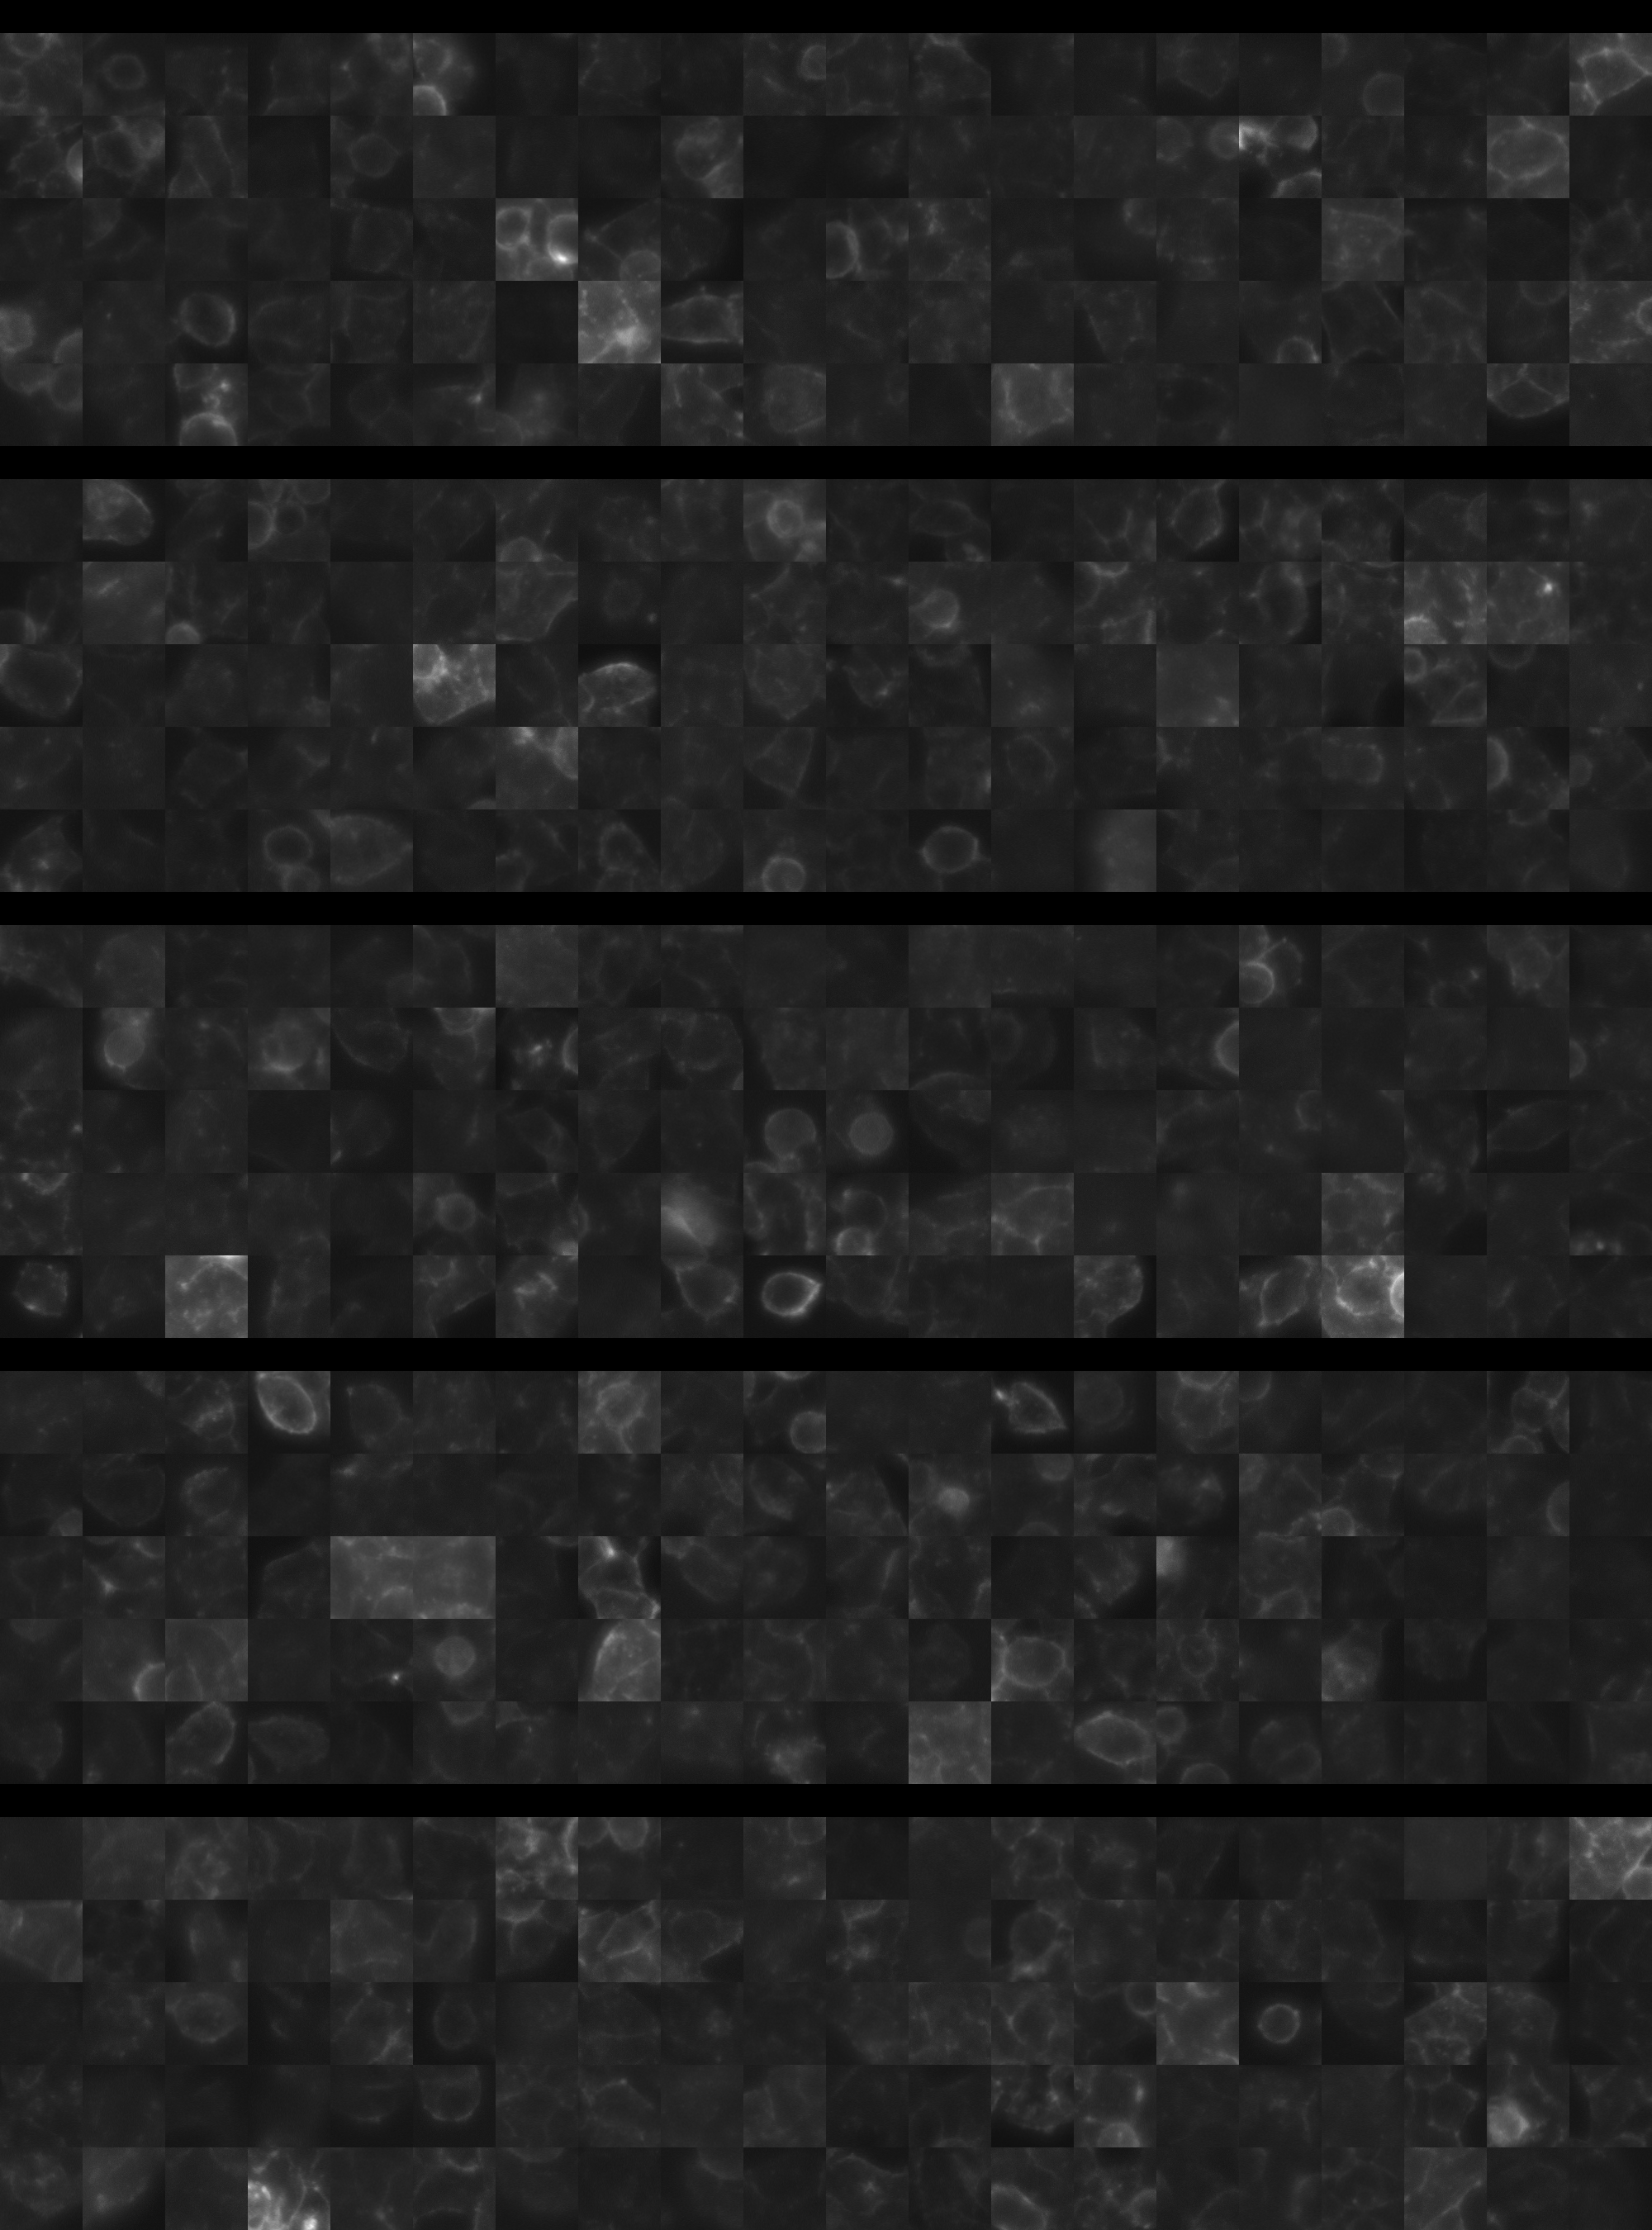
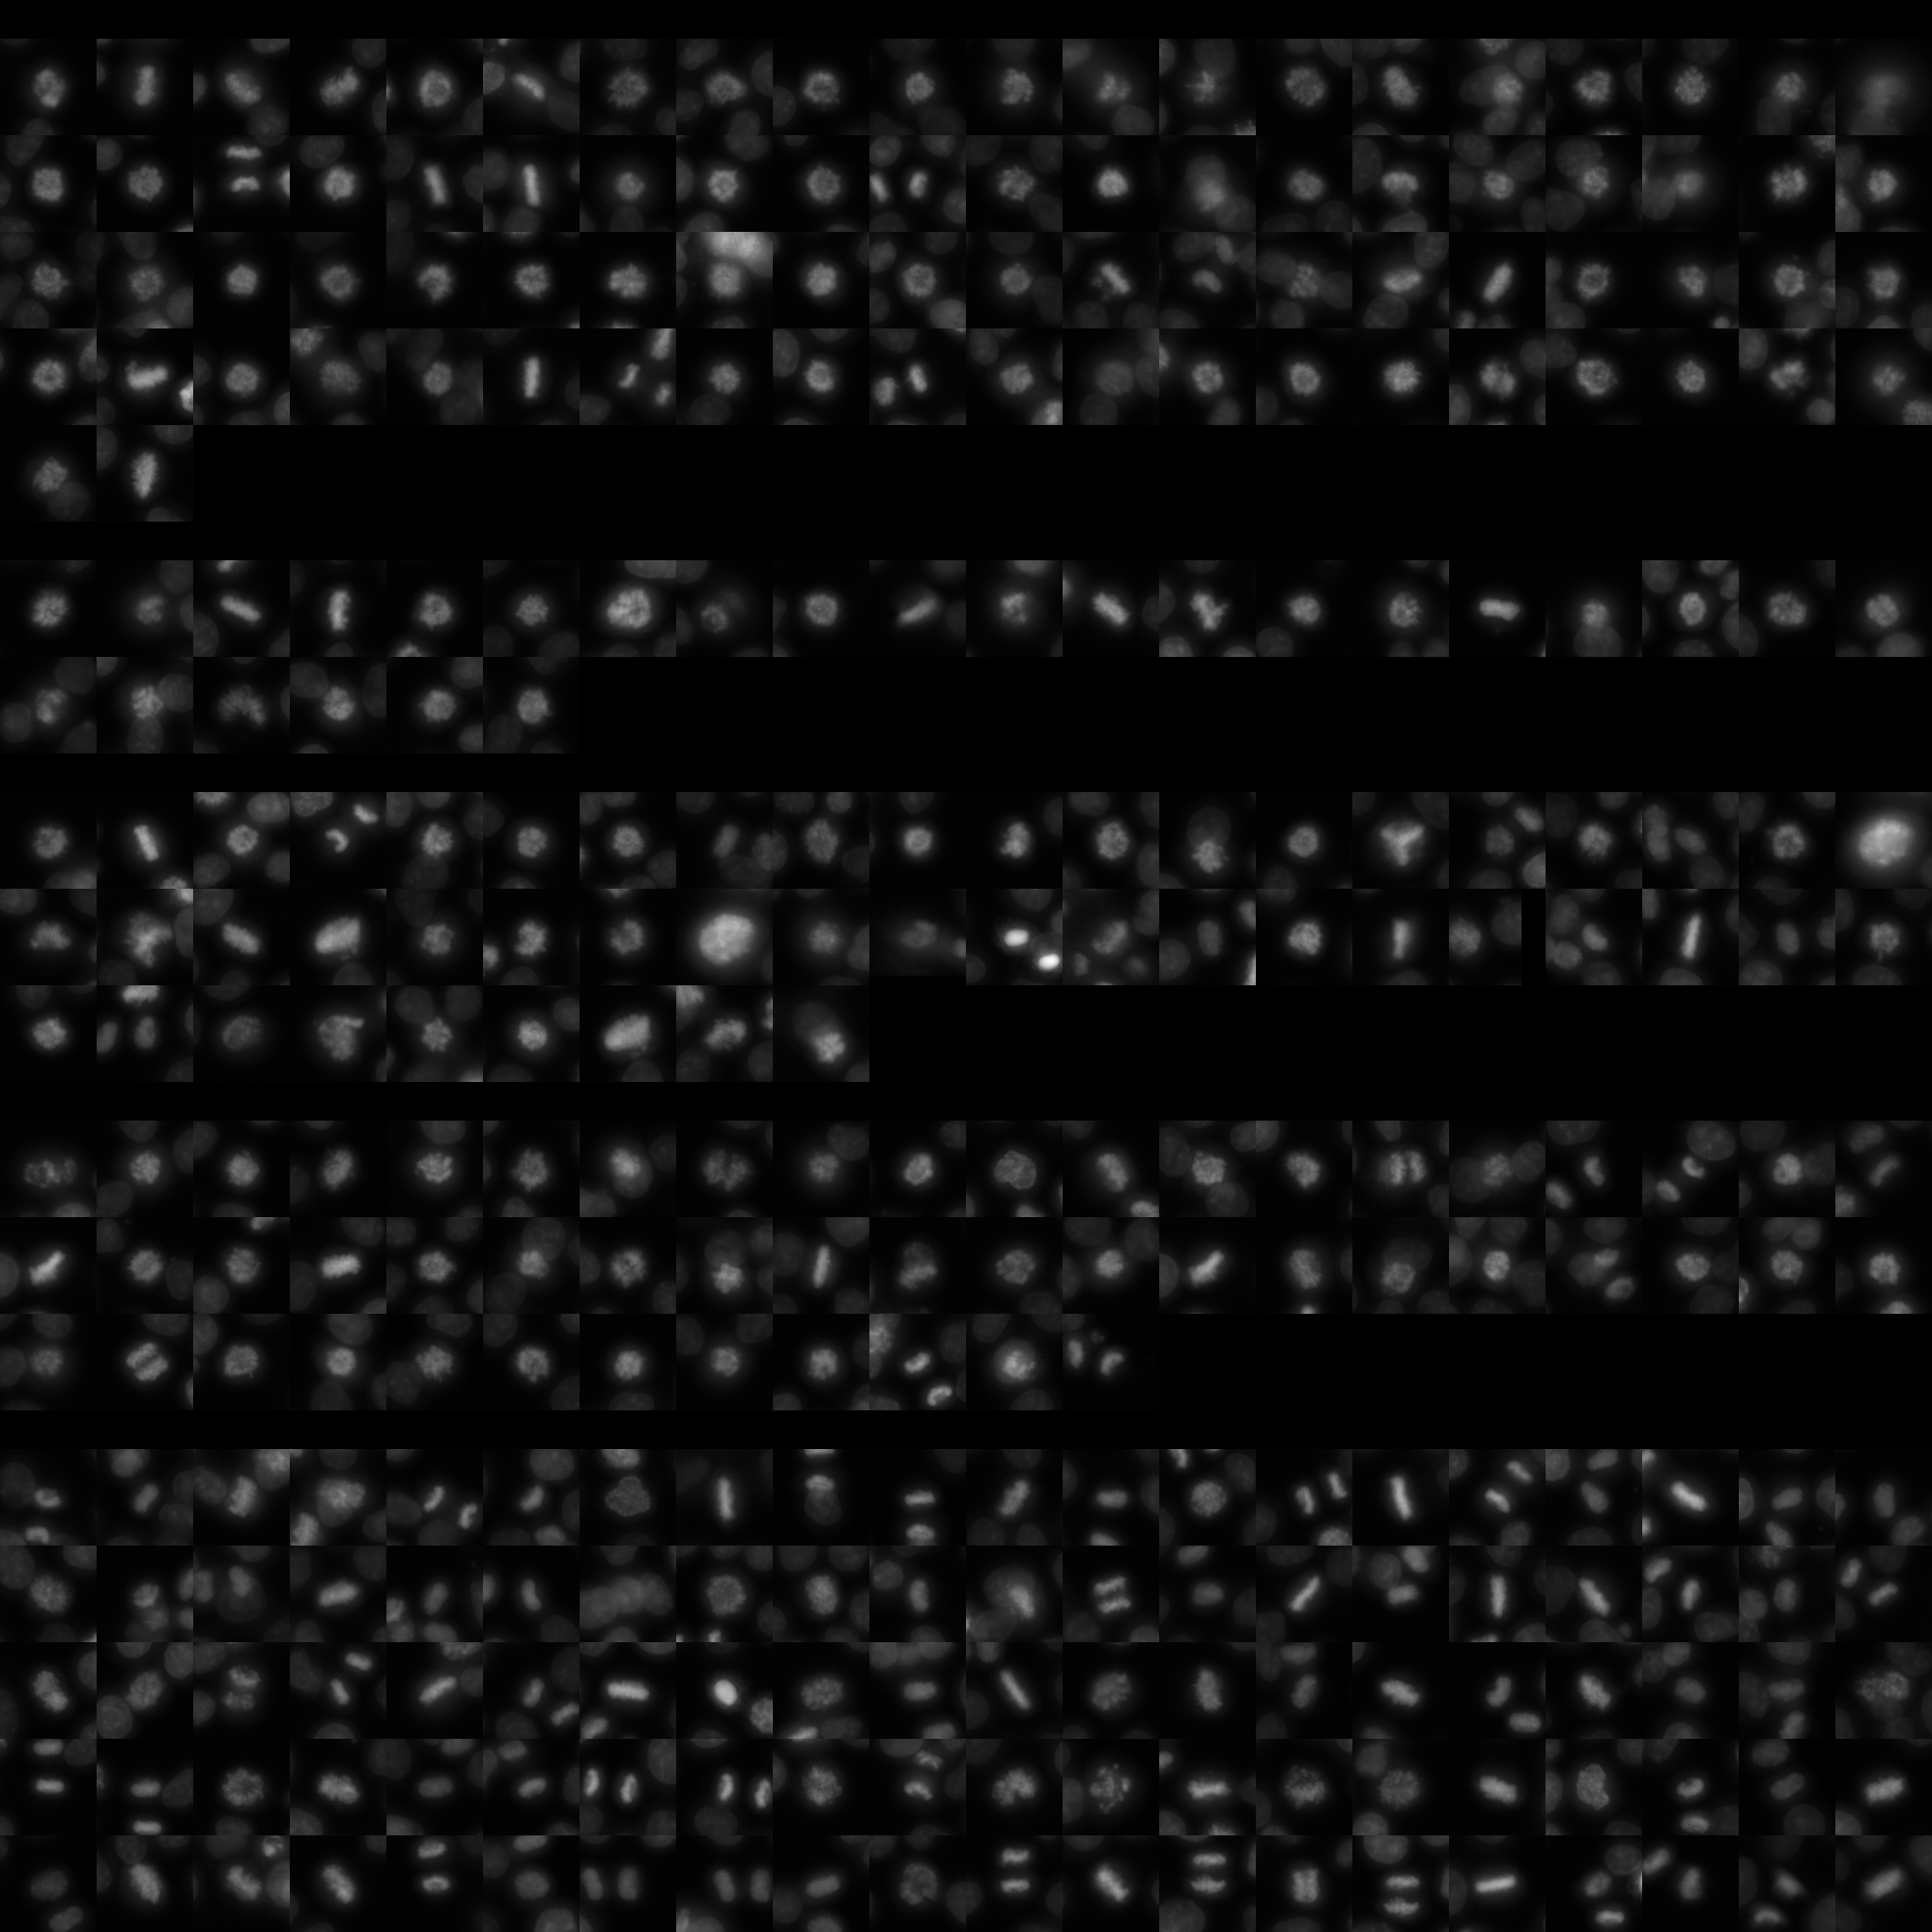
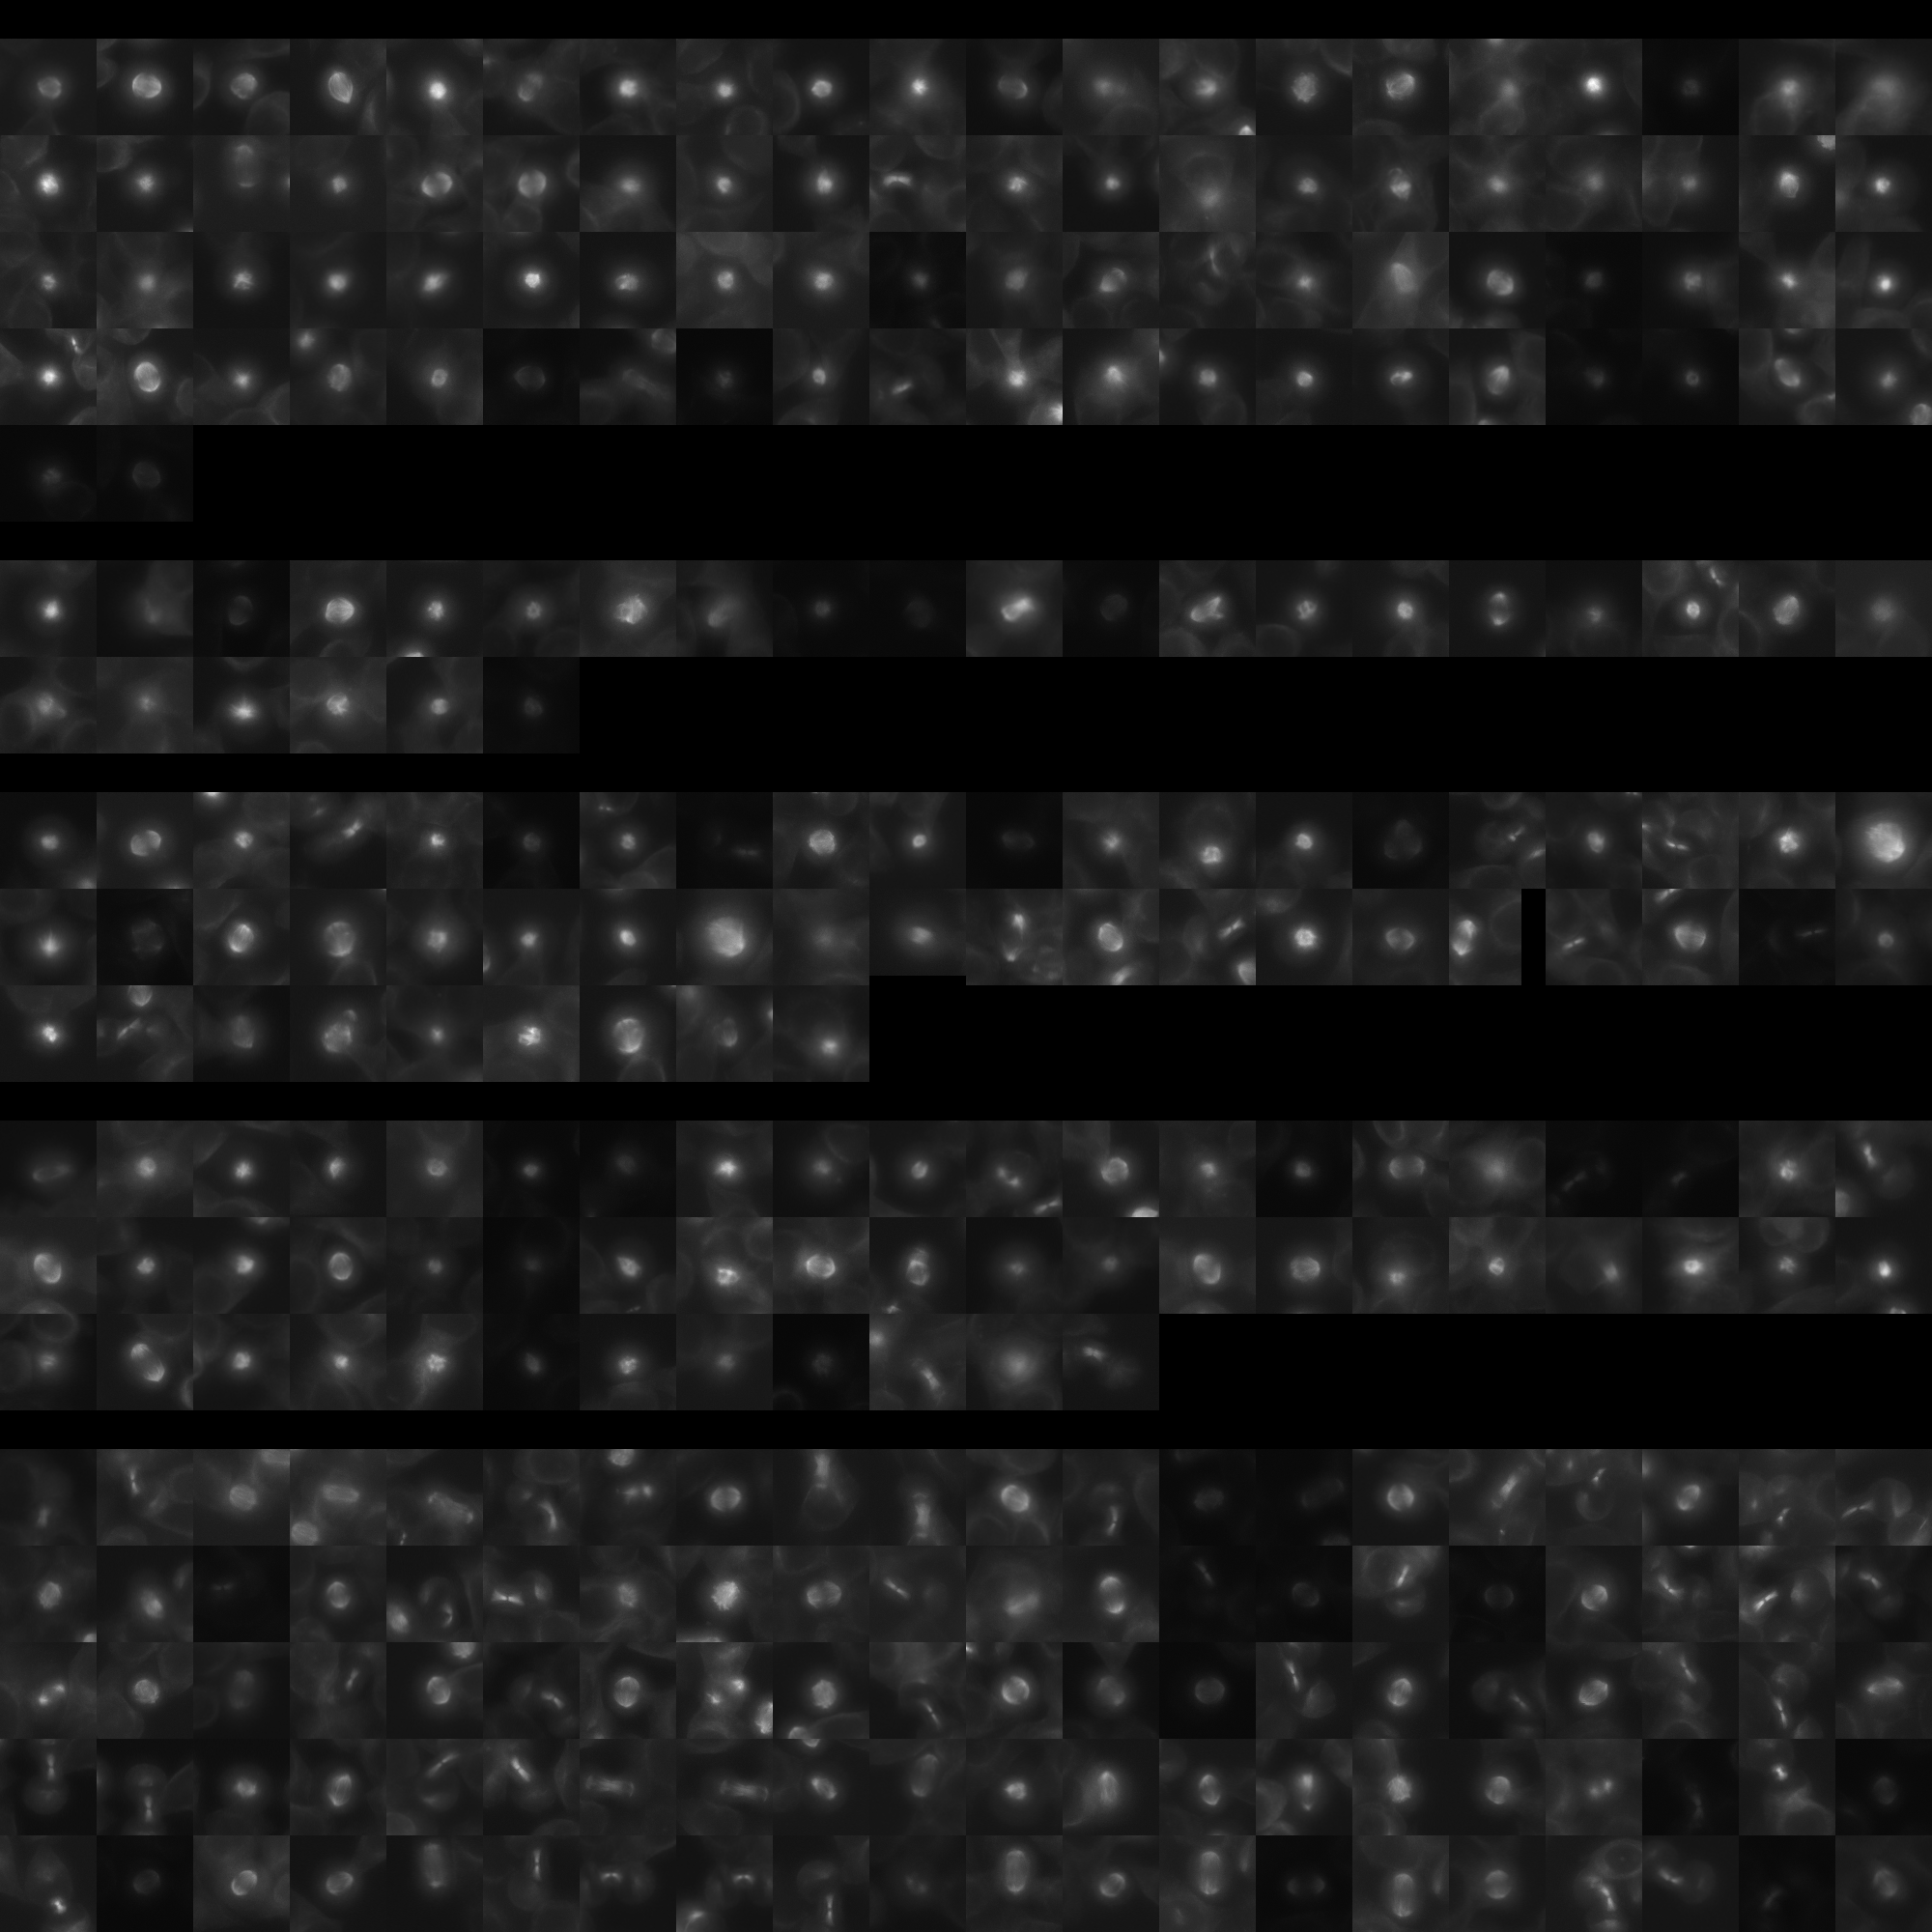
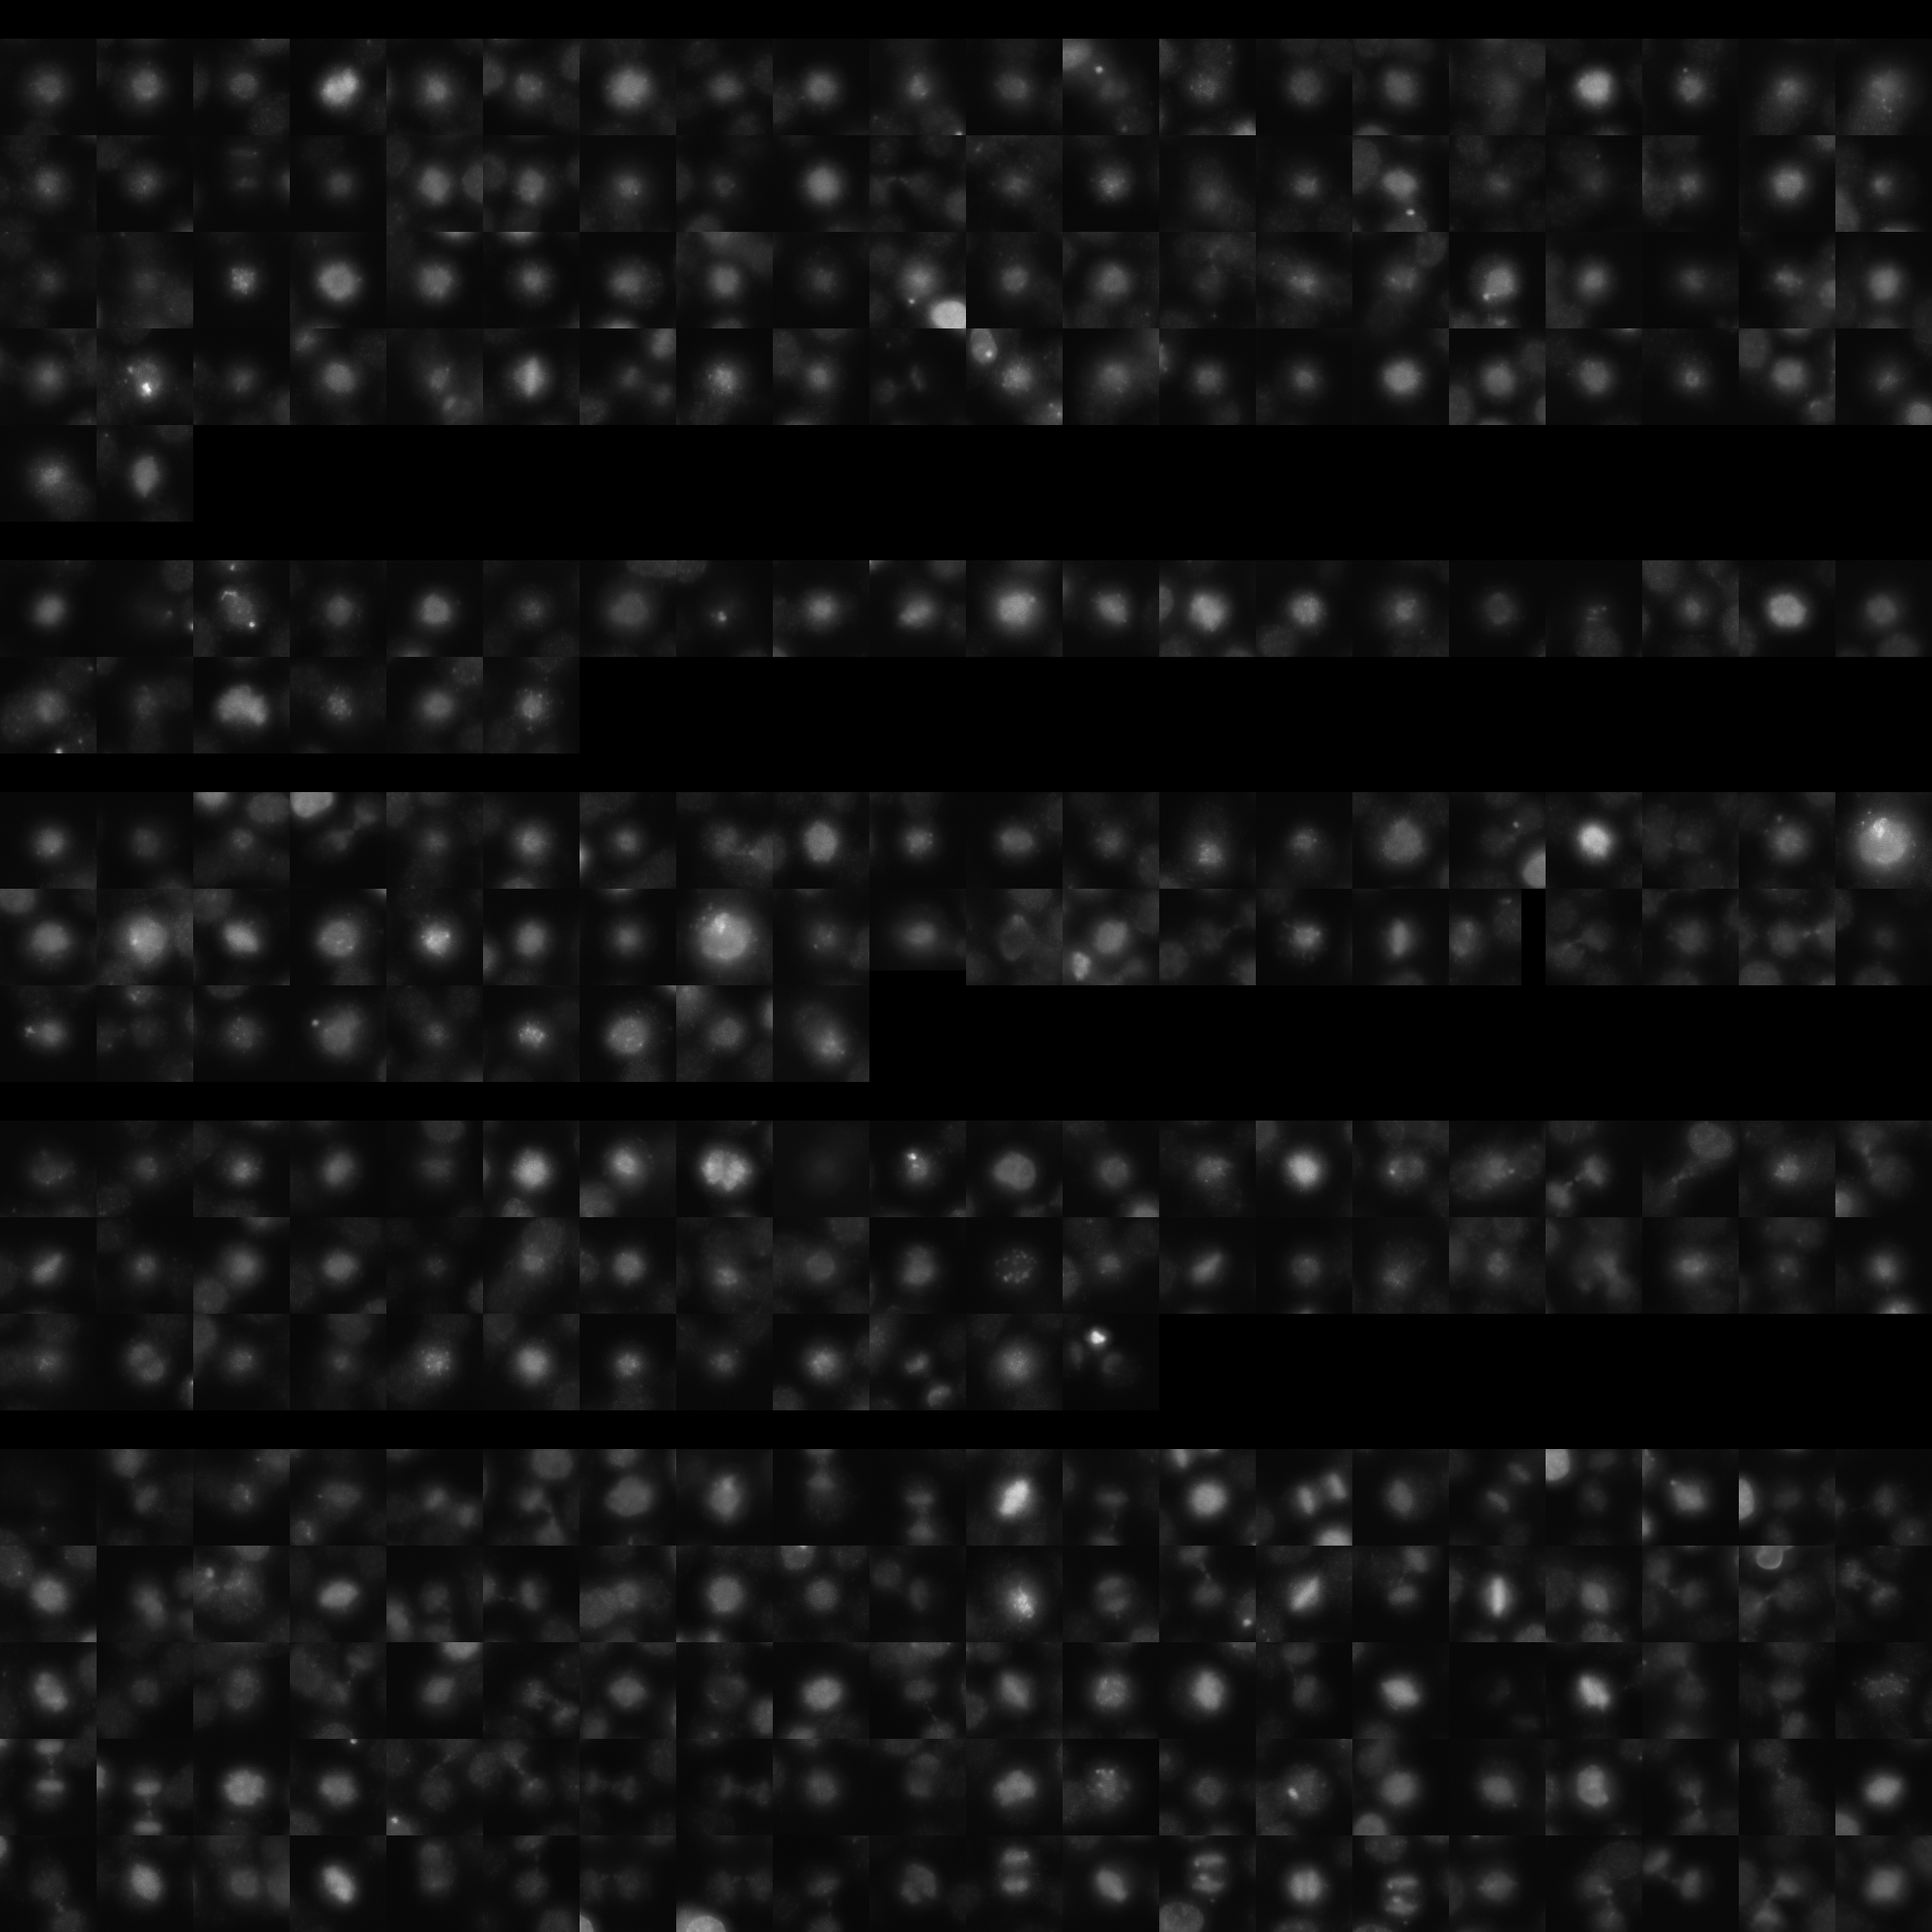
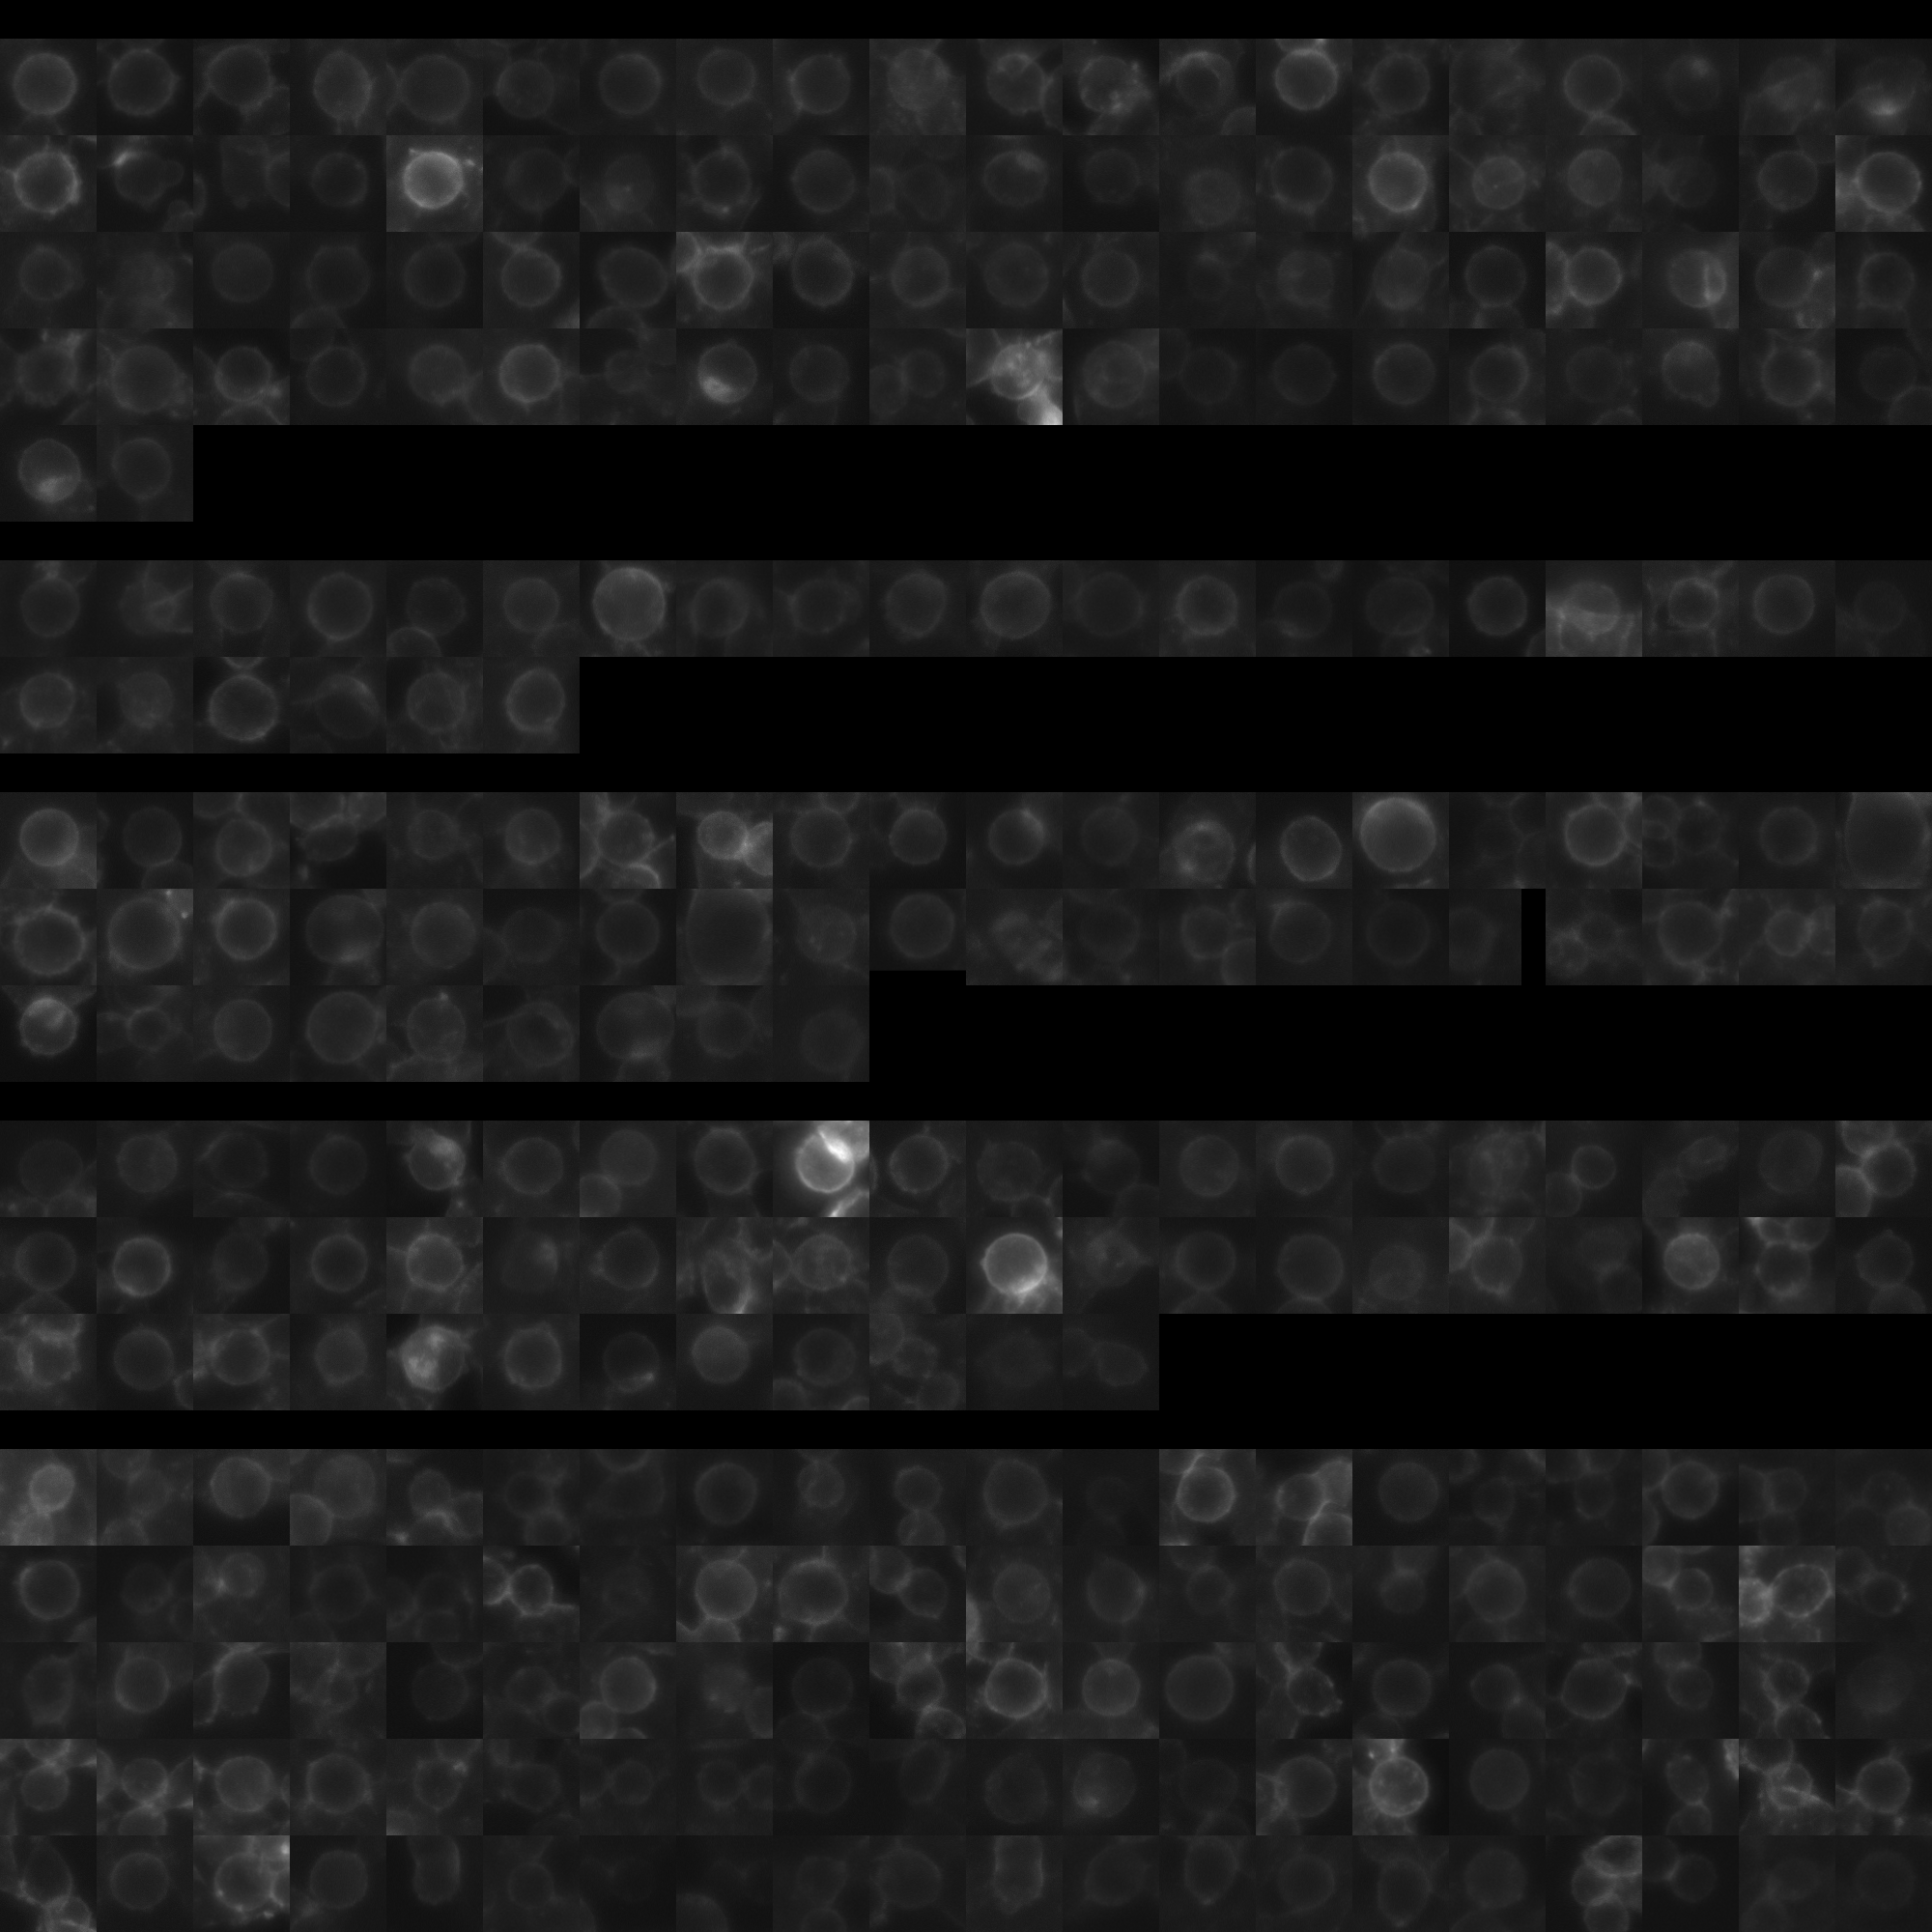
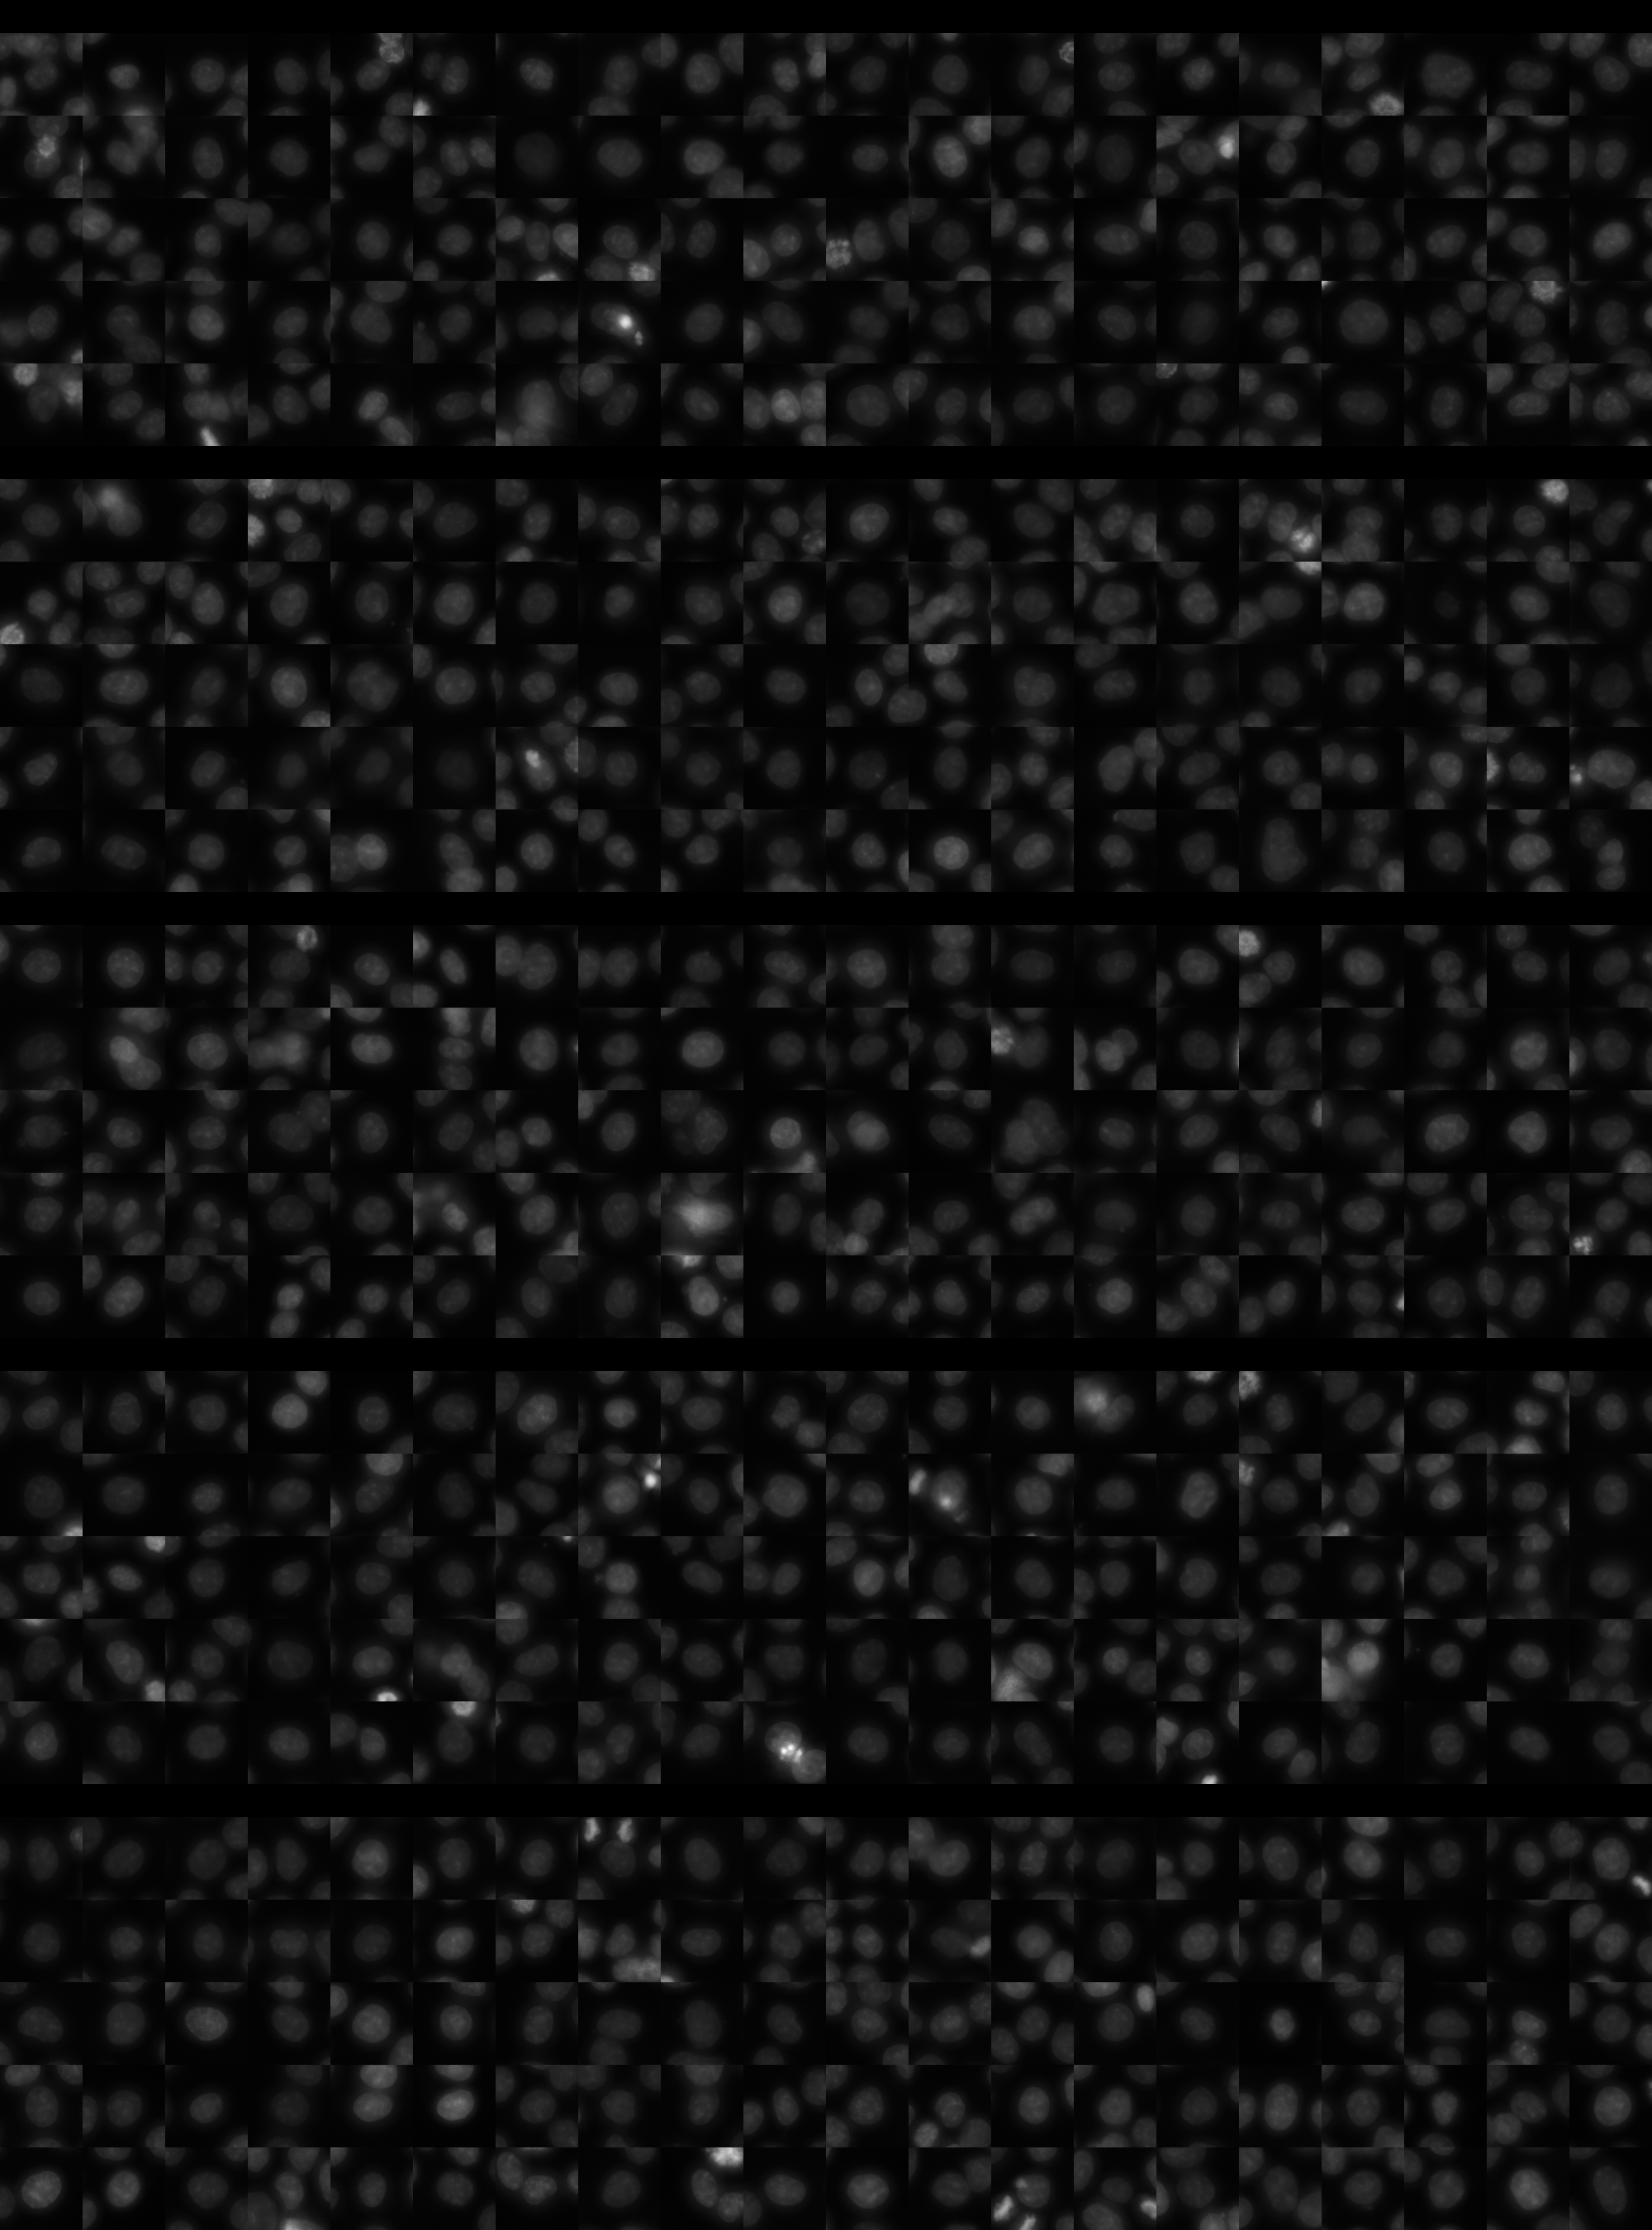
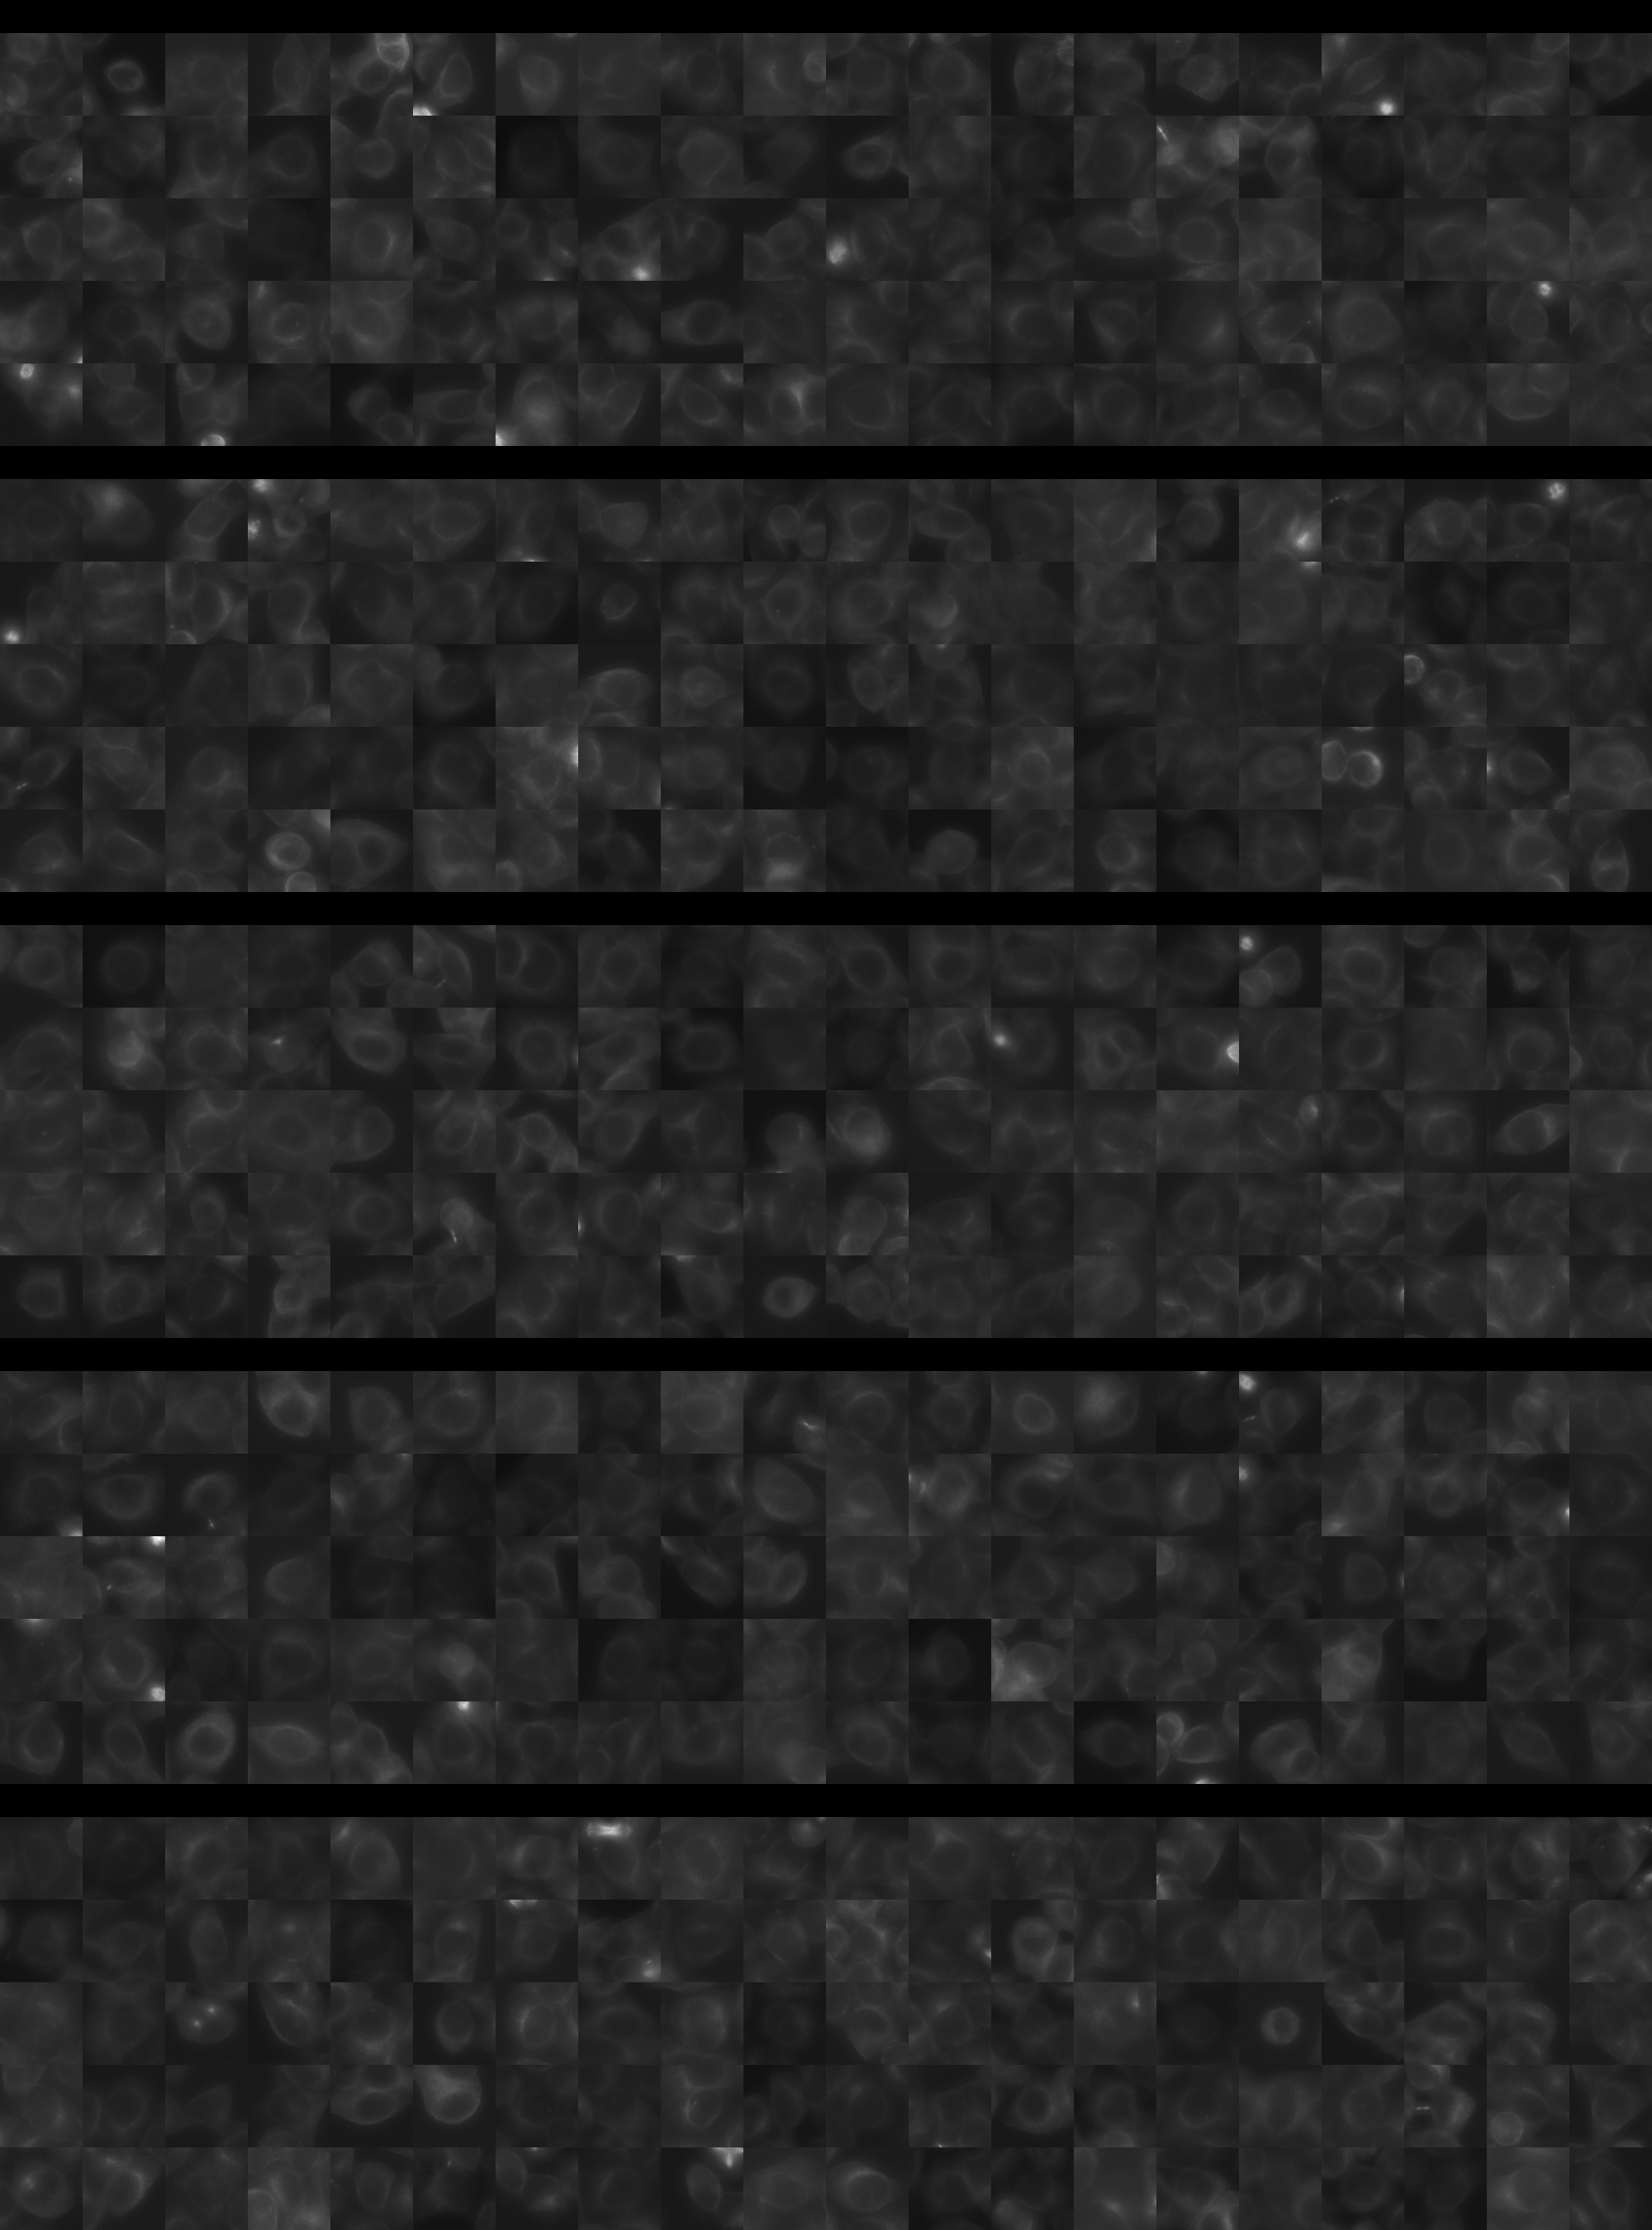
Each montage below shows randomly selected individual cell images for the same target gene separated by sgRNA, along with an example montage of cells expressing a non-targeting negative control sgRNA at the bottom. sgRNA labels in the montages correspond to the numbered sgRNA sequences in the gene info table above. The DNA (blue) and tubulin (green) channels are displayed by default, with gH2AX (grayscale) and actin (yellow) available using the check boxes. Channel brightness, contrast, and opacity are adjustable by clicking the arrow next to the channel name. When only one channel is selected, the display defaults to grayscale. Click the “Zoom” checkbox above the channel controls to enable image zooming (via scrolling) and panning (via click-and-drag).

The cell boxes displayed for this gene are square, 30.36 μm per side for the interphase montage and 30.36 μm per side for the mitotic montage.
Features

Interphase Score Rank FDR q-value
Nucleus DNA Integrated 0.144 249 of 5322 0.012
Nucleus DNA Mean -1.512e-02 2486 of 5322 0.832
Nucleus gH2AX Mean 0.145 1092 of 5322 0.002
Nucleus DNA - gH2AX Correlation 0.084 221 of 5322 0.027
Nucleus Shape Area 0.090 832 of 5322 0.114
Nucleus Shape Eccentricity 0.013 2603 of 5322 0.806
Nucleus Shape Form Factor -1.025e-01 4431 of 5322 0.018
Nucleus Shape Solidity -8.830e-02 4050 of 5322 0.021
Cell DNA Mass Displacement 0.022 2921 of 5322 0.806
Cell Tubulin Mean -5.805e-03 3008 of 5322 0.965
Cell Tubulin Mass Displacement -5.865e-02 4902 of 5322 0.238
Cell Actin Mean -6.121e-03 3203 of 5322 0.956
Cell Tubulin - Actin Correlation 0.111 487 of 5322 0.009
Cell DNA - Tubulin Correlation 0.069 1452 of 5322 0.095
Cell Shape Area 0.034 2018 of 5322 0.729
Cell Shape Eccentricity -3.733e-03 3960 of 5322 0.987
Mitotic Score Rank FDR q-value
Nucleus DNA Integrated 0.573 80 of 5322 0.064
Nucleus DNA Mean 0.319 180 of 5322 1.000
Nucleus DNA Mass Displacement 0.192 829 of 5322 0.999
Nucleus DNA Mean Frac 3 -1.332e-02 3326 of 5322 1.000
Nucleus gH2AX Mean -6.946e-02 3905 of 5322 1.000
Nucleus gH2AX Mean Frac 0 0.753 7 of 5322 0.053
Nucleus Tubulin Mean Frac 0 2.184 4 of 5322 0.005
Nucleus Tubulin Mean Edge -4.727e-01 5252 of 5322 0.074
Nucleus Tubulin Std Edge -1.013e+00 5311 of 5322 0.002
Nucleus Shape Area 0.539 221 of 5322 0.037
Nucleus Shape Eccentricity -1.150e+00 5311 of 5322 0.006
Nucleus Shape Form Factor -3.038e-02 1818 of 5322 0.998
Cell Tubulin Mean 0.239 712 of 5322 0.933
Cell Tubulin Mean Frac 3 -5.142e-01 5200 of 5322 0.092
Cell Actin Mean 0.204 866 of 5322 0.997
Cell Shape Area 0.527 174 of 5322 0.174
( Reset Zoom )
Brightness
Contrast
Opacity
Brightness
Contrast
Opacity
Brightness
Contrast
Opacity
Brightness
Contrast
Opacity
Brightness
Contrast
Opacity

( Reset Zoom )
Brightness
Contrast
Opacity
Brightness
Contrast
Opacity
Brightness
Contrast
Opacity
Brightness
Contrast
Opacity
Brightness
Contrast
Opacity

Day 3

Day 4

MIT Central Accessability