PIH1D1

Gene symbol: PIH1D1
Gene: 55011
Uniprot Function: Involved in the assembly of C/D box small nucleolar ribonucleoprotein (snoRNP) particles (PubMed:17636026). Recruits the SWI/SNF complex to the core promoter of rRNA genes and enhances pre-rRNA transcription (PubMed:22368283, PubMed:24036451). Mediates interaction of TELO2 with the R2TP complex which is necessary for the stability of MTOR and SMG1 (PubMed:20864032). Positively regulates the assembly and activity of the mTORC1 complex (PubMed:24036451).
Mitotic Index 0.0321
Interphase Cluster: #22 (39 genes)
Mitotic Cluster: #18 (40 genes)
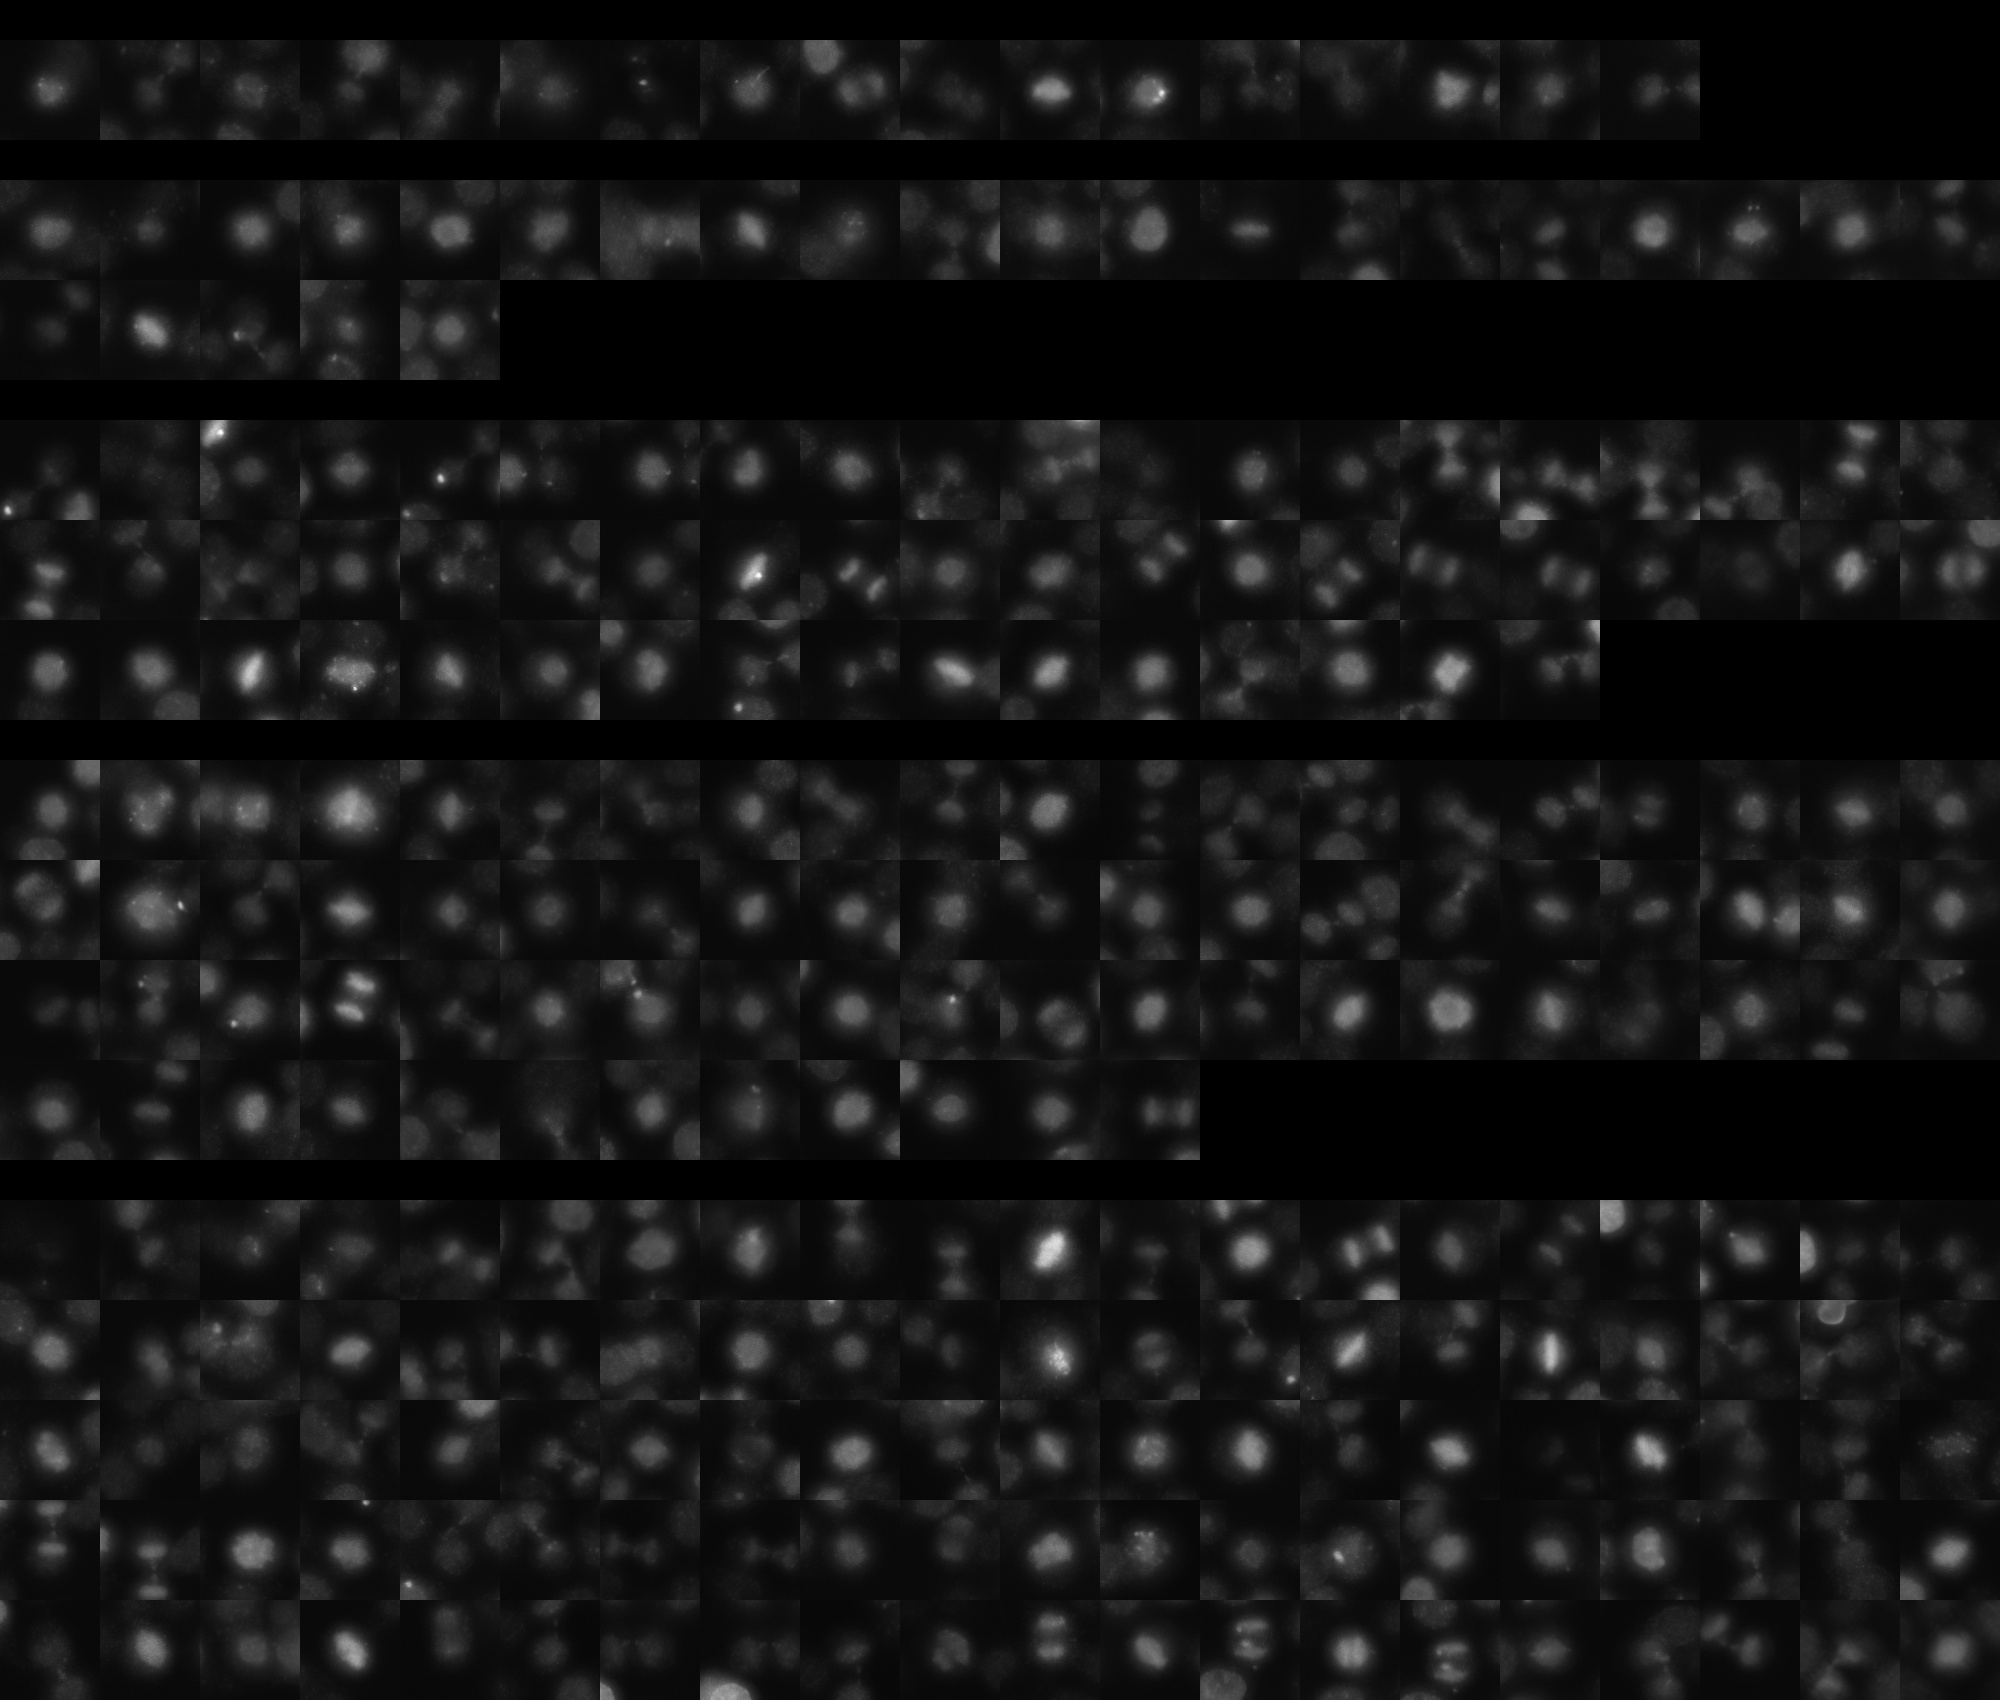
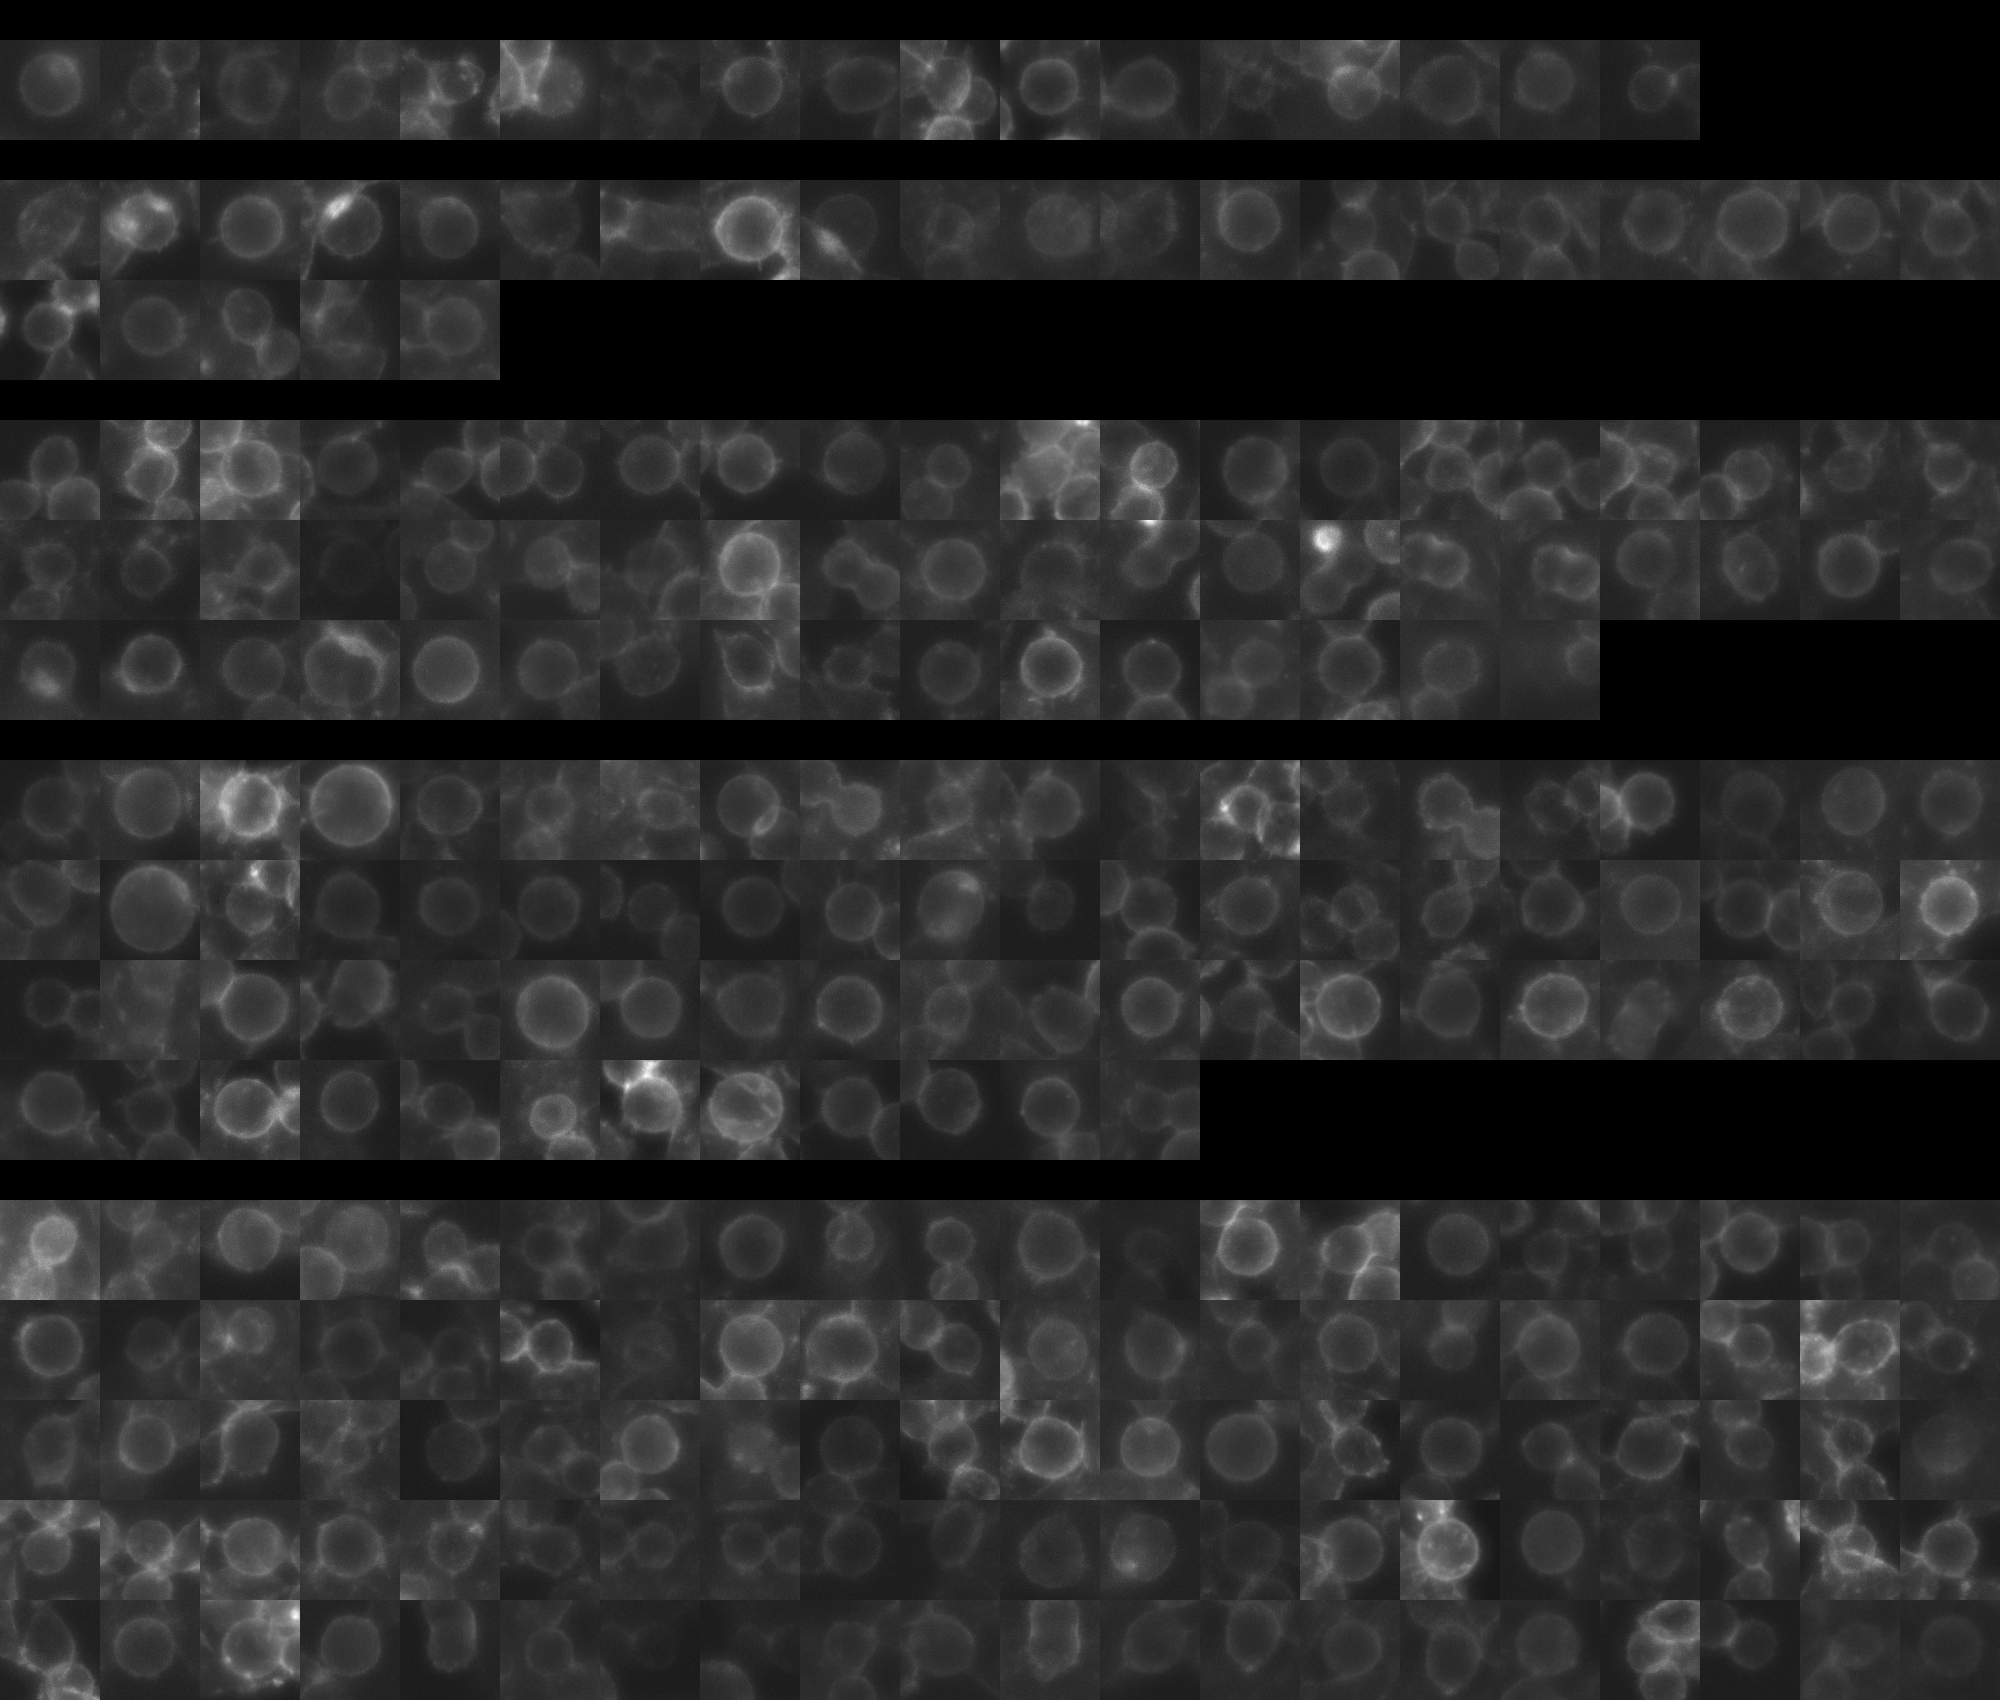
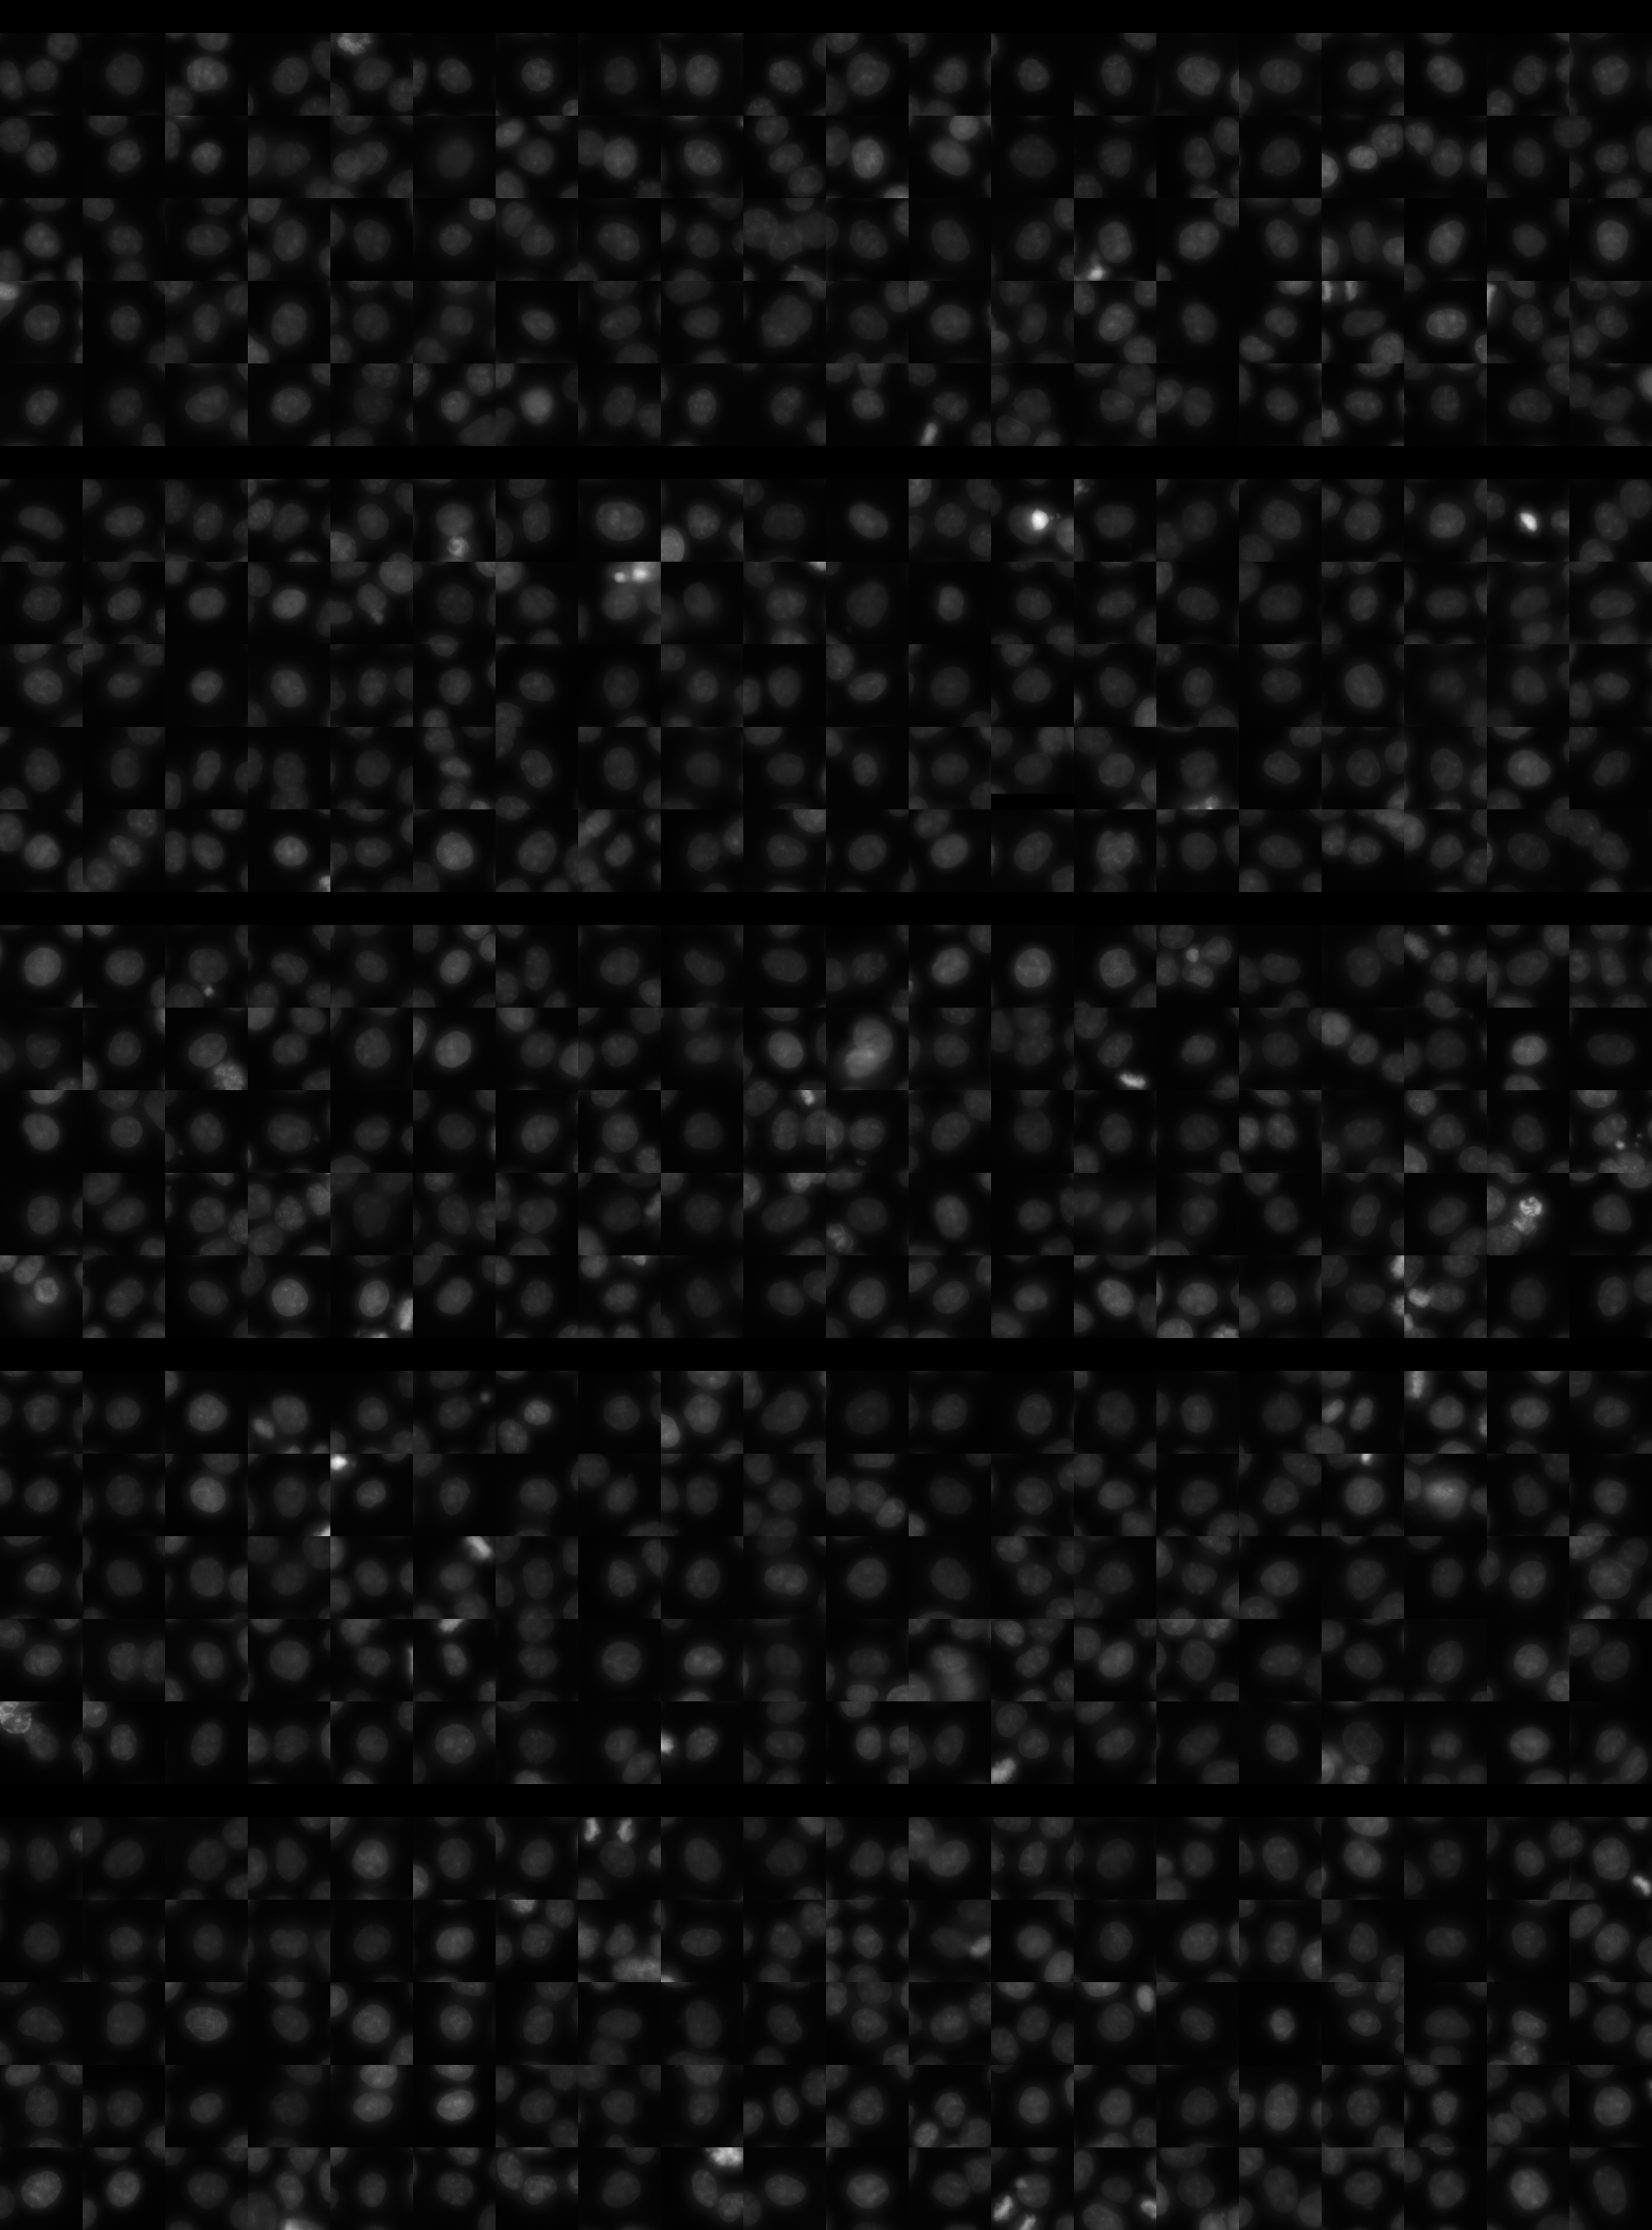
sgRNA 1: GTTGACAGCTACGTCGTAGG (interphase cells: 836, mitotic cells: 17)
sgRNA 2: TAAAGACCAACTCCTCGGAA (interphase cells: 1034, mitotic cells: 25)
sgRNA 3: TCCTCCCGCCGACGTGACCG (interphase cells: 1484, mitotic cells: 56)
sgRNA 4: TTTCGCATCCCCATGAGTCT (interphase cells: 1769, mitotic cells: 72)

Interphase Cluster

Mitotic Cluster

Overview

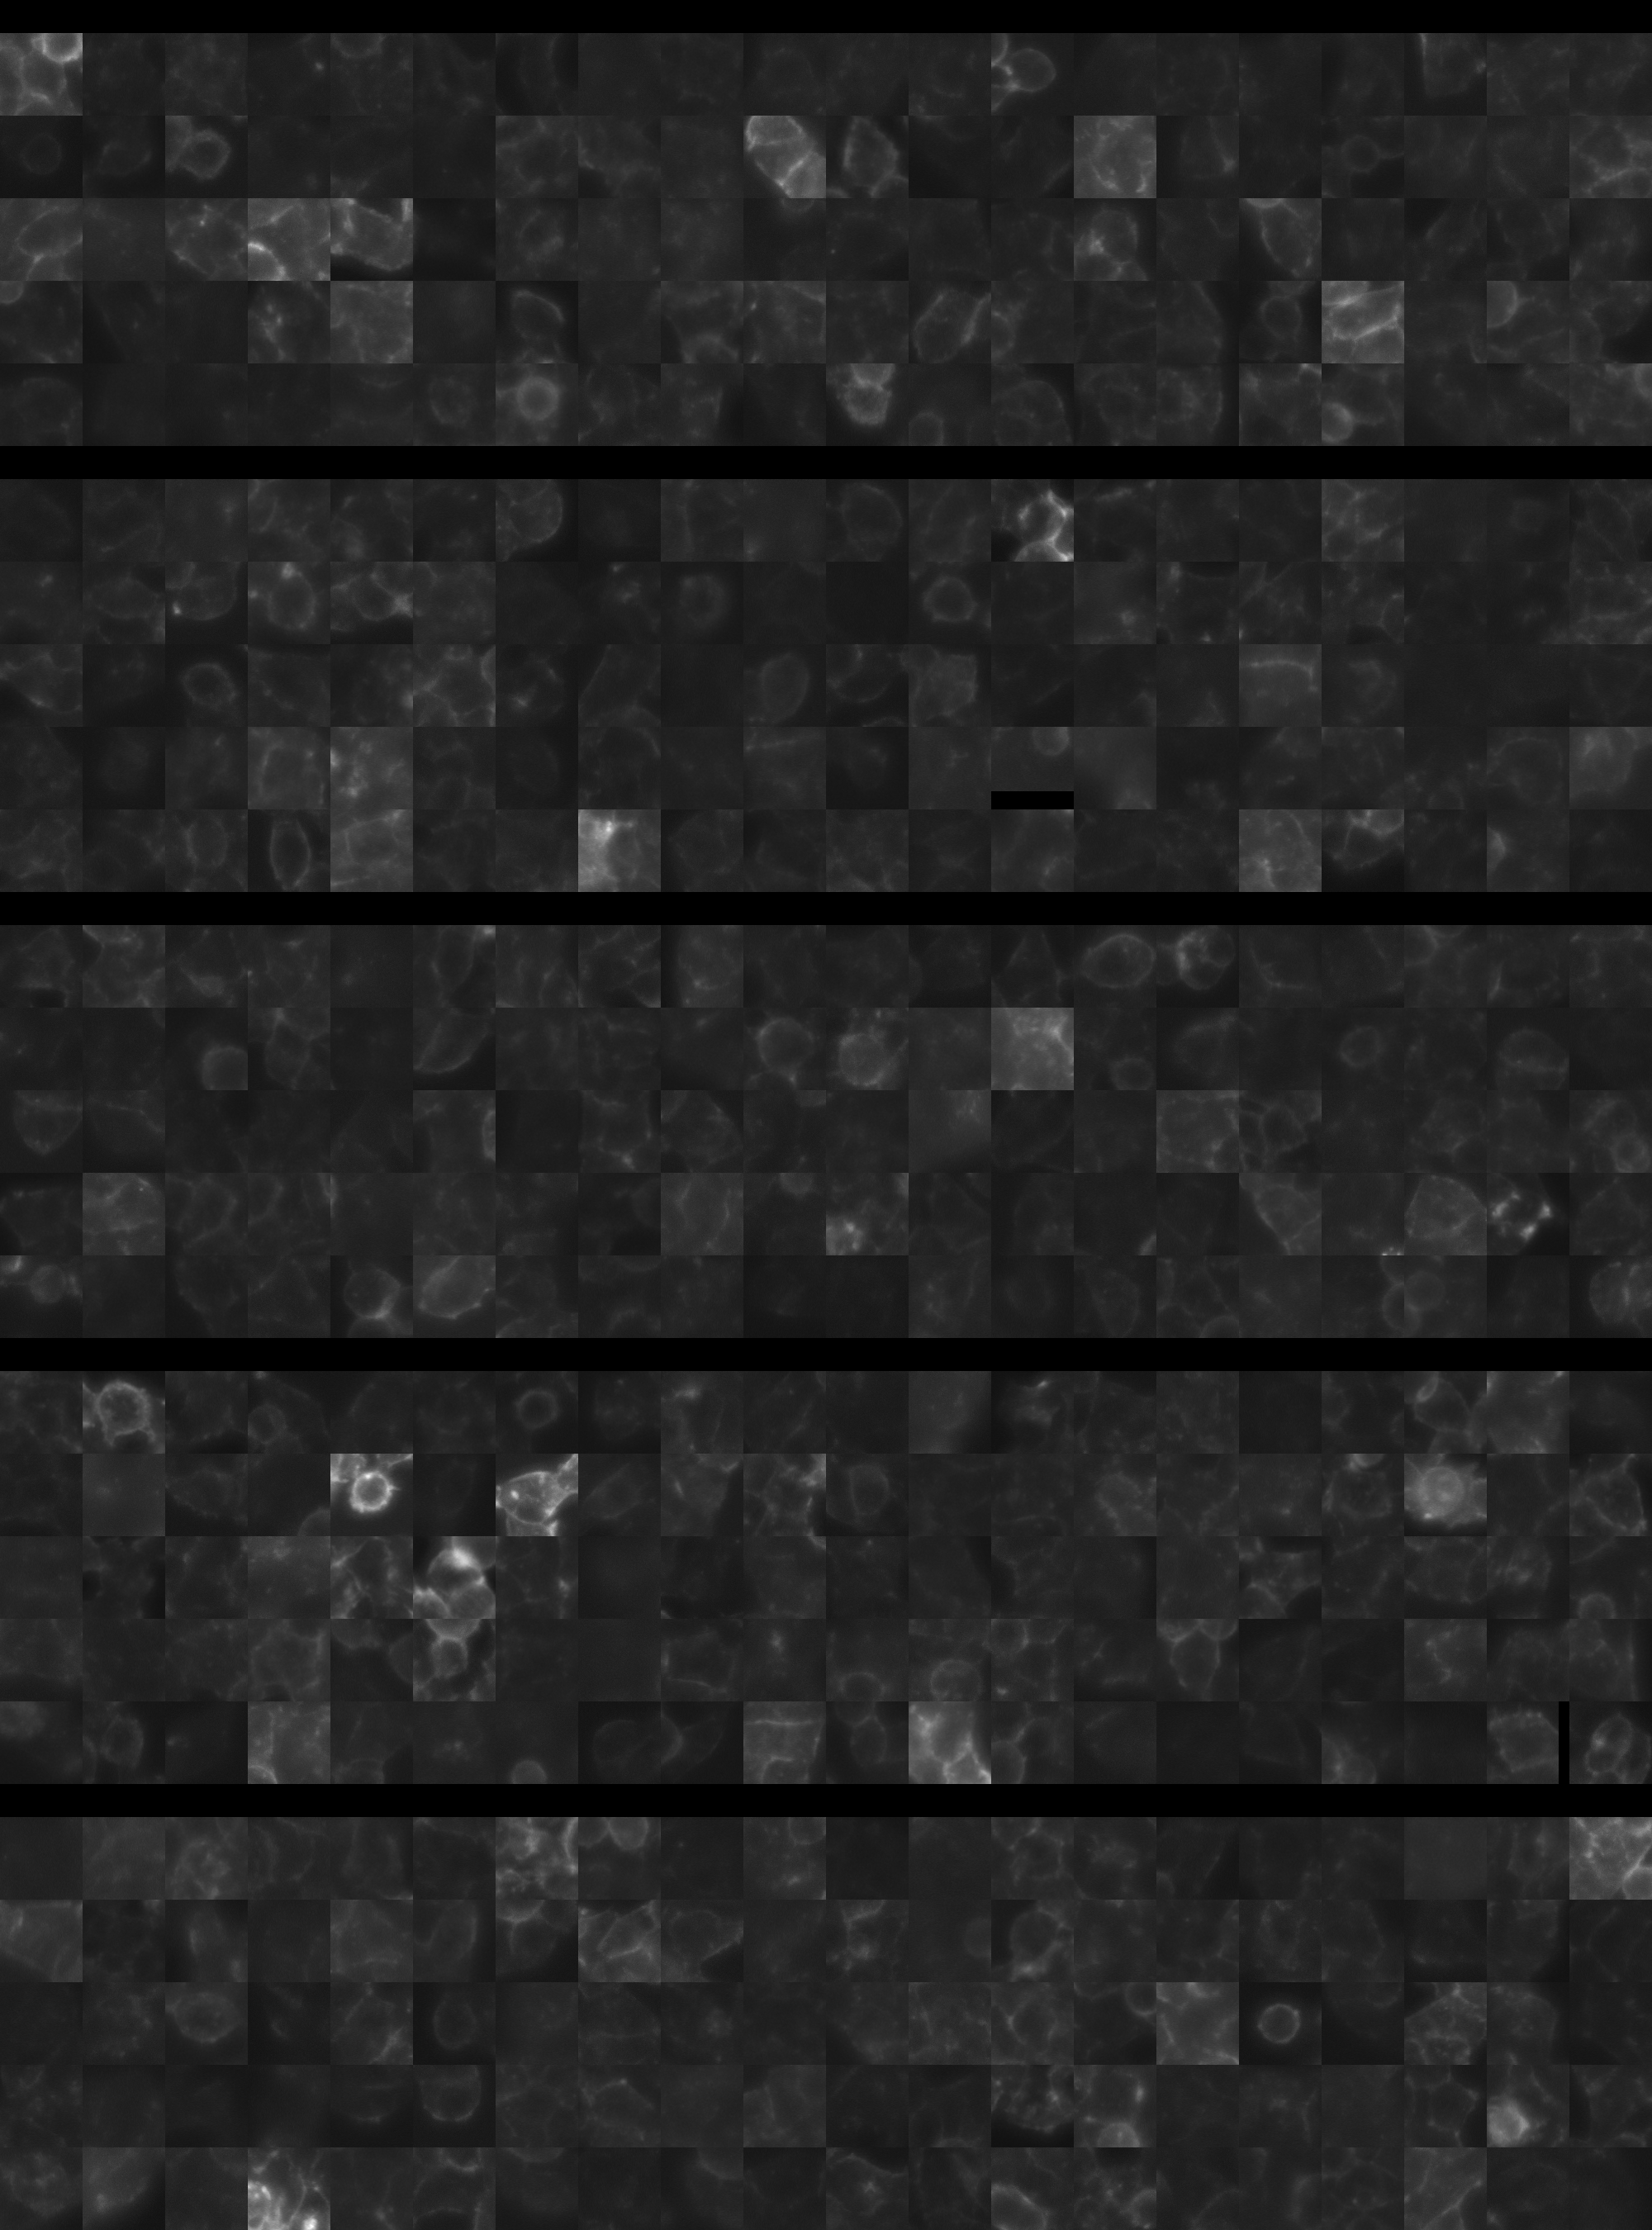
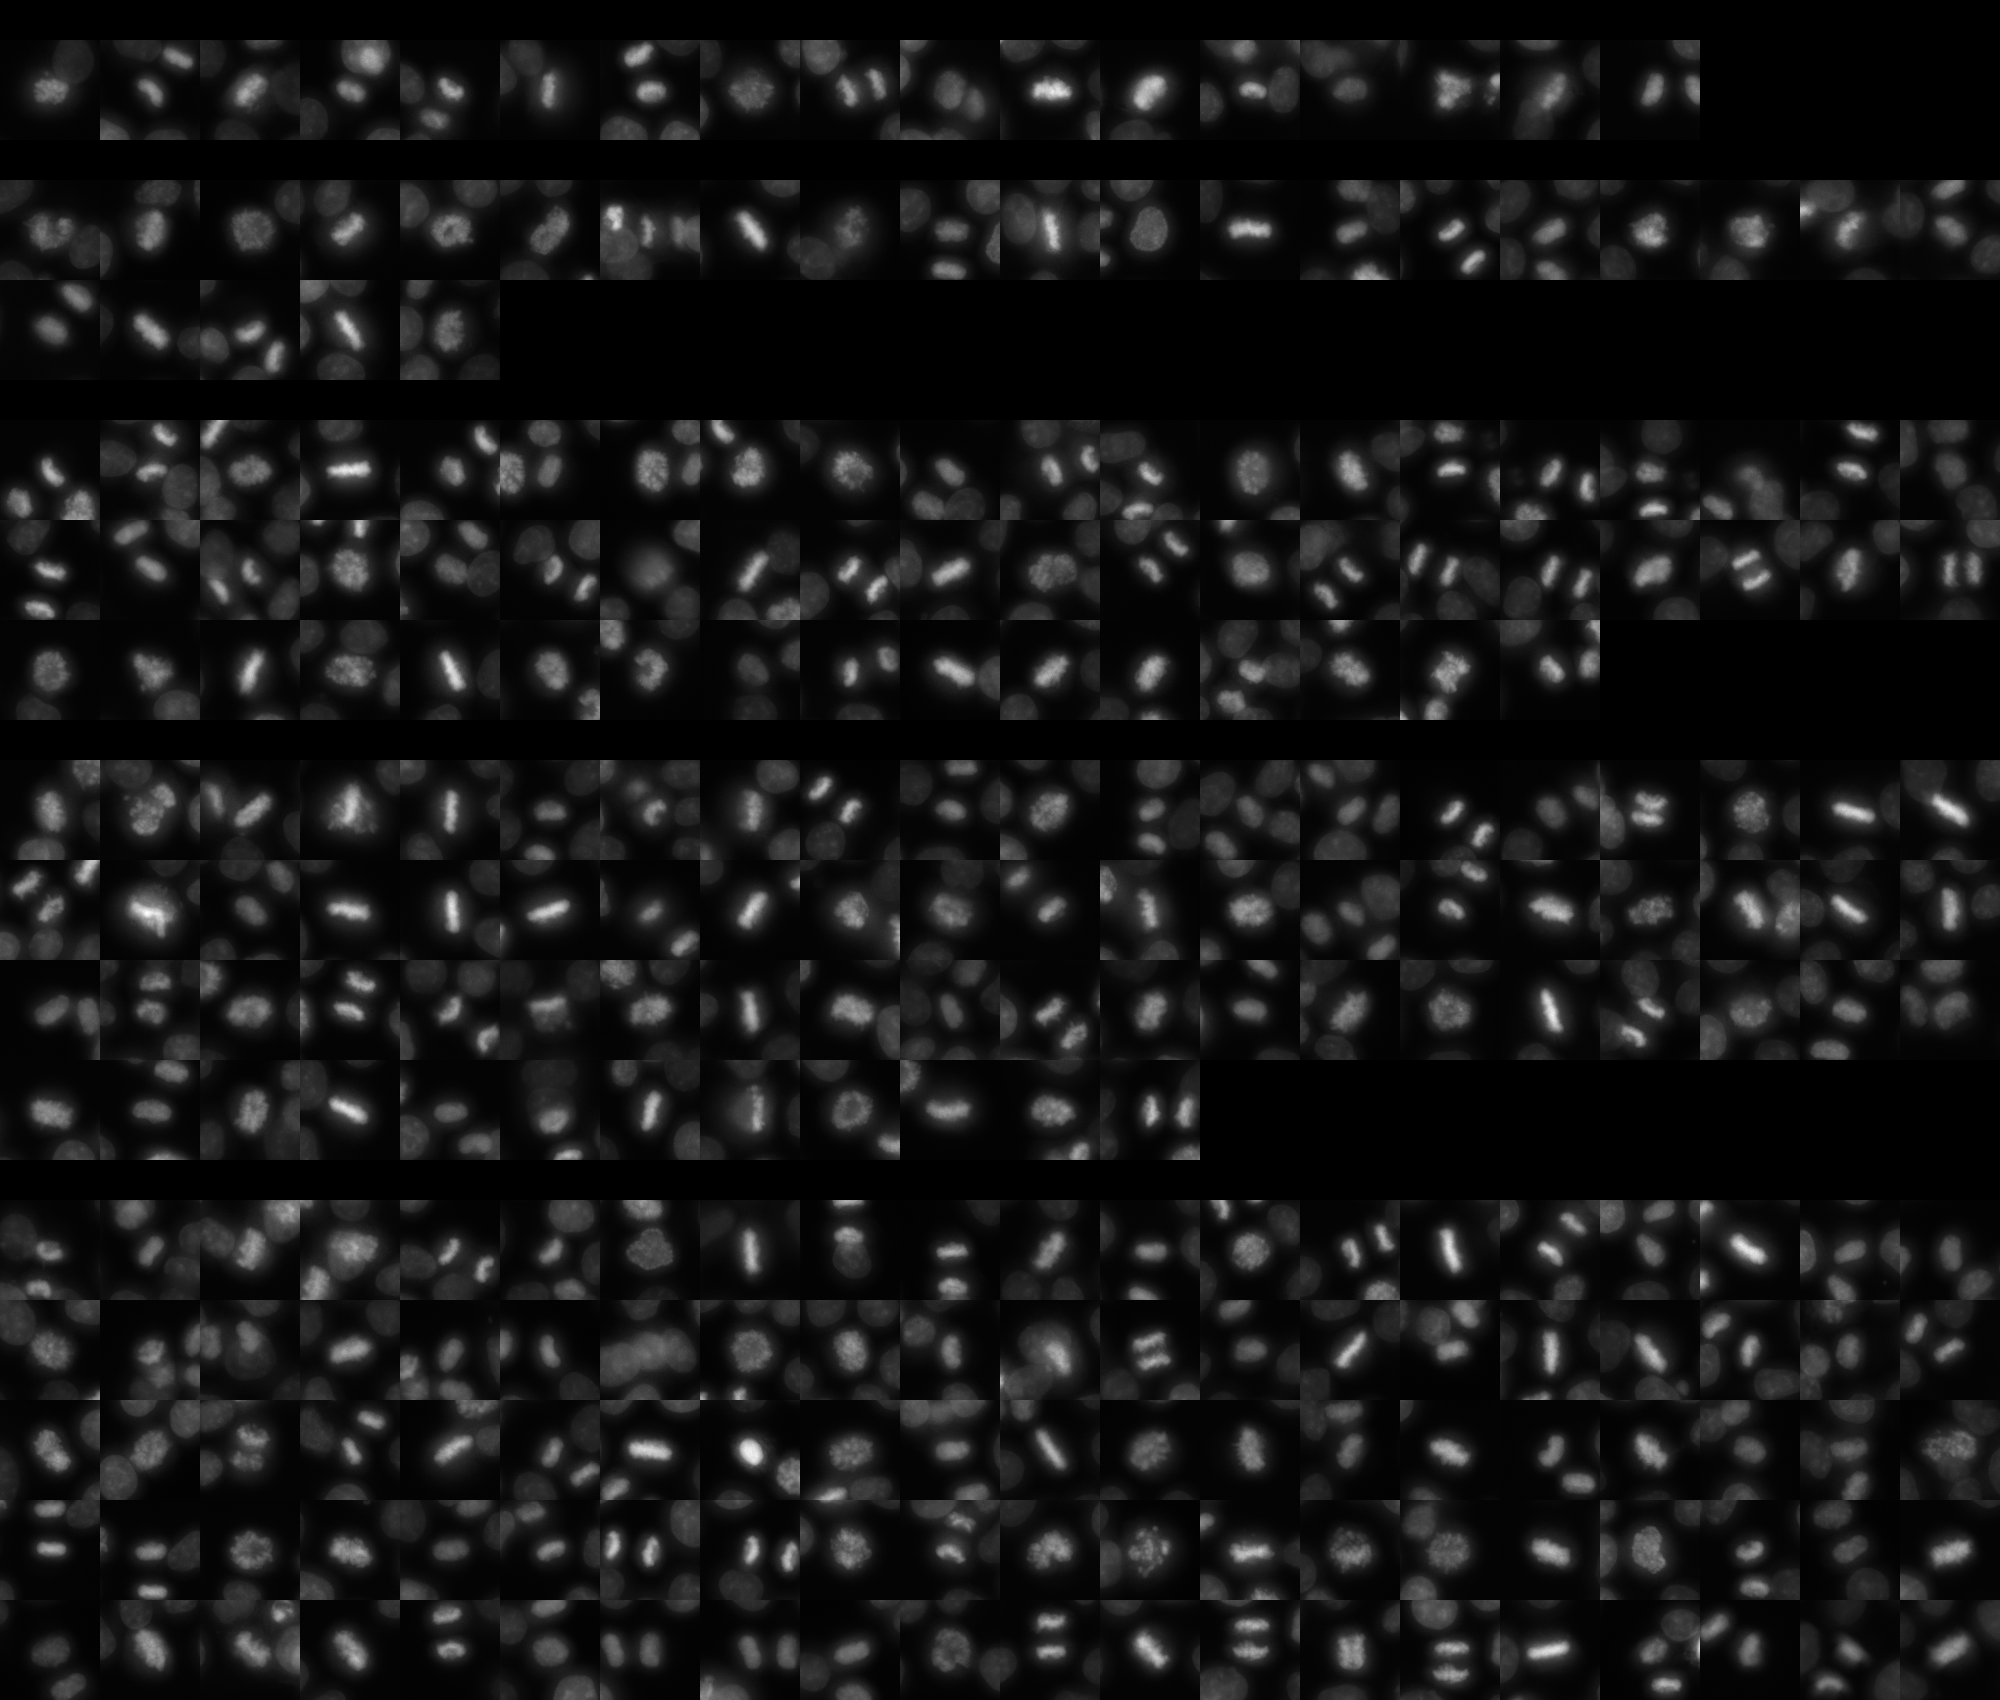
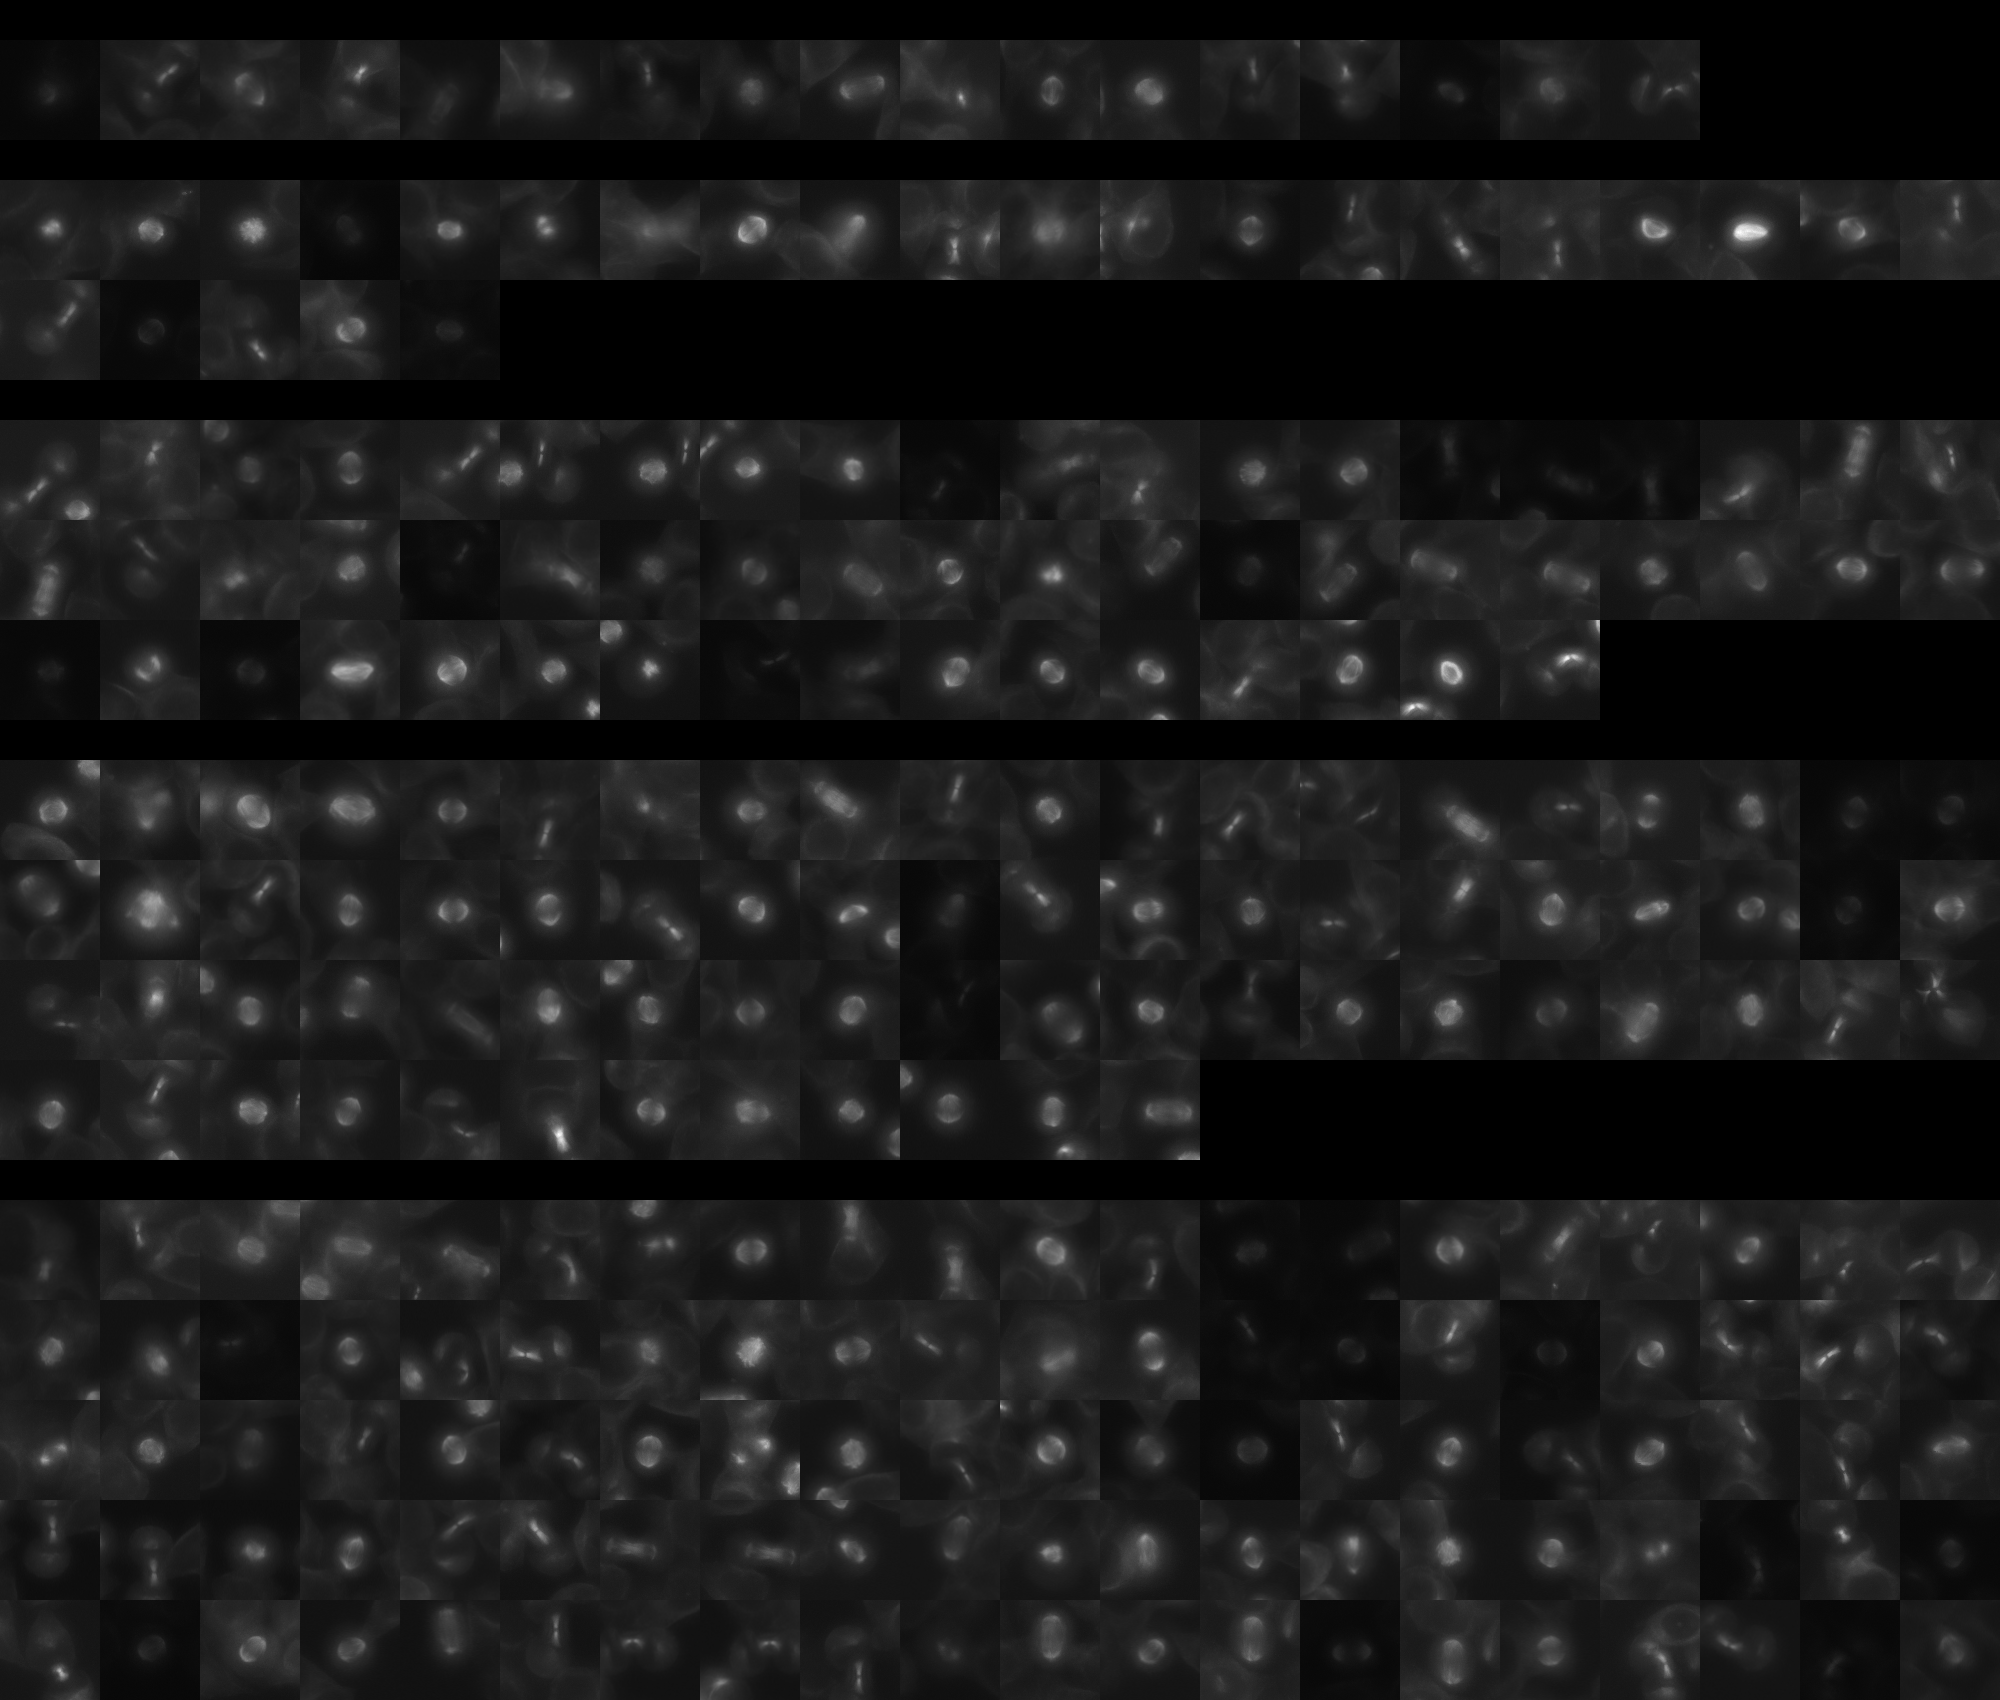
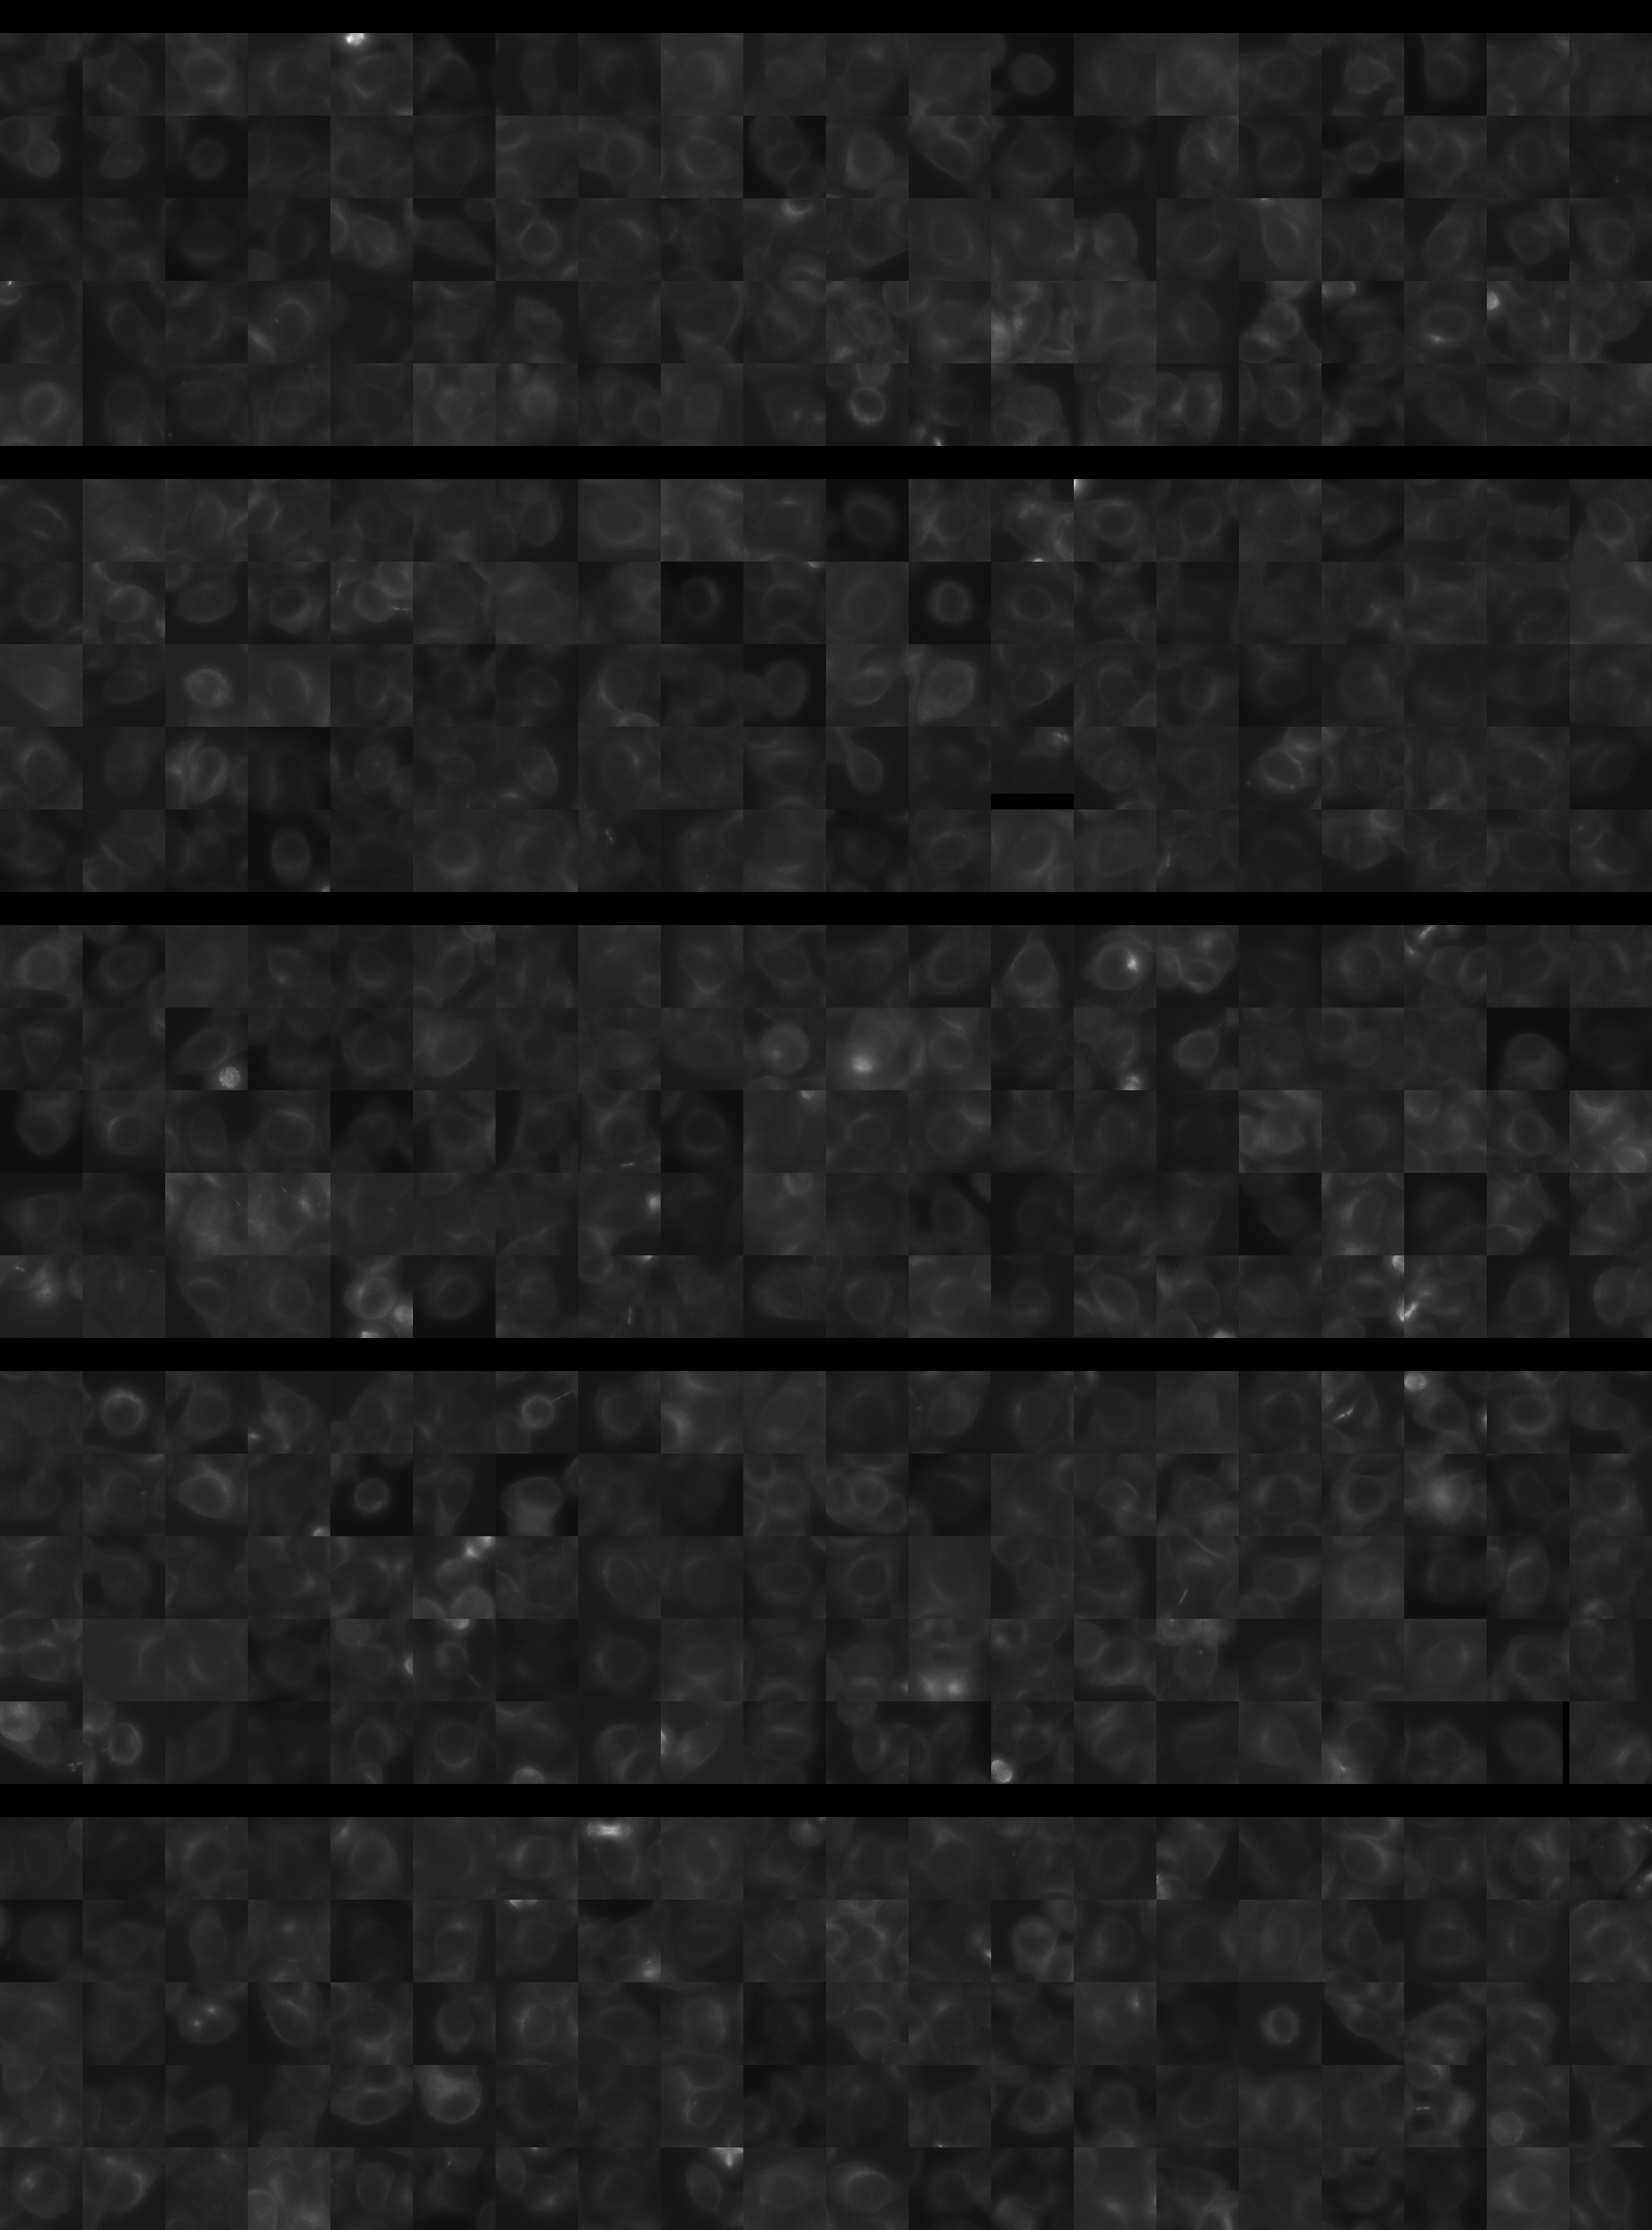
Each montage below shows randomly selected individual cell images for the same target gene separated by sgRNA, along with an example montage of cells expressing a non-targeting negative control sgRNA at the bottom. sgRNA labels in the montages correspond to the numbered sgRNA sequences in the gene info table above. The DNA (blue) and tubulin (green) channels are displayed by default, with gH2AX (grayscale) and actin (yellow) available using the check boxes. Channel brightness, contrast, and opacity are adjustable by clicking the arrow next to the channel name. When only one channel is selected, the display defaults to grayscale. Click the “Zoom” checkbox above the channel controls to enable image zooming (via scrolling) and panning (via click-and-drag).

The cell boxes displayed for this gene are square, 30.36 μm per side for the interphase montage and 30.36 μm per side for the mitotic montage.
Features

Interphase Score Rank FDR q-value
Nucleus DNA Integrated 0.008 2714 of 5322 0.963
Nucleus DNA Mean 0.017 1471 of 5322 0.699
Nucleus gH2AX Mean 0.037 3878 of 5322 0.352
Nucleus DNA - gH2AX Correlation -5.288e-02 2527 of 5322 0.078
Nucleus Shape Area -6.513e-02 4630 of 5322 0.114
Nucleus Shape Eccentricity -2.749e-02 4450 of 5322 0.602
Nucleus Shape Form Factor 0.003 564 of 5322 0.844
Nucleus Shape Solidity -2.398e-02 1489 of 5322 0.532
Cell DNA Mass Displacement 0.012 3645 of 5322 0.900
Cell Tubulin Mean 0.012 2292 of 5322 0.811
Cell Tubulin Mass Displacement 0.003 2825 of 5322 0.977
Cell Actin Mean 0.052 1528 of 5322 0.309
Cell Tubulin - Actin Correlation 0.028 2275 of 5322 0.568
Cell DNA - Tubulin Correlation 0.067 1491 of 5322 0.074
Cell Shape Area -7.865e-02 4673 of 5322 0.055
Cell Shape Eccentricity 0.018 2261 of 5322 0.843
Mitotic Score Rank FDR q-value
Nucleus DNA Integrated -1.010e-01 4794 of 5322 0.962
Nucleus DNA Mean -5.853e-02 3825 of 5322 1.000
Nucleus DNA Mass Displacement -5.516e-03 3606 of 5322 0.999
Nucleus DNA Mean Frac 3 0.119 1342 of 5322 1.000
Nucleus gH2AX Mean 8.777e-04 2935 of 5322 1.000
Nucleus gH2AX Mean Frac 0 -1.067e-01 3897 of 5322 1.000
Nucleus Tubulin Mean Frac 0 0.199 863 of 5322 0.999
Nucleus Tubulin Mean Edge -3.420e-03 3216 of 5322 1.000
Nucleus Tubulin Std Edge -1.208e-01 4101 of 5322 0.999
Nucleus Shape Area 0.073 3022 of 5322 0.990
Nucleus Shape Eccentricity -6.643e-03 2219 of 5322 1.000
Nucleus Shape Form Factor 0.082 519 of 5322 0.998
Cell Tubulin Mean 0.193 1038 of 5322 0.997
Cell Tubulin Mean Frac 3 0.028 1374 of 5322 0.999
Cell Actin Mean 0.119 1628 of 5322 0.997
Cell Shape Area -8.414e-03 4007 of 5322 0.998
( Reset Zoom )
Brightness
Contrast
Opacity
Brightness
Contrast
Opacity
Brightness
Contrast
Opacity
Brightness
Contrast
Opacity
Brightness
Contrast
Opacity

( Reset Zoom )
Brightness
Contrast
Opacity
Brightness
Contrast
Opacity
Brightness
Contrast
Opacity
Brightness
Contrast
Opacity
Brightness
Contrast
Opacity

MIT Central Accessability