PELO

Due to sgRNA sequence design constraints two or more of the sgRNAs used to target this gene have multiple genomic target sites, potentially impacting the observed phenotype through increased DNA damage.
Gene symbol: PELO
Gene: 53918
Uniprot Function: Cotranslational quality control factor involved in the No-Go Decay (NGD) pathway (PubMed:21448132, PubMed:29861391). In the presence of ABCE1 and HBS1L, is required for 48S complex formation from 80S ribosomes and dissociation of vacant 80S ribosomes (PubMed:21448132). Together with HBS1L and in presence of ABCE1, recognizes stalled ribosomes and promotes dissociation of elongation complexes assembled on non-stop mRNAs; this triggers endonucleolytic cleavage of the mRNA, a mechanism to release non-functional ribosomes and to degrade damaged mRNAs as part of the No-Go Decay (NGD) pathway (PubMed:21448132). As part of the PINK1-regulated signaling, upon mitochondrial damage is recruited to the ribosome/mRNA-ribonucleoprotein complex associated to mitochondrial outer membrane thereby enabling the recruitment of autophagy receptors and induction of mitophagy (PubMed:29861391).
Mitotic Index 0.027000000000000003
Interphase Cluster: #112 (22 genes)
Mitotic Cluster: #146 (19 genes)
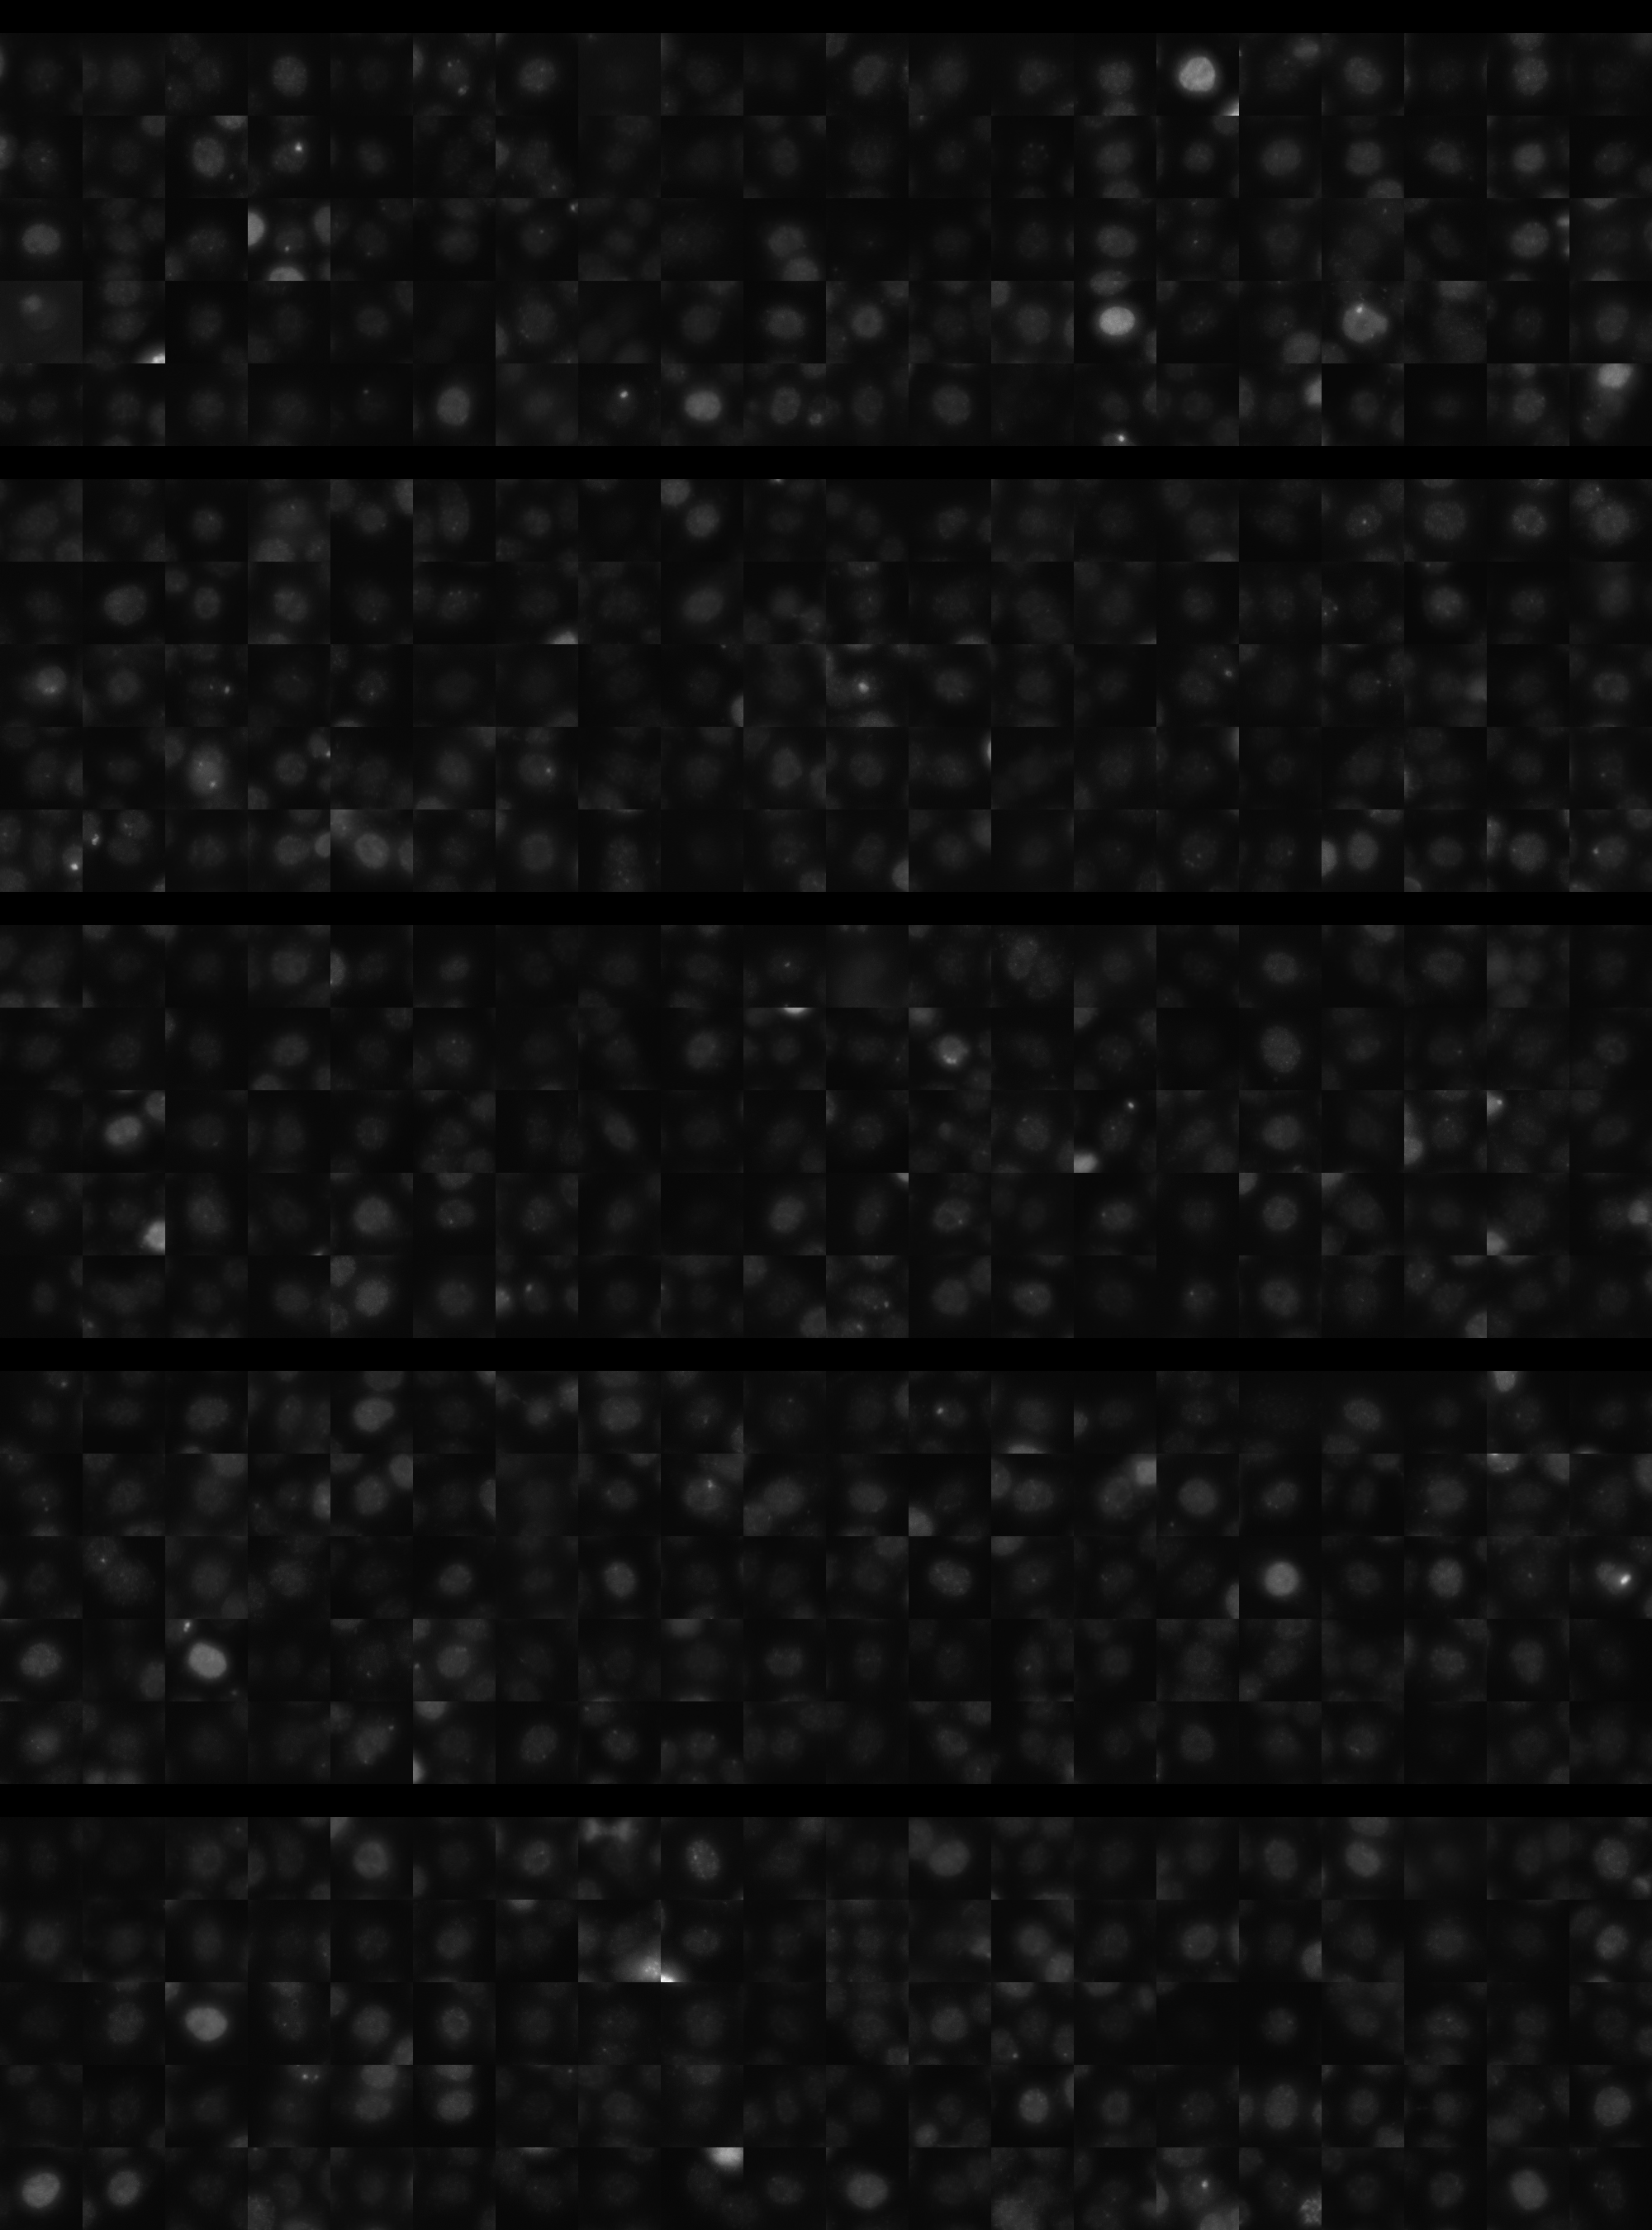
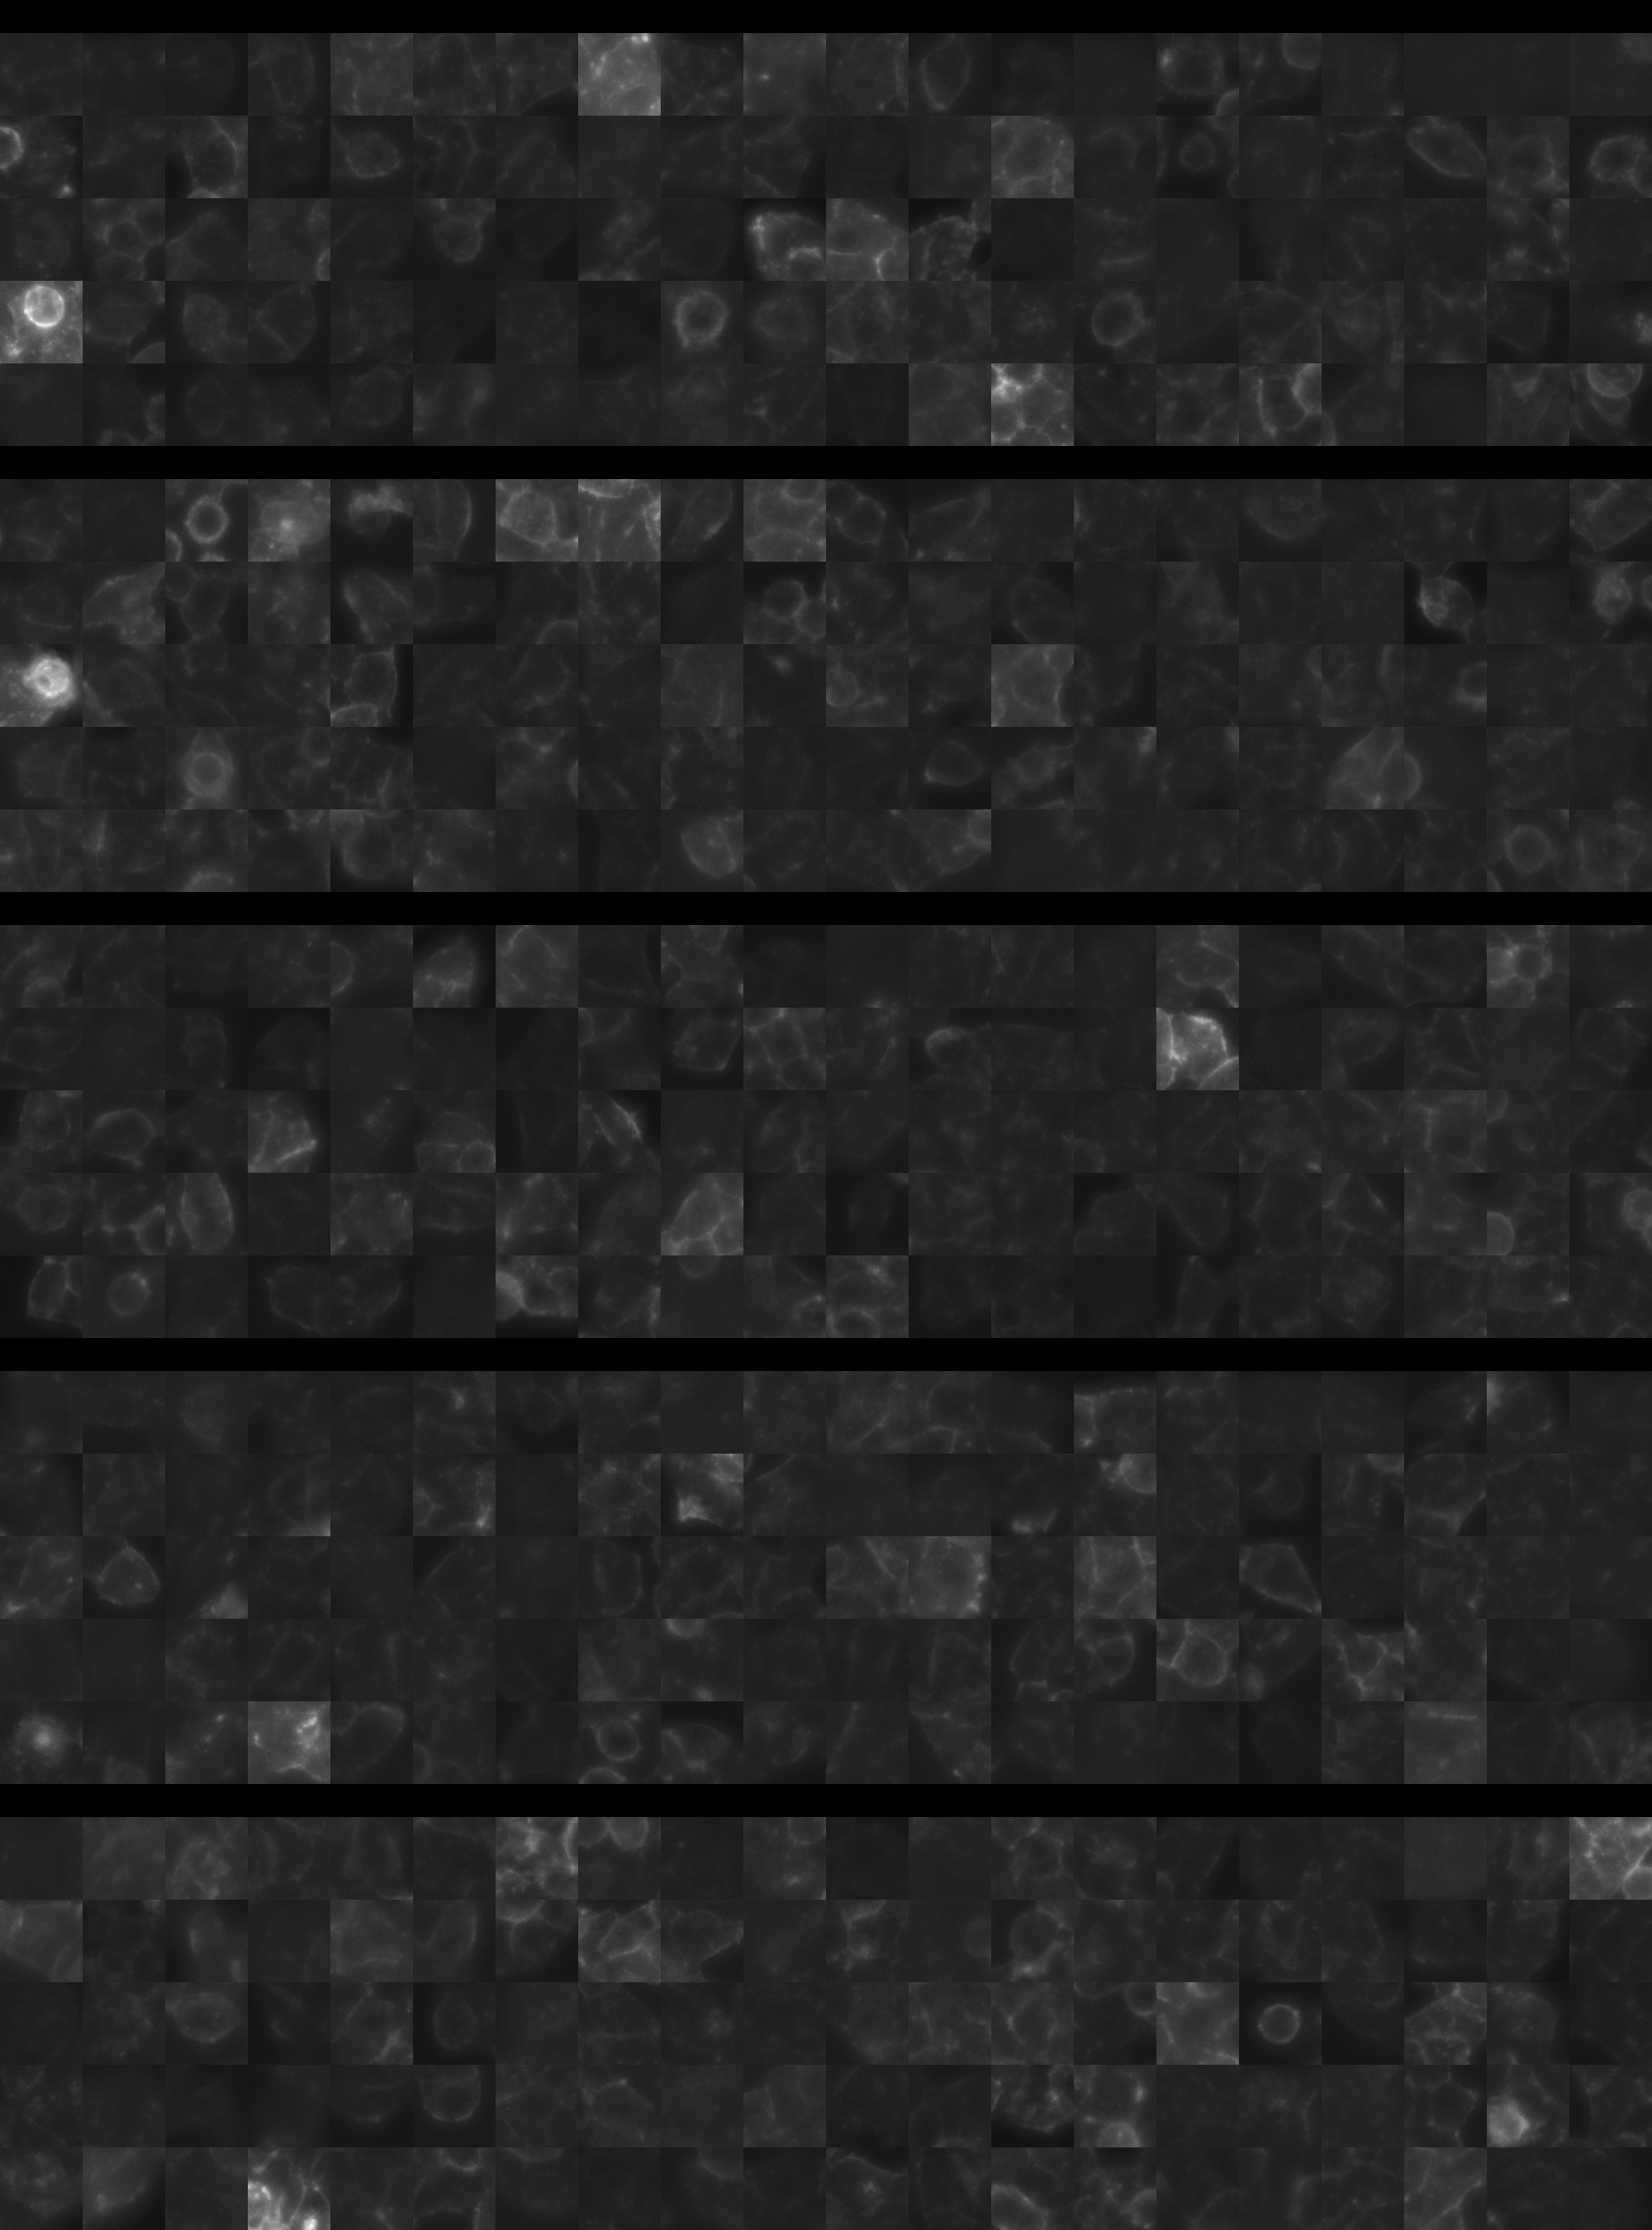
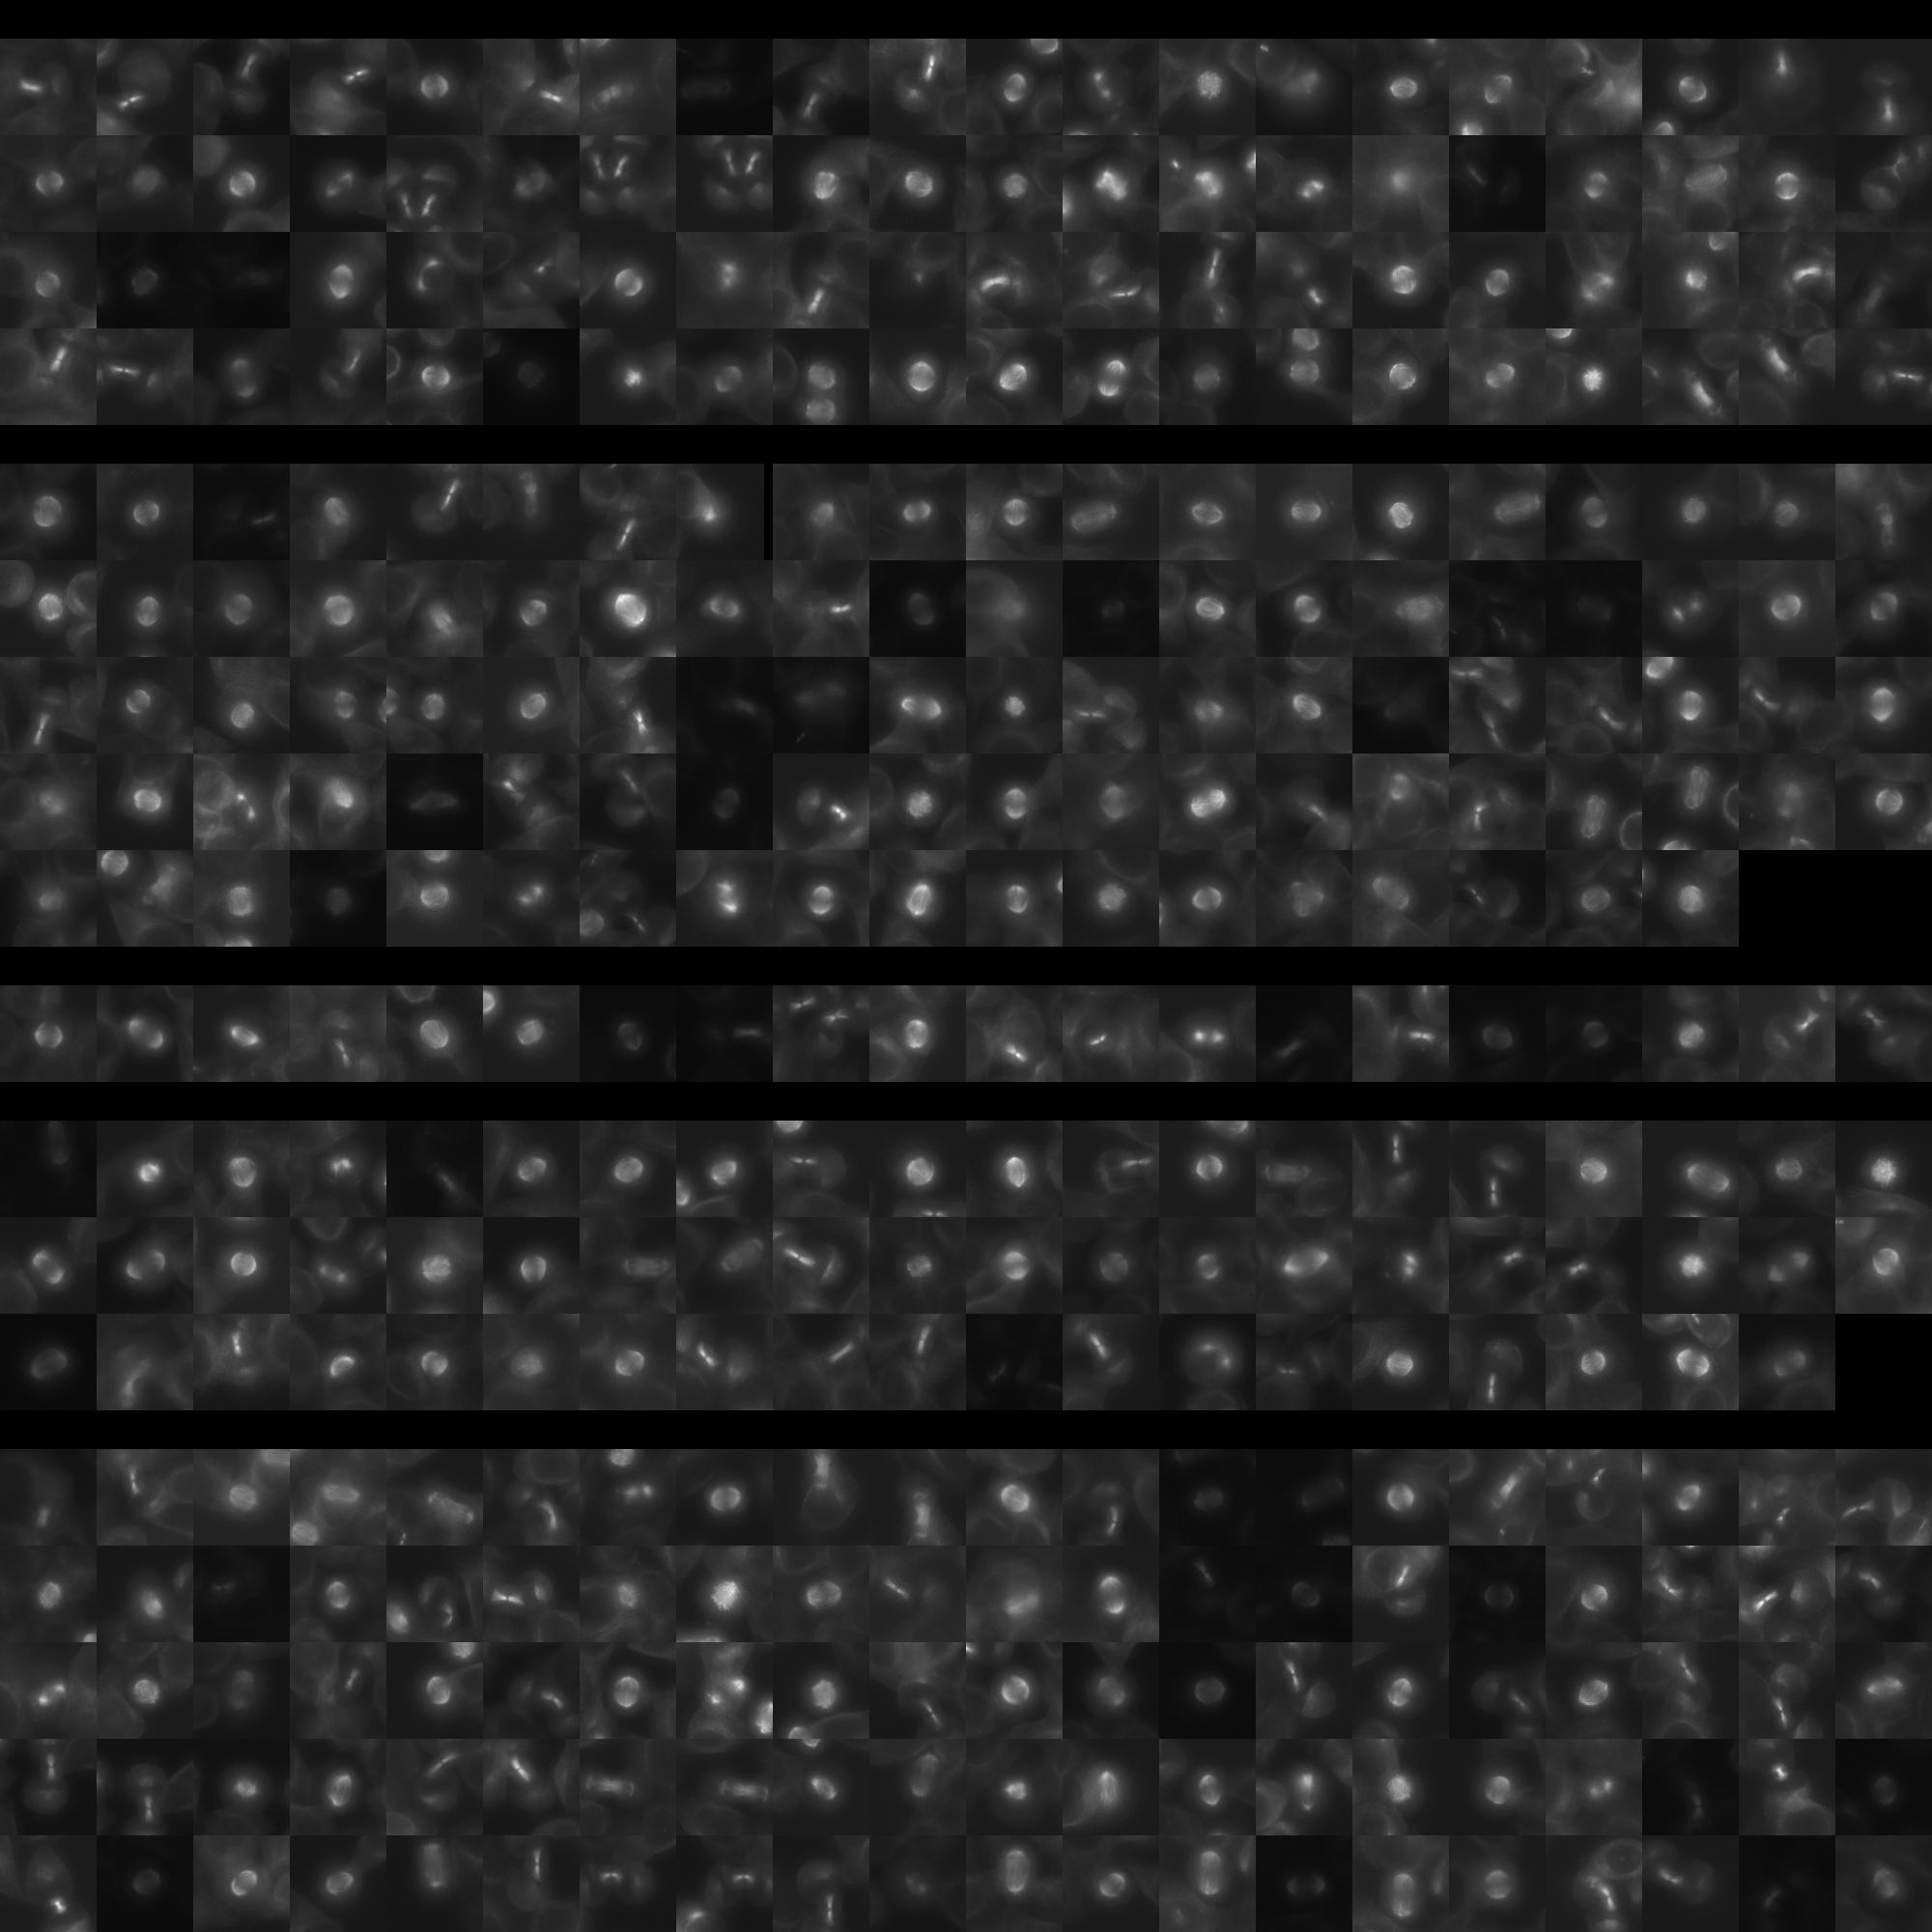
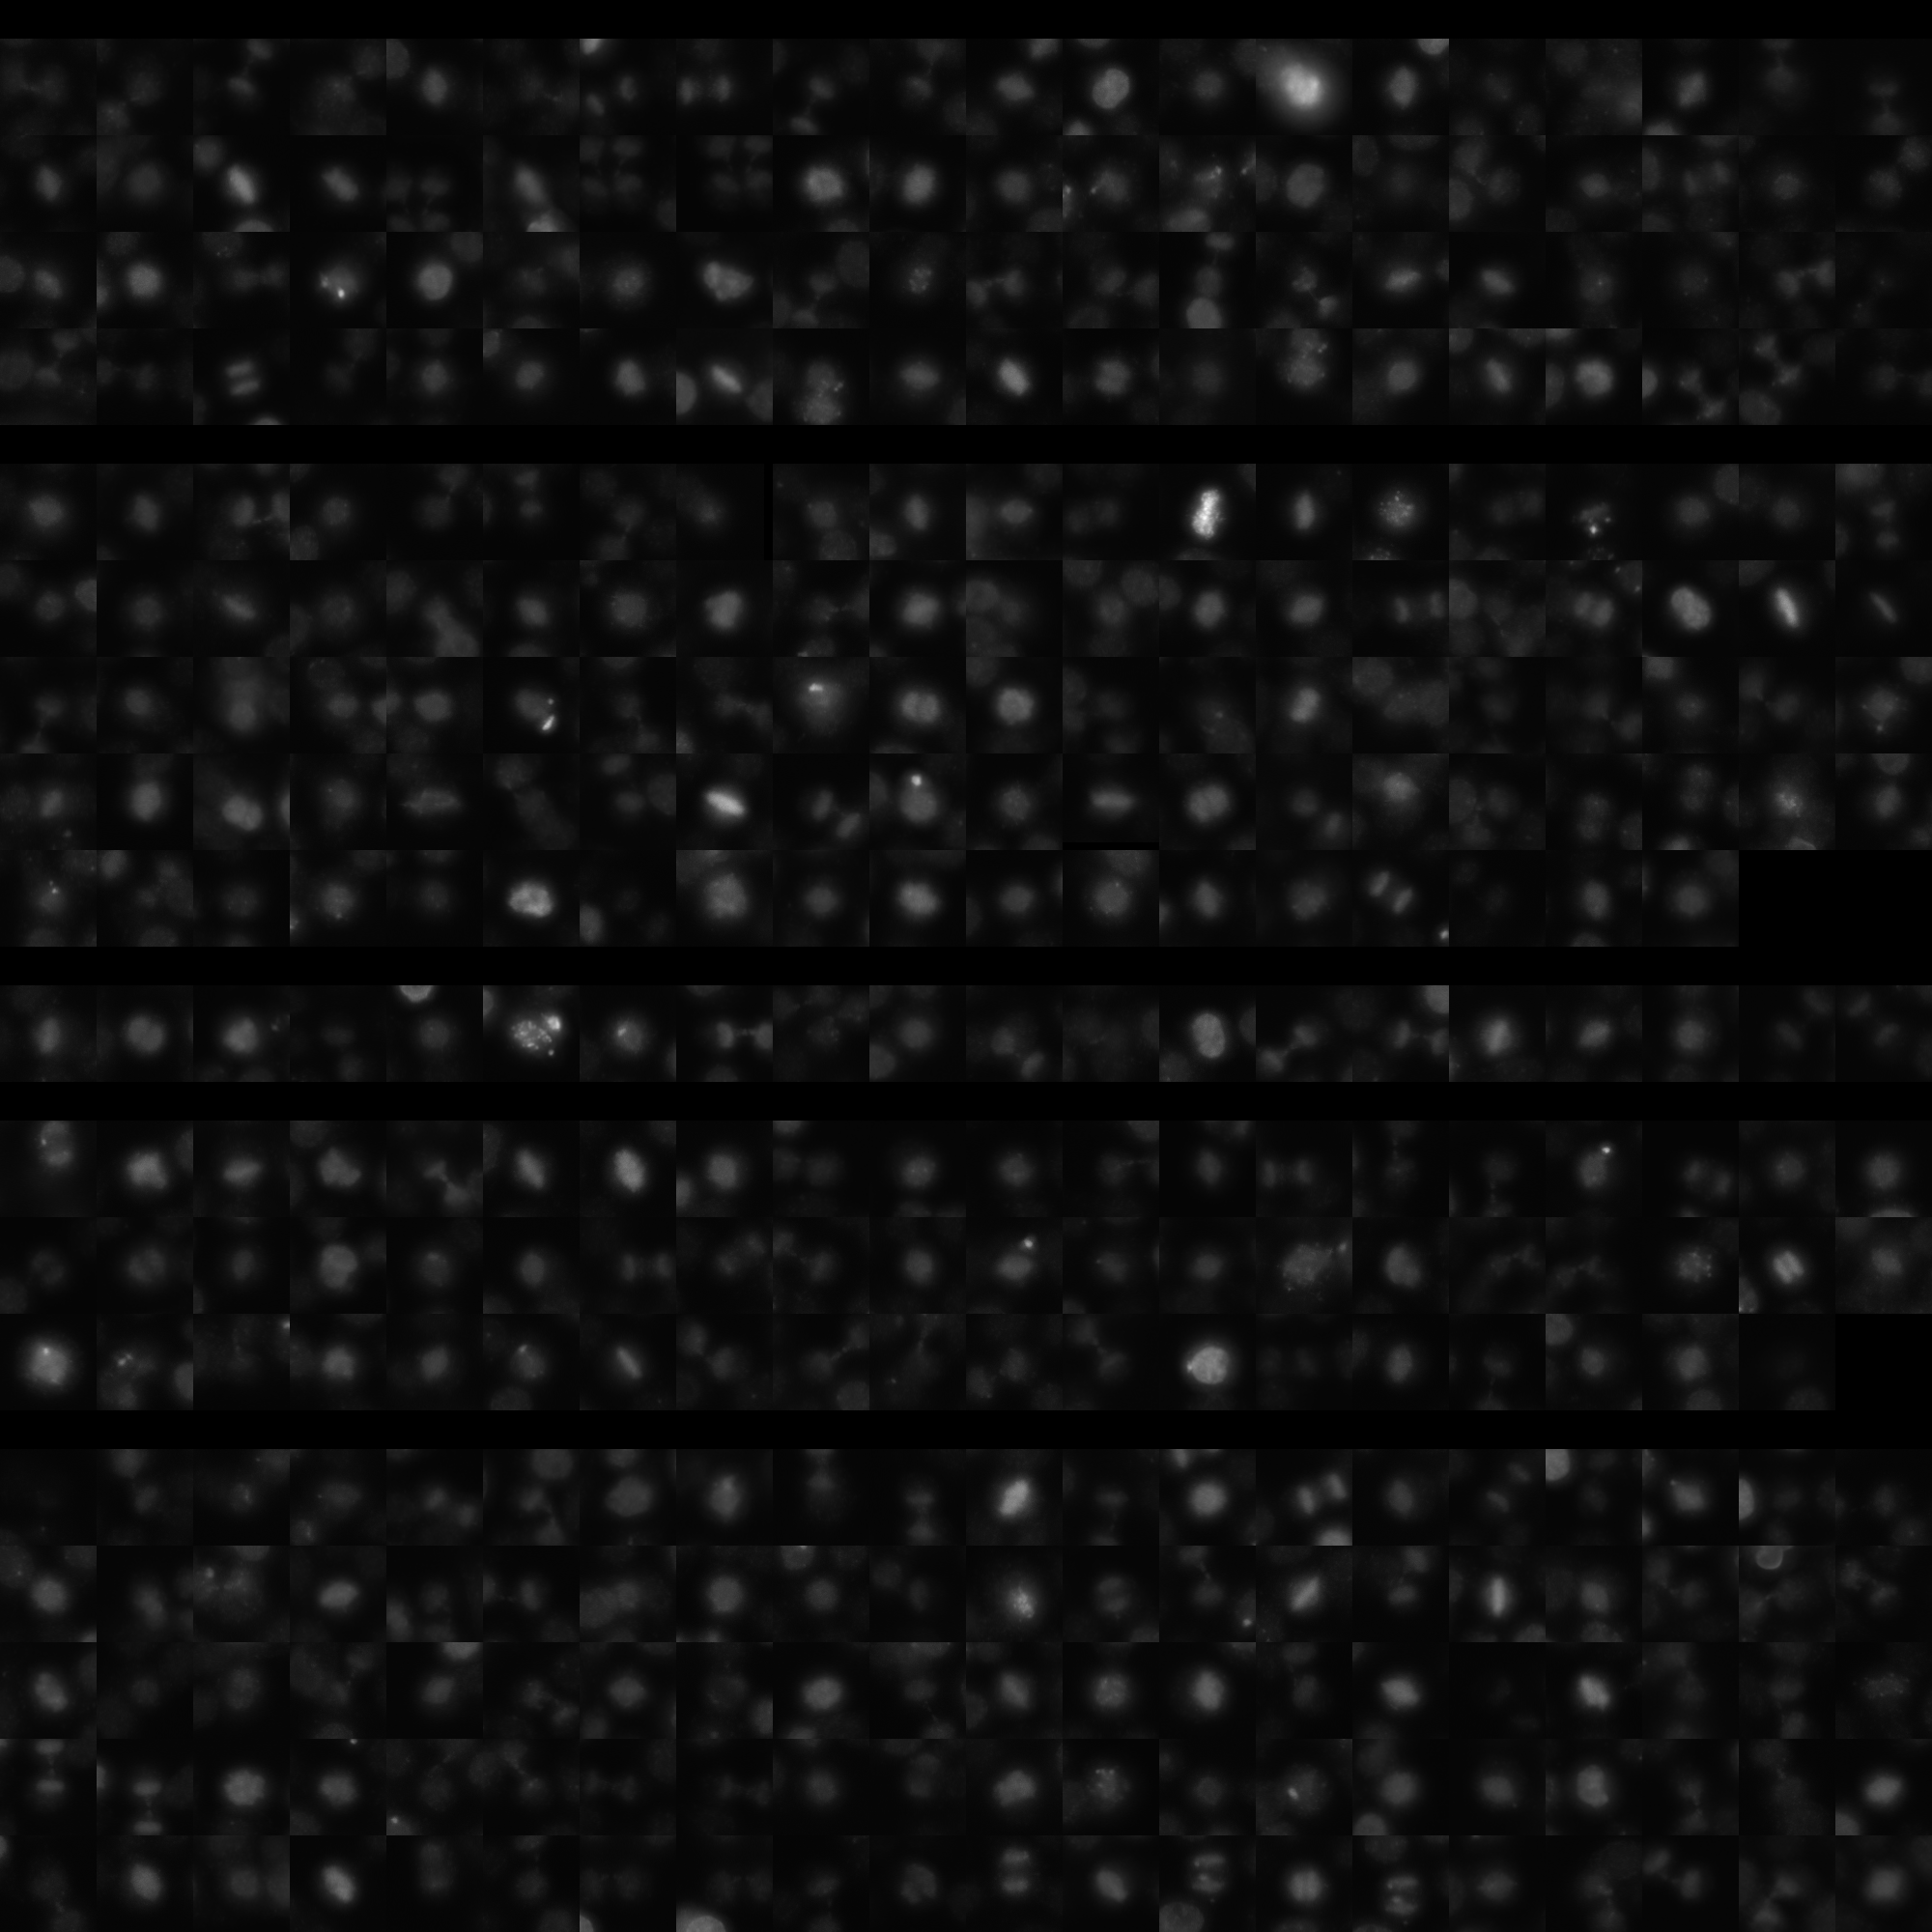
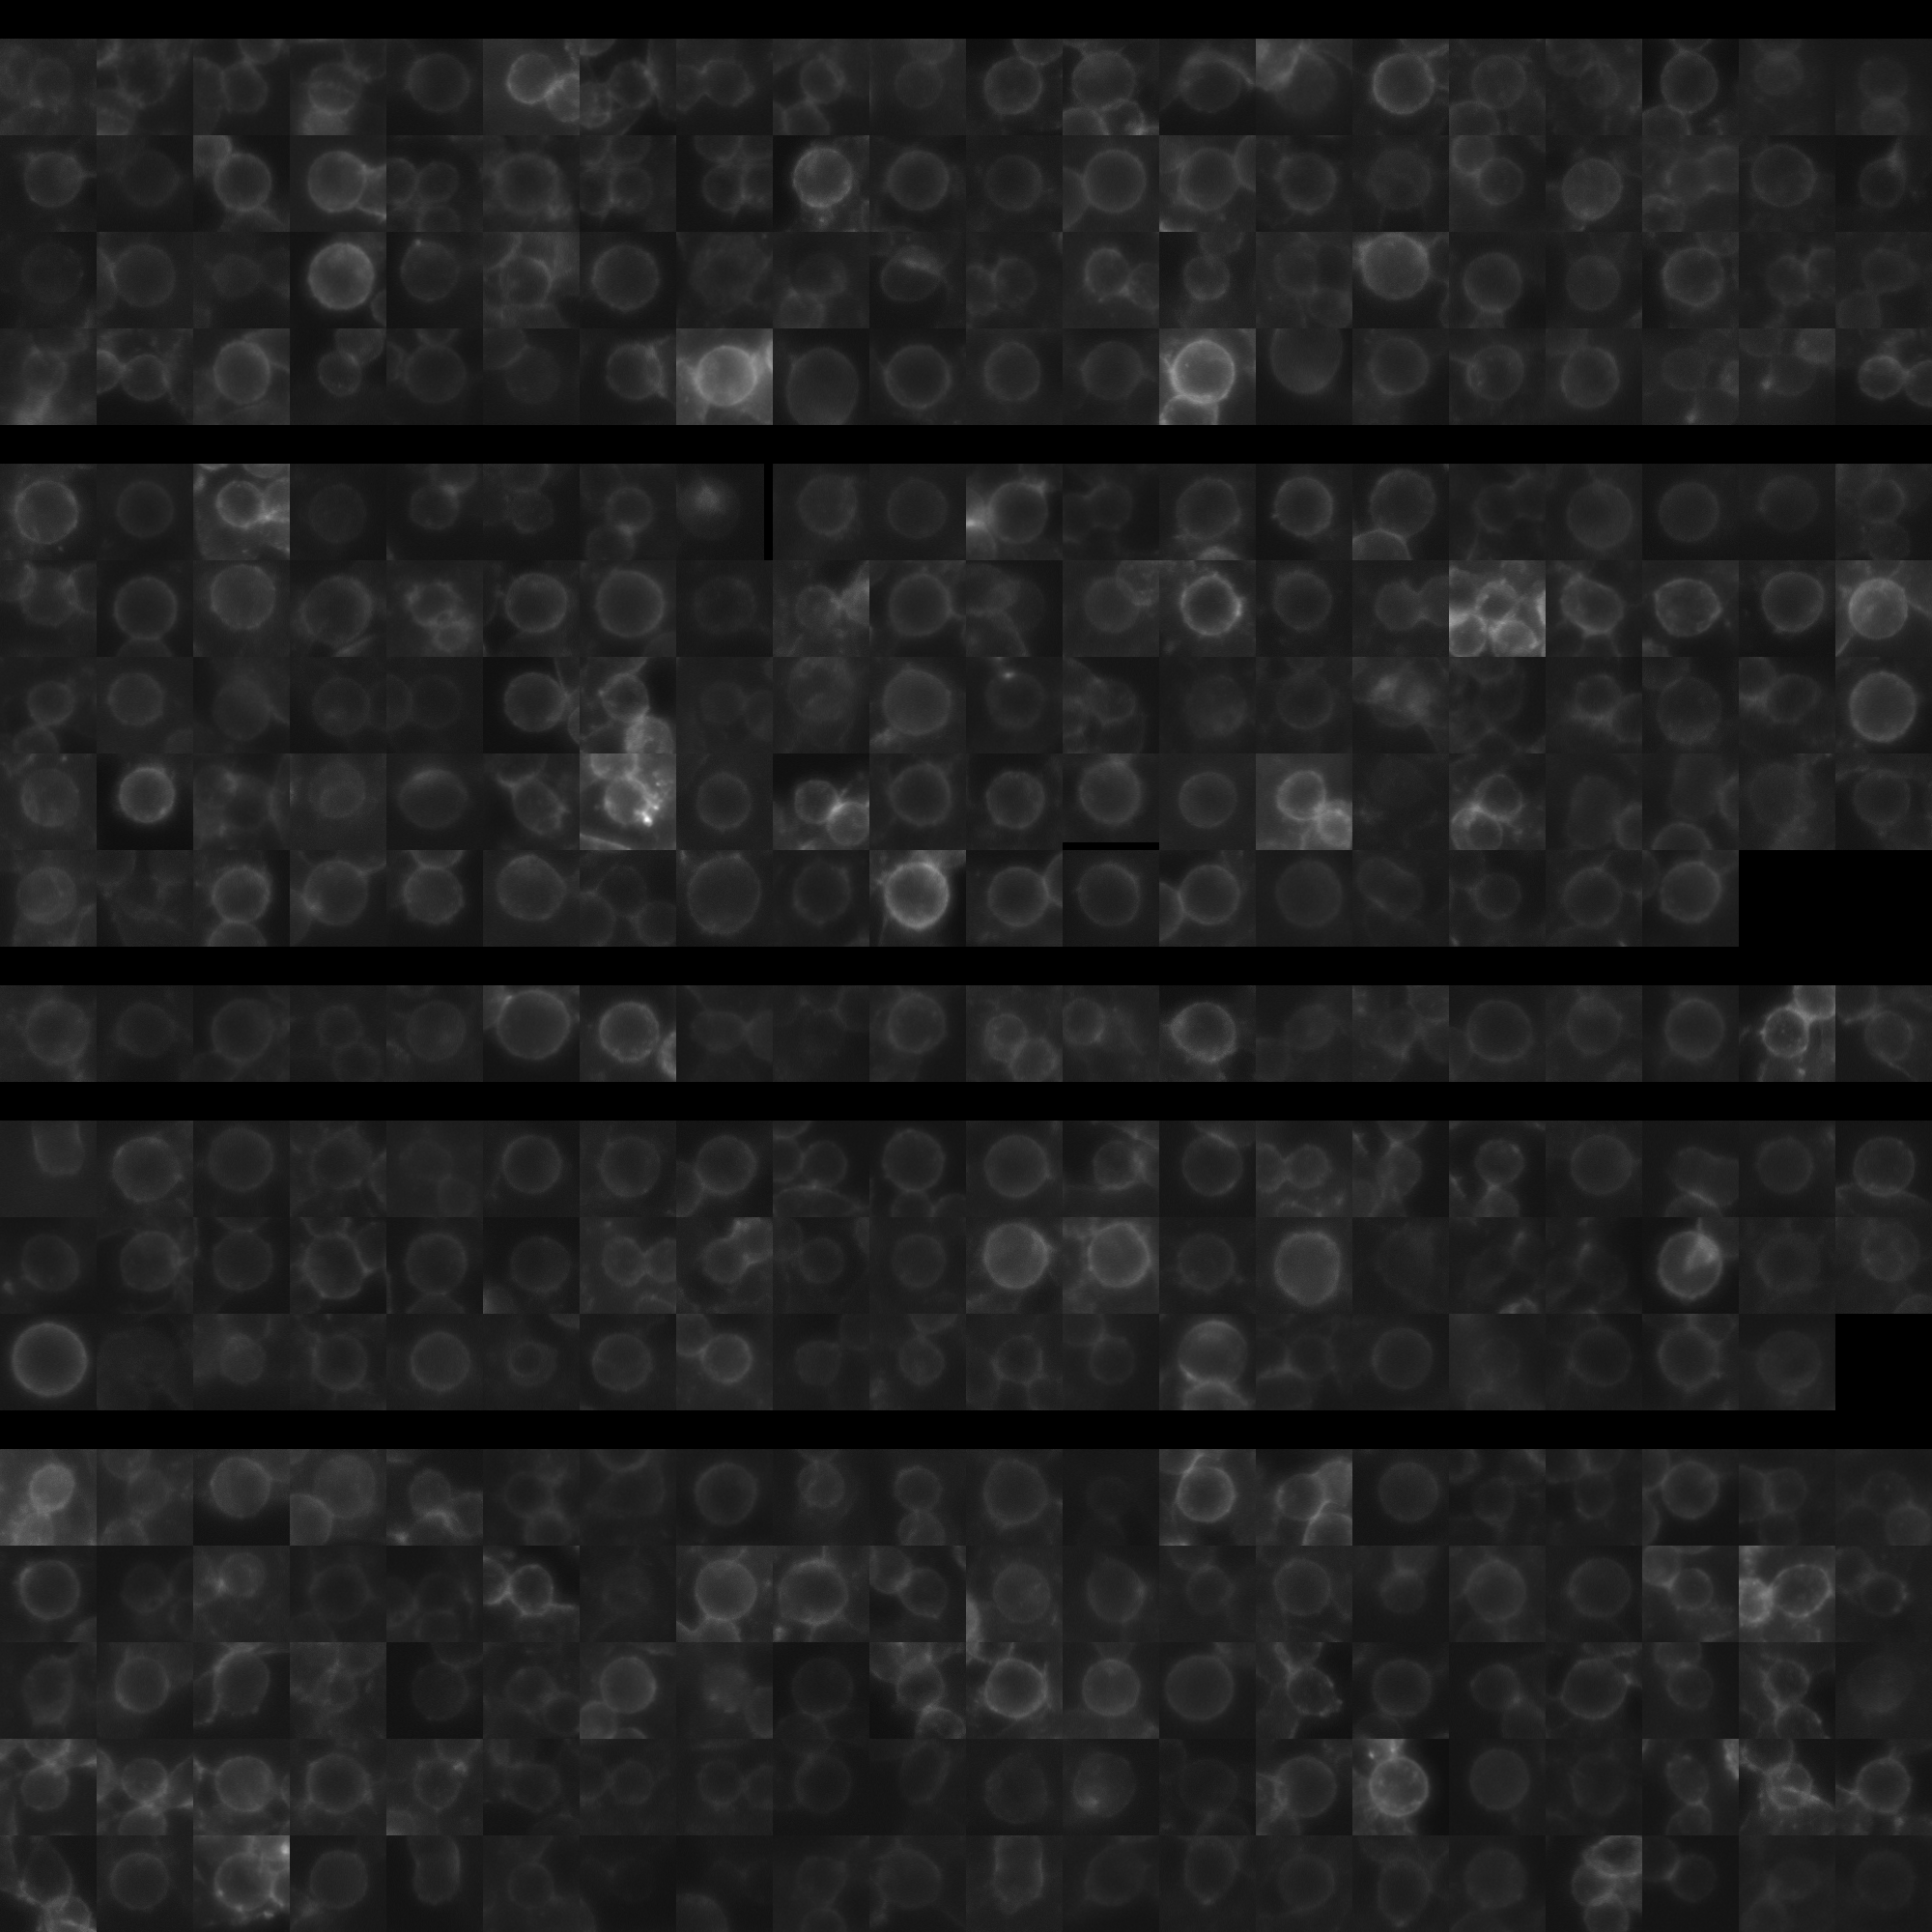
sgRNA 1: ACTGCTCCCTCACAAATCCT (interphase cells: 2685, mitotic cells: 80)
sgRNA 2: AGAATGAGTATGTCAAGATG (interphase cells: 3235, mitotic cells: 98)
sgRNA 3: GGCTTGAGAGTCGAAGTCGA (interphase cells: 1162, mitotic cells: 20)
sgRNA 4: TGACTAAGCAGATATGGGCG (interphase cells: 2162, mitotic cells: 59)

Interphase Cluster

Mitotic Cluster

Overview

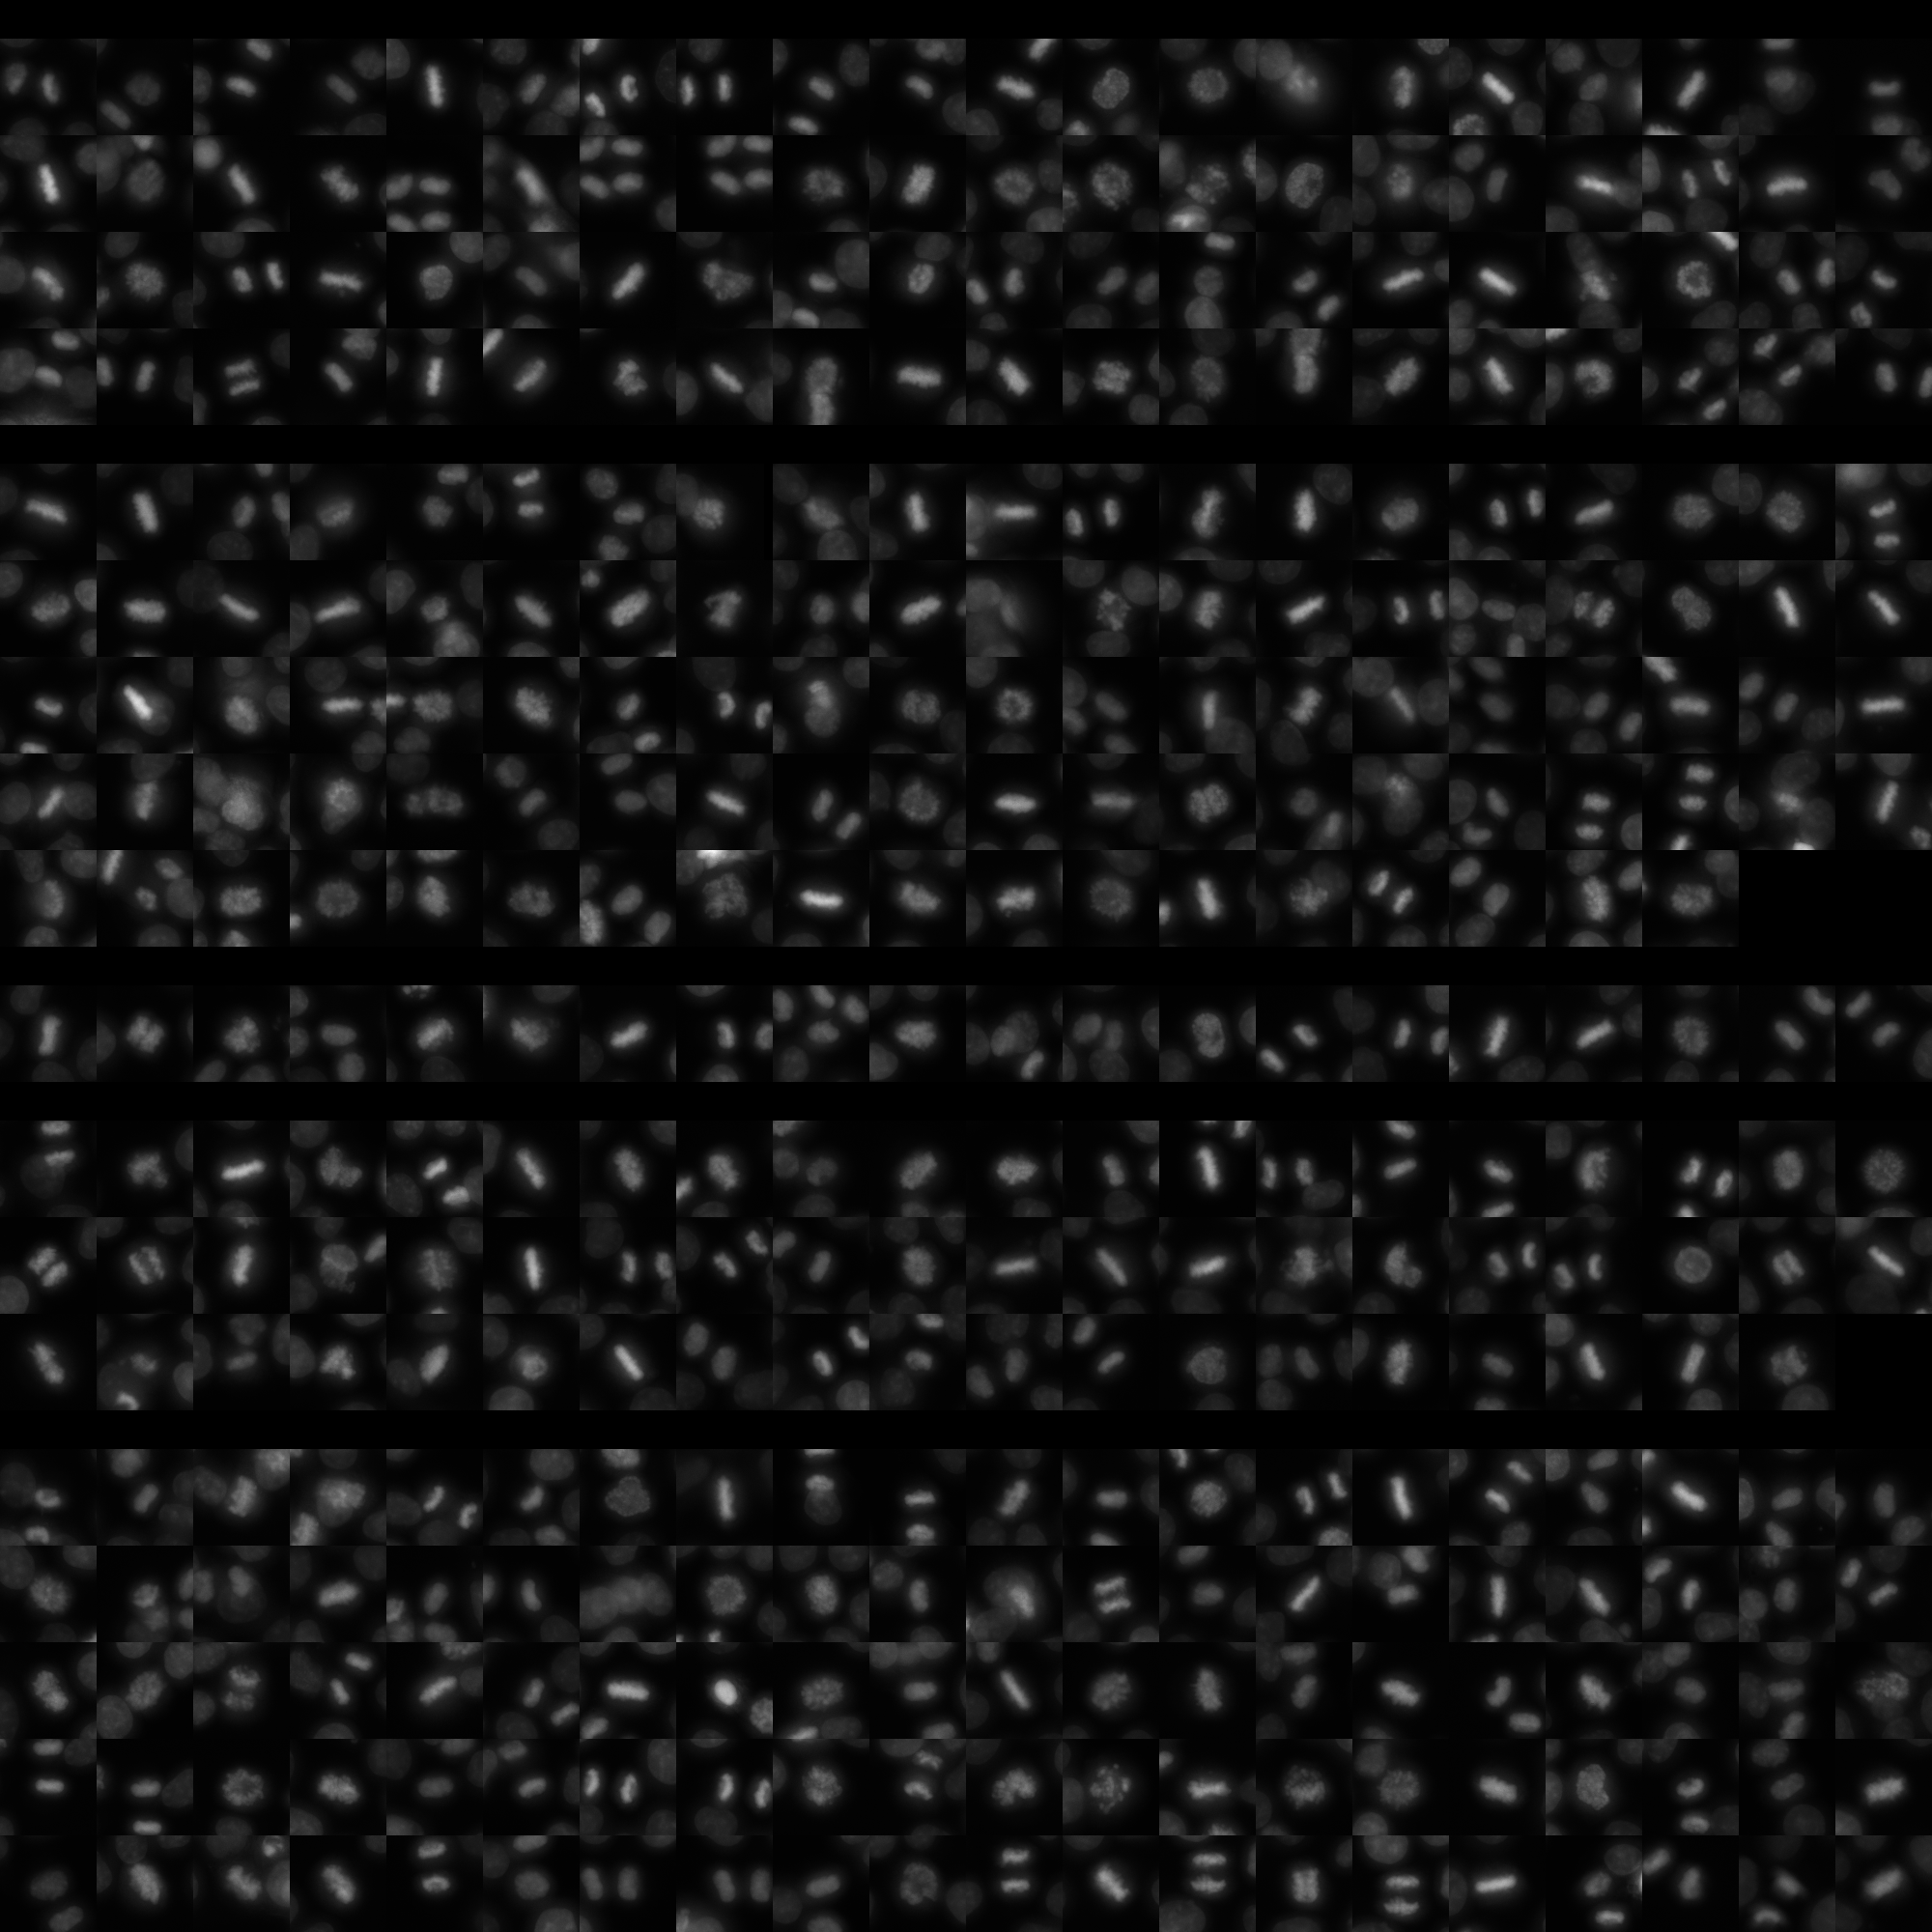
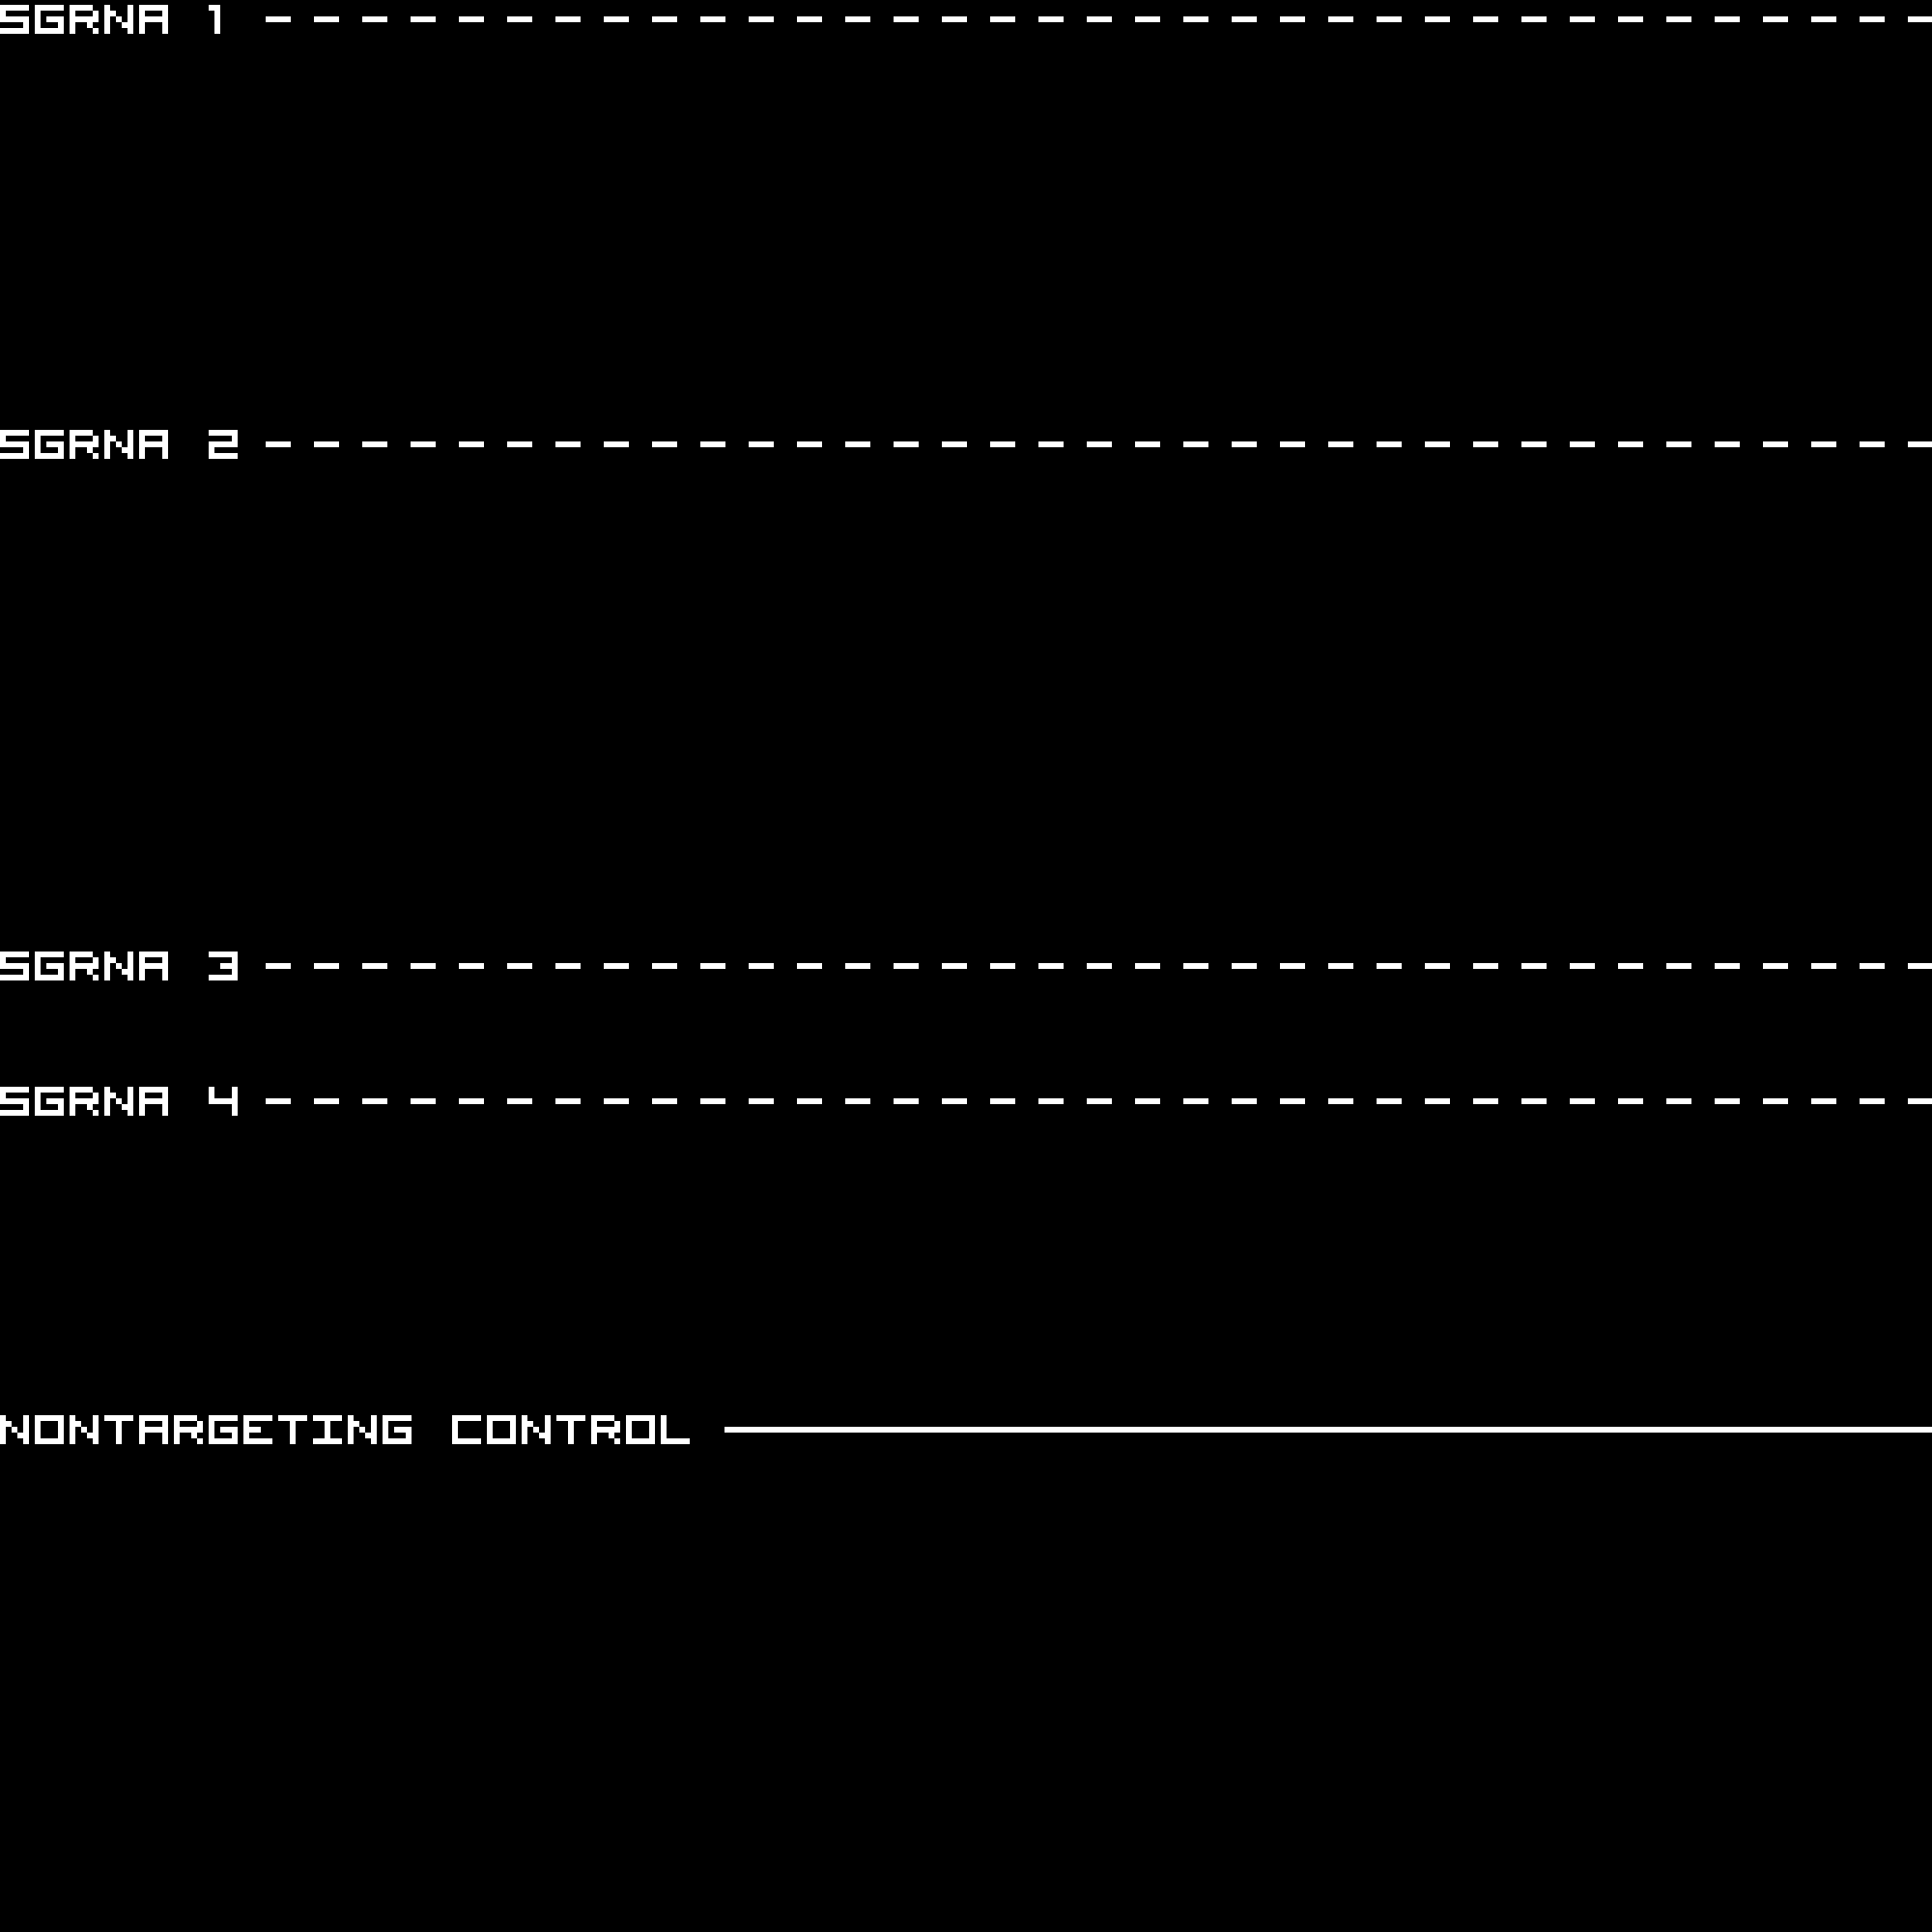
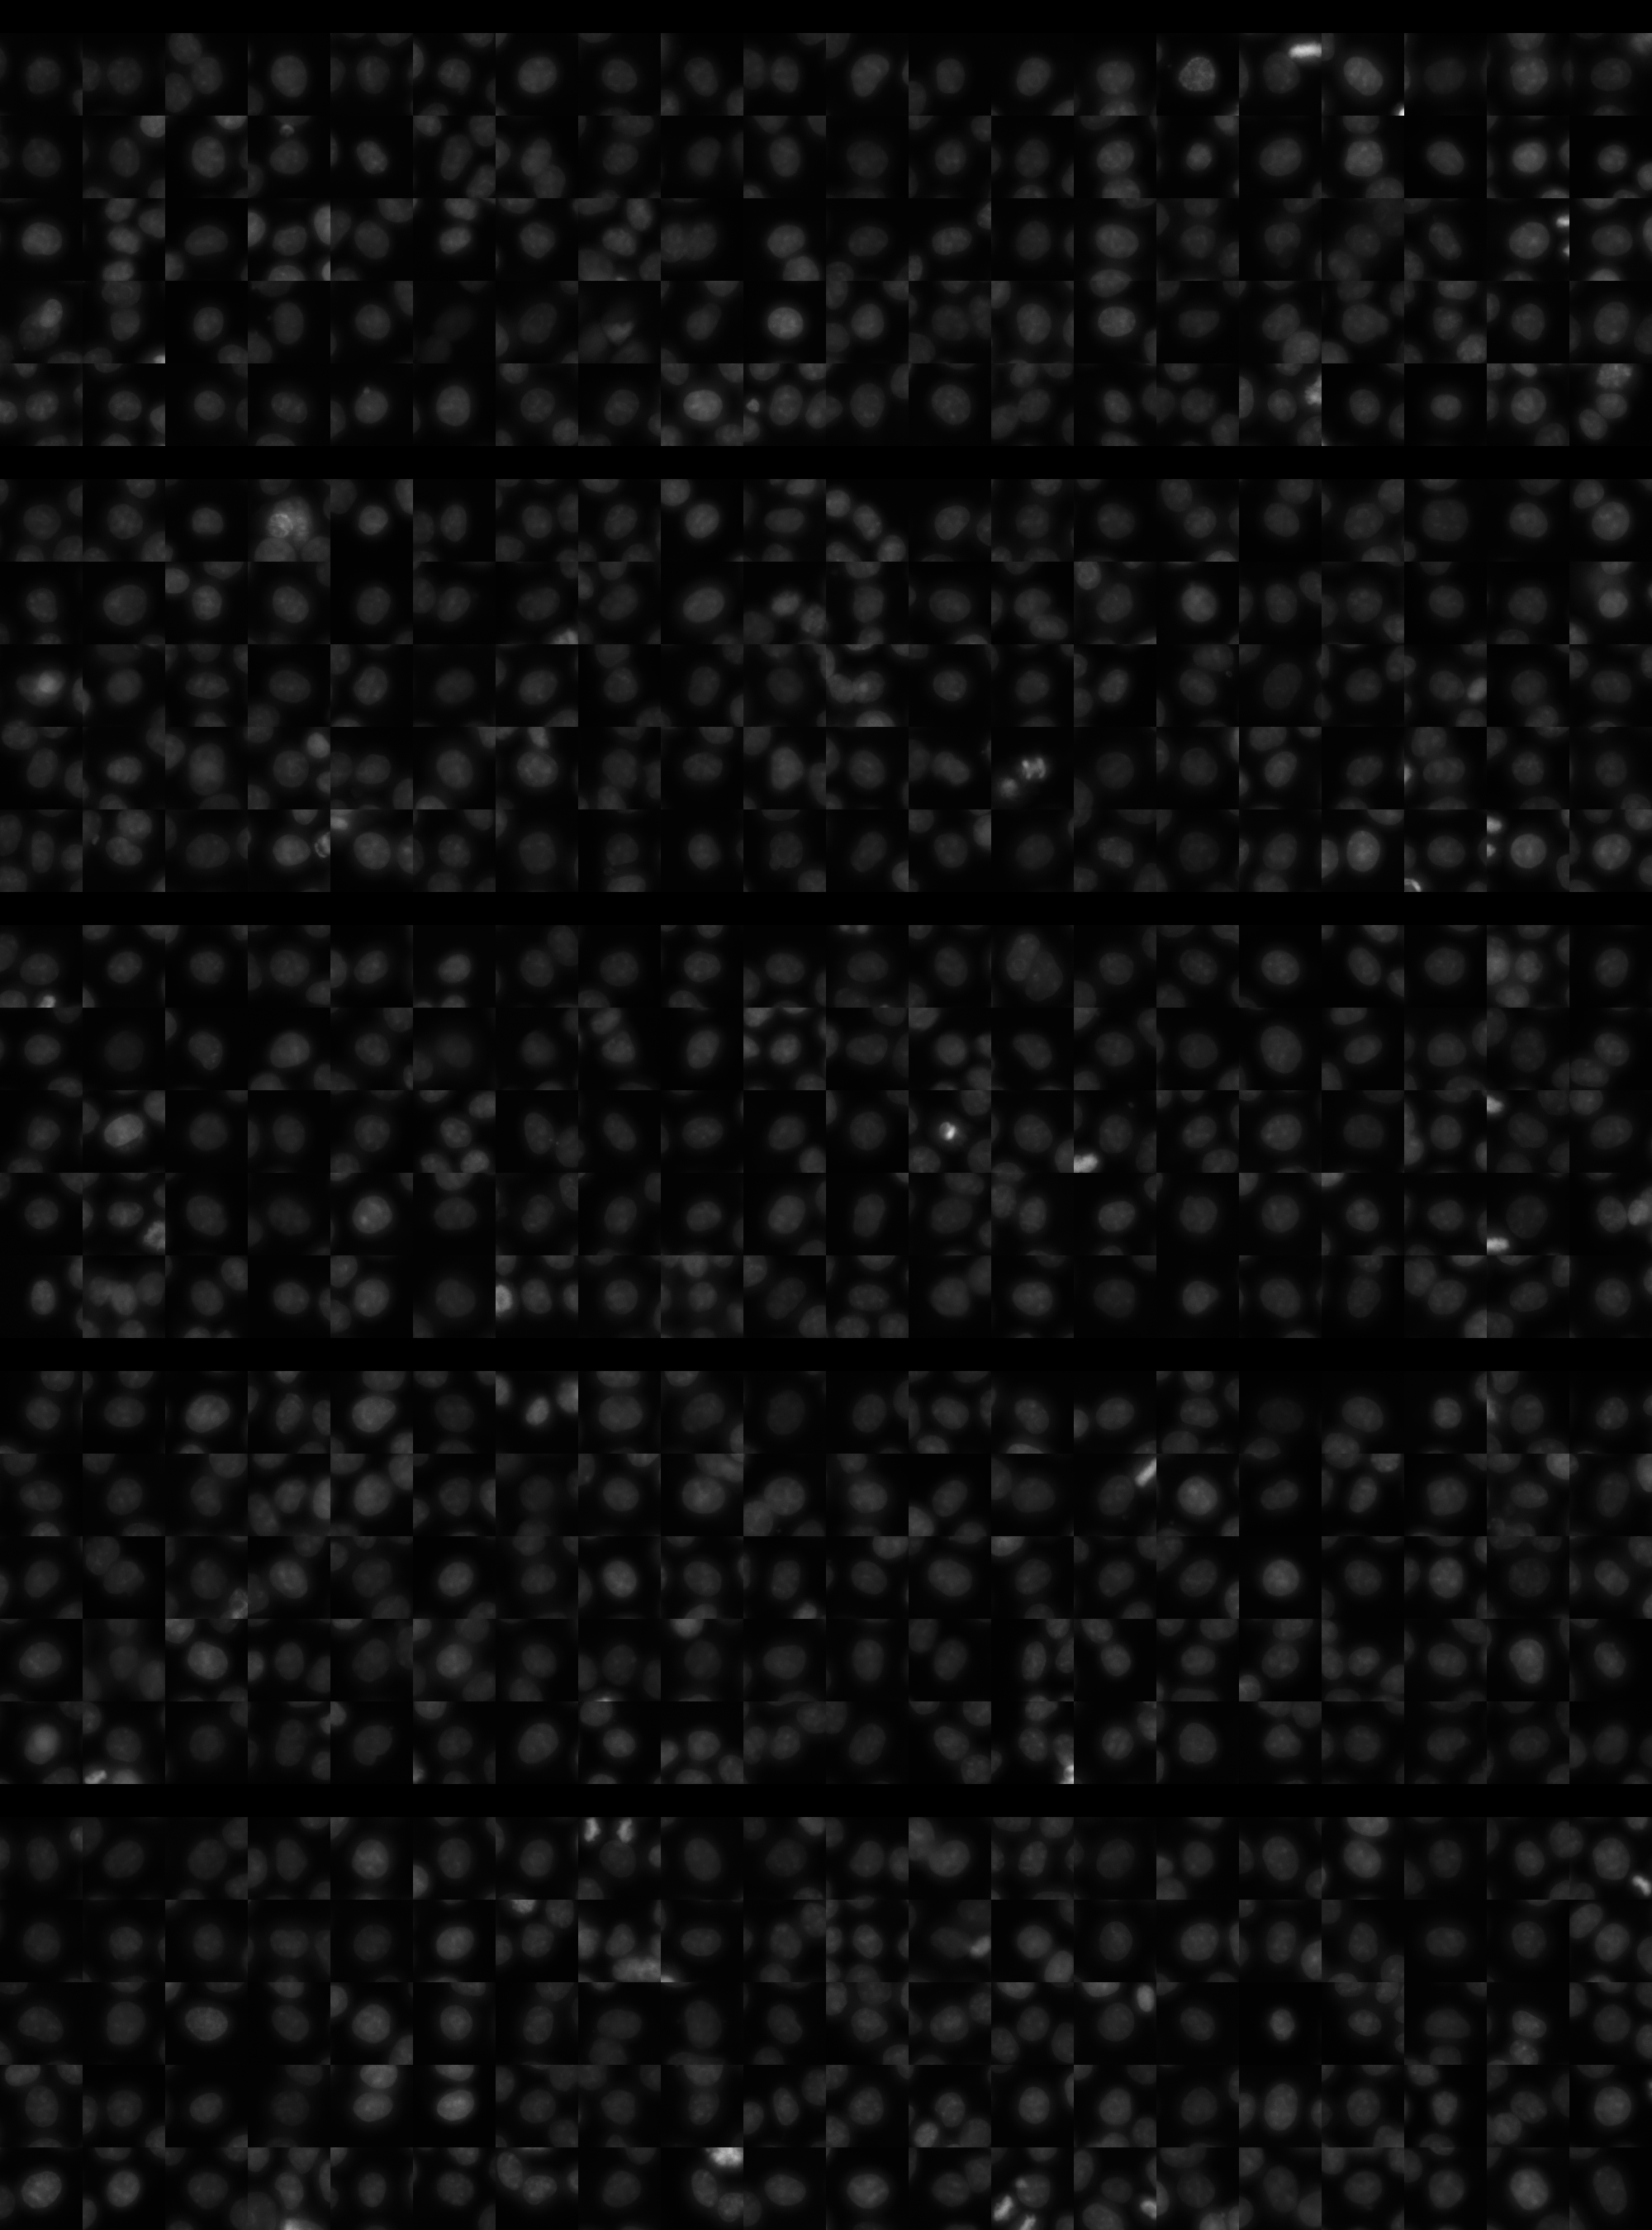
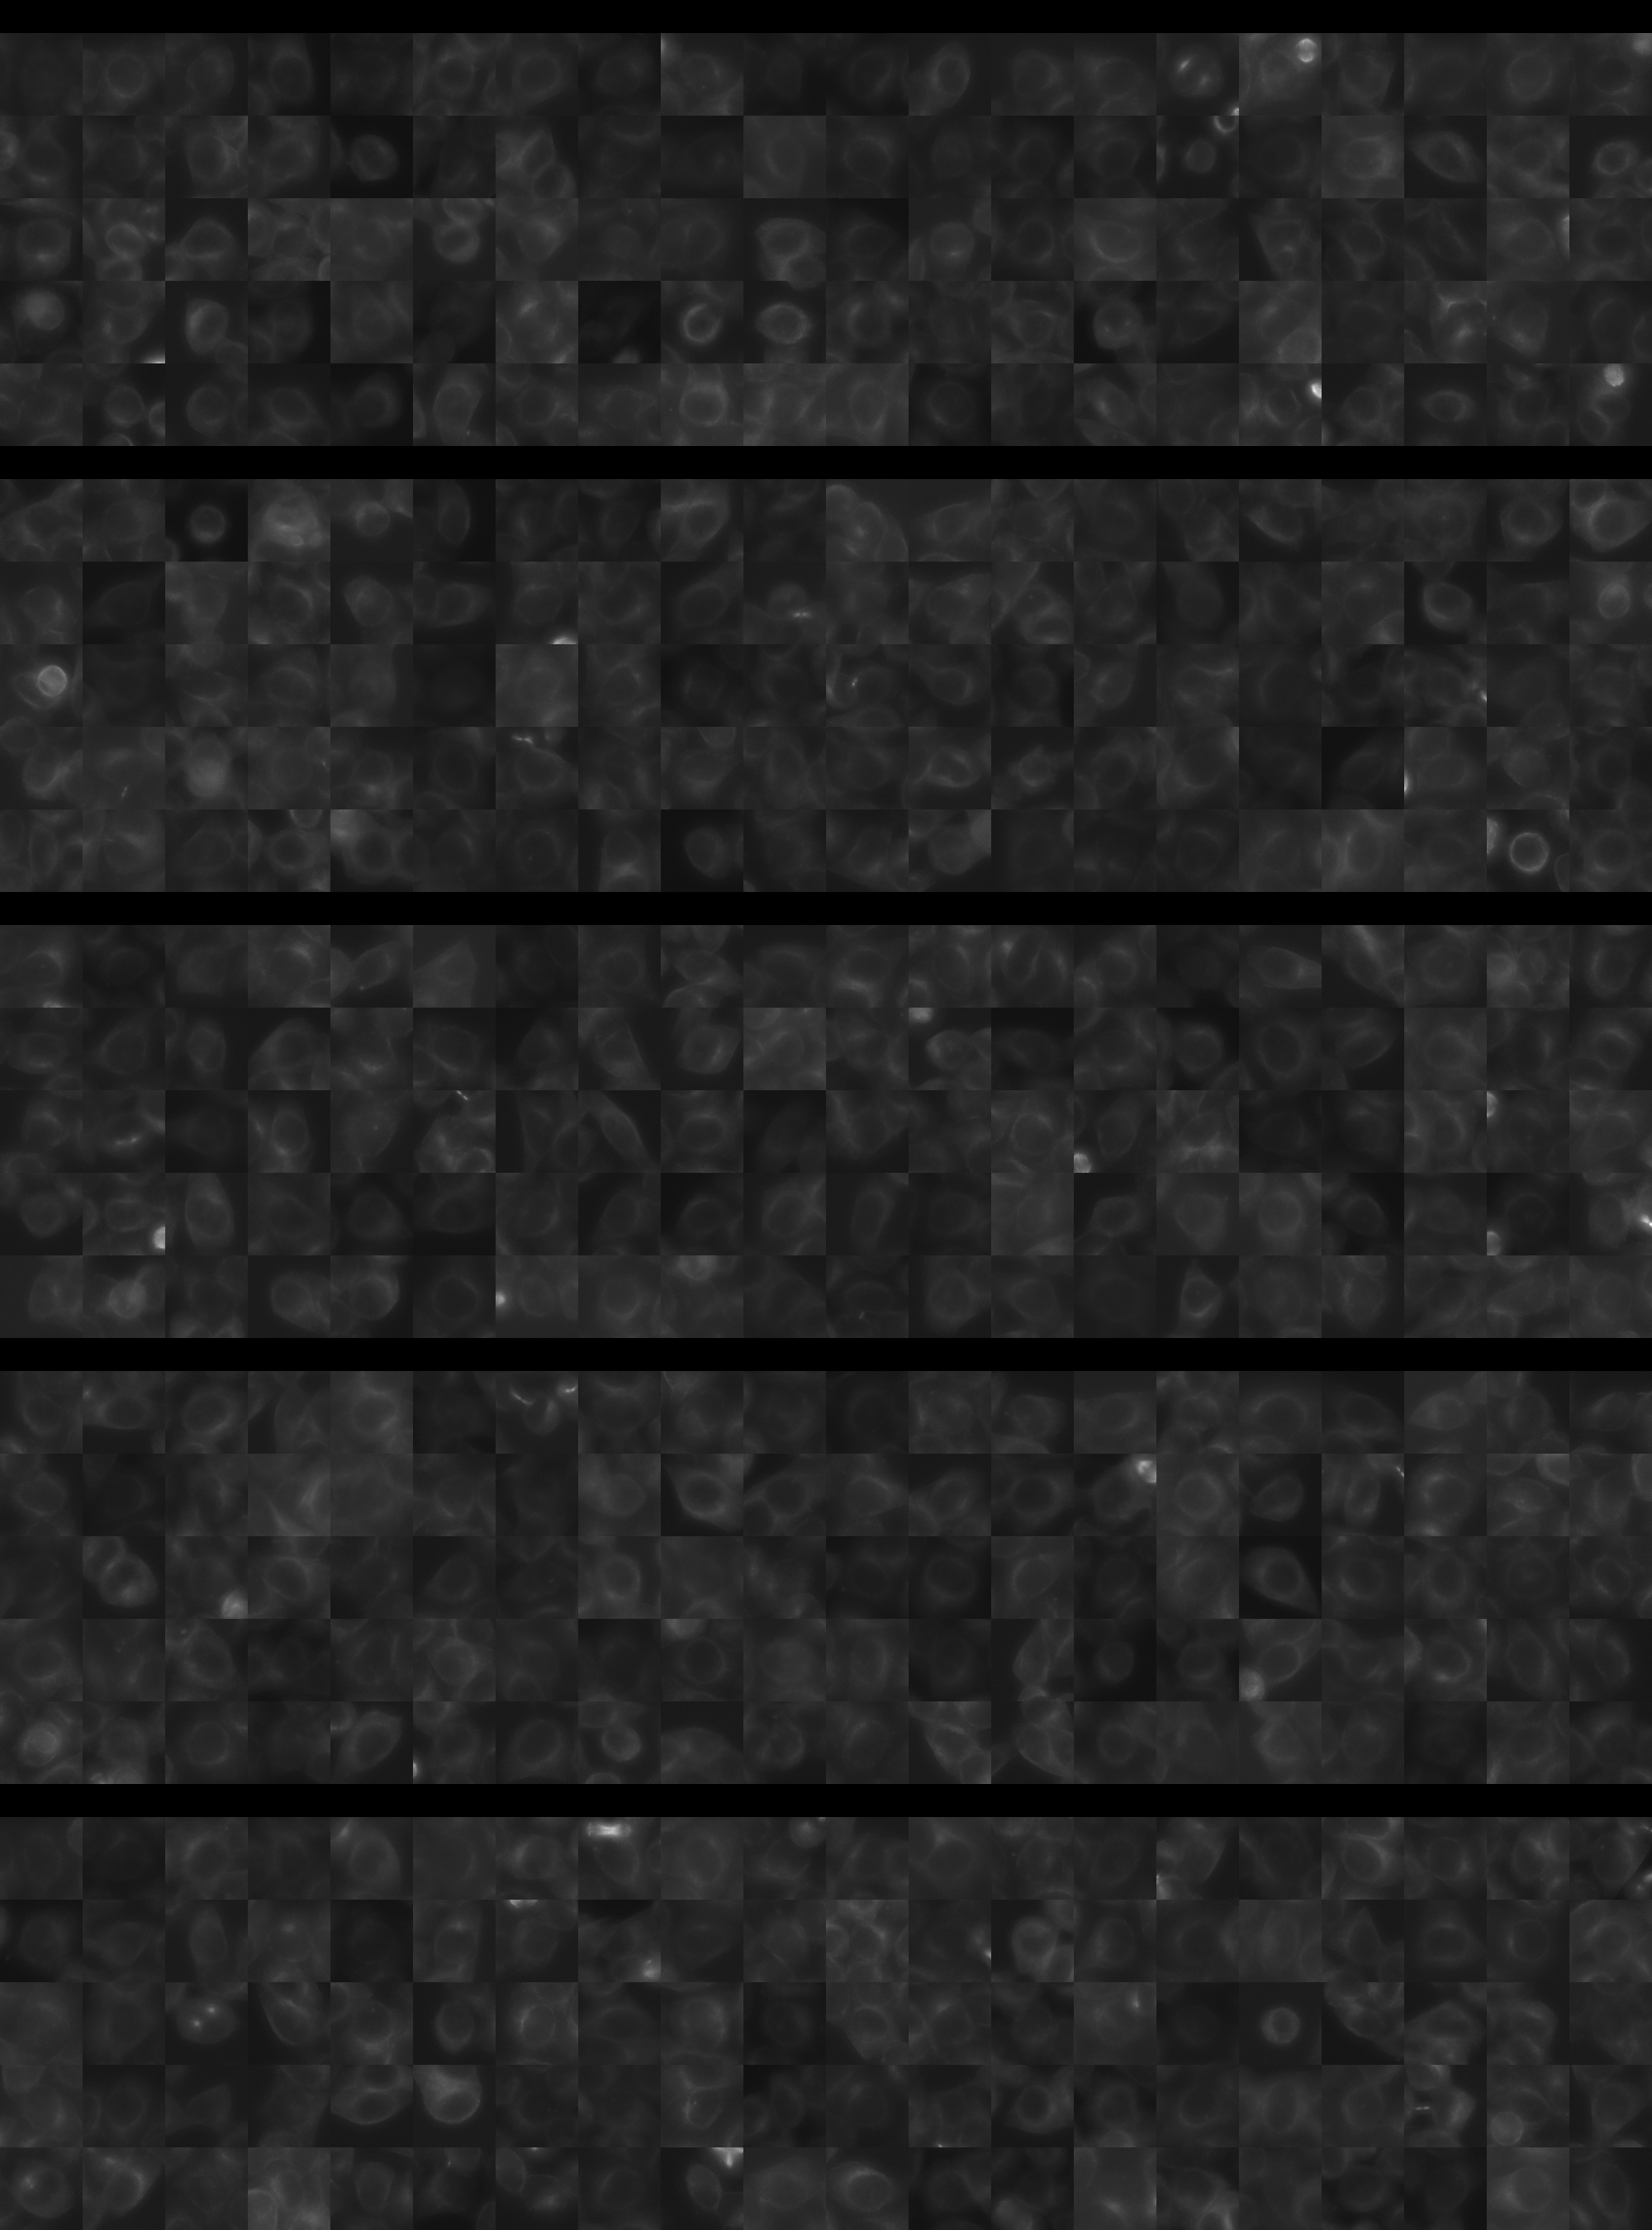
Each montage below shows randomly selected individual cell images for the same target gene separated by sgRNA, along with an example montage of cells expressing a non-targeting negative control sgRNA at the bottom. sgRNA labels in the montages correspond to the numbered sgRNA sequences in the gene info table above. The DNA (blue) and tubulin (green) channels are displayed by default, with gH2AX (grayscale) and actin (yellow) available using the check boxes. Channel brightness, contrast, and opacity are adjustable by clicking the arrow next to the channel name. When only one channel is selected, the display defaults to grayscale. Click the “Zoom” checkbox above the channel controls to enable image zooming (via scrolling) and panning (via click-and-drag).

The cell boxes displayed for this gene are square, 30.36 μm per side for the interphase montage and 30.36 μm per side for the mitotic montage.
Features

Interphase Score Rank FDR q-value
Nucleus DNA Integrated -5.607e-02 4962 of 5322 0.183
Nucleus DNA Mean 0.069 651 of 5322 0.064
Nucleus gH2AX Mean 0.091 2191 of 5322 0.018
Nucleus DNA - gH2AX Correlation -5.273e-03 1051 of 5322 0.802
Nucleus Shape Area -1.039e-01 4851 of 5322 0.002
Nucleus Shape Eccentricity -2.346e-02 4321 of 5322 0.617
Nucleus Shape Form Factor -2.411e-02 1460 of 5322 0.562
Nucleus Shape Solidity -4.933e-02 2668 of 5322 0.116
Cell DNA Mass Displacement 0.016 3336 of 5322 0.818
Cell Tubulin Mean -9.368e-02 4862 of 5322 0.022
Cell Tubulin Mass Displacement 0.010 2408 of 5322 0.884
Cell Actin Mean 0.027 2140 of 5322 0.604
Cell Tubulin - Actin Correlation 0.045 1607 of 5322 0.229
Cell DNA - Tubulin Correlation -2.072e-03 3907 of 5322 0.958
Cell Shape Area -6.524e-02 4575 of 5322 0.089
Cell Shape Eccentricity 0.010 2936 of 5322 0.913
Mitotic Score Rank FDR q-value
Nucleus DNA Integrated 0.089 2642 of 5322 0.965
Nucleus DNA Mean 0.087 1641 of 5322 1.000
Nucleus DNA Mass Displacement 0.232 541 of 5322 0.999
Nucleus DNA Mean Frac 3 -1.262e-01 4654 of 5322 1.000
Nucleus gH2AX Mean -1.195e-02 3108 of 5322 1.000
Nucleus gH2AX Mean Frac 0 0.120 790 of 5322 1.000
Nucleus Tubulin Mean Frac 0 -1.189e-02 3680 of 5322 0.999
Nucleus Tubulin Mean Edge 0.148 1289 of 5322 0.996
Nucleus Tubulin Std Edge -2.746e-02 2937 of 5322 0.999
Nucleus Shape Area 0.099 2685 of 5322 0.989
Nucleus Shape Eccentricity -7.180e-02 3196 of 5322 1.000
Nucleus Shape Form Factor -5.701e-02 2234 of 5322 0.998
Cell Tubulin Mean -8.988e-03 3626 of 5322 1.000
Cell Tubulin Mean Frac 3 0.087 816 of 5322 0.999
Cell Actin Mean 0.083 2104 of 5322 0.997
Cell Shape Area 0.184 1568 of 5322 0.994
( Reset Zoom )
Brightness
Contrast
Opacity
Brightness
Contrast
Opacity
Brightness
Contrast
Opacity
Brightness
Contrast
Opacity
Brightness
Contrast
Opacity

( Reset Zoom )
Brightness
Contrast
Opacity
Brightness
Contrast
Opacity
Brightness
Contrast
Opacity
Brightness
Contrast
Opacity
Brightness
Contrast
Opacity

MIT Central Accessability