PDSS1

Gene symbol: PDSS1
Gene: 23590
Uniprot Function: Heterotetrameric enzyme that catalyzes the condensation of farnesyl diphosphate (FPP), which acts as a primer, and isopentenyl diphosphate (IPP) to produce prenyl diphosphates of varying chain lengths and participates in the determination of the side chain of ubiquinone (PubMed:16262699). Supplies nona and decaprenyl diphosphate, the precursors for the side chain of the isoprenoid quinones ubiquinone-9 (Q9)and ubiquinone-10 (Q10) respectively (PubMed:16262699). The enzyme adds isopentenyl diphosphate molecules sequentially to farnesyl diphosphate with trans stereochemistry (PubMed:16262699).
Mitotic Index 0.0247
Interphase Cluster: #43 (31 genes)
Mitotic Cluster: #18 (40 genes)
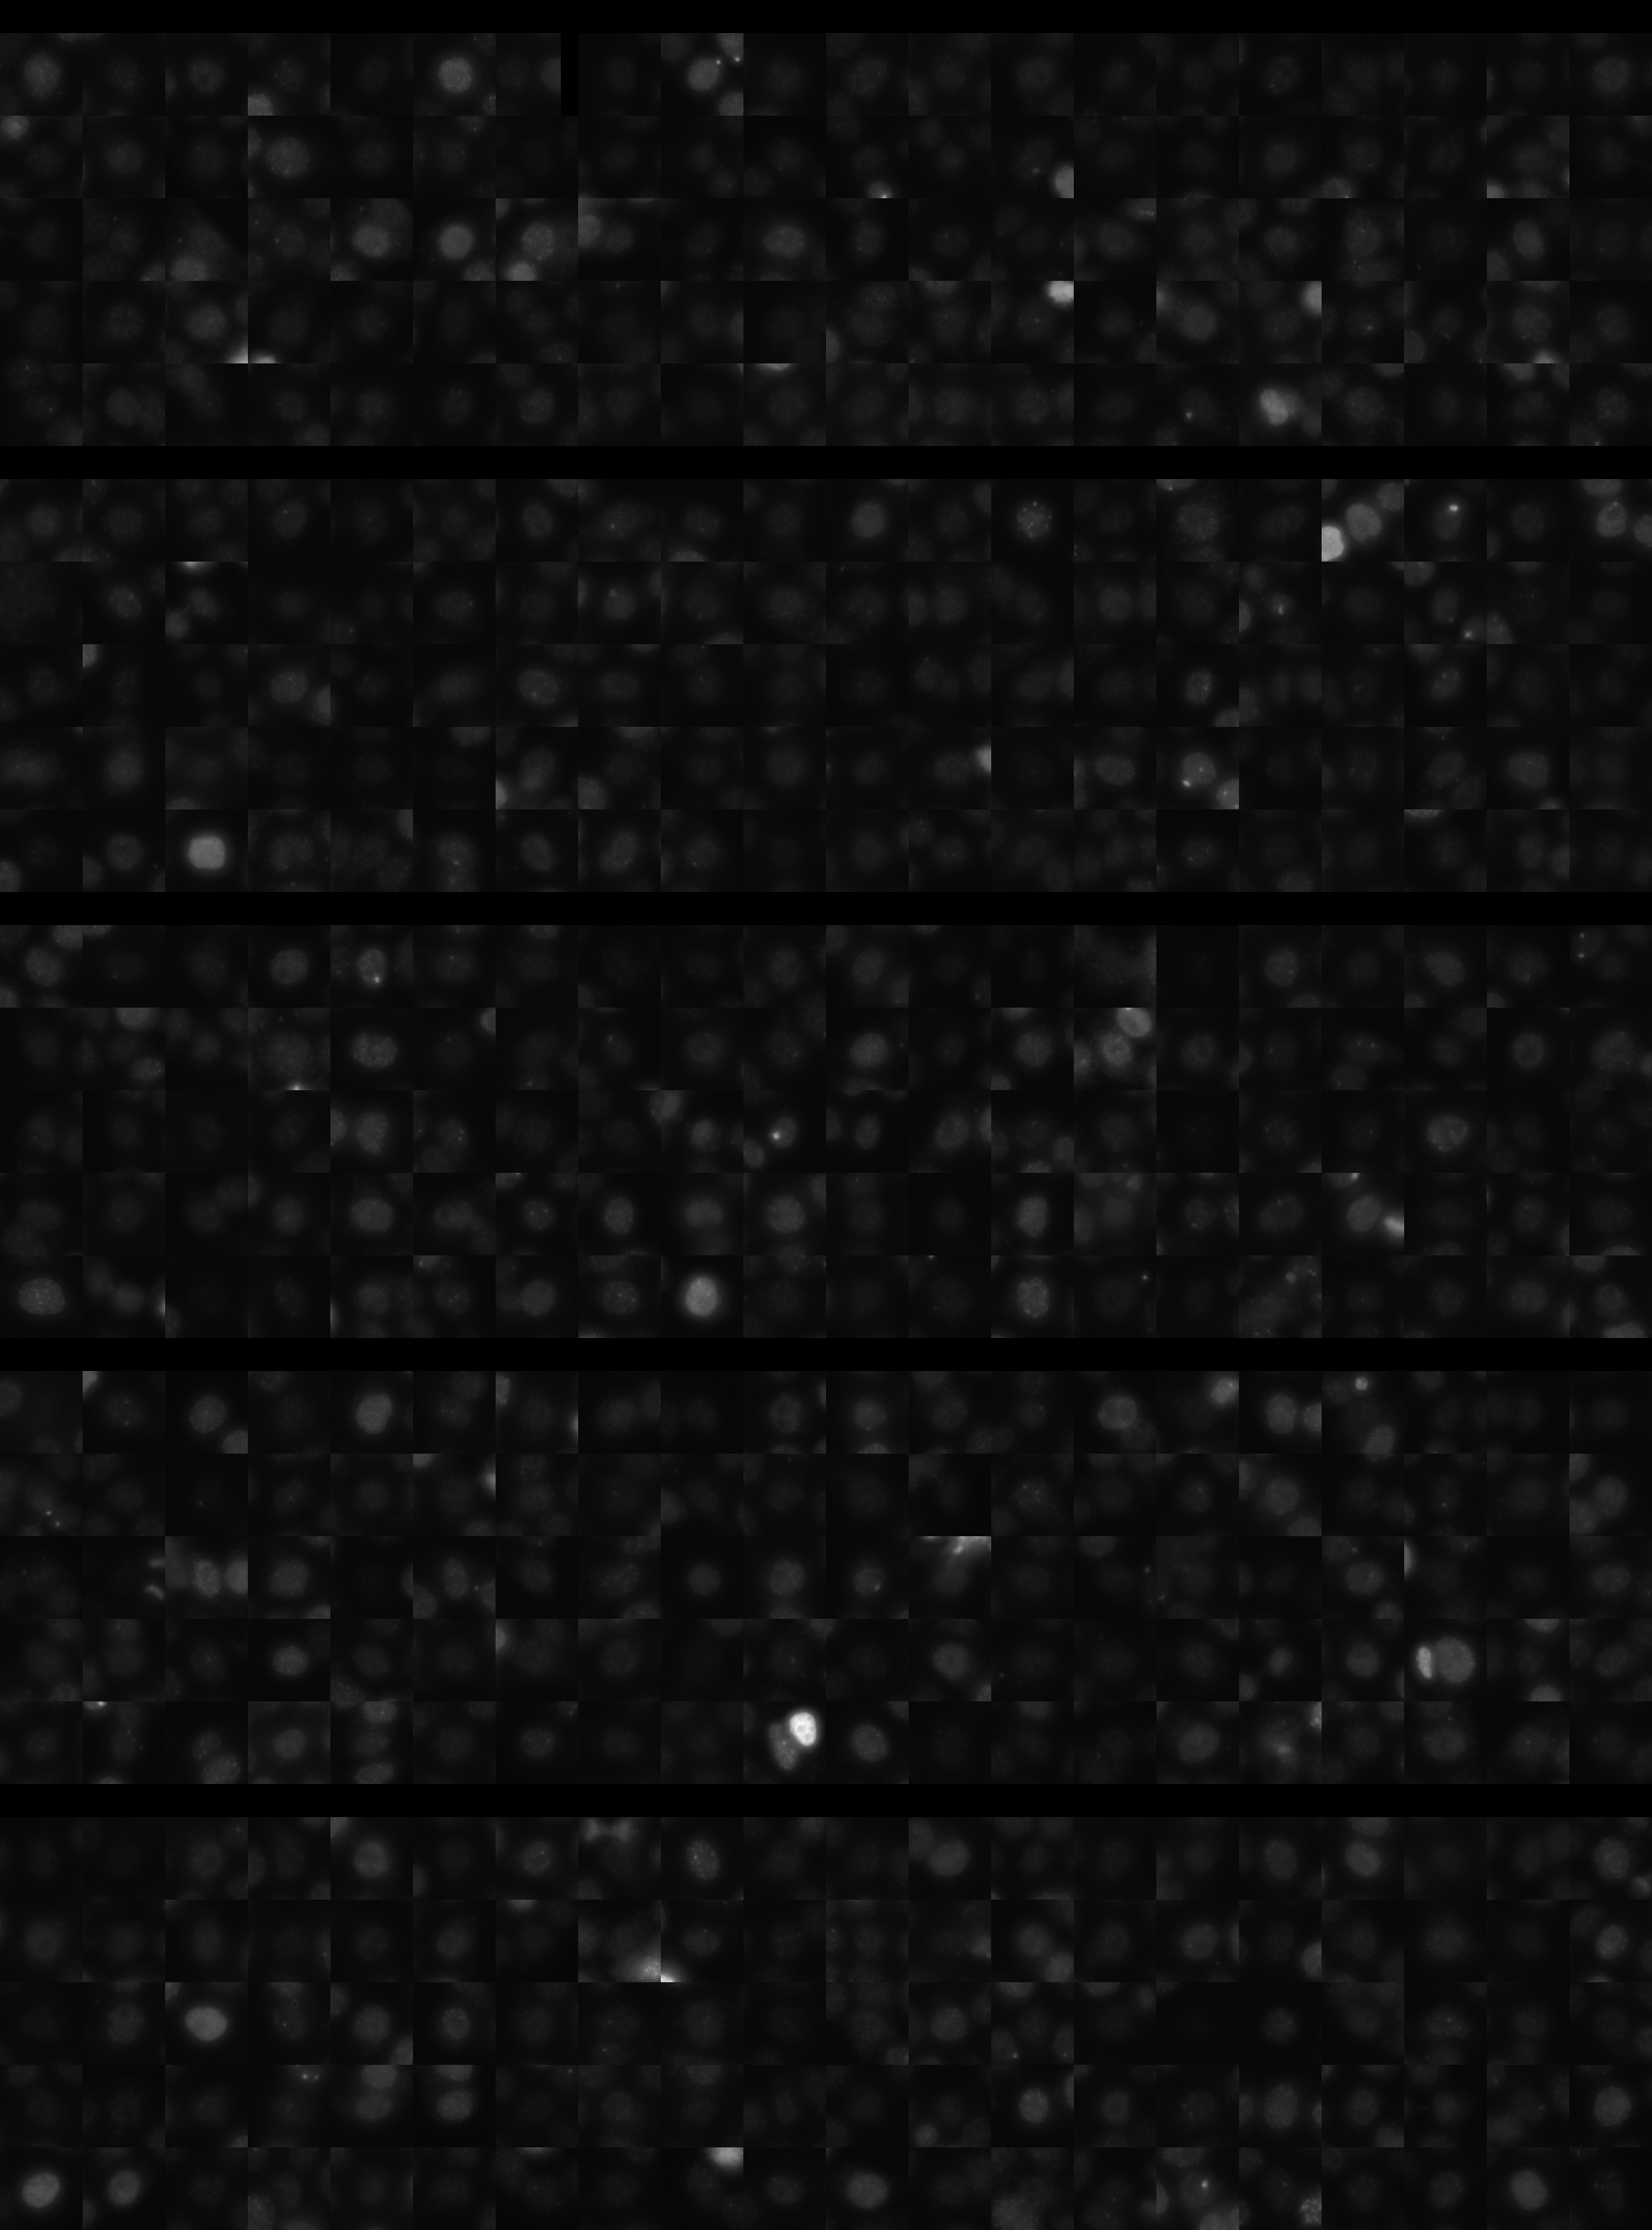
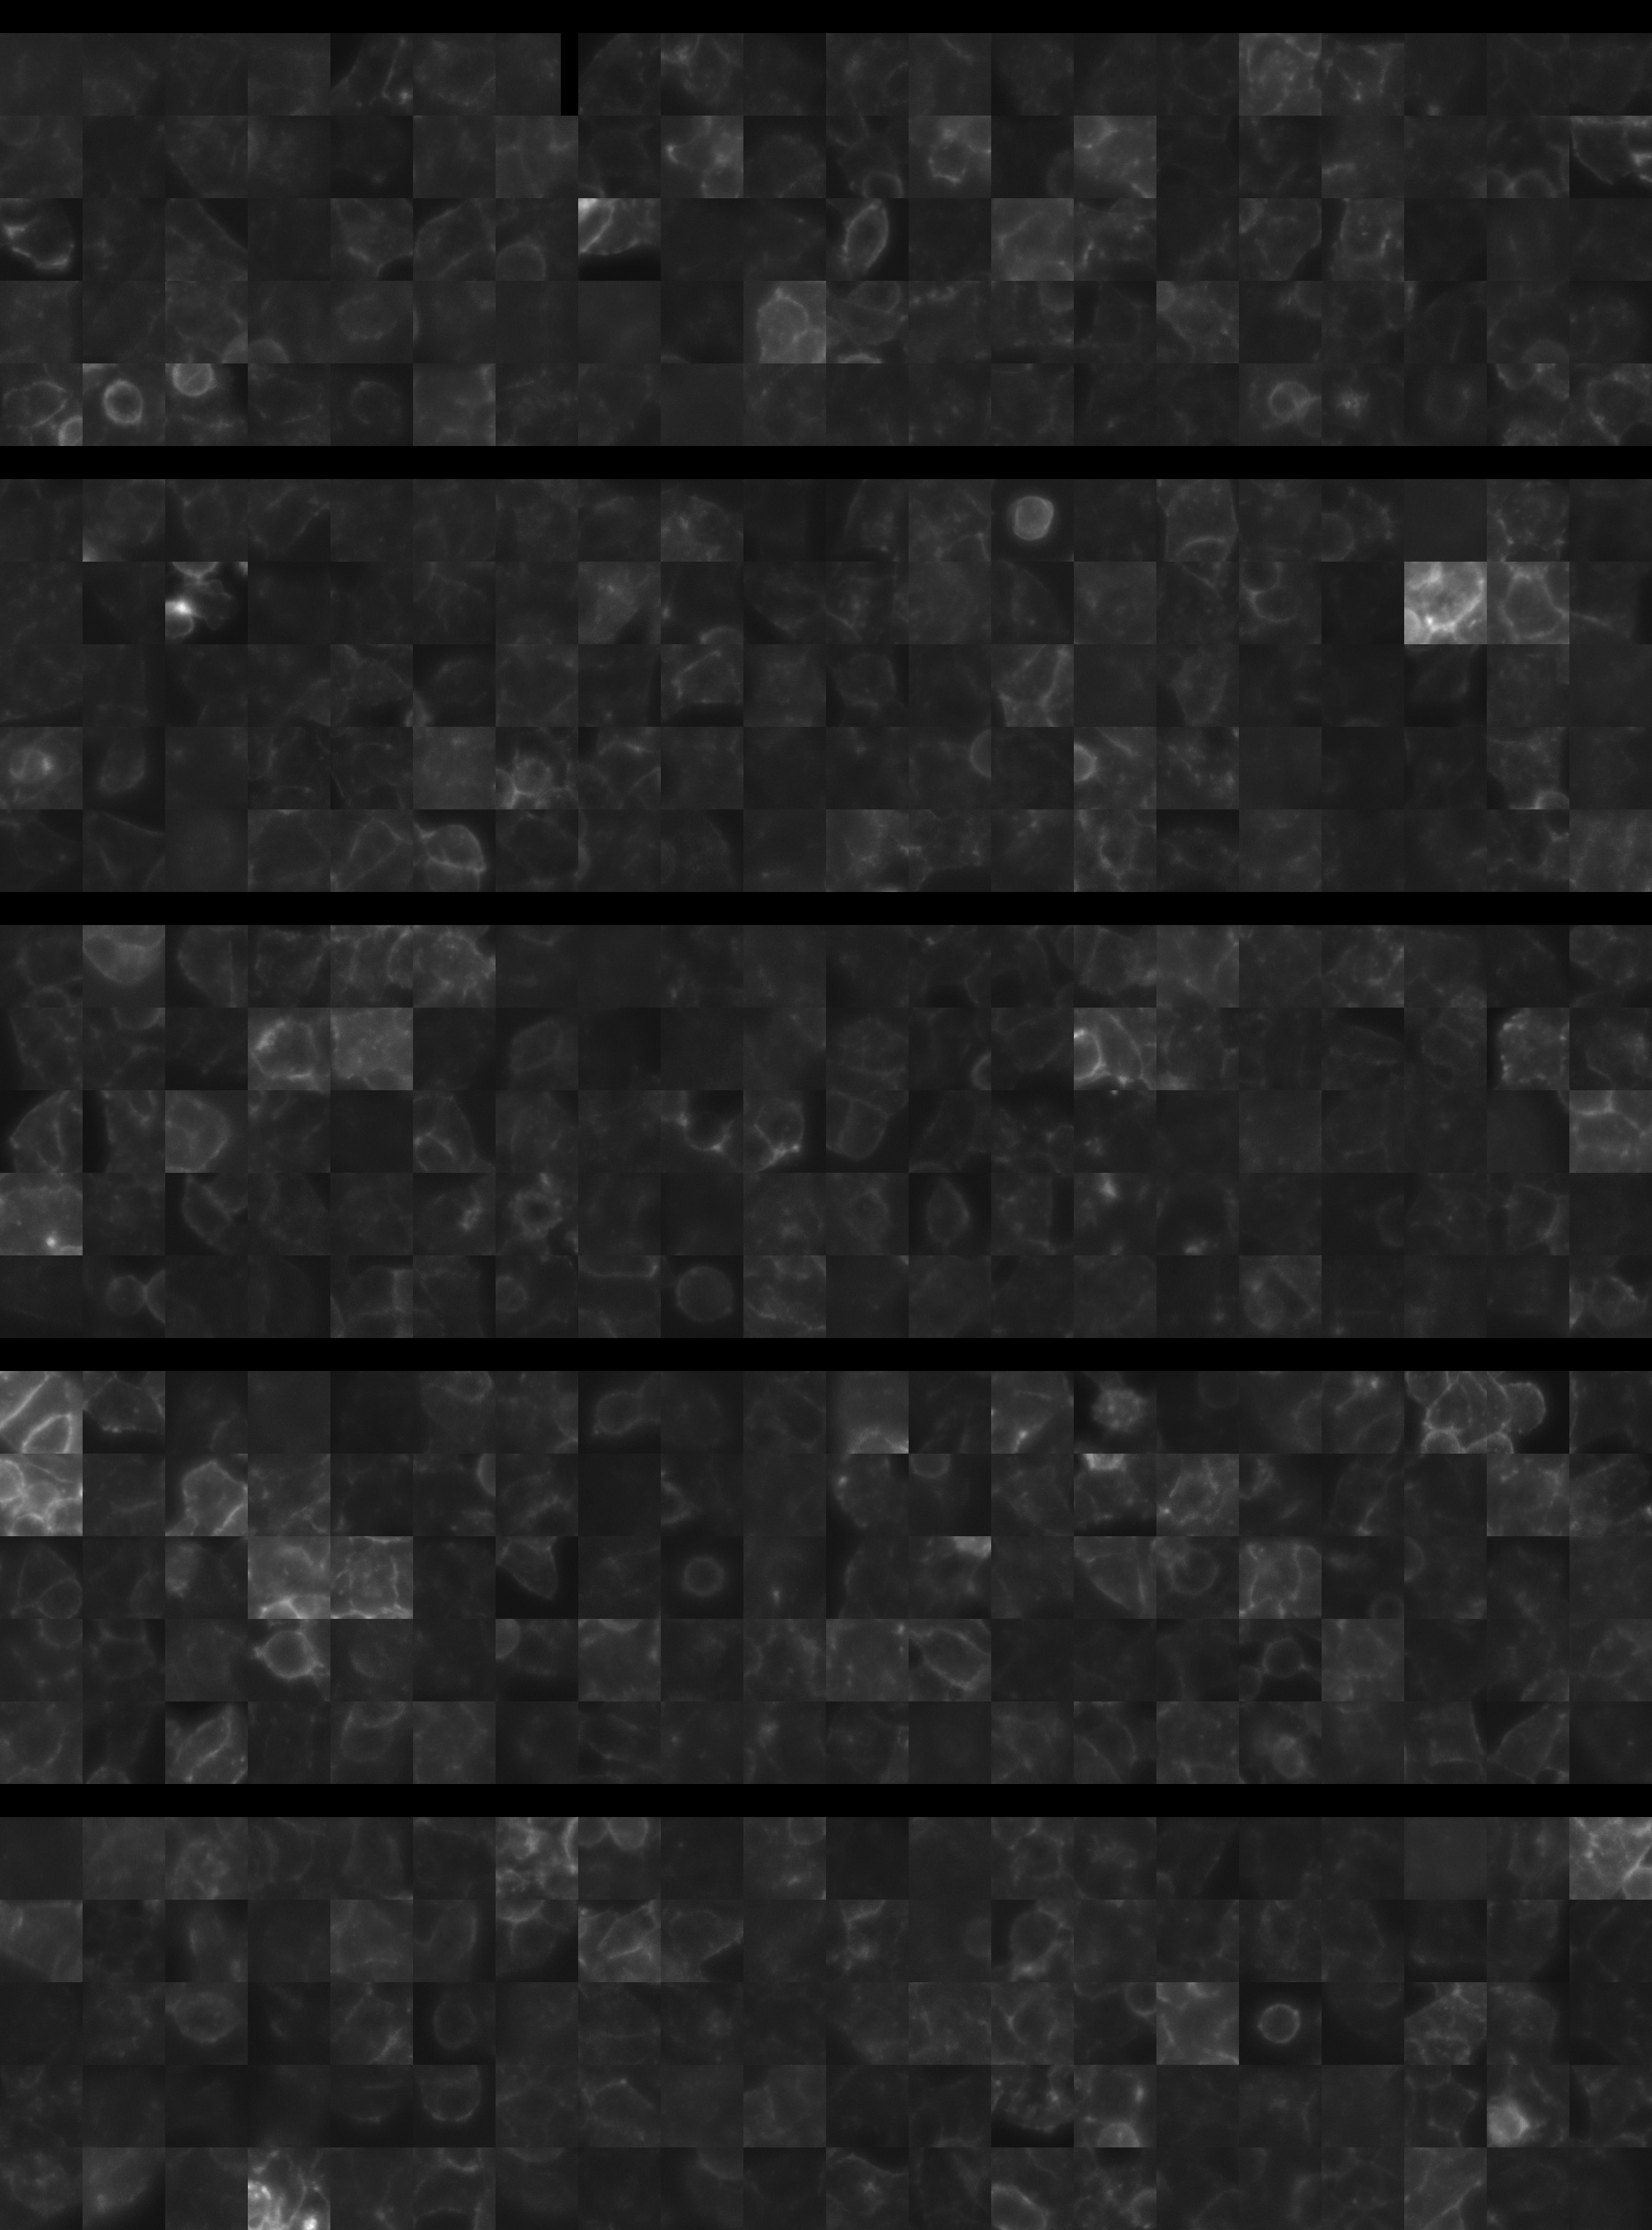
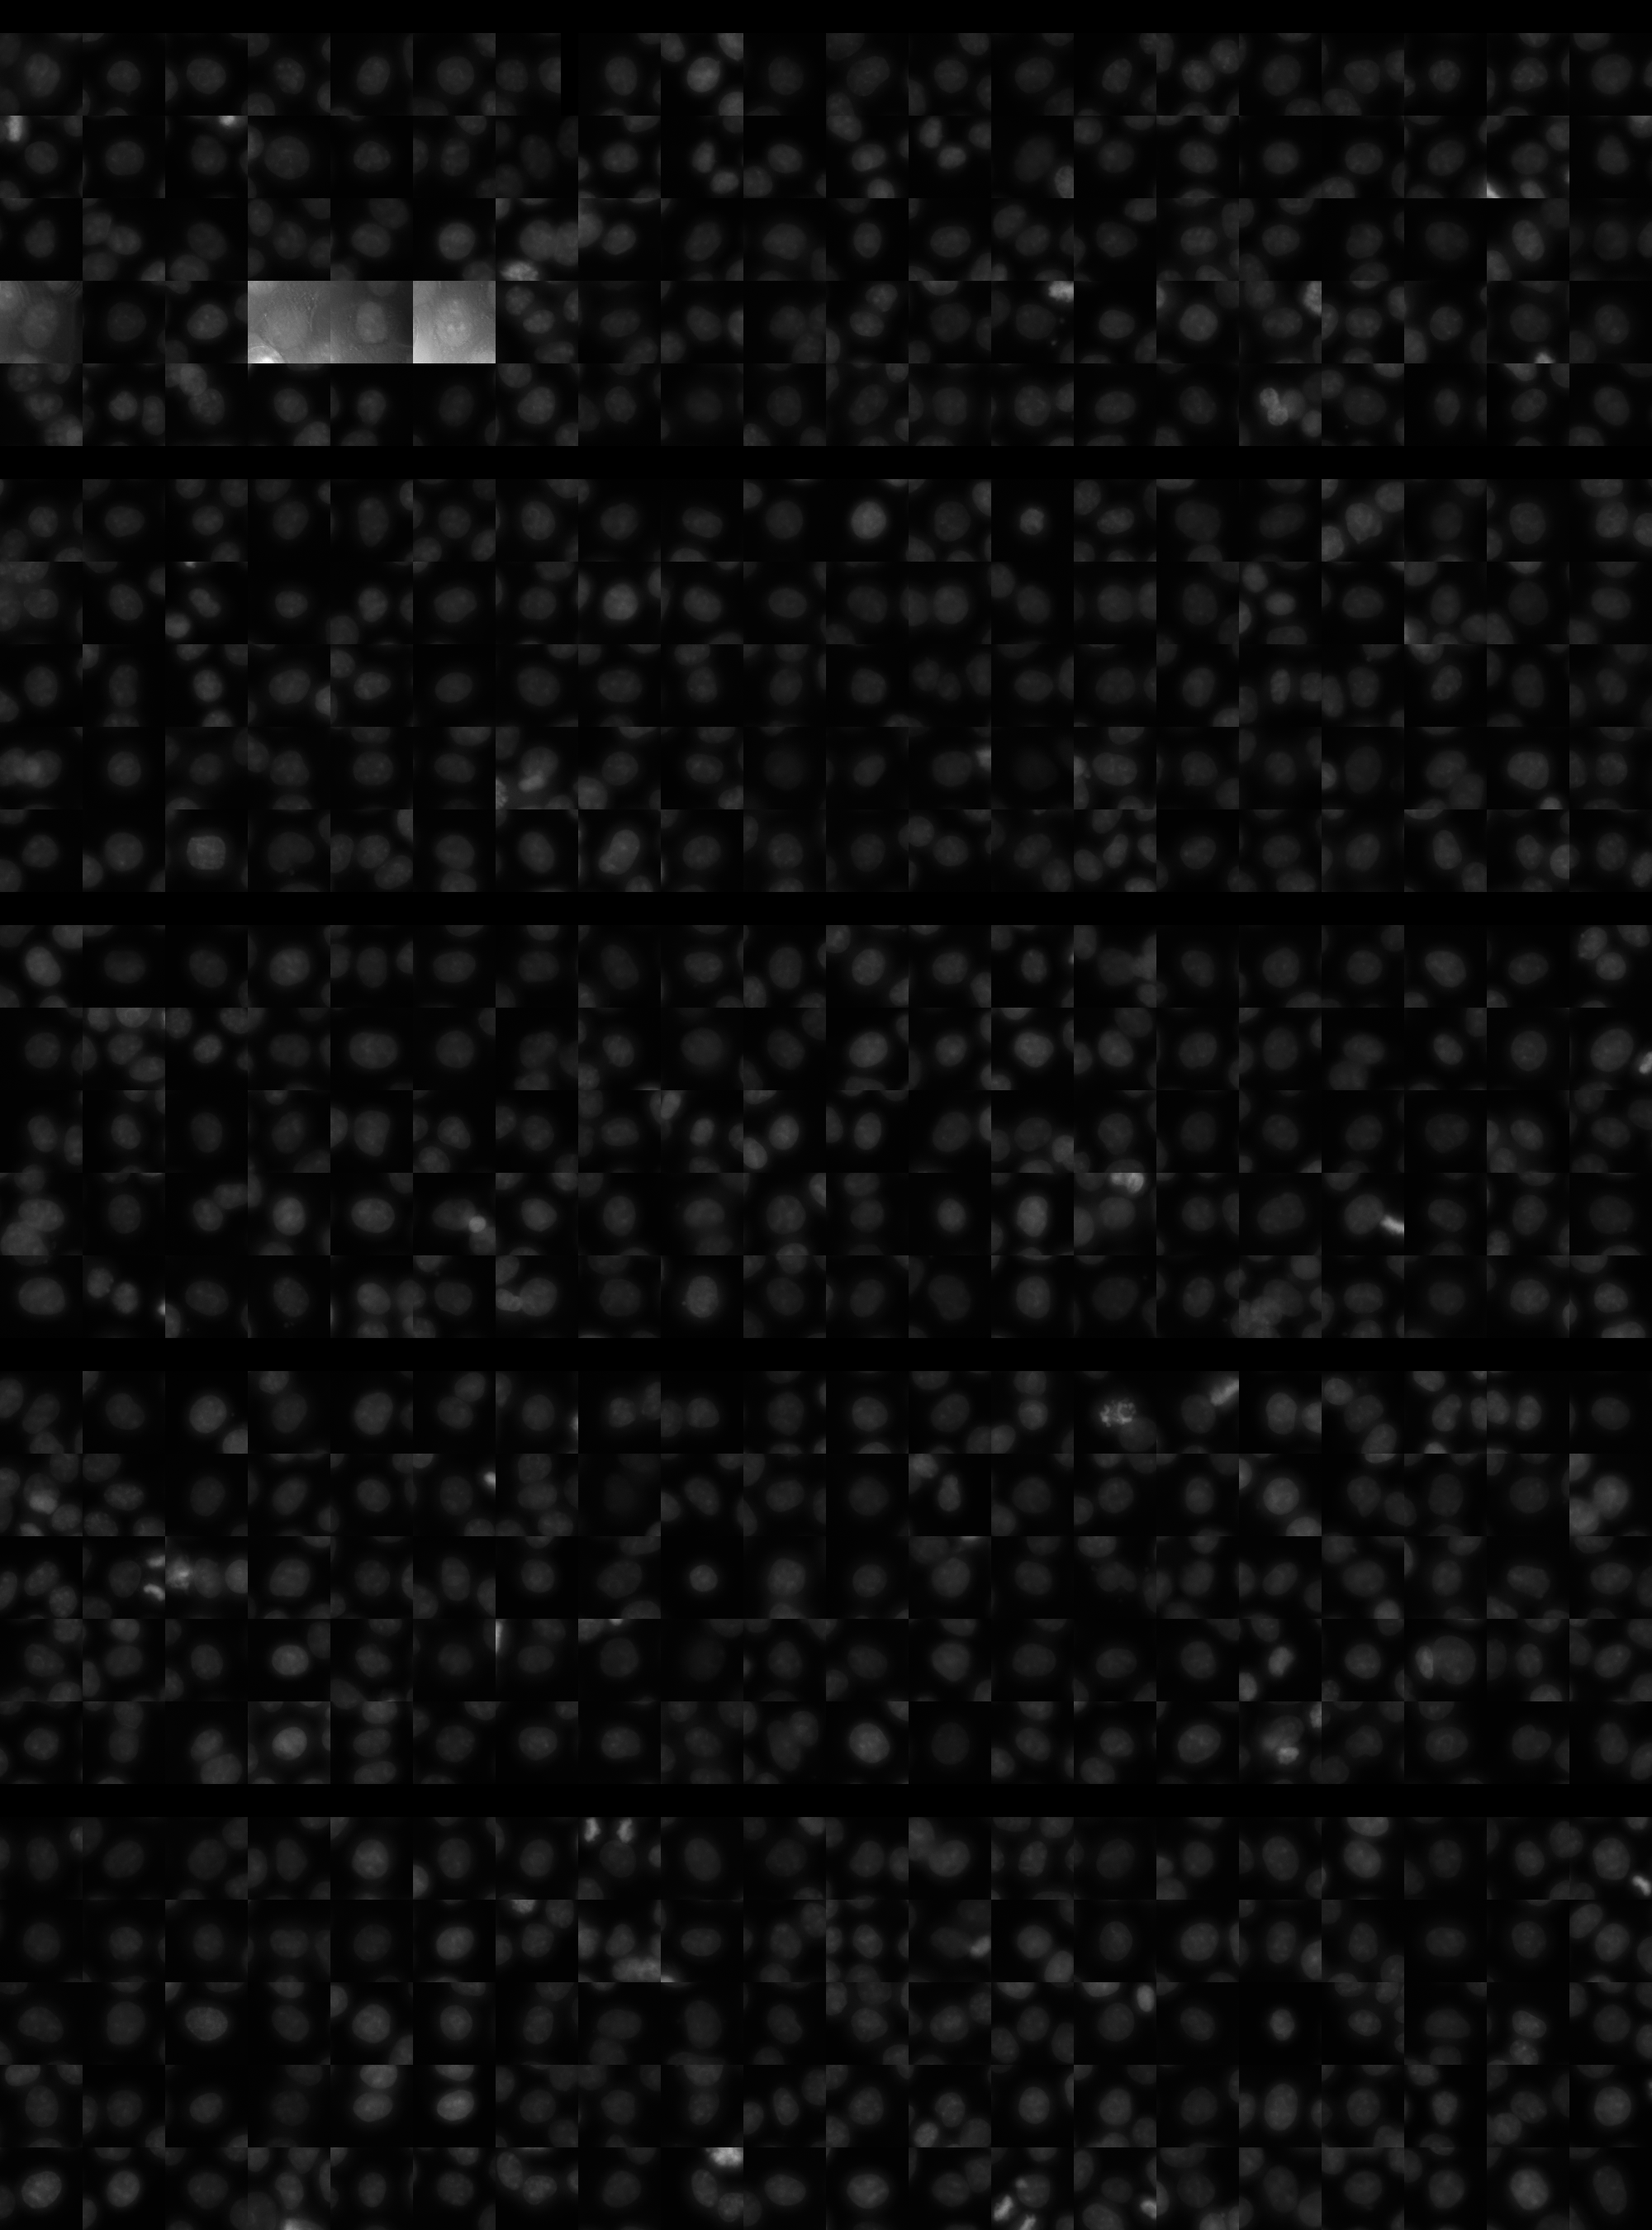
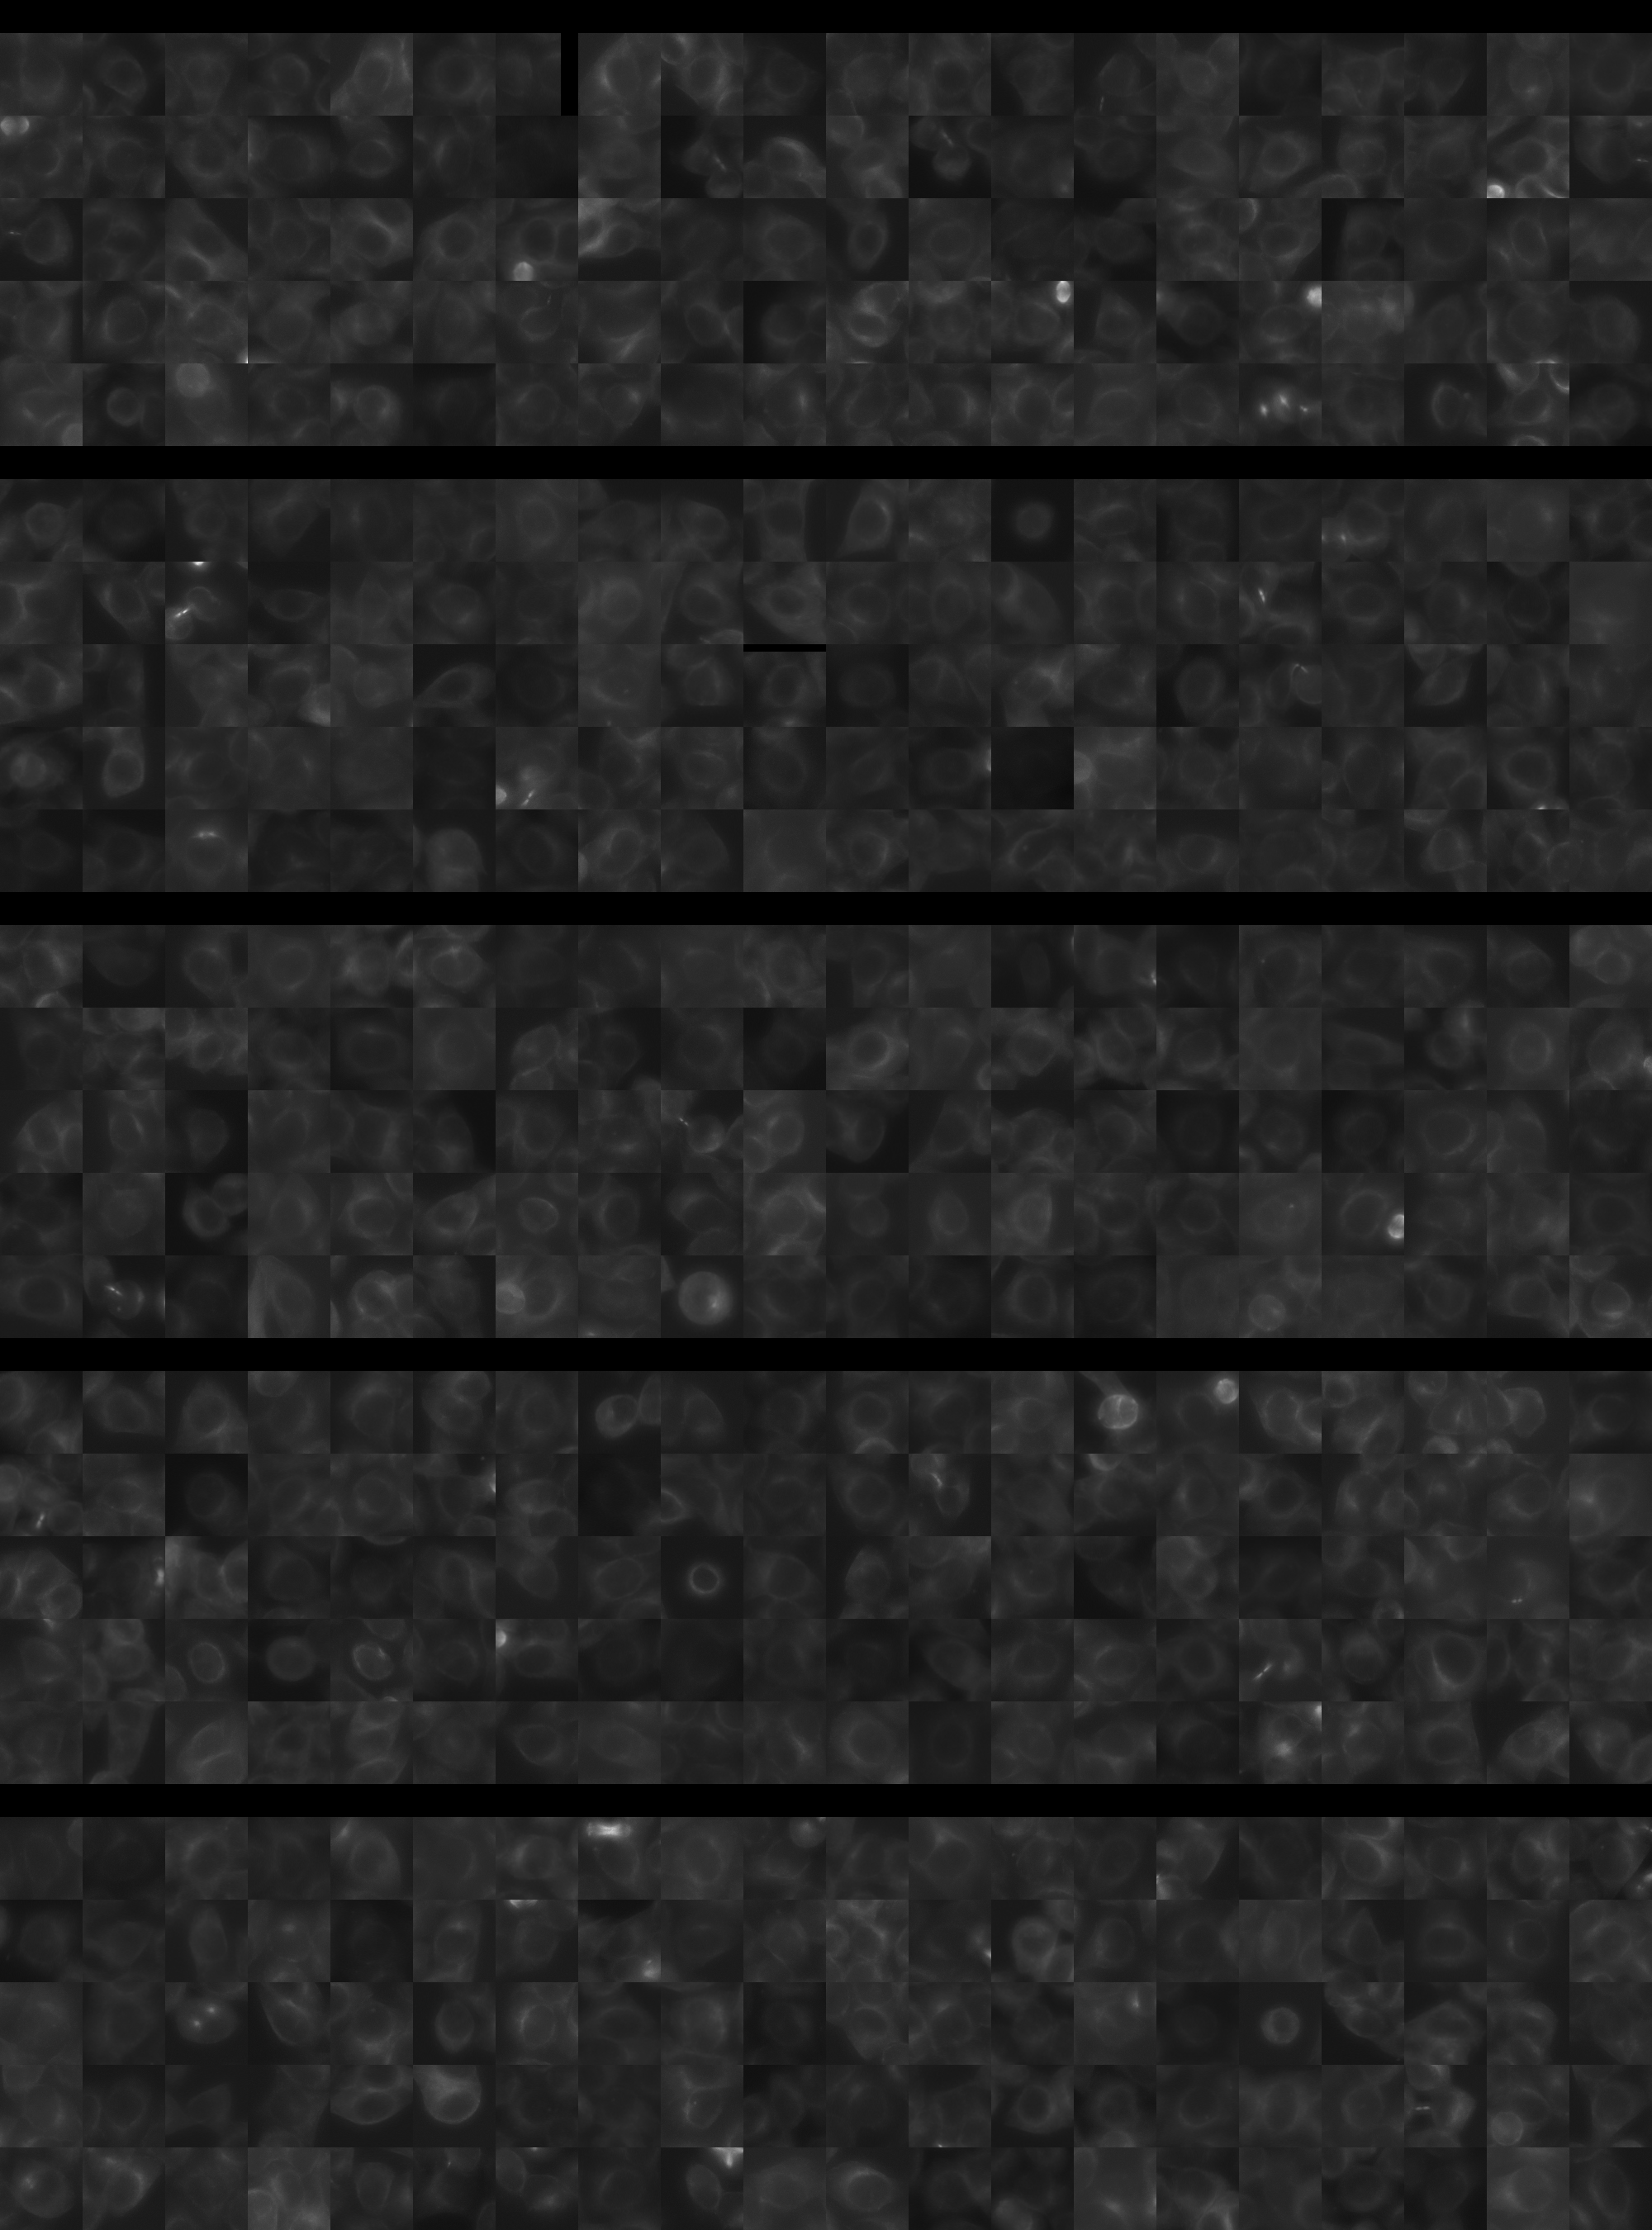
sgRNA 1: CCGGCCGTGCGGGACCGTTG (interphase cells: 421, mitotic cells: 11)
sgRNA 2: GTTATTGAAGATTTGGTGCG (interphase cells: 1639, mitotic cells: 41)
sgRNA 3: TATACGACATACATTTGGAC (interphase cells: 950, mitotic cells: 25)
sgRNA 4: TATGATGAATATTGCATGCT (interphase cells: 2352, mitotic cells: 59)

Interphase Cluster

Mitotic Cluster

Overview

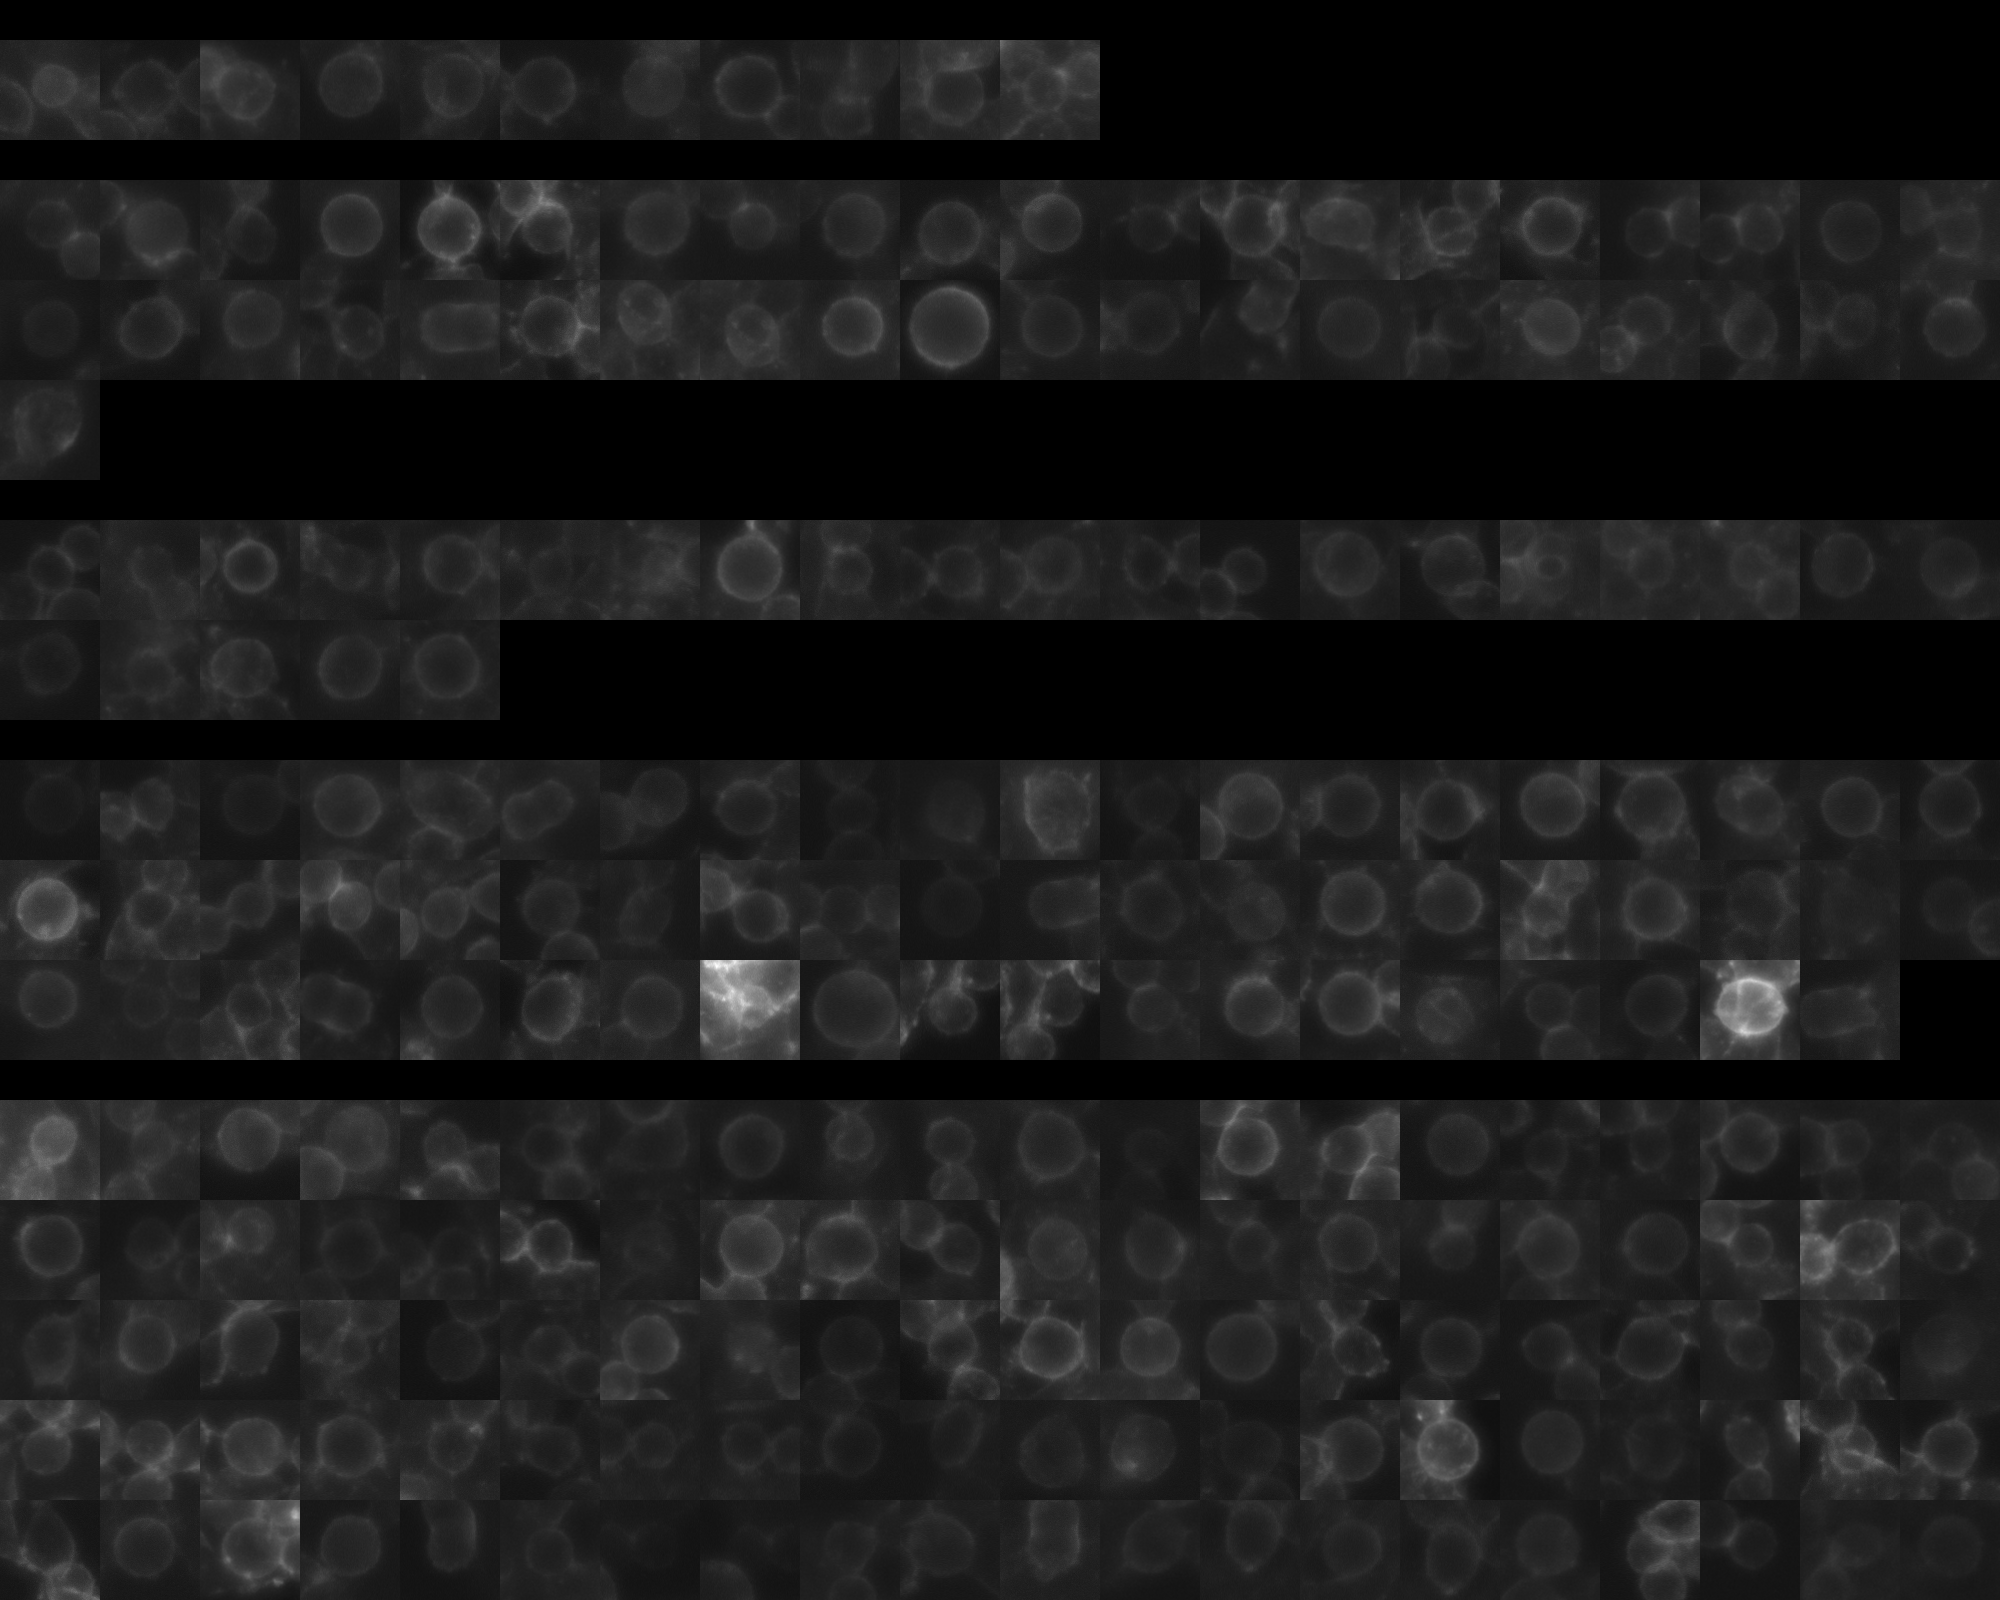
Each montage below shows randomly selected individual cell images for the same target gene separated by sgRNA, along with an example montage of cells expressing a non-targeting negative control sgRNA at the bottom. sgRNA labels in the montages correspond to the numbered sgRNA sequences in the gene info table above. The DNA (blue) and tubulin (green) channels are displayed by default, with gH2AX (grayscale) and actin (yellow) available using the check boxes. Channel brightness, contrast, and opacity are adjustable by clicking the arrow next to the channel name. When only one channel is selected, the display defaults to grayscale. Click the “Zoom” checkbox above the channel controls to enable image zooming (via scrolling) and panning (via click-and-drag).

The cell boxes displayed for this gene are square, 30.36 μm per side for the interphase montage and 30.36 μm per side for the mitotic montage.
Features

Interphase Score Rank FDR q-value
Nucleus DNA Integrated -6.805e-02 5091 of 5322 0.150
Nucleus DNA Mean 0.001 1934 of 5322 0.950
Nucleus gH2AX Mean 0.035 3926 of 5322 0.402
Nucleus DNA - gH2AX Correlation -4.935e-02 2384 of 5322 0.113
Nucleus Shape Area -7.416e-02 4695 of 5322 0.087
Nucleus Shape Eccentricity -2.519e-02 4372 of 5322 0.657
Nucleus Shape Form Factor -7.121e-03 821 of 5322 0.951
Nucleus Shape Solidity -3.358e-02 1925 of 5322 0.381
Cell DNA Mass Displacement 0.015 3453 of 5322 0.873
Cell Tubulin Mean 0.078 684 of 5322 0.071
Cell Tubulin Mass Displacement -2.203e-03 3155 of 5322 0.988
Cell Actin Mean 0.104 773 of 5322 0.029
Cell Tubulin - Actin Correlation -2.876e-02 4722 of 5322 0.580
Cell DNA - Tubulin Correlation 0.035 2421 of 5322 0.437
Cell Shape Area -5.373e-02 4432 of 5322 0.240
Cell Shape Eccentricity -5.429e-03 4080 of 5322 0.979
Mitotic Score Rank FDR q-value
Nucleus DNA Integrated 0.114 2275 of 5322 0.965
Nucleus DNA Mean 0.049 2186 of 5322 1.000
Nucleus DNA Mass Displacement -3.141e-02 3969 of 5322 0.999
Nucleus DNA Mean Frac 3 0.194 653 of 5322 1.000
Nucleus gH2AX Mean 0.068 2000 of 5322 1.000
Nucleus gH2AX Mean Frac 0 -6.229e-02 3270 of 5322 1.000
Nucleus Tubulin Mean Frac 0 0.037 2934 of 5322 0.999
Nucleus Tubulin Mean Edge 0.133 1453 of 5322 0.999
Nucleus Tubulin Std Edge -1.435e-02 2762 of 5322 0.999
Nucleus Shape Area 0.037 3506 of 5322 0.990
Nucleus Shape Eccentricity -1.133e-01 3746 of 5322 1.000
Nucleus Shape Form Factor -3.094e-02 1829 of 5322 0.998
Cell Tubulin Mean 0.315 369 of 5322 0.873
Cell Tubulin Mean Frac 3 -3.984e-02 2160 of 5322 0.999
Cell Actin Mean 0.045 2592 of 5322 0.997
Cell Shape Area -4.359e-02 4377 of 5322 0.998
( Reset Zoom )
Brightness
Contrast
Opacity
Brightness
Contrast
Opacity
Brightness
Contrast
Opacity
Brightness
Contrast
Opacity
Brightness
Contrast
Opacity

( Reset Zoom )
Brightness
Contrast
Opacity
Brightness
Contrast
Opacity
Brightness
Contrast
Opacity
Brightness
Contrast
Opacity
Brightness
Contrast
Opacity

MIT Central Accessability