OXSM

Gene symbol: OXSM
Gene: 54995
Uniprot Function: May play a role in the biosynthesis of lipoic acid as well as longer chain fatty acids required for optimal mitochondrial function.
Mitotic Index 0.0268
Interphase Cluster: #219 (7 genes)
Mitotic Cluster: #65 (27 genes)
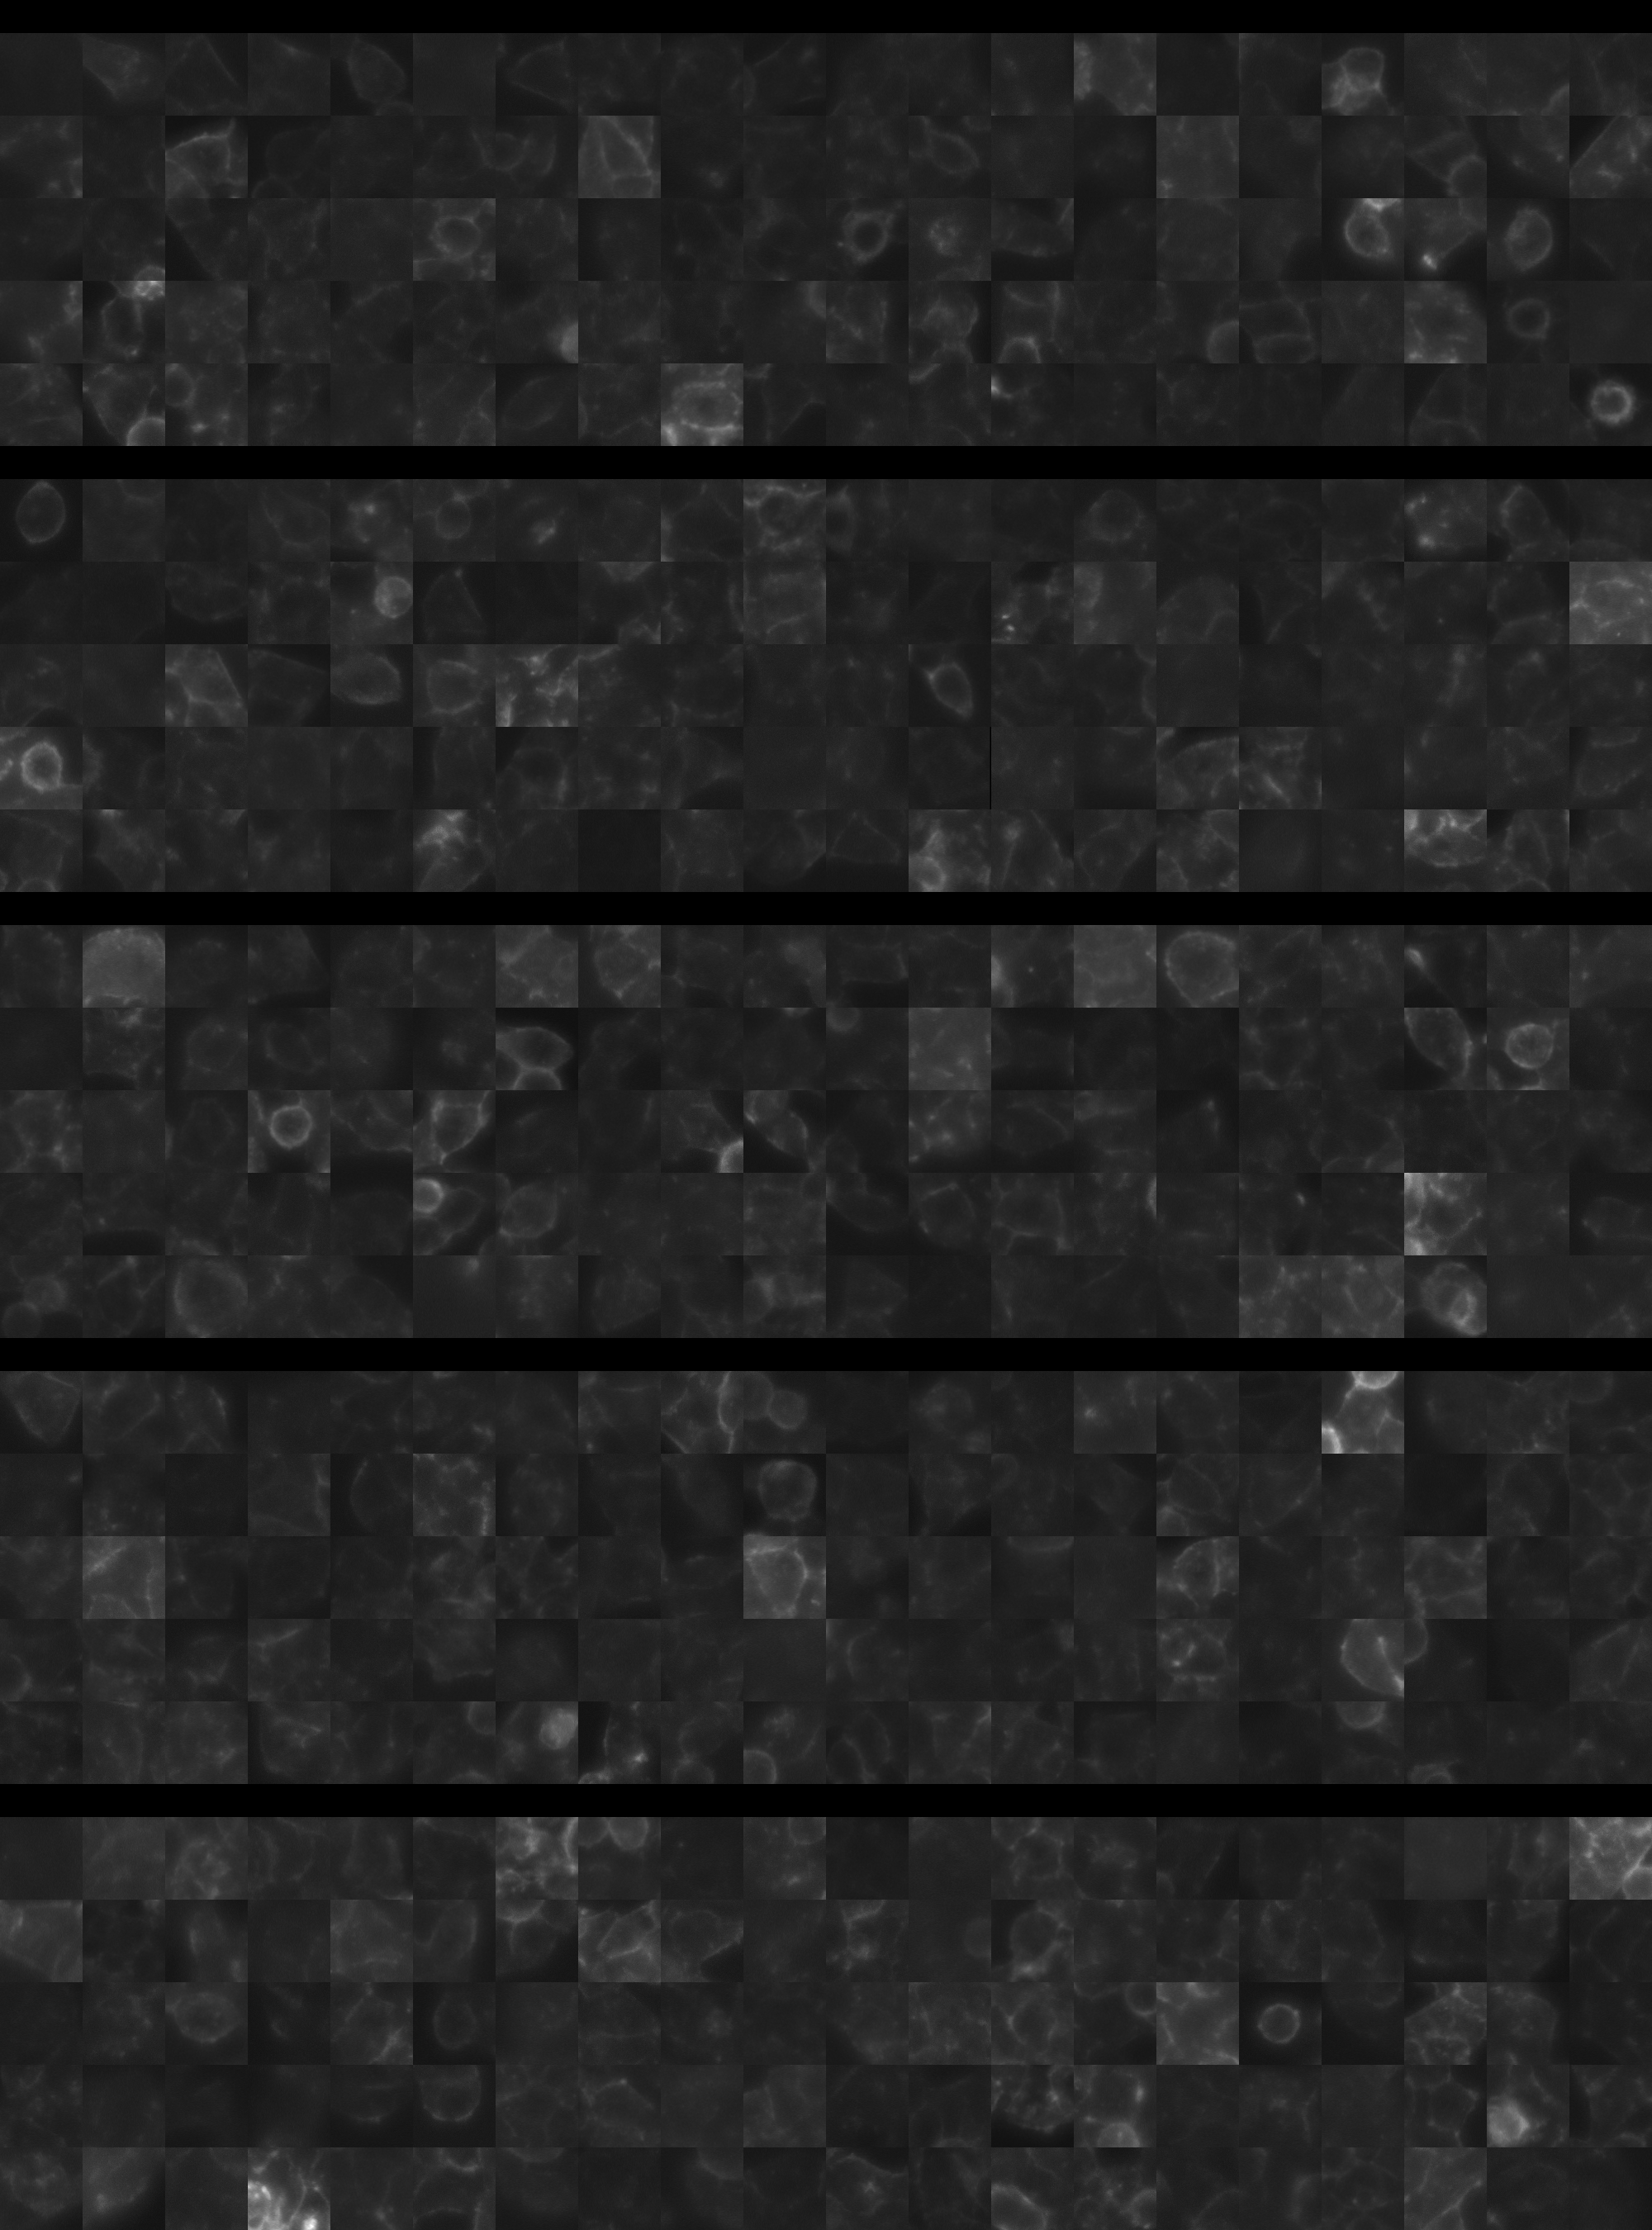
sgRNA 1: AATGGTCGACATGCCAACTT (interphase cells: 2047, mitotic cells: 68)
sgRNA 2: CAGCATTCGATATAAACTCA (interphase cells: 2161, mitotic cells: 50)
sgRNA 3: GTTTGGGATCGTCTTATCGG (interphase cells: 1392, mitotic cells: 35)
sgRNA 4: TGCCAATATCCAGATTGCAT (interphase cells: 1889, mitotic cells: 53)

Interphase Cluster

Mitotic Cluster

Overview

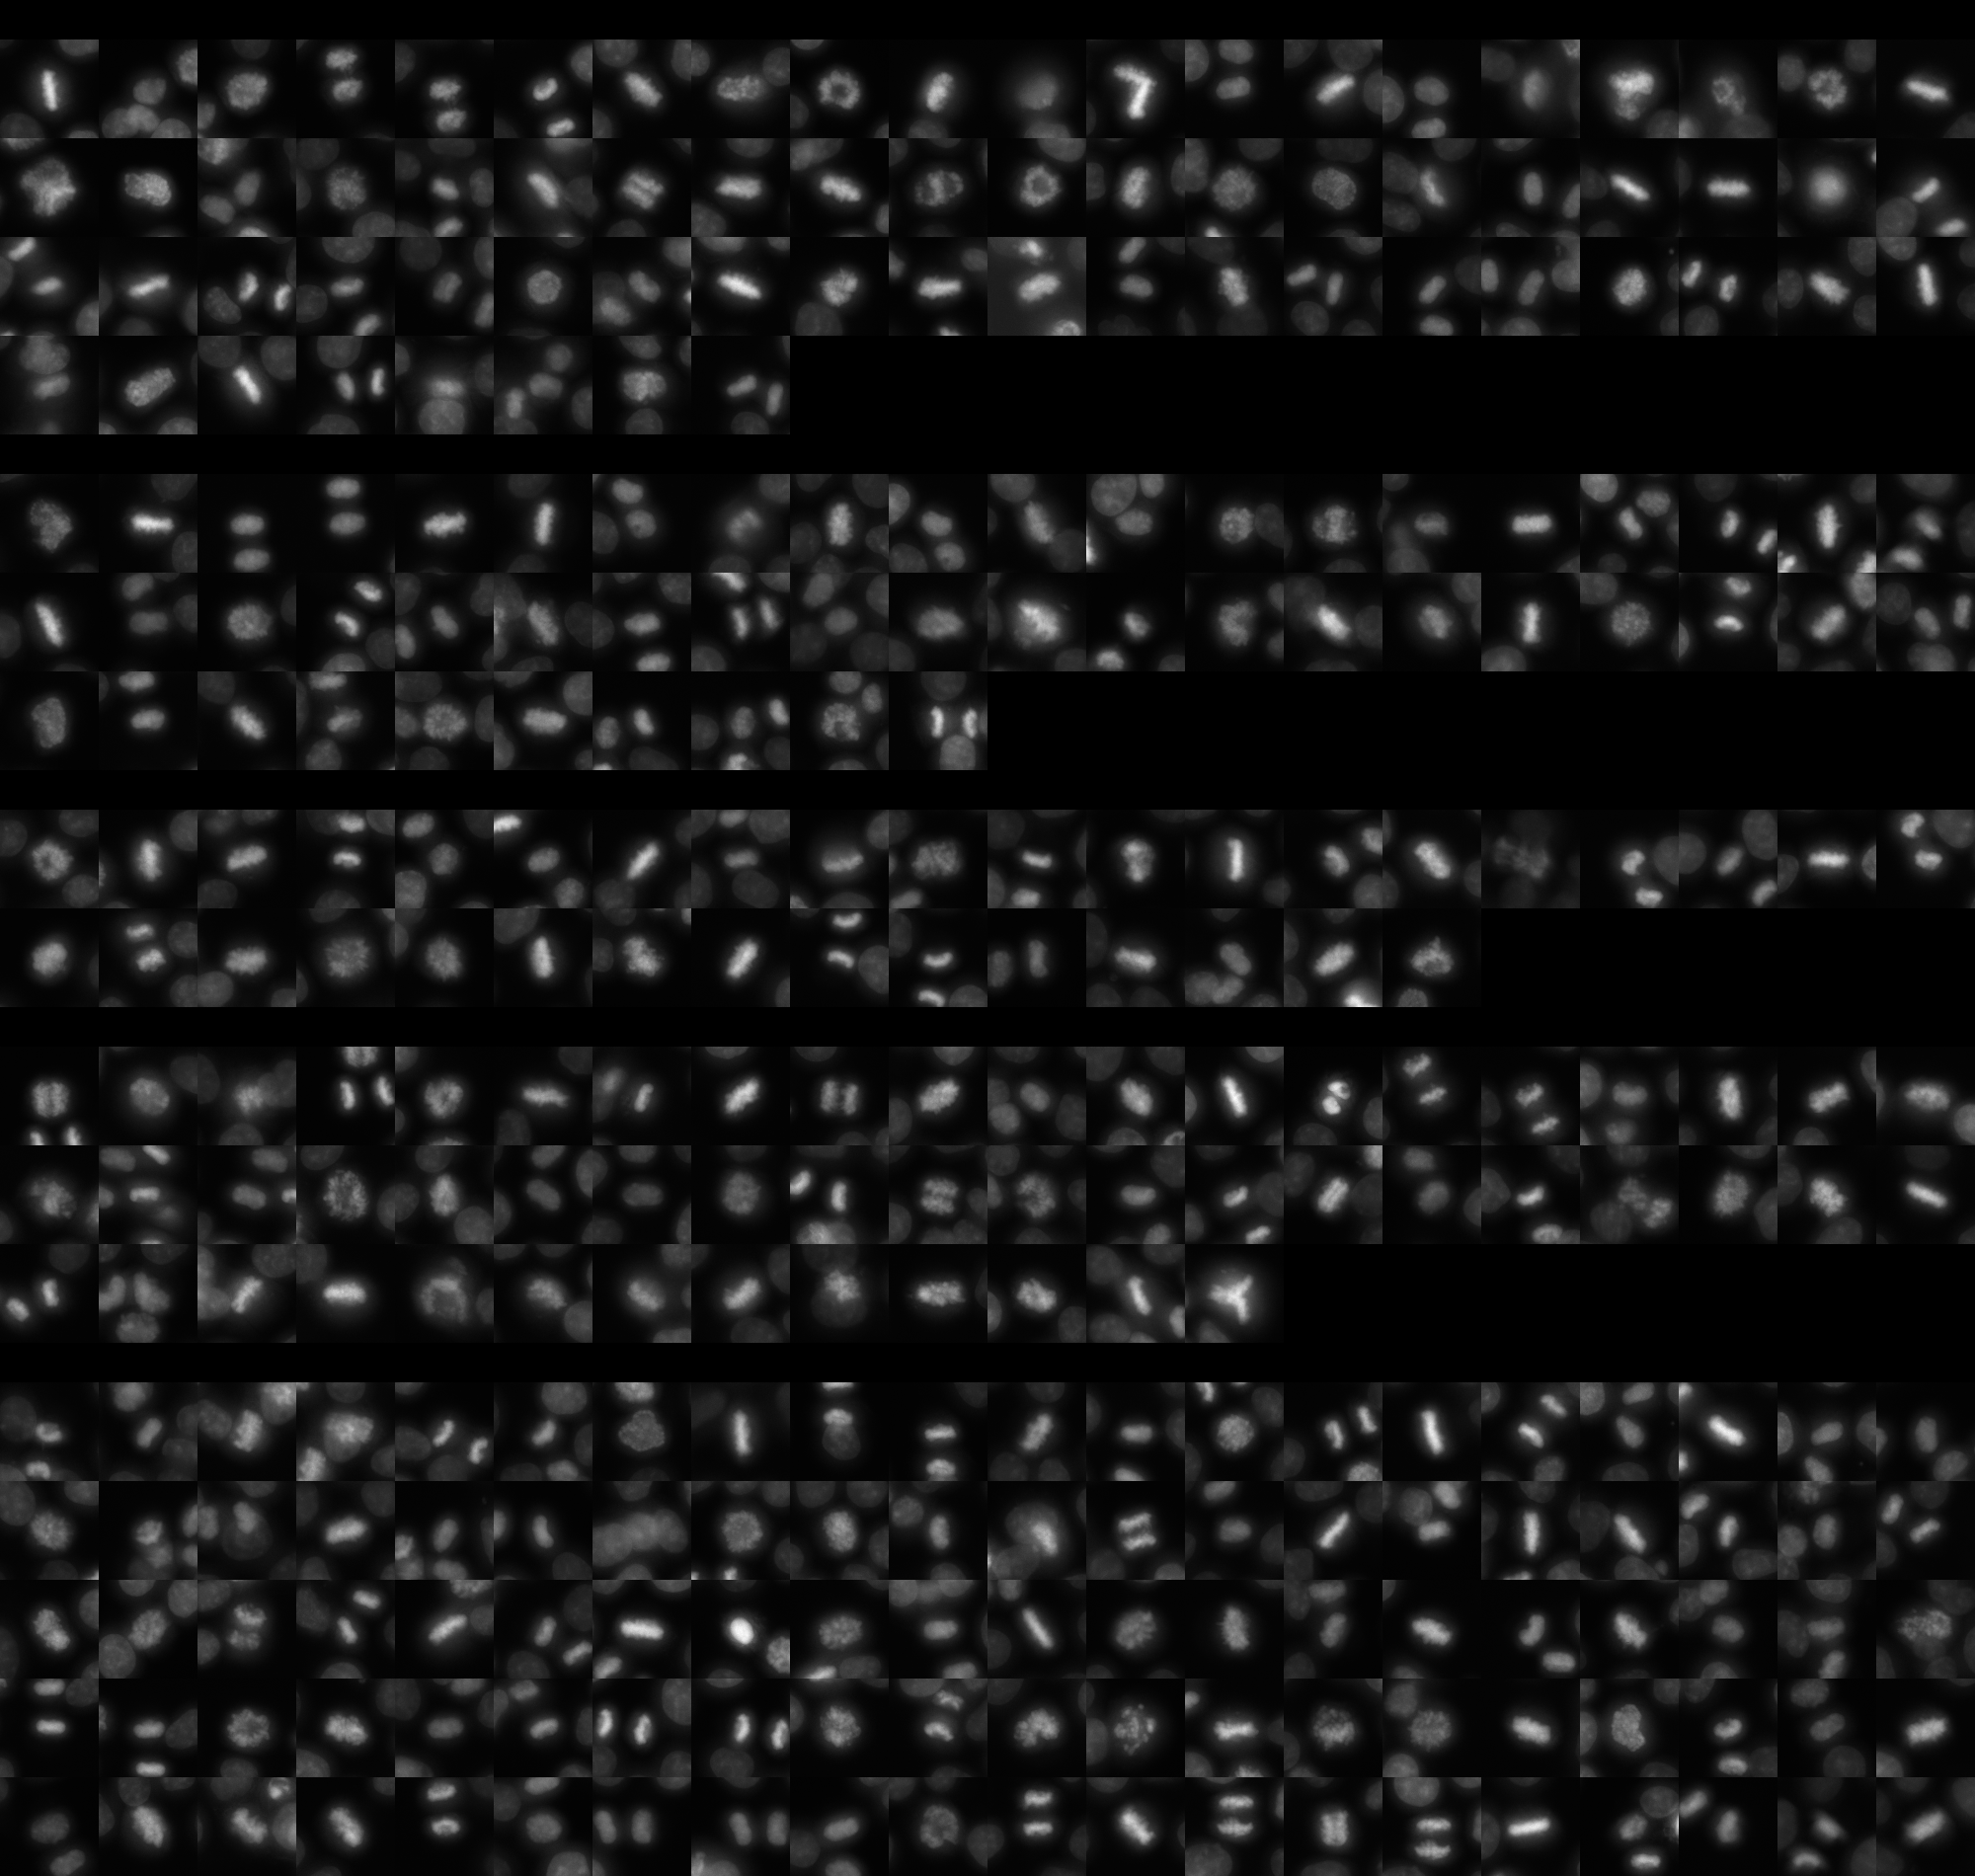
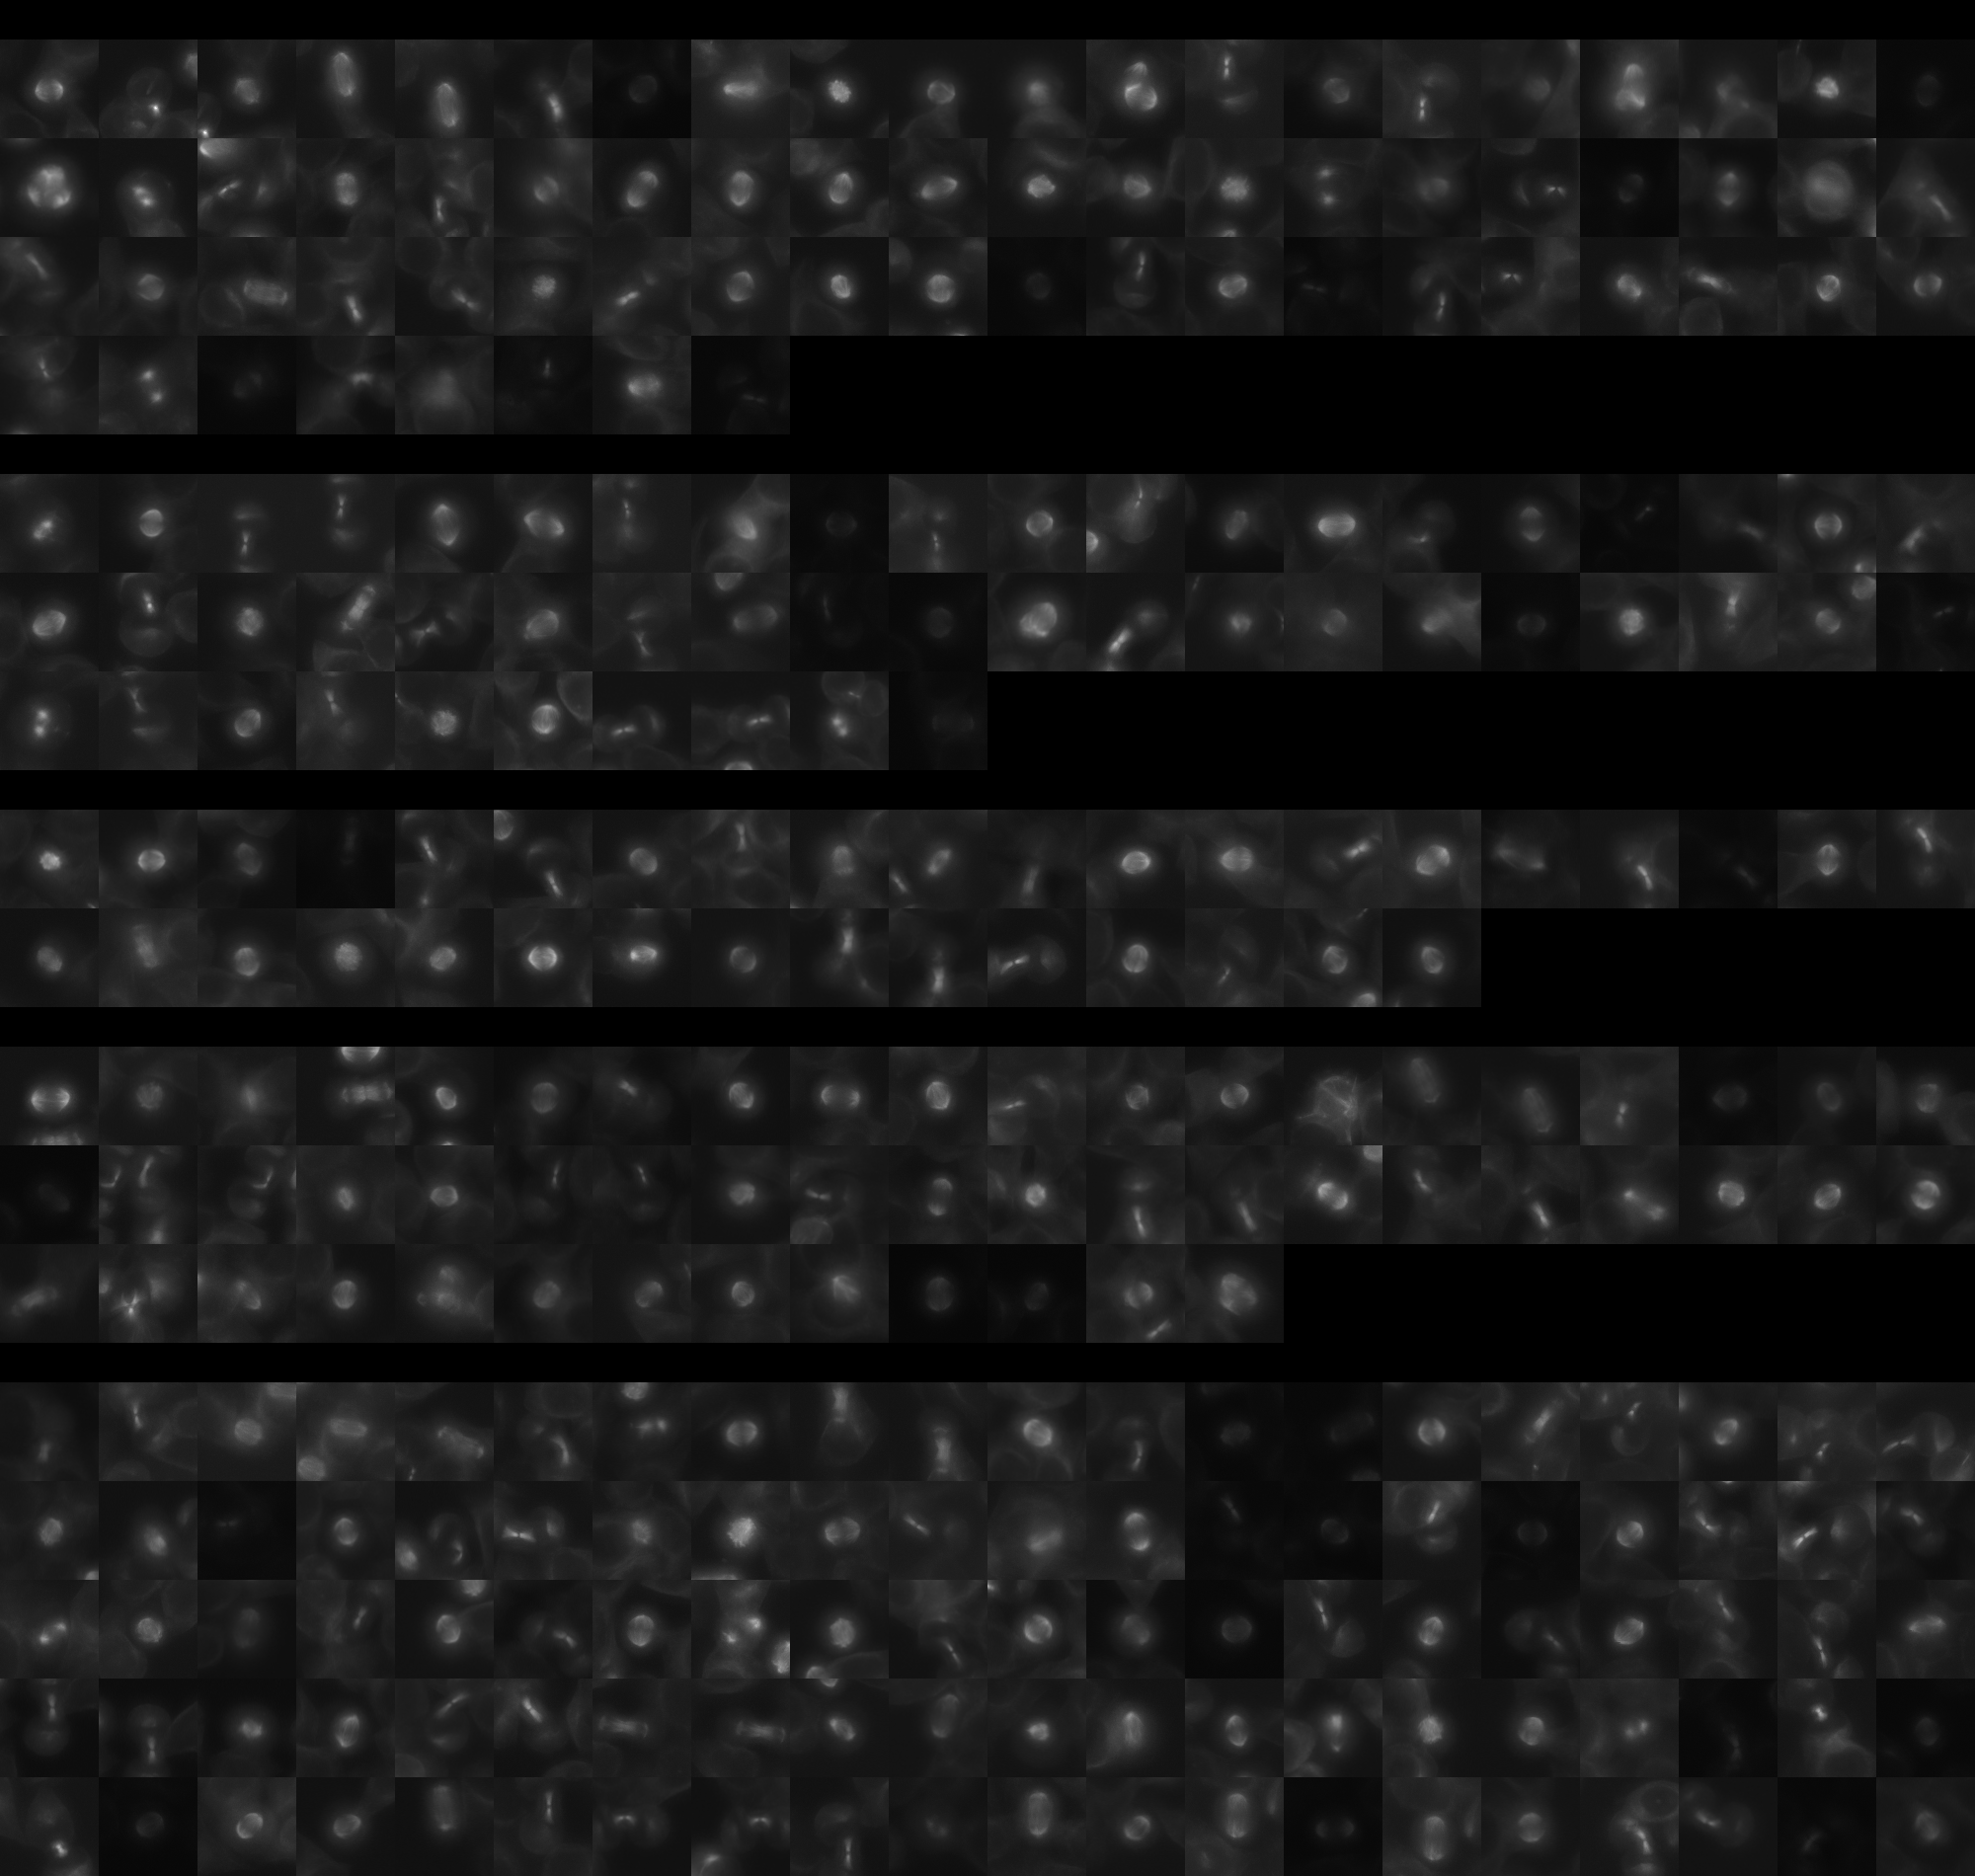
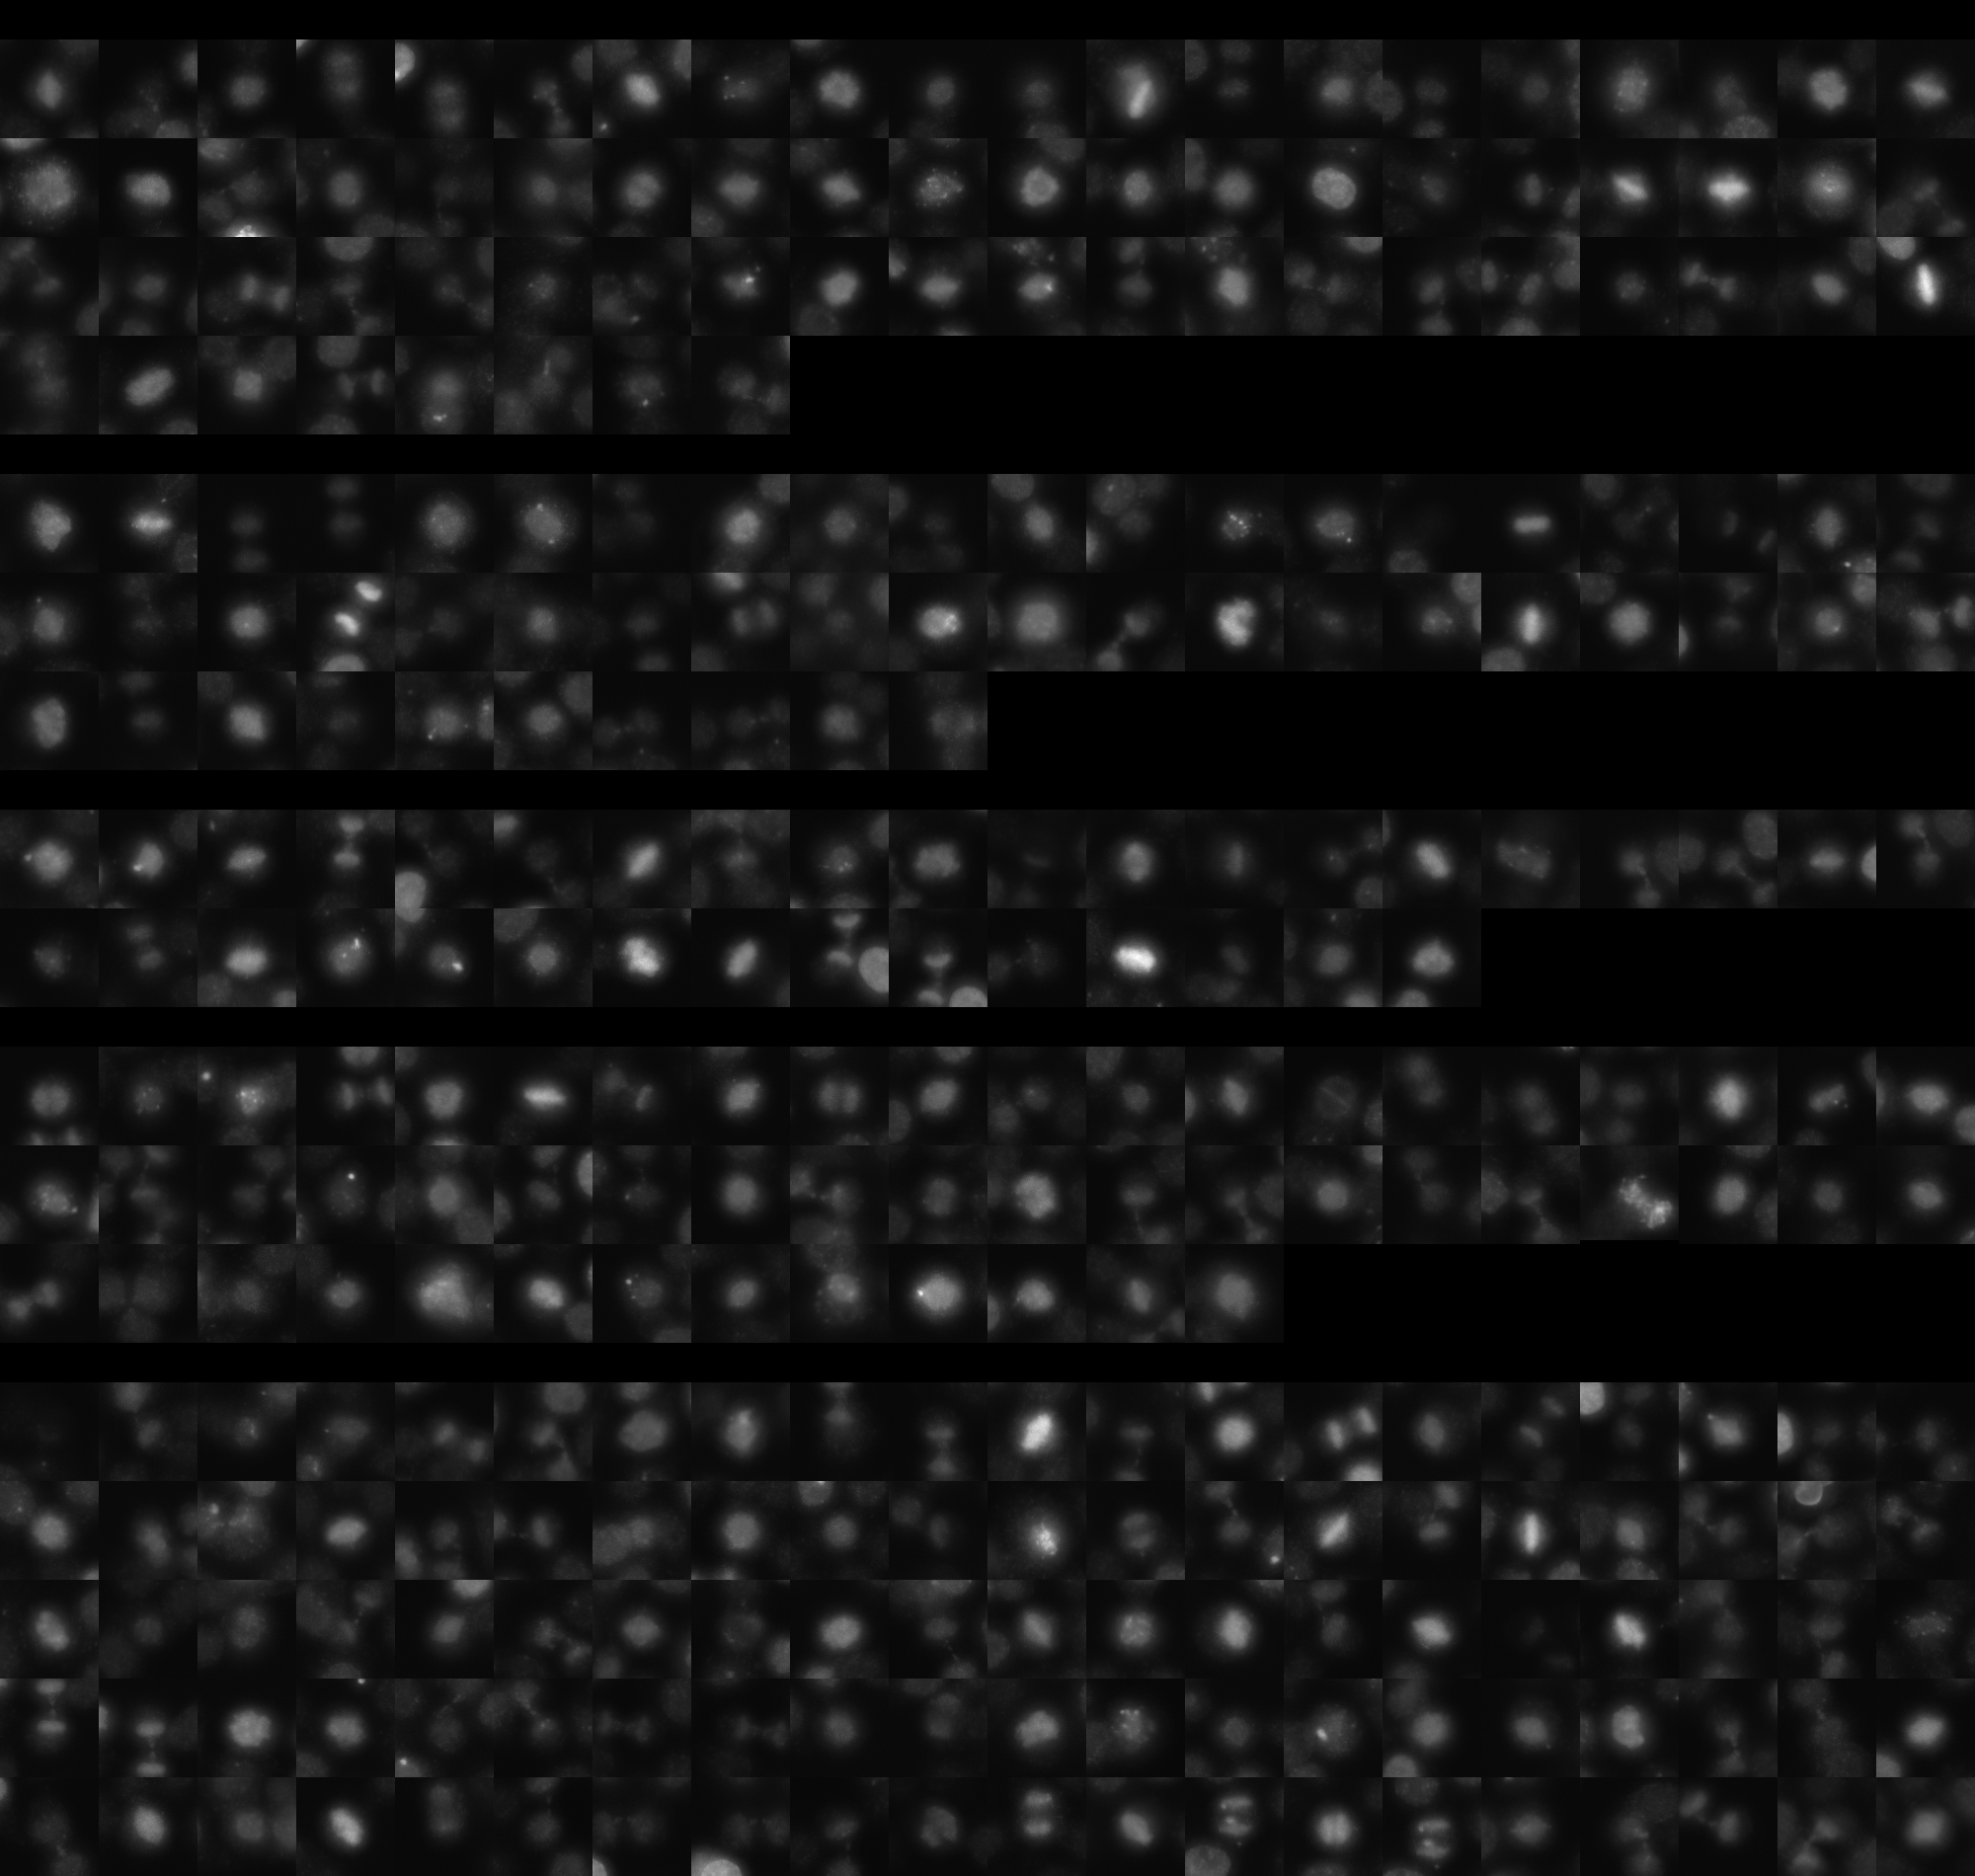
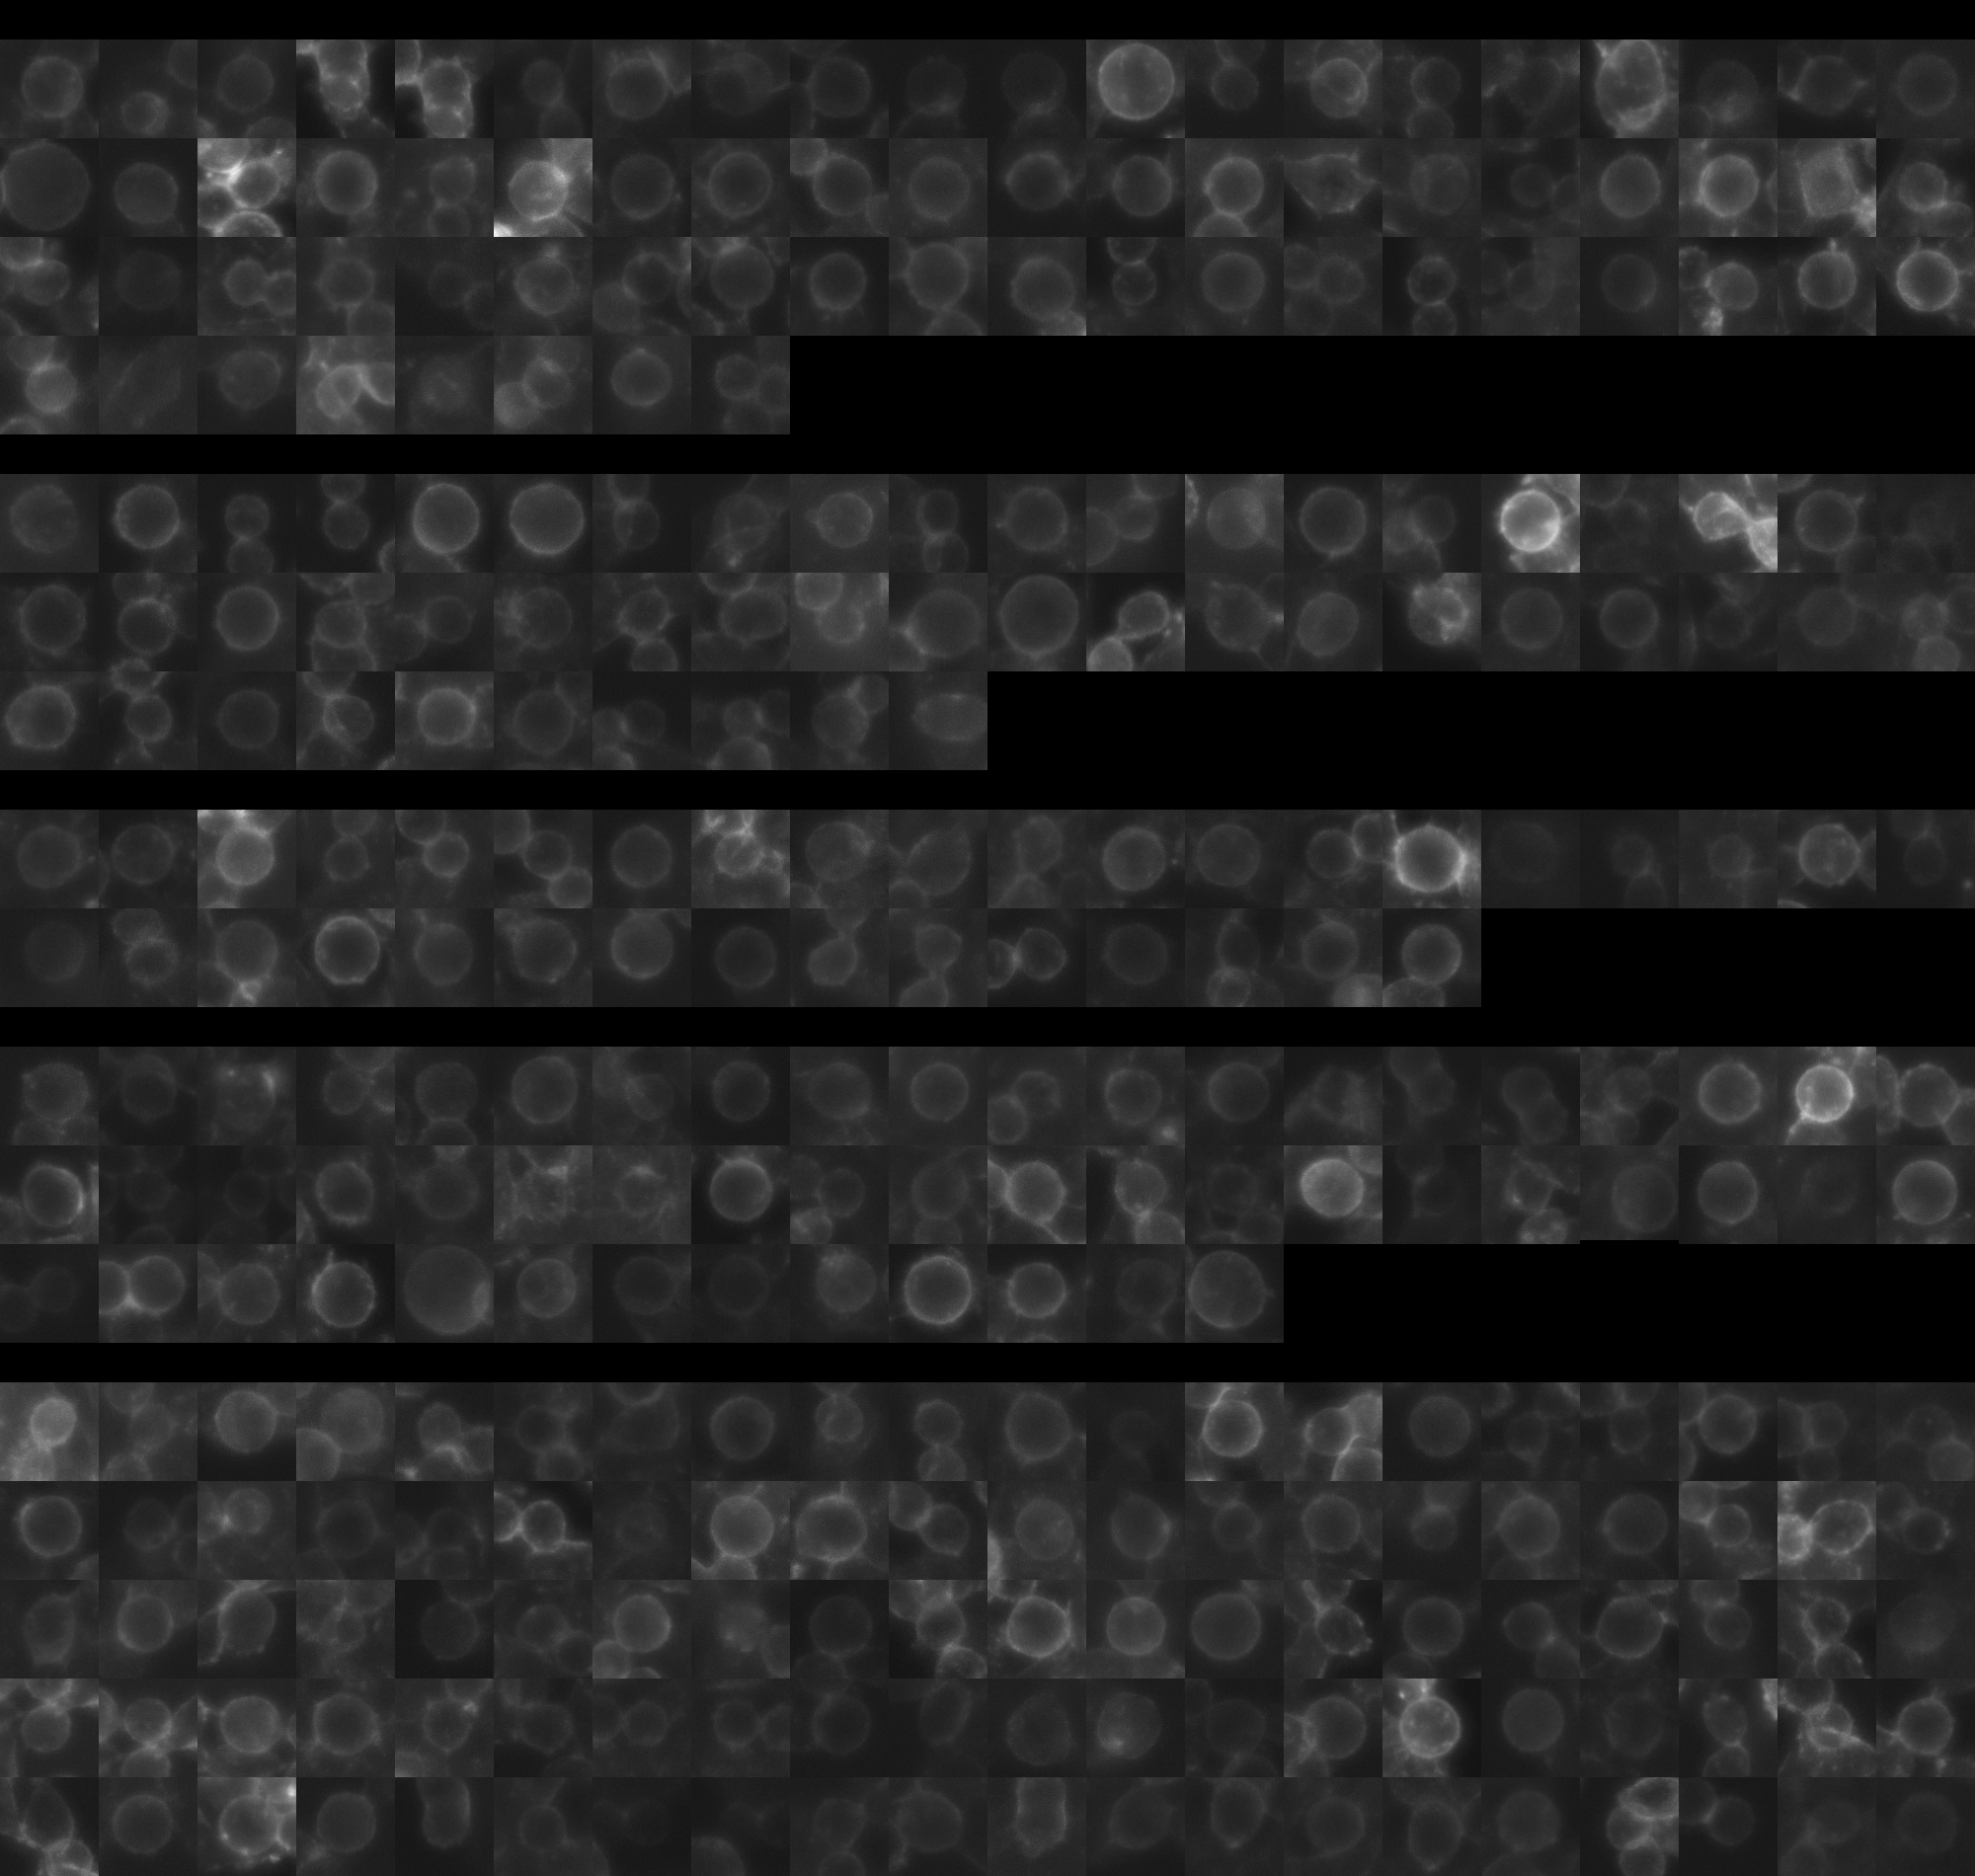
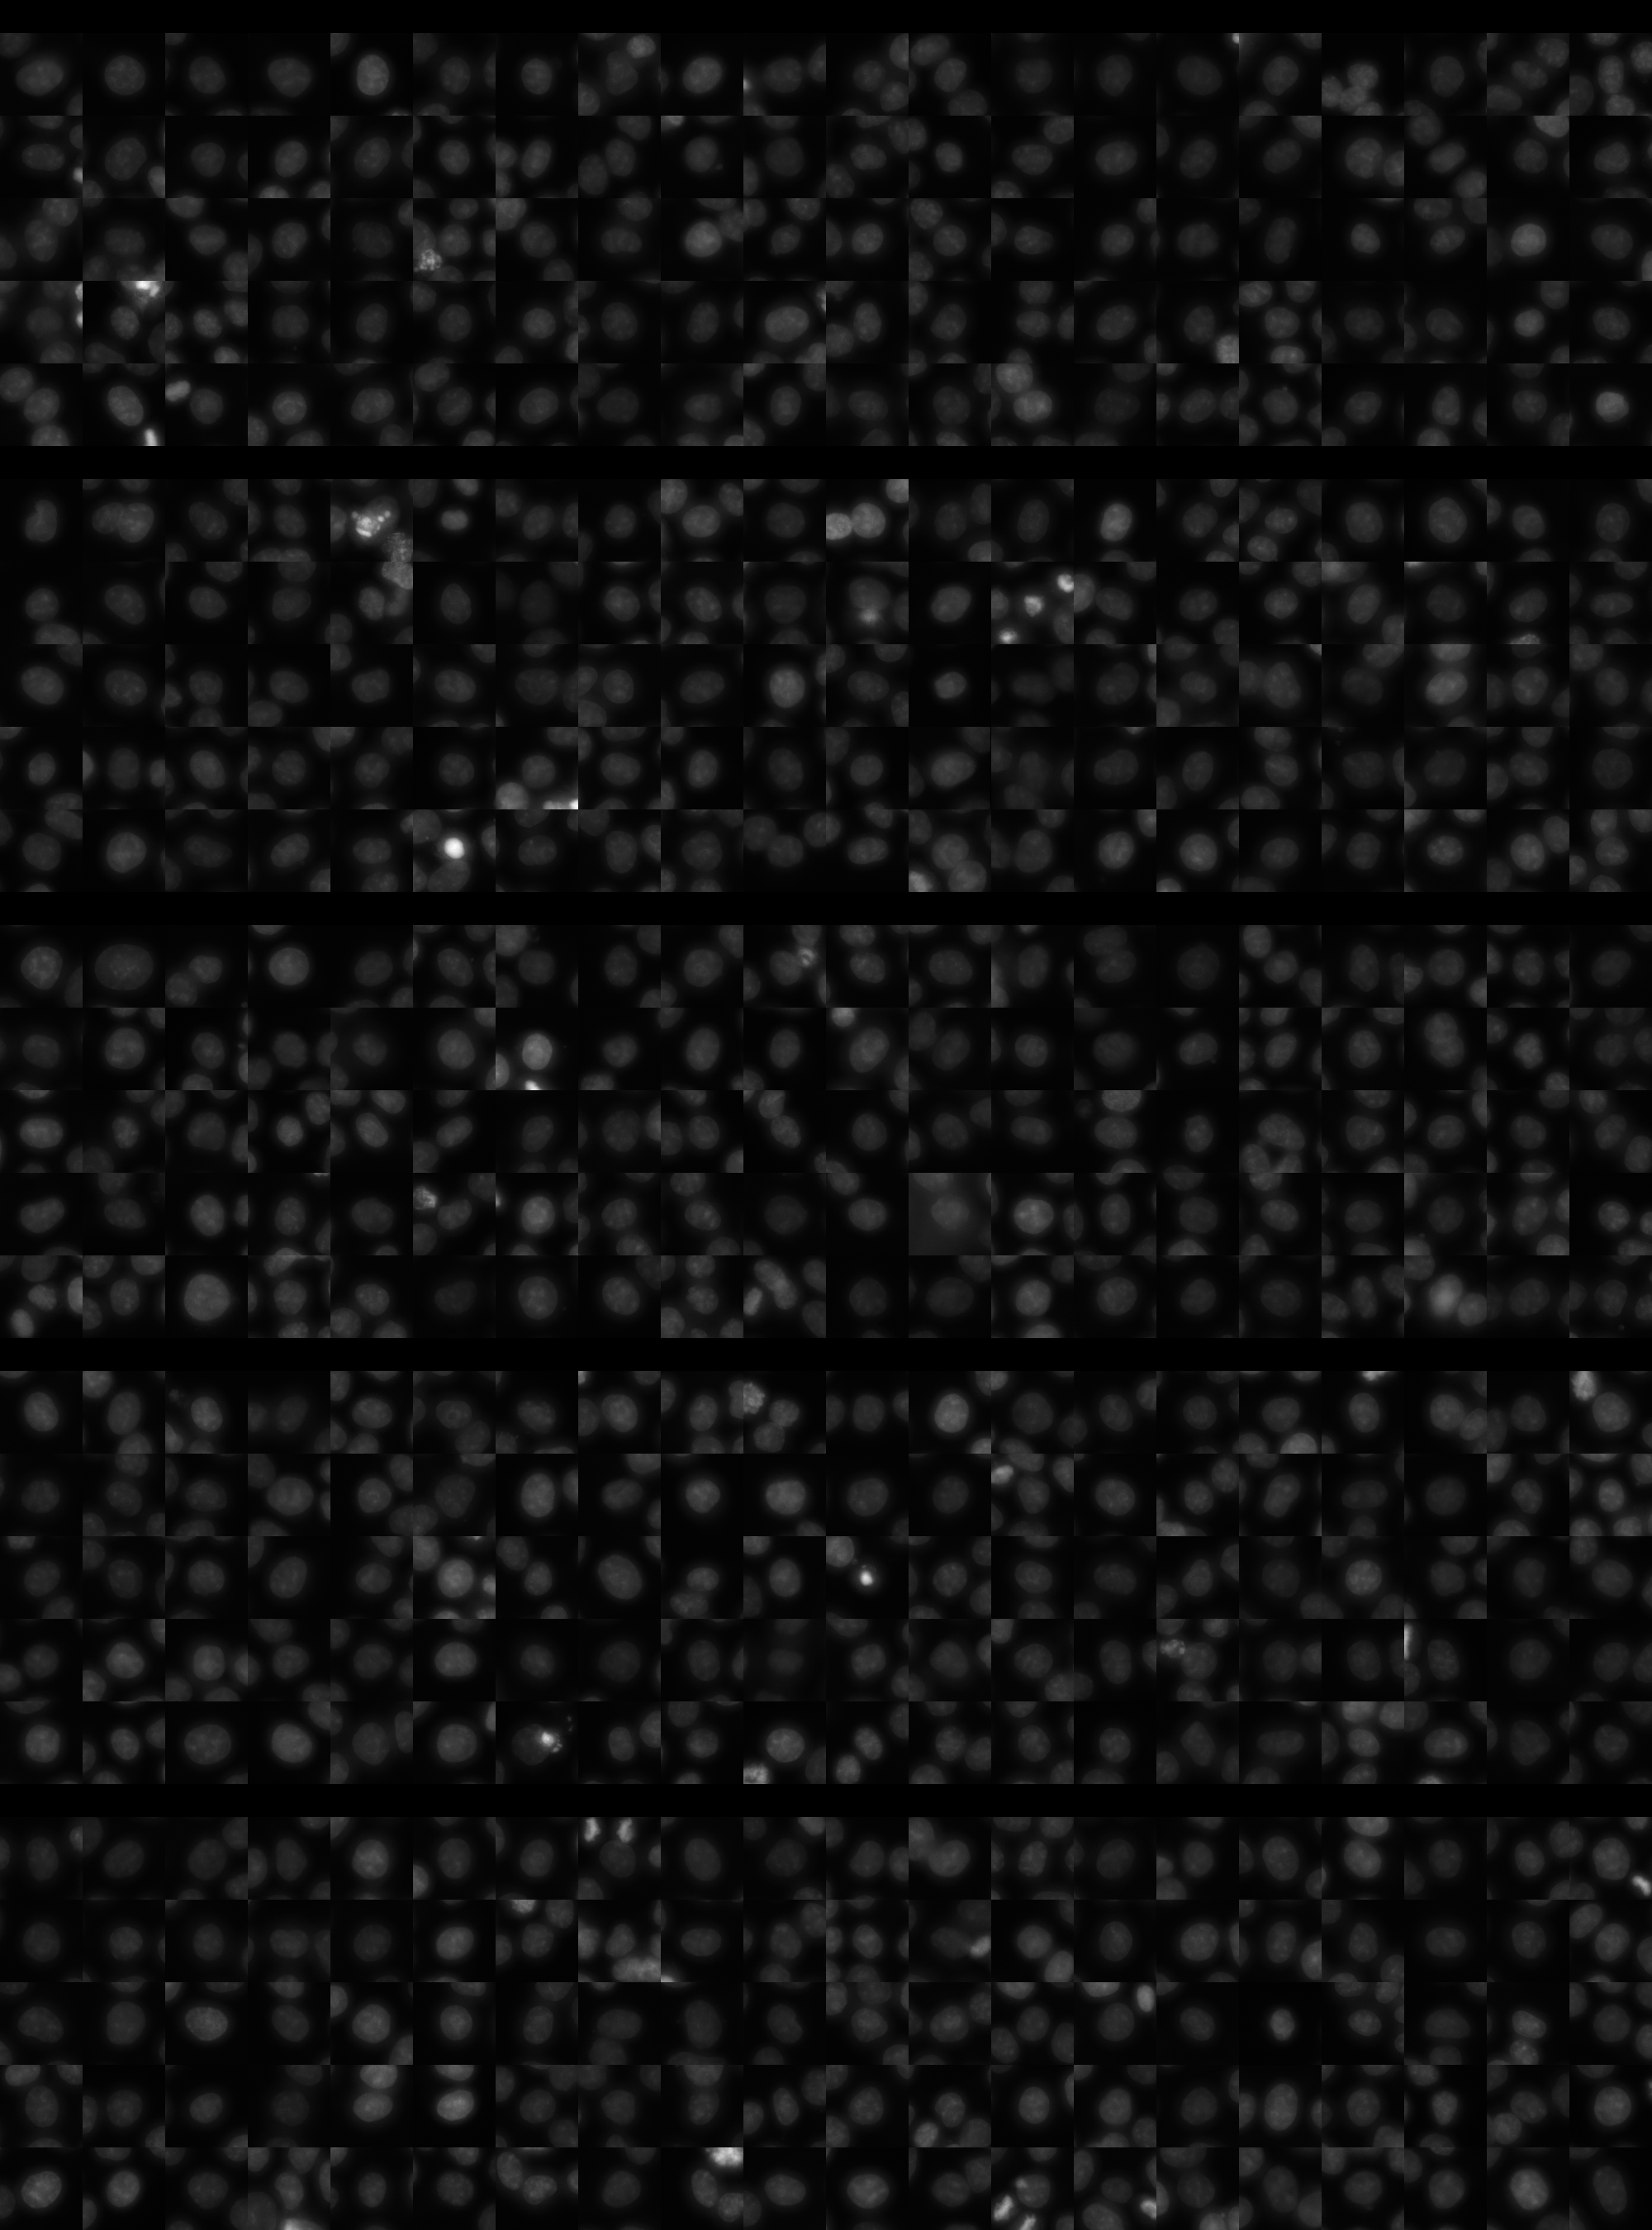
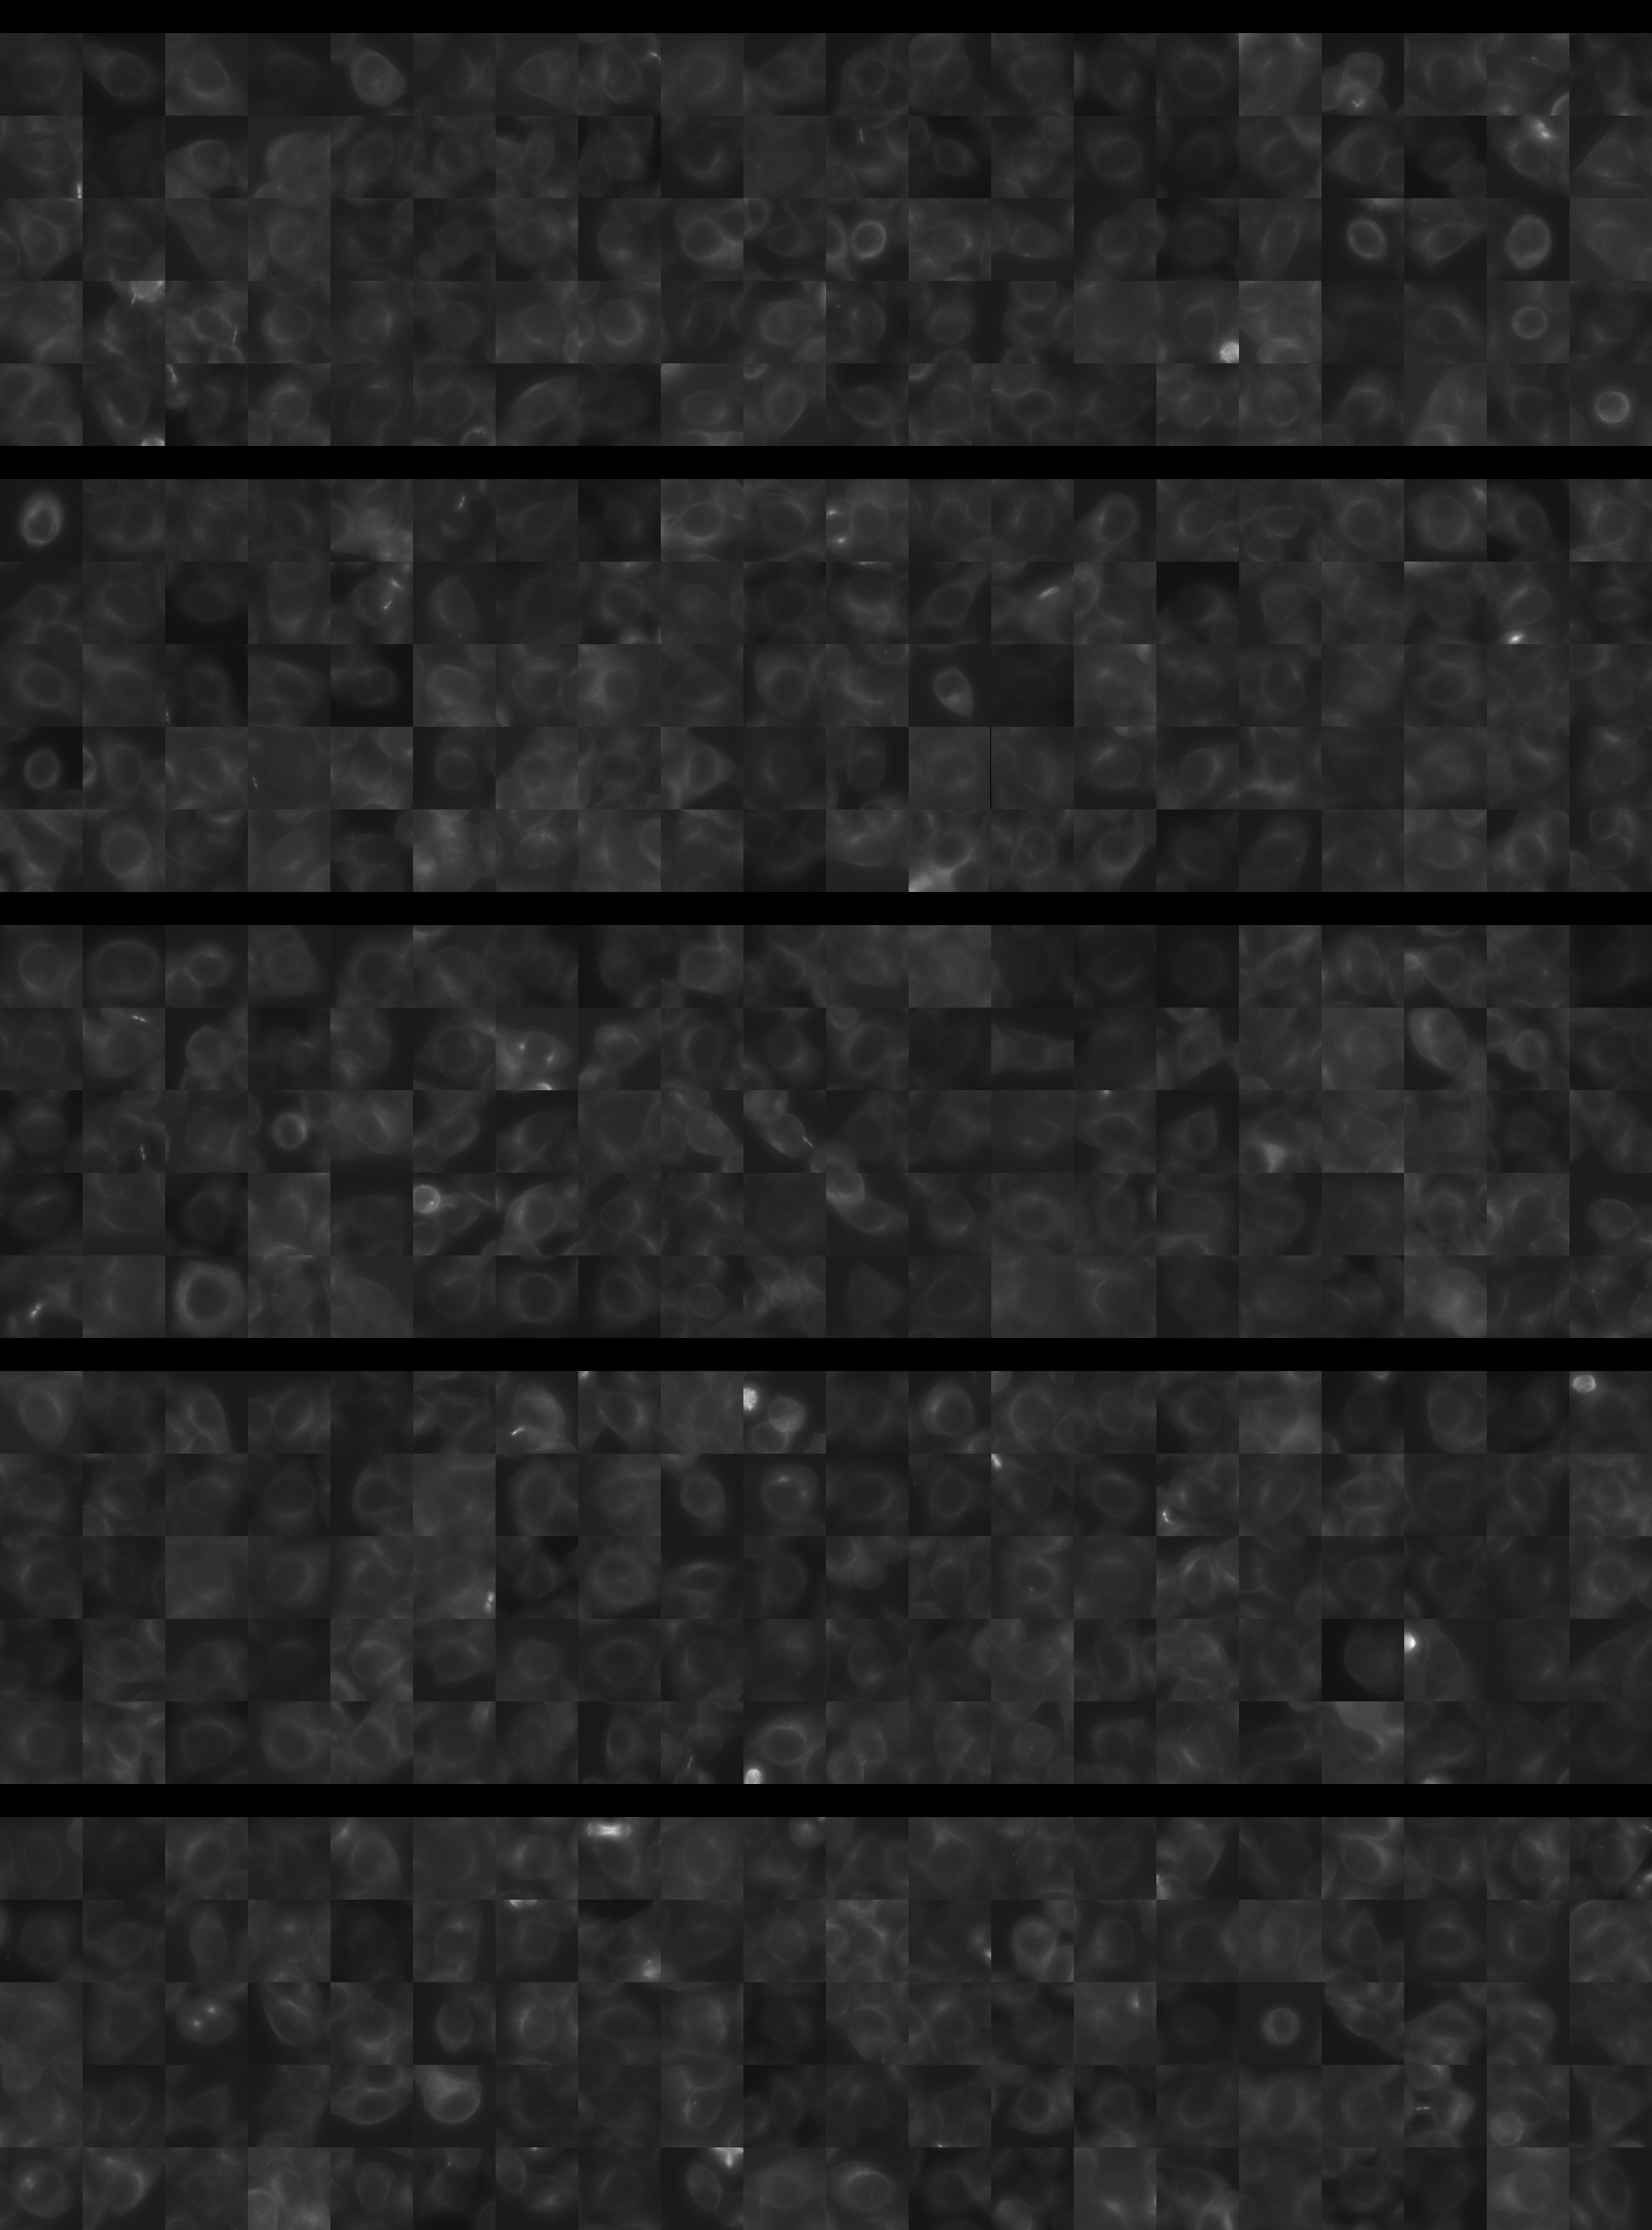
Each montage below shows randomly selected individual cell images for the same target gene separated by sgRNA, along with an example montage of cells expressing a non-targeting negative control sgRNA at the bottom. sgRNA labels in the montages correspond to the numbered sgRNA sequences in the gene info table above. The DNA (blue) and tubulin (green) channels are displayed by default, with gH2AX (grayscale) and actin (yellow) available using the check boxes. Channel brightness, contrast, and opacity are adjustable by clicking the arrow next to the channel name. When only one channel is selected, the display defaults to grayscale. Click the “Zoom” checkbox above the channel controls to enable image zooming (via scrolling) and panning (via click-and-drag).

The cell boxes displayed for this gene are square, 30.36 μm per side for the interphase montage and 30.36 μm per side for the mitotic montage.
Features

Interphase Score Rank FDR q-value
Nucleus DNA Integrated -4.016e-05 3125 of 5322 0.975
Nucleus DNA Mean -2.772e-03 2067 of 5322 0.995
Nucleus gH2AX Mean 0.036 3905 of 5322 0.333
Nucleus DNA - gH2AX Correlation -6.183e-02 2841 of 5322 0.024
Nucleus Shape Area 0.002 3228 of 5322 0.942
Nucleus Shape Eccentricity -2.551e-03 3476 of 5322 0.997
Nucleus Shape Form Factor -9.775e-03 908 of 5322 0.880
Nucleus Shape Solidity -1.185e-03 671 of 5322 0.994
Cell DNA Mass Displacement 0.004 4118 of 5322 0.983
Cell Tubulin Mean -3.677e-02 4012 of 5322 0.451
Cell Tubulin Mass Displacement 0.017 1950 of 5322 0.789
Cell Actin Mean -3.021e-02 3910 of 5322 0.588
Cell Tubulin - Actin Correlation -9.755e-03 4116 of 5322 0.856
Cell DNA - Tubulin Correlation 0.004 3695 of 5322 0.953
Cell Shape Area 0.015 2674 of 5322 0.944
Cell Shape Eccentricity 0.032 1326 of 5322 0.594
Mitotic Score Rank FDR q-value
Nucleus DNA Integrated 0.018 3695 of 5322 0.996
Nucleus DNA Mean -4.865e-02 3698 of 5322 1.000
Nucleus DNA Mass Displacement -6.863e-02 4389 of 5322 0.999
Nucleus DNA Mean Frac 3 0.130 1198 of 5322 1.000
Nucleus gH2AX Mean -2.333e-02 3257 of 5322 1.000
Nucleus gH2AX Mean Frac 0 -8.326e-02 3564 of 5322 1.000
Nucleus Tubulin Mean Frac 0 0.139 1460 of 5322 0.999
Nucleus Tubulin Mean Edge 0.049 2506 of 5322 0.999
Nucleus Tubulin Std Edge 0.004 2516 of 5322 0.999
Nucleus Shape Area 0.082 2911 of 5322 0.990
Nucleus Shape Eccentricity -3.918e-02 2720 of 5322 1.000
Nucleus Shape Form Factor 0.009 1268 of 5322 0.998
Cell Tubulin Mean 0.093 2142 of 5322 0.997
Cell Tubulin Mean Frac 3 0.061 1045 of 5322 0.999
Cell Actin Mean 0.024 2882 of 5322 0.997
Cell Shape Area 0.018 3681 of 5322 1.000
( Reset Zoom )
Brightness
Contrast
Opacity
Brightness
Contrast
Opacity
Brightness
Contrast
Opacity
Brightness
Contrast
Opacity
Brightness
Contrast
Opacity

( Reset Zoom )
Brightness
Contrast
Opacity
Brightness
Contrast
Opacity
Brightness
Contrast
Opacity
Brightness
Contrast
Opacity
Brightness
Contrast
Opacity

MIT Central Accessability