OGT

Gene symbol: OGT
Gene: 8473
Uniprot Function: Catalyzes the transfer of a single N-acetylglucosamine from UDP-GlcNAc to a serine or threonine residue in cytoplasmic and nuclear proteins resulting in their modification with a beta-linked N-acetylglucosamine (O-GlcNAc) (PubMed:26678539, PubMed:23103939, PubMed:21240259, PubMed:21285374, PubMed:15361863). Glycosylates a large and diverse number of proteins including histone H2B, AKT1, EZH2, PFKL, KMT2E/MLL5, MAPT/TAU and HCFC1. Can regulate their cellular processes via cross-talk between glycosylation and phosphorylation or by affecting proteolytic processing (PubMed:21285374). Probably by glycosylating KMT2E/MLL5, stabilizes KMT2E/MLL5 by preventing its ubiquitination (PubMed:26678539). Involved in insulin resistance in muscle and adipocyte cells via glycosylating insulin signaling components and inhibiting the 'Thr-308' phosphorylation of AKT1, enhancing IRS1 phosphorylation and attenuating insulin signaling (By similarity). Involved in glycolysis regulation by mediating glycosylation of 6-phosphofructokinase PFKL, inhibiting its activity (PubMed:22923583). Component of a THAP1/THAP3-HCFC1-OGT complex that is required for the regulation of the transcriptional activity of RRM1. Plays a key role in chromatin structure by mediating O-GlcNAcylation of 'Ser-112' of histone H2B: recruited to CpG-rich transcription start sites of active genes via its interaction with TET proteins (TET1, TET2 or TET3) (PubMed:22121020, PubMed:23353889). As part of the NSL complex indirectly involved in acetylation of nucleosomal histone H4 on several lysine residues (PubMed:20018852). O-GlcNAcylation of 'Ser-75' of EZH2 increases its stability, and facilitating the formation of H3K27me3 by the PRC2/EED-EZH2 complex (PubMed:24474760). Regulates circadian oscillation of the clock genes and glucose homeostasis in the liver. Stabilizes clock proteins ARNTL/BMAL1 and CLOCK through O-glycosylation, which prevents their ubiquitination and subsequent degradation. Promotes the CLOCK-ARNTL/BMAL1-mediated transcription of genes in the negative loop of the circadian clock such as PER1/2 and CRY1/2 (PubMed:12150998, PubMed:19451179, PubMed:20018868, PubMed:20200153, PubMed:21285374, PubMed:15361863). O-glycosylates HCFC1 and regulates its proteolytic processing and transcriptional activity (PubMed:21285374, PubMed:28584052, PubMed:28302723). Regulates mitochondrial motility in neurons by mediating glycosylation of TRAK1 (By similarity). Glycosylates HOXA1 (By similarity). O-glycosylates FNIP1 (PubMed:30699359).
Mitotic Index 0.028
Interphase Cluster: #104 (23 genes)
Mitotic Cluster: #117 (23 genes)
sgRNA 1: CTATACACTTCCAGTGTCGA (interphase cells: 1927, mitotic cells: 51)
sgRNA 2: GAAGAAGTTGGTCAGTATTG (interphase cells: 1191, mitotic cells: 41)
sgRNA 3: GCTCCAGATGGCGTCTTCCG (interphase cells: 1529, mitotic cells: 43)
sgRNA 4: TGGCAATAGACACCTACAGG (interphase cells: 1299, mitotic cells: 36)

Interphase Cluster

Mitotic Cluster

Overview

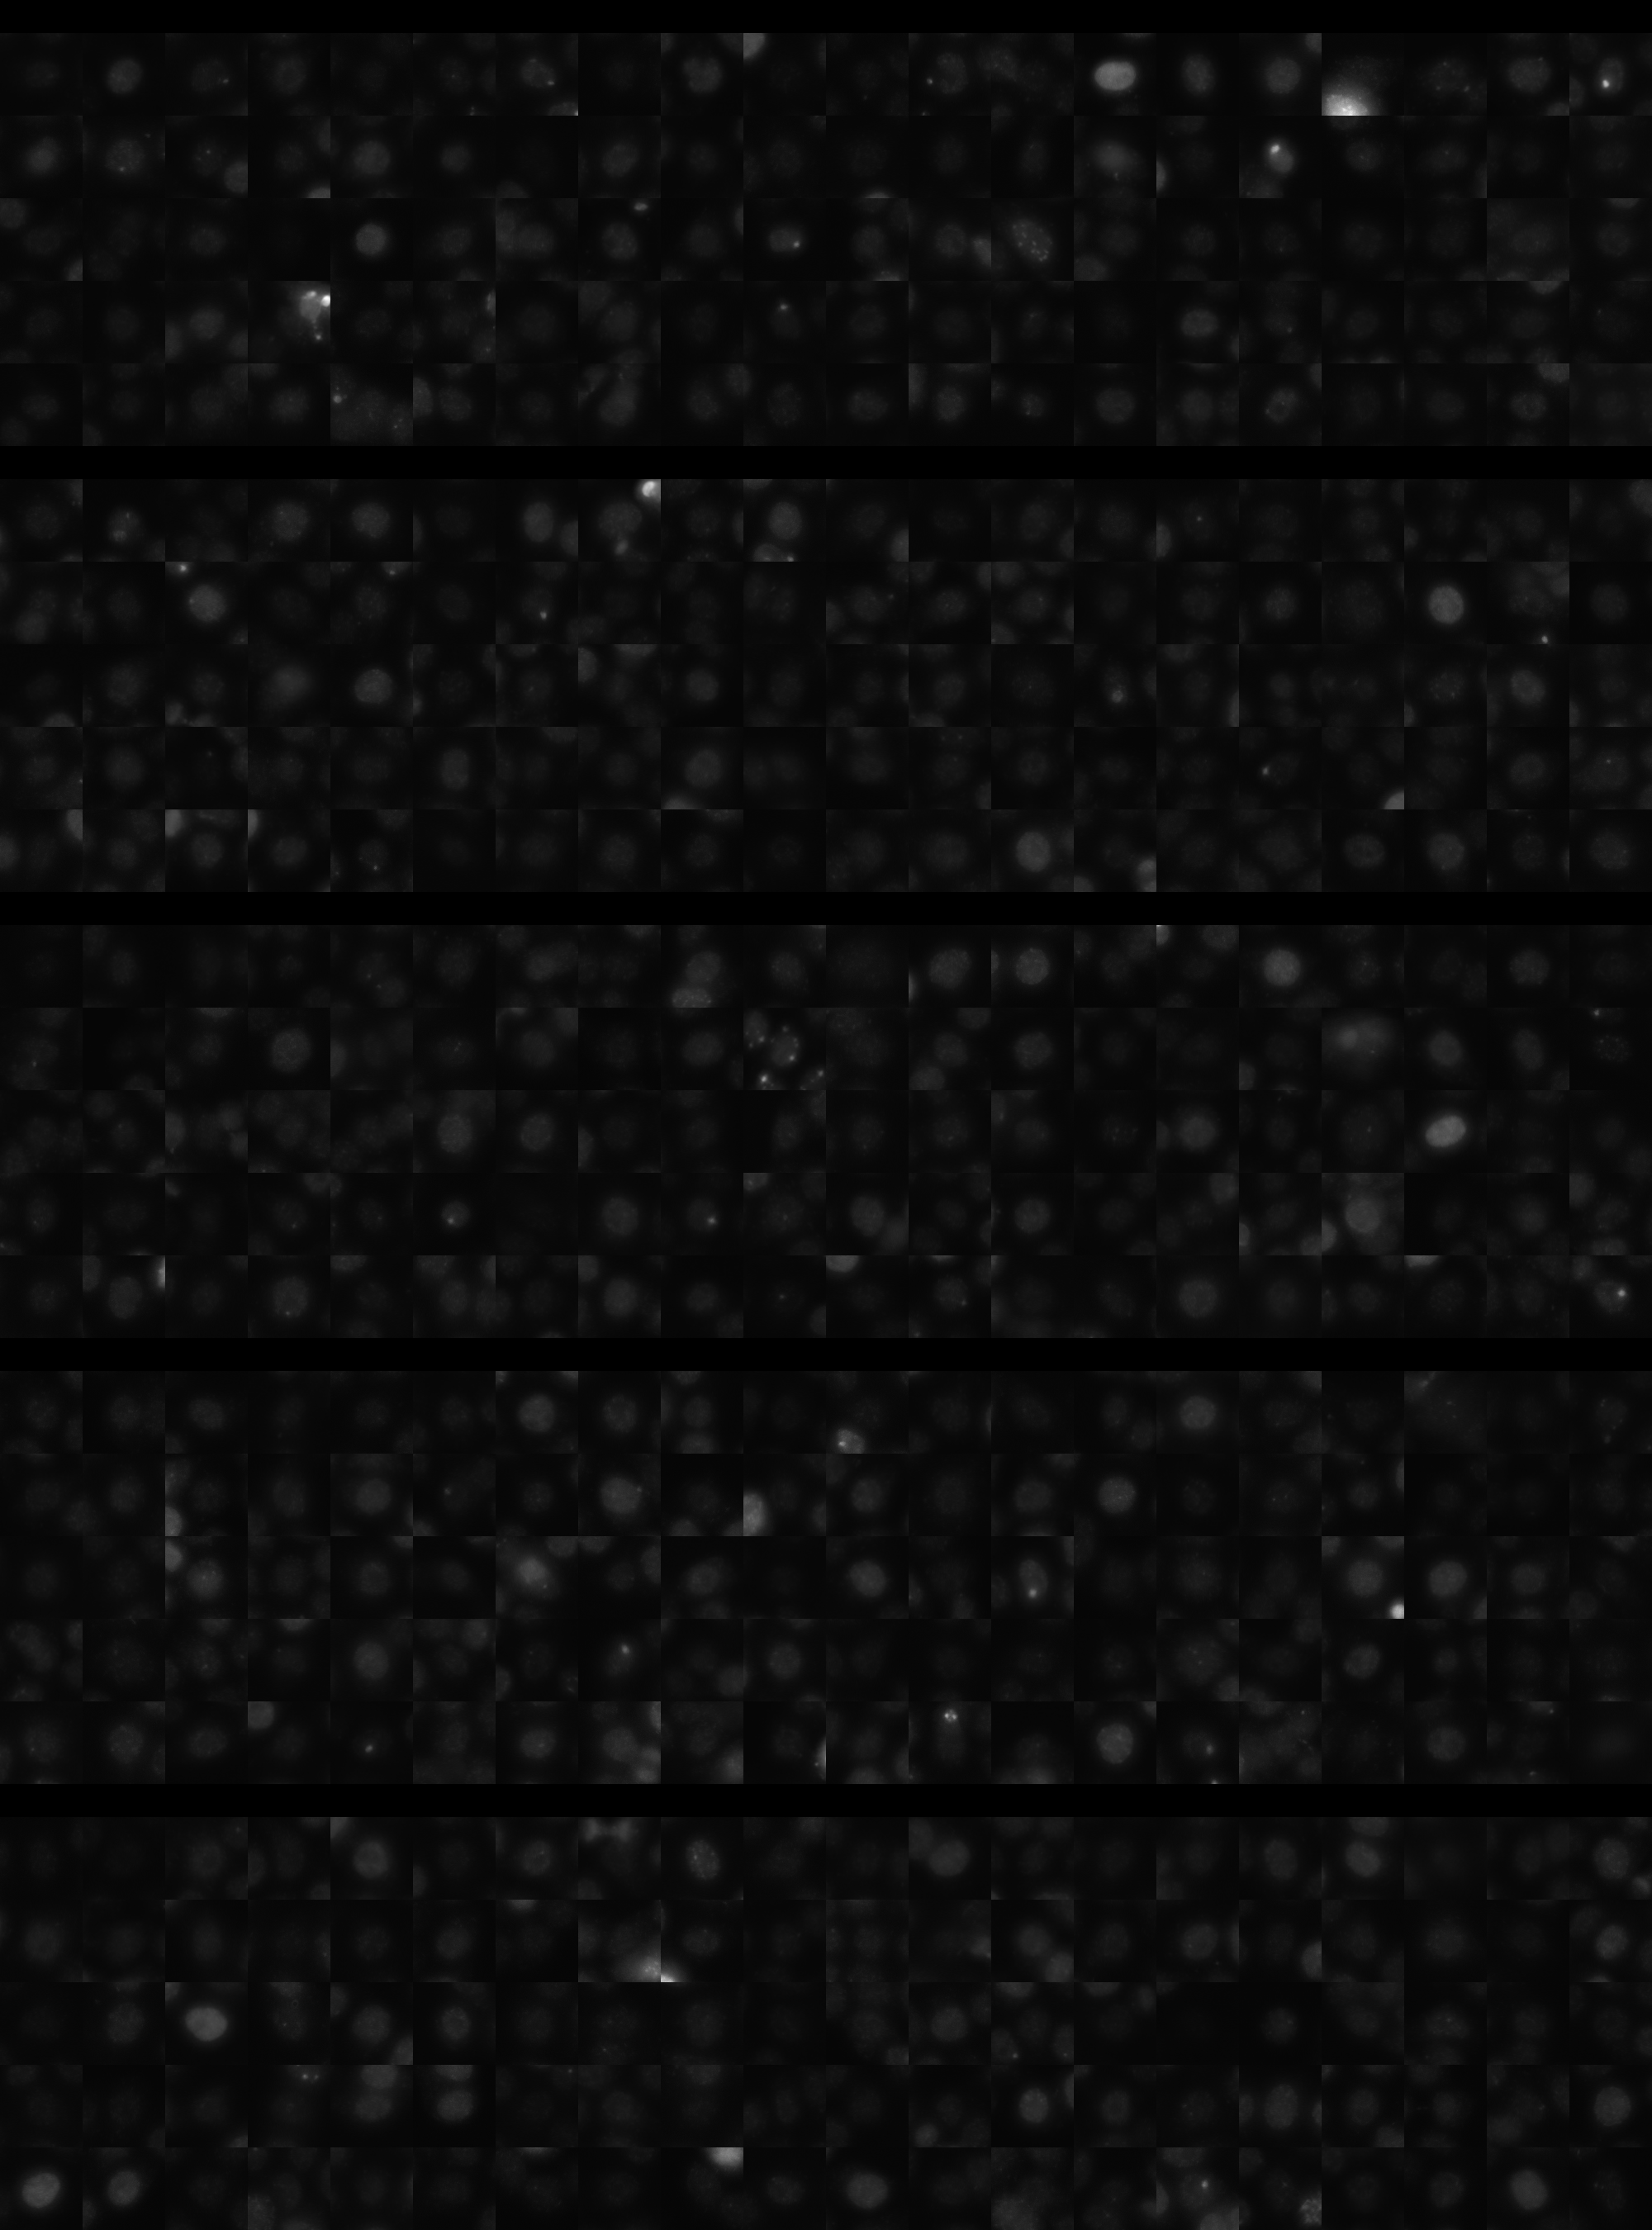
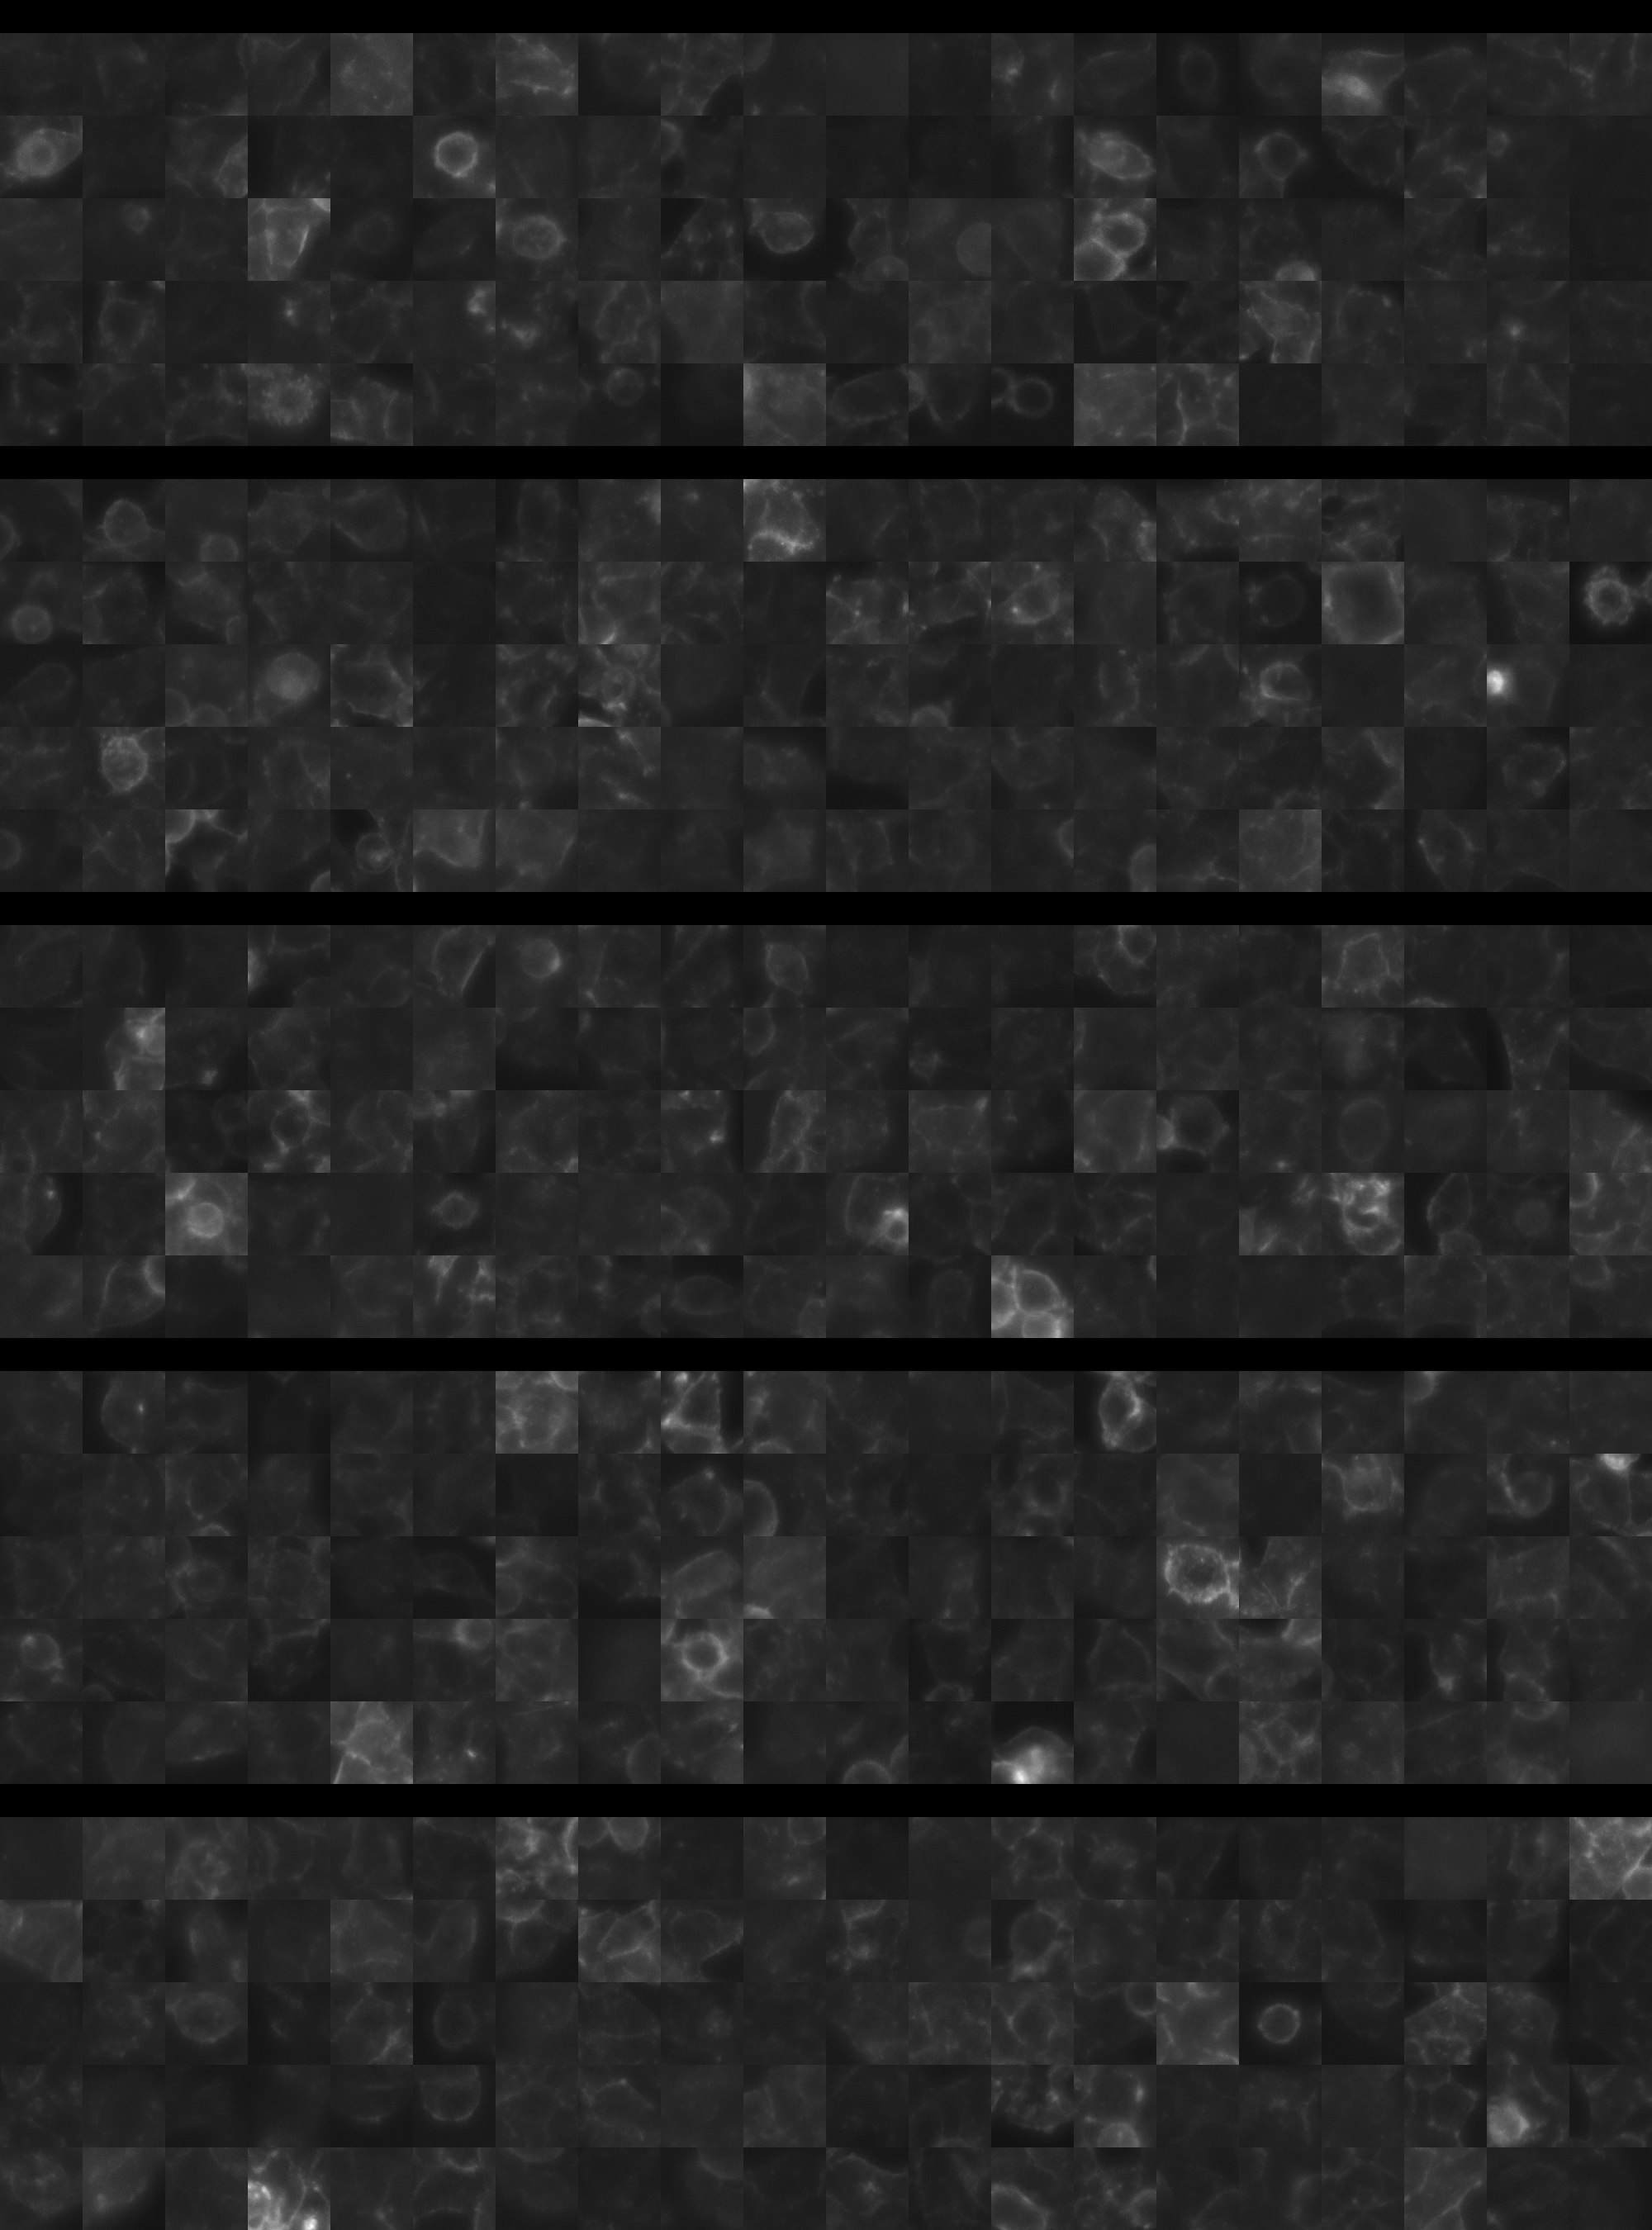
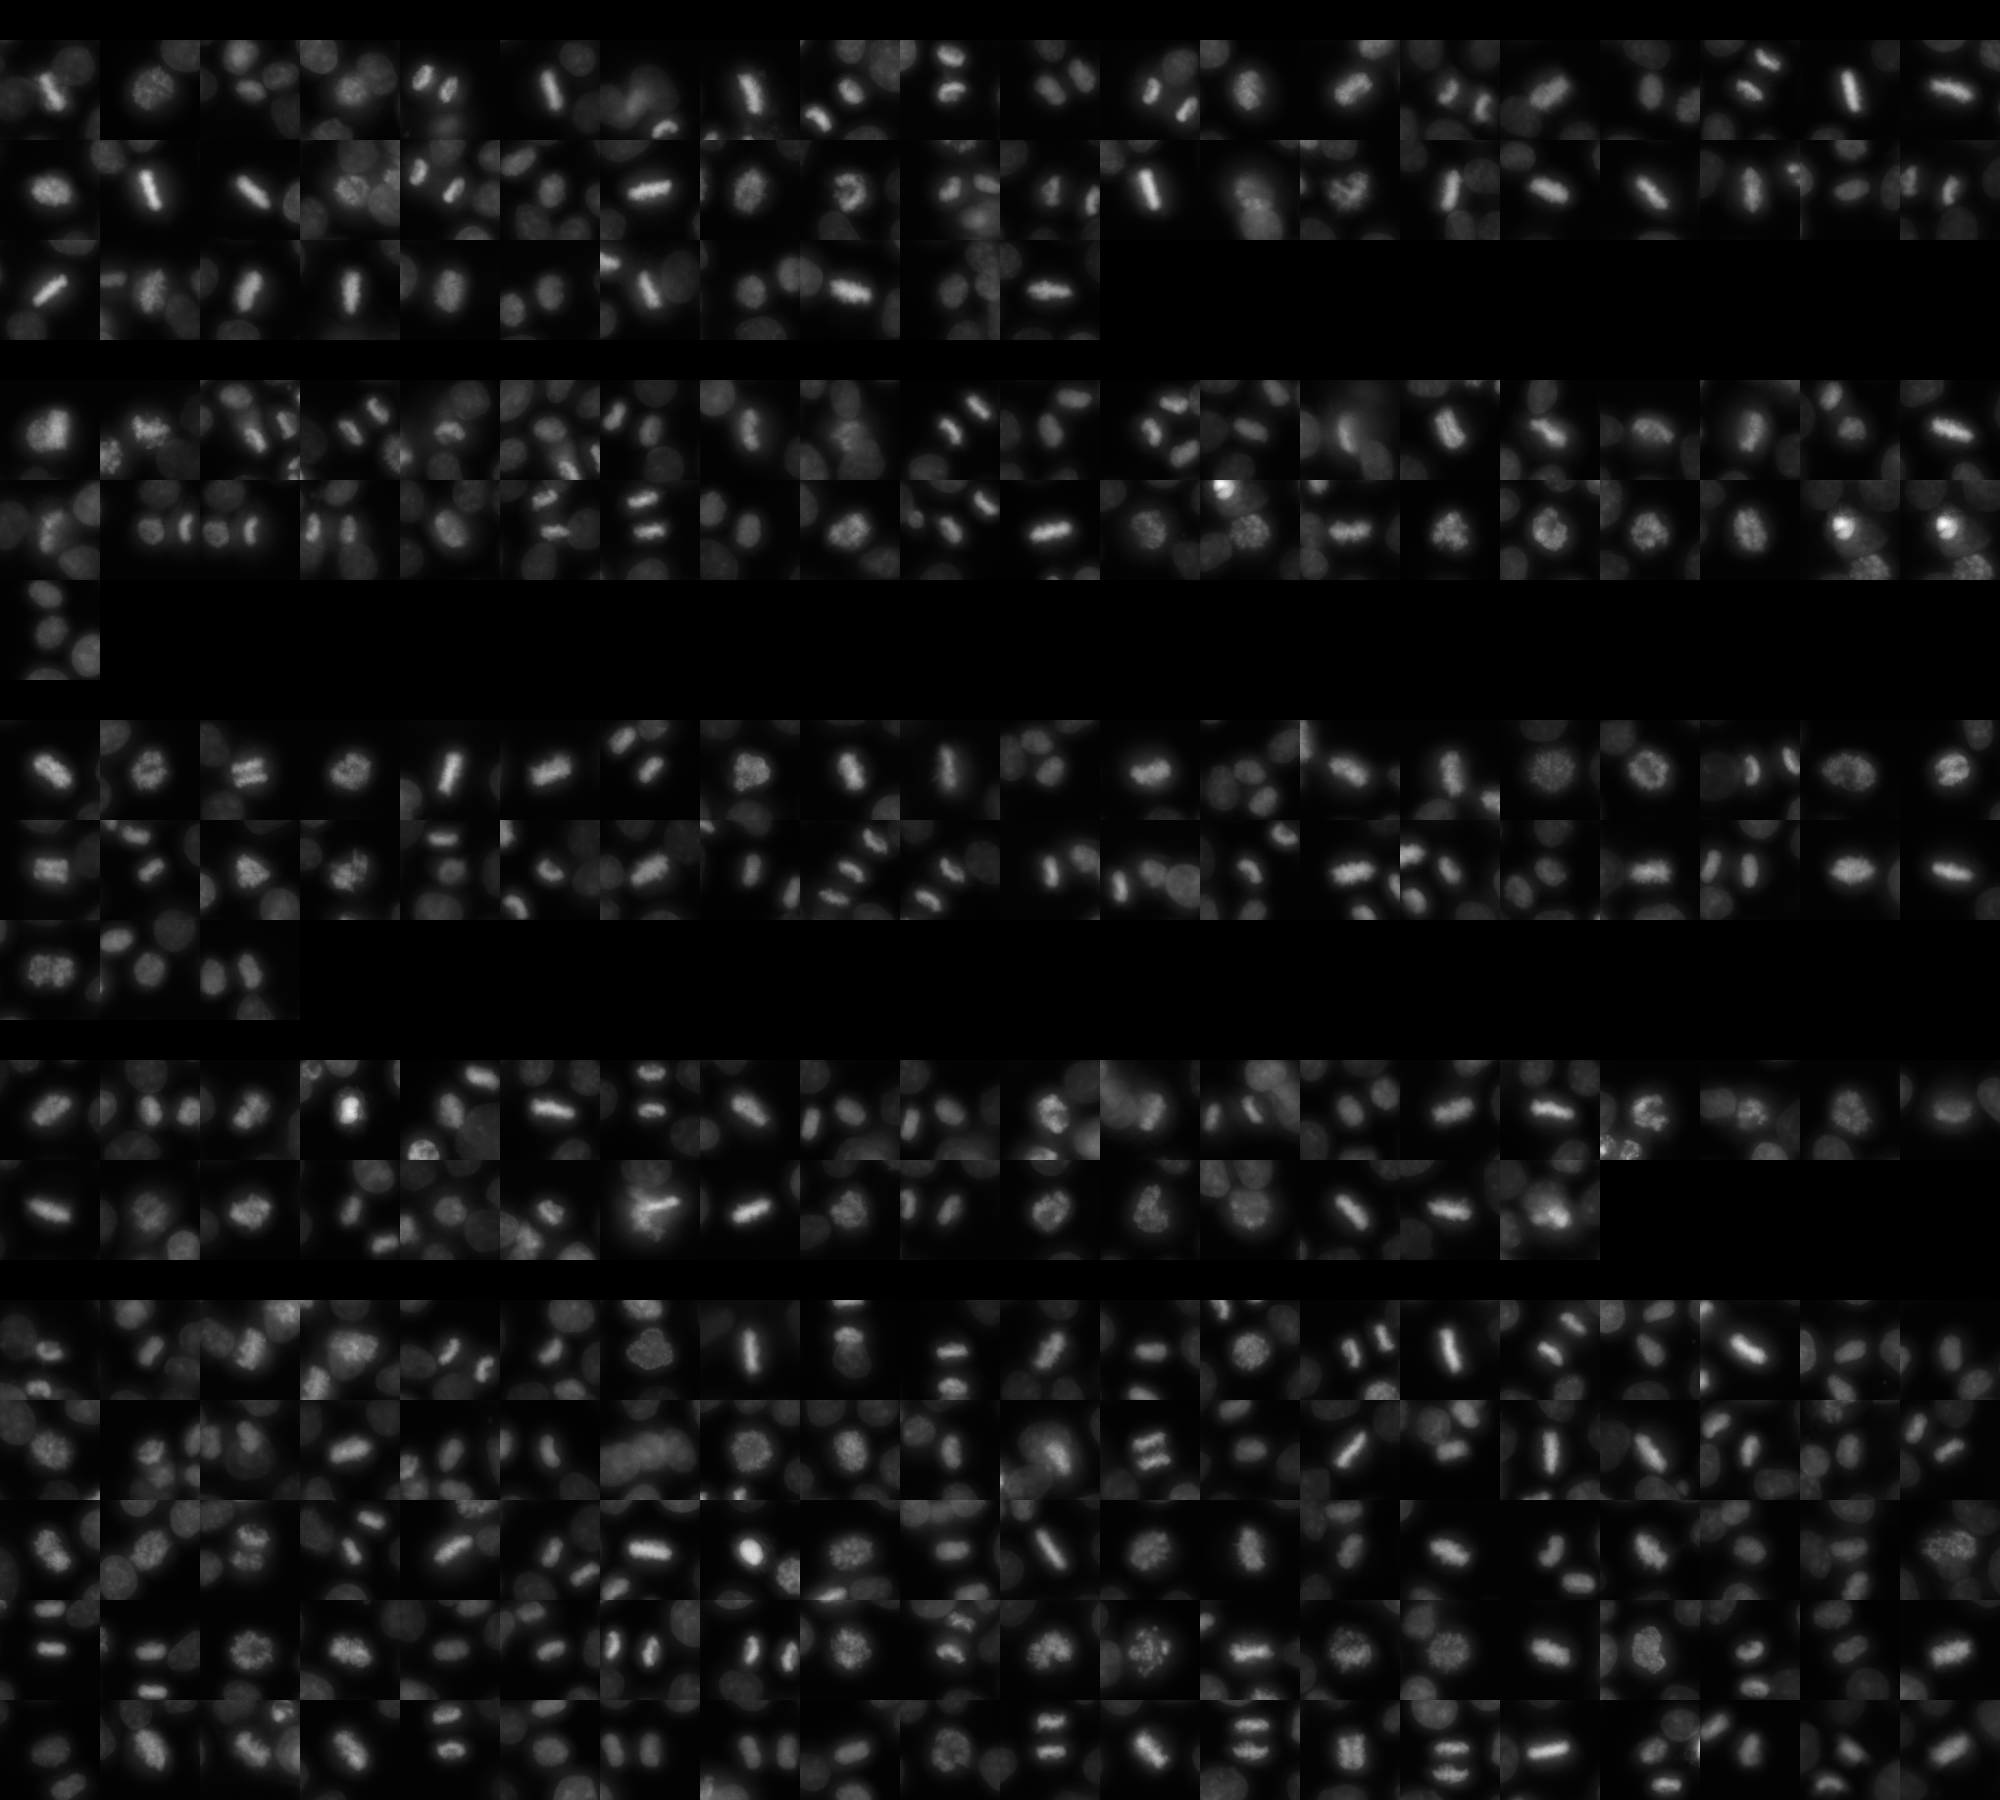
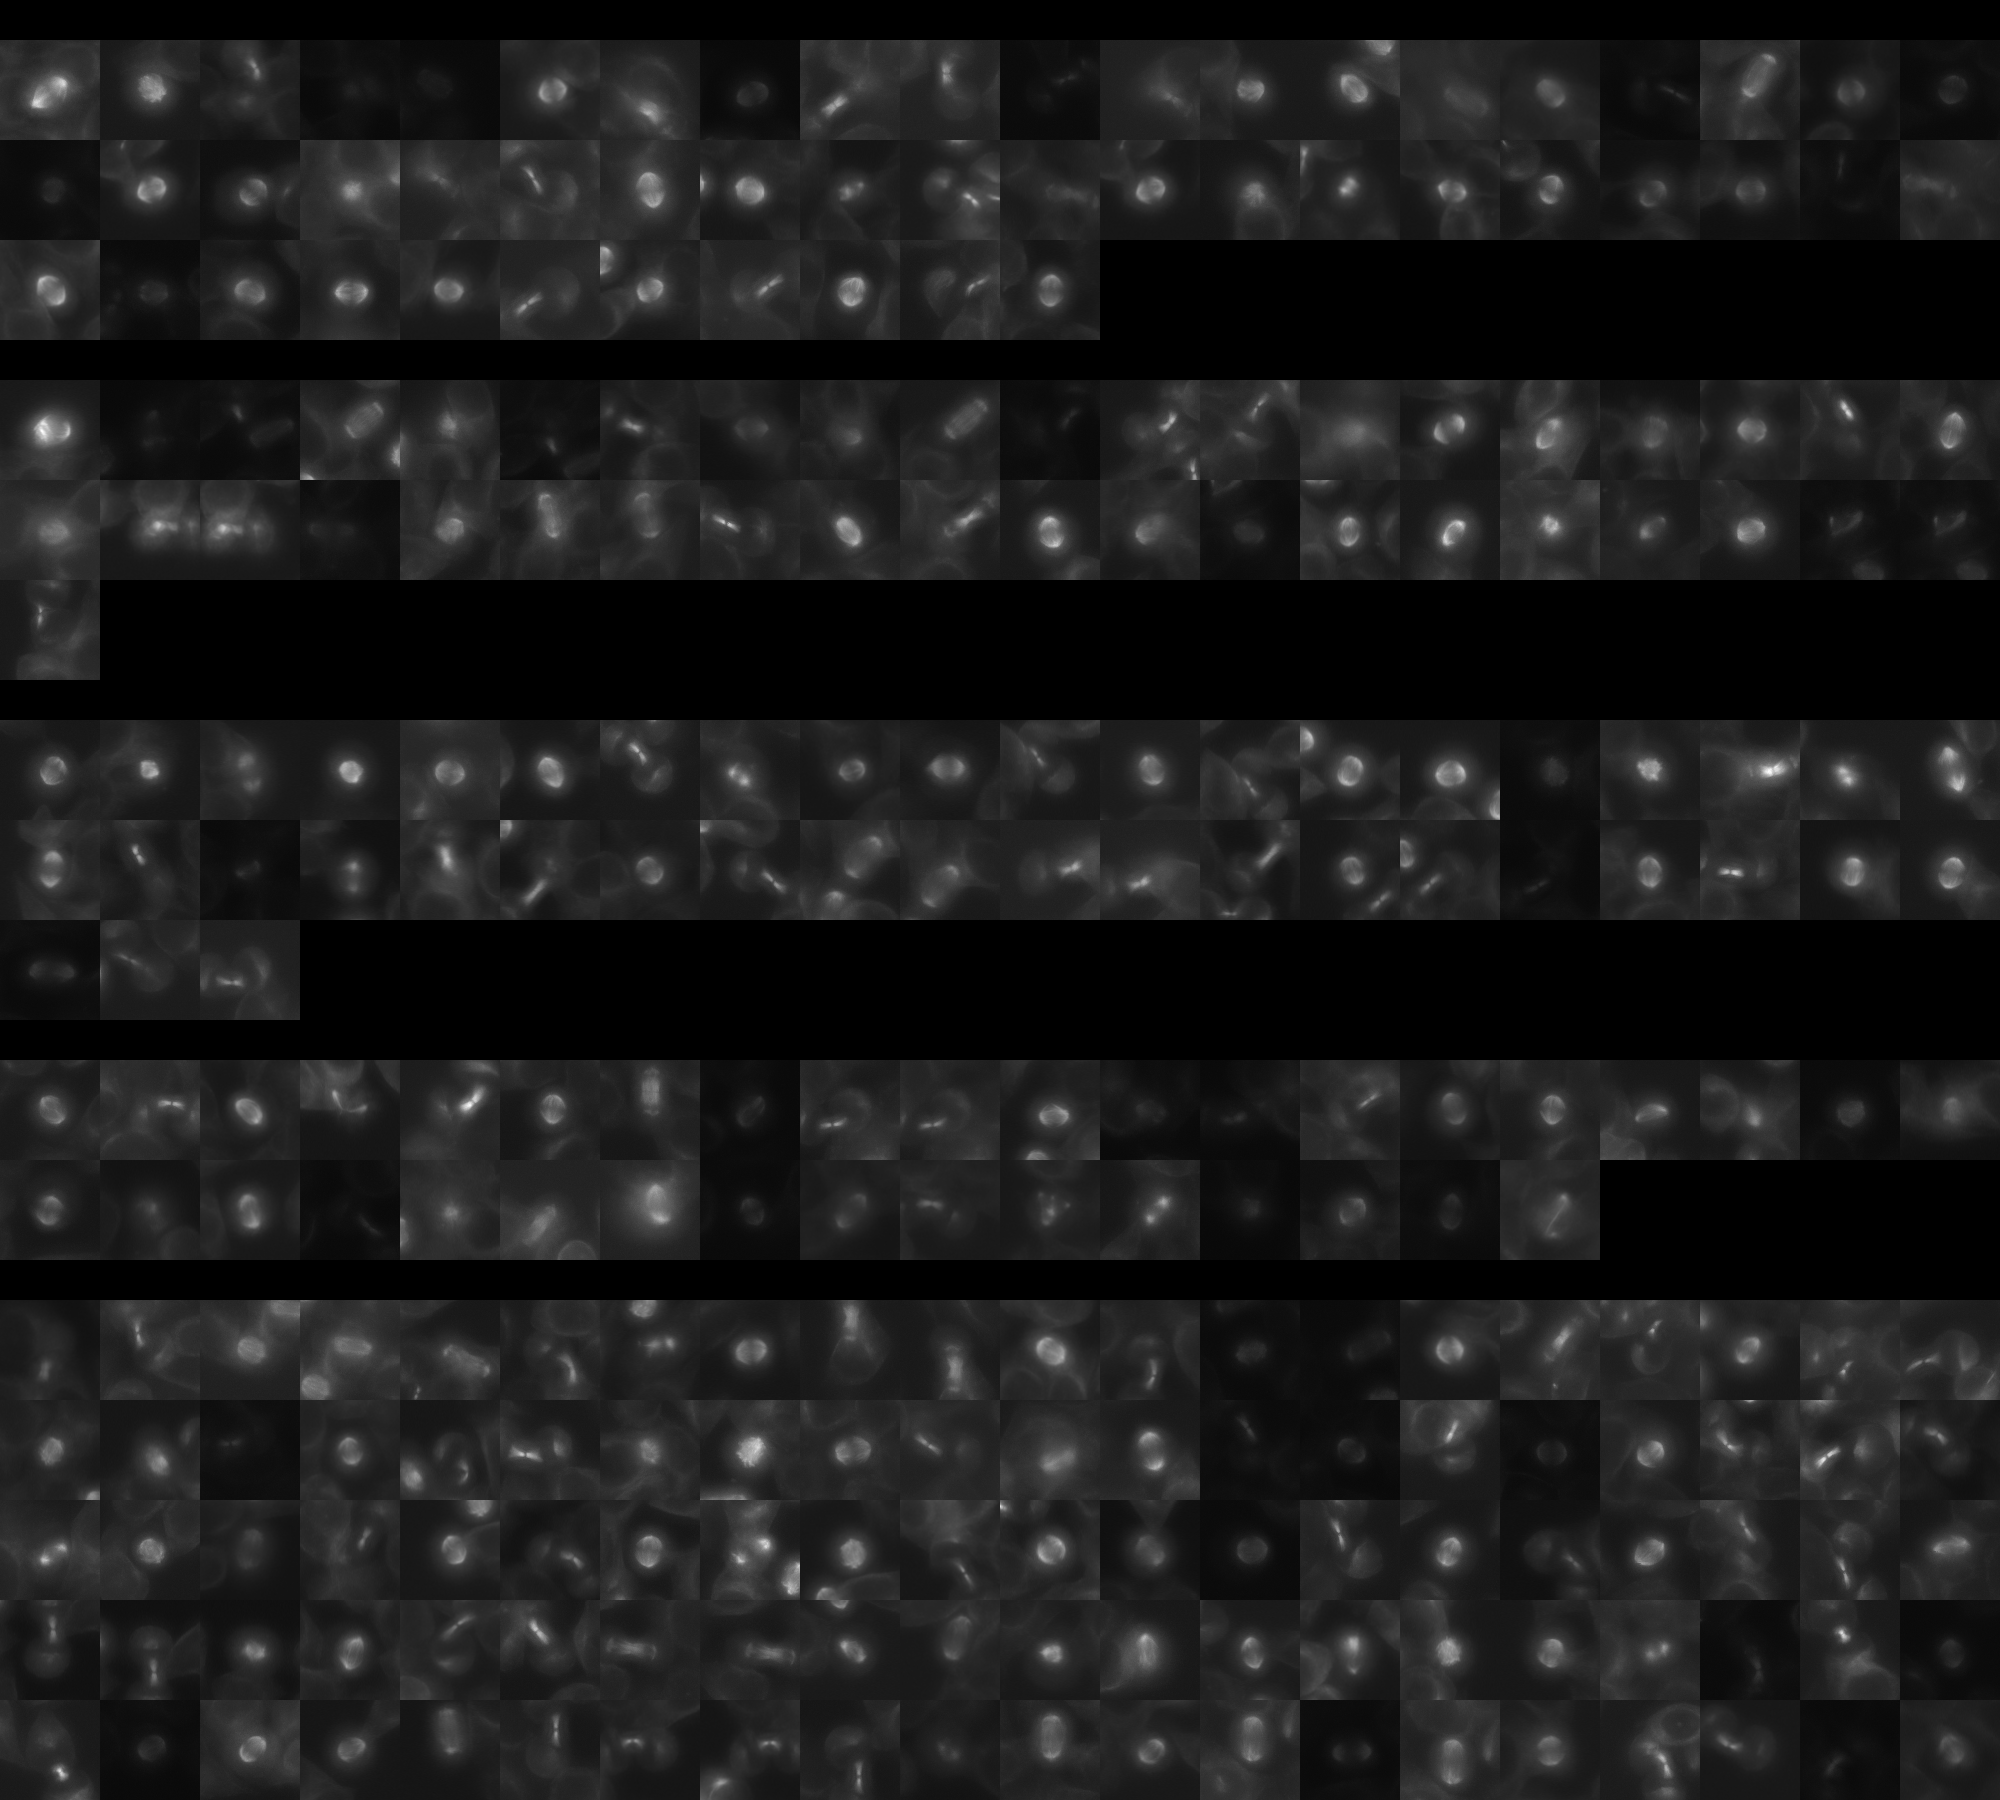
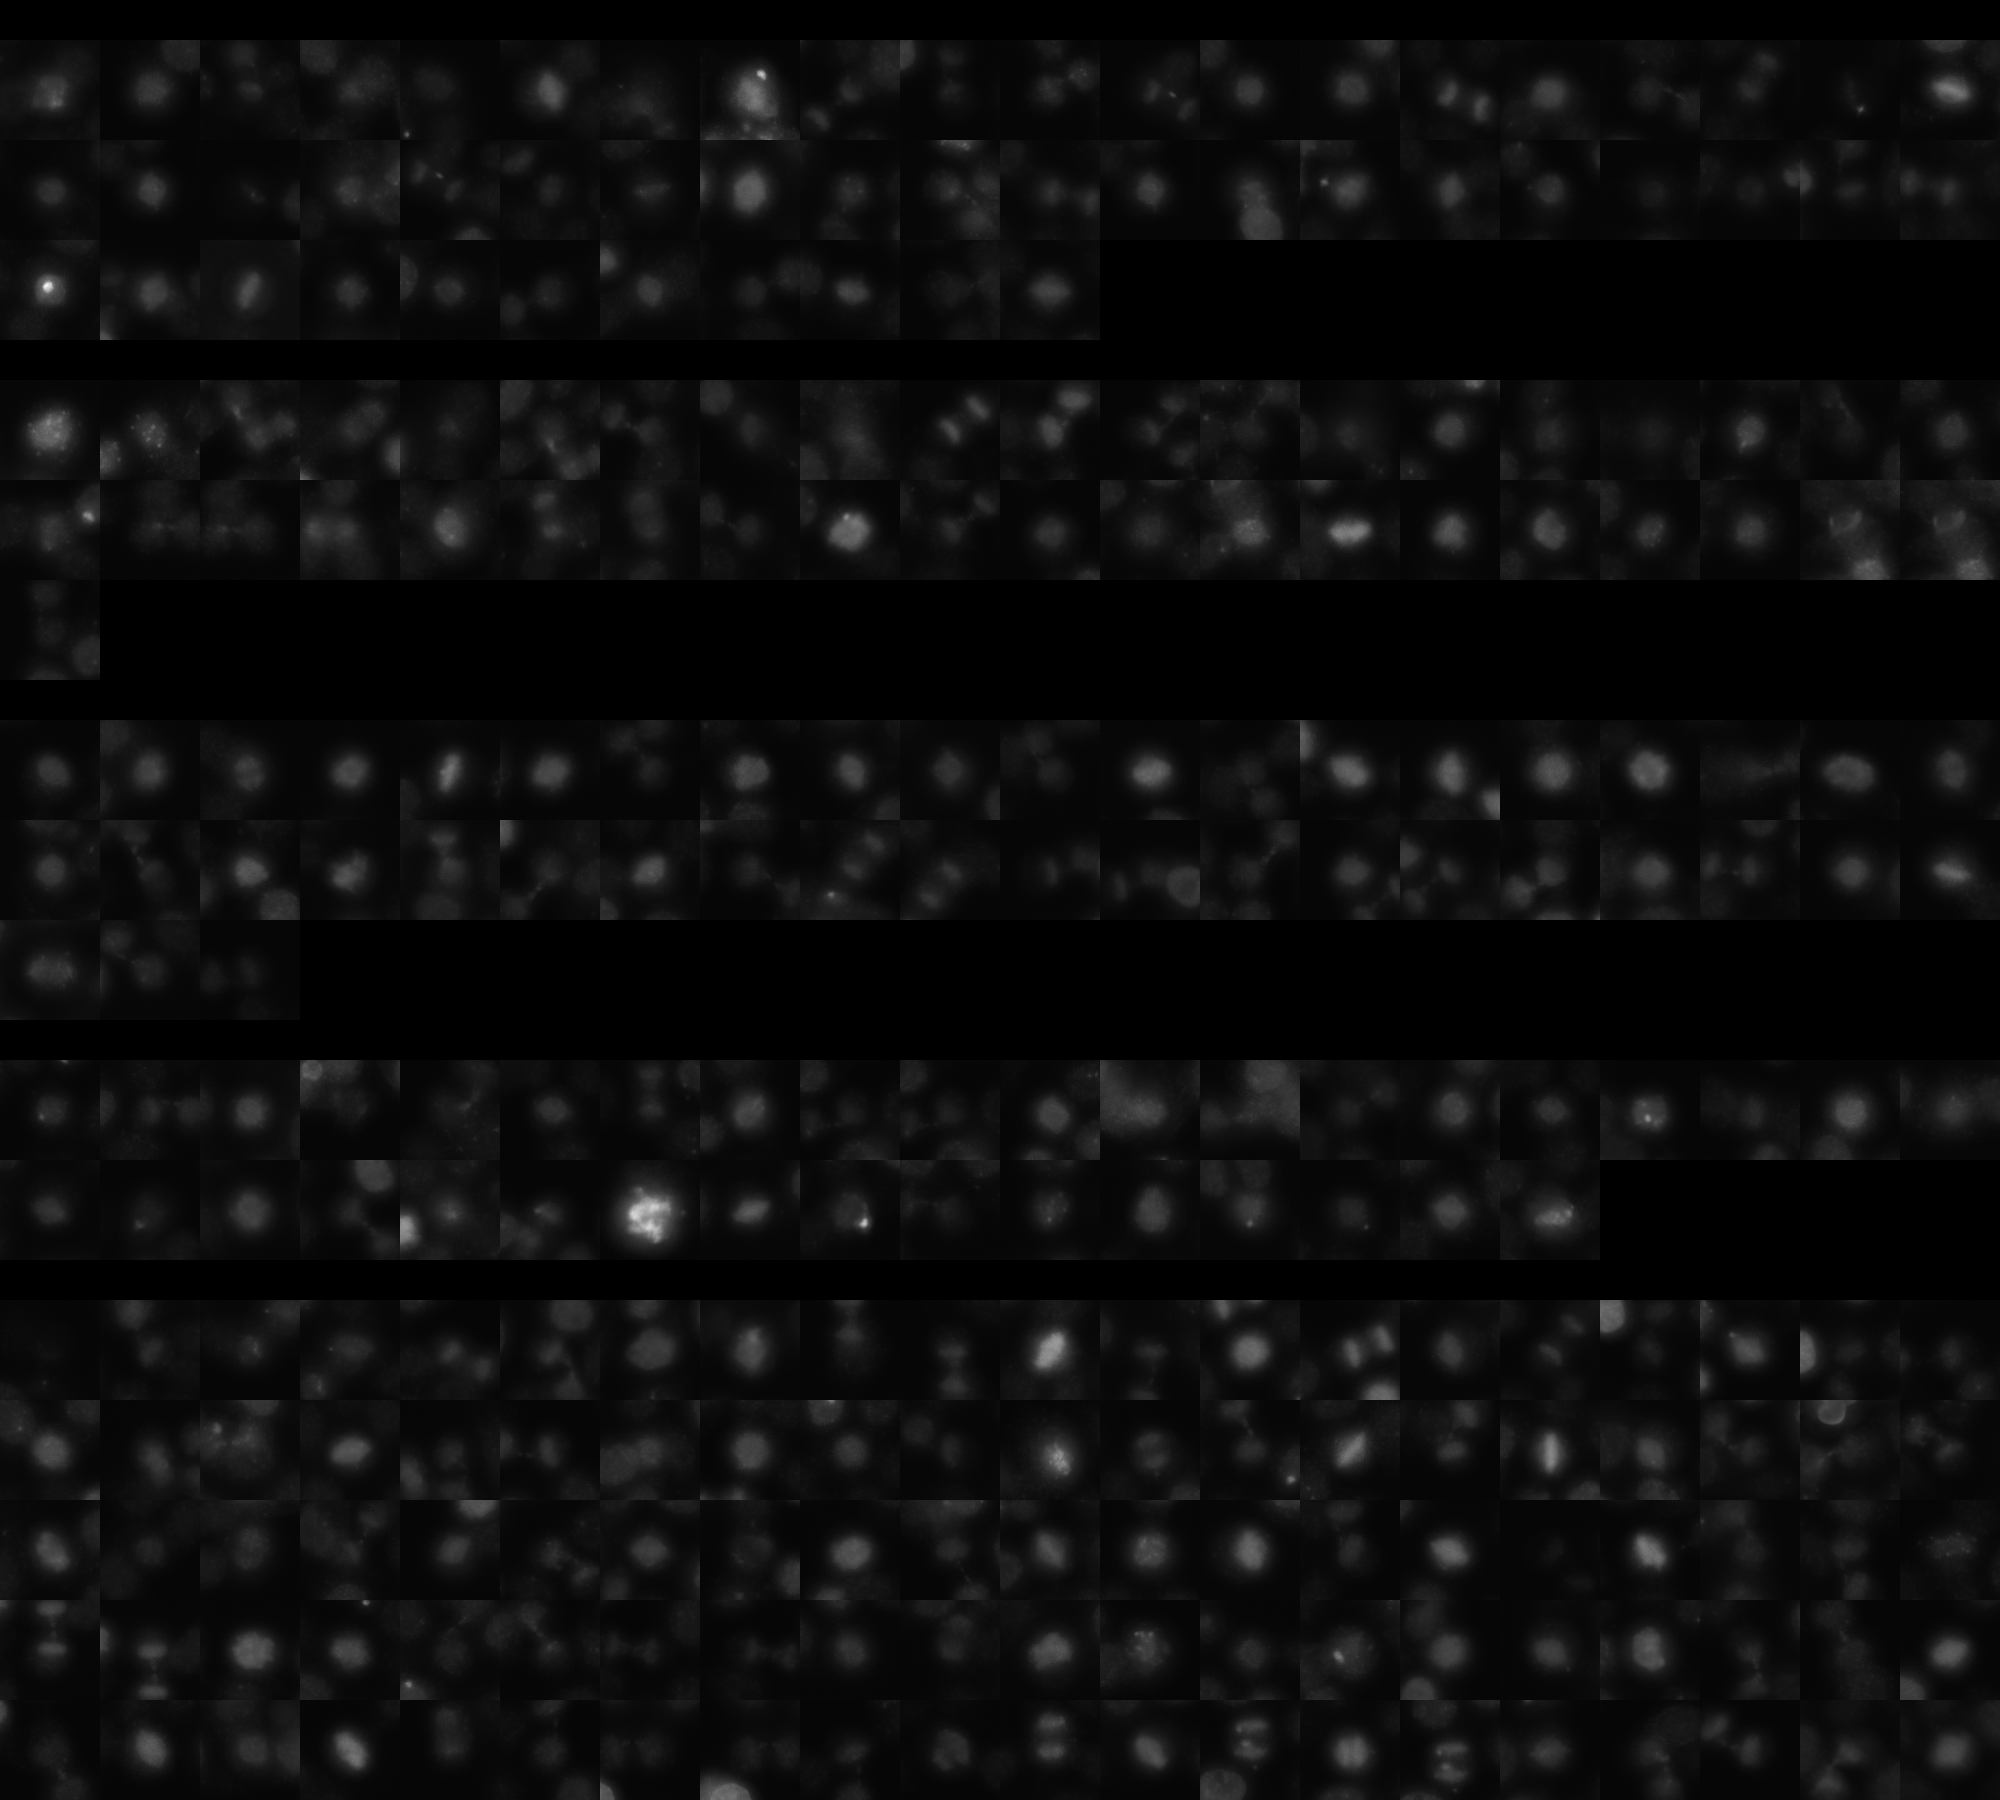
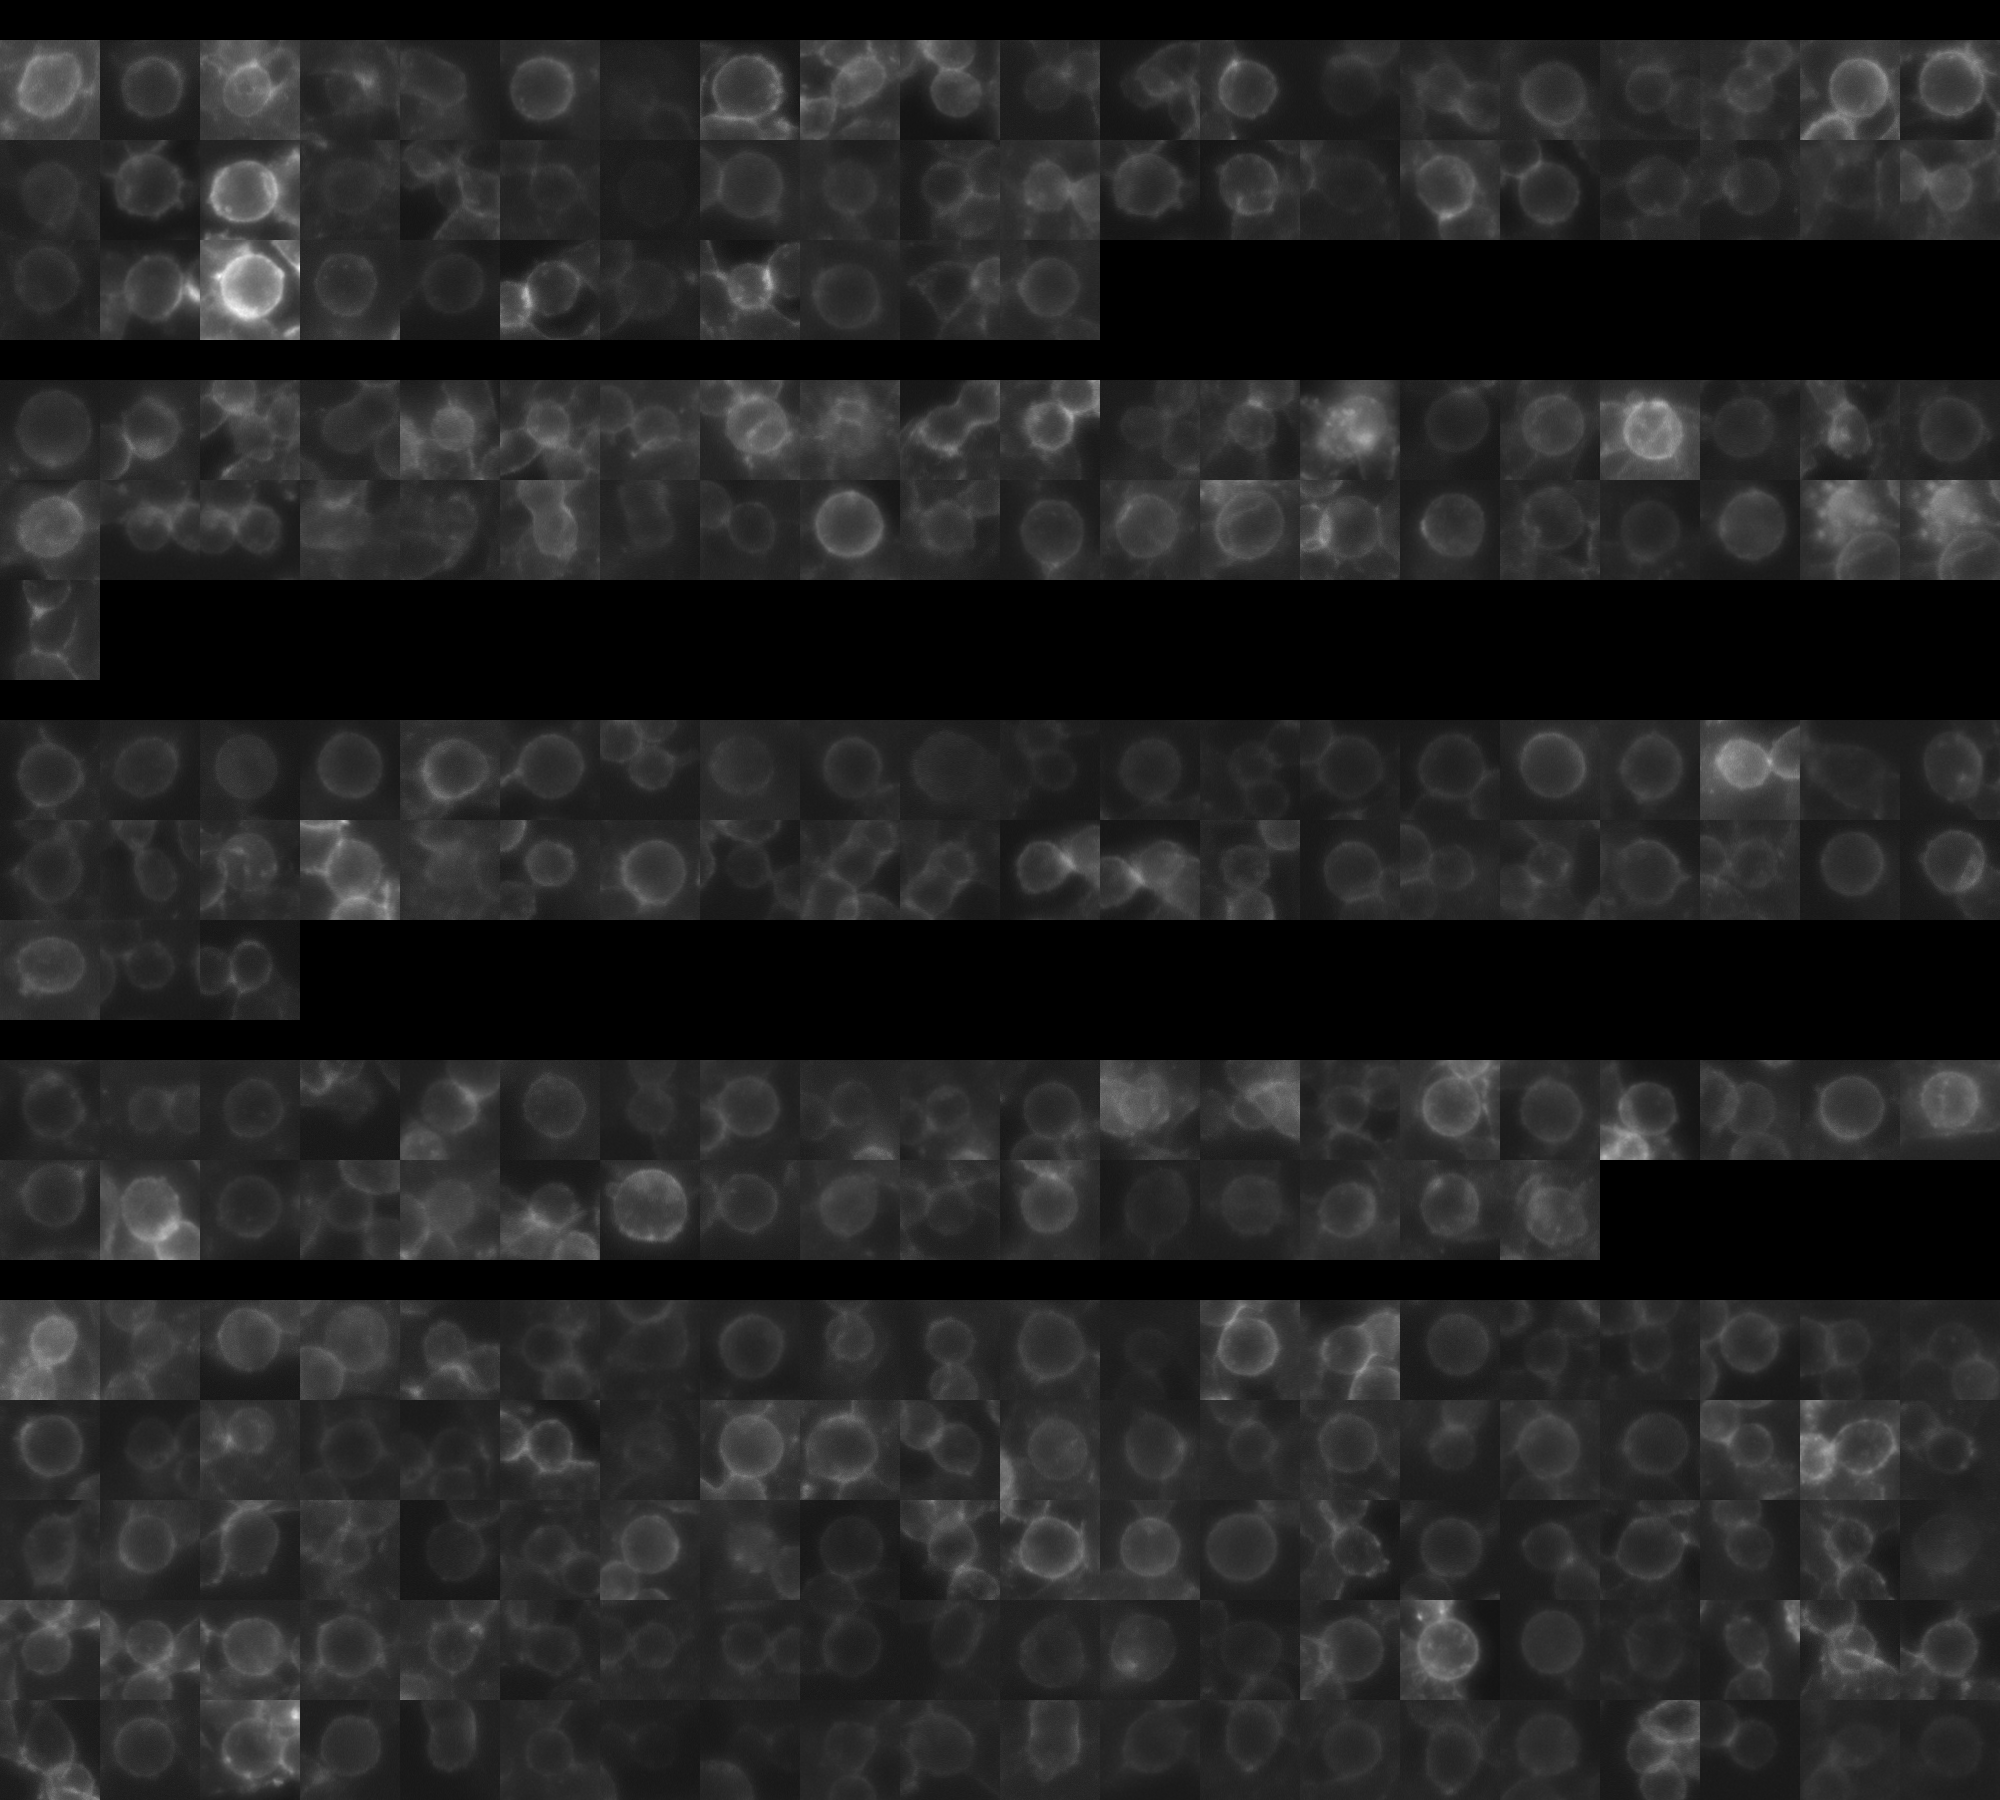
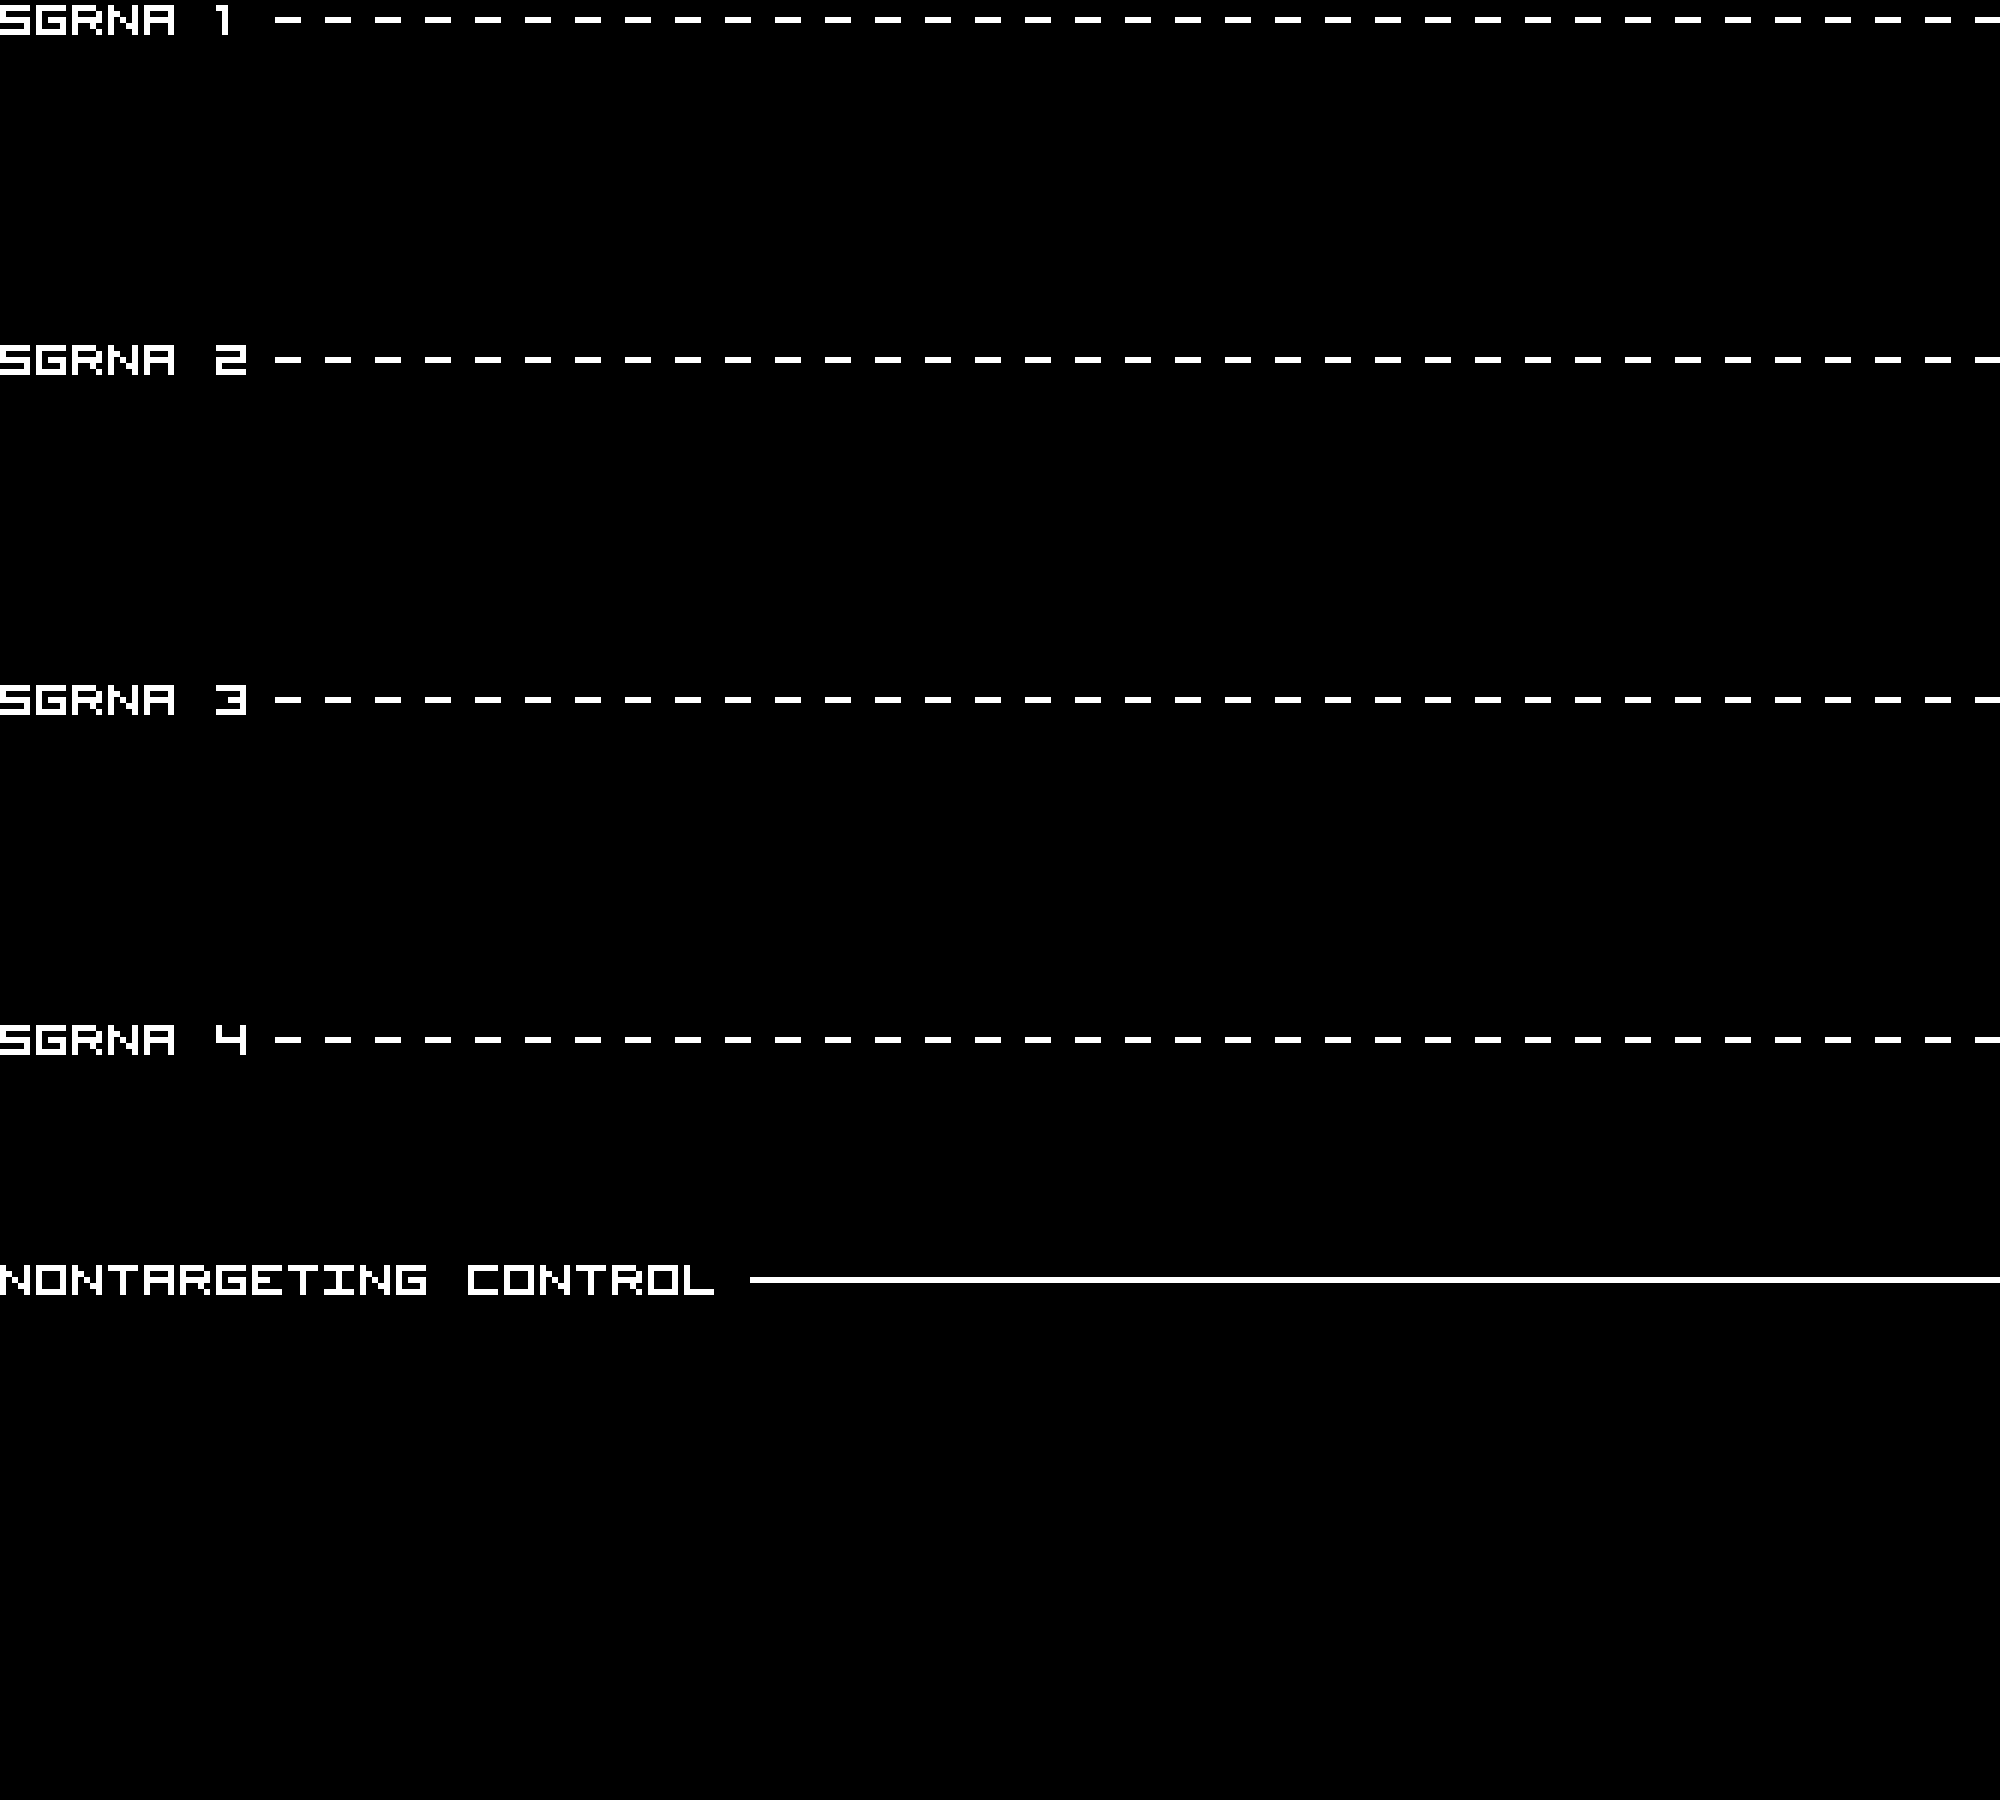
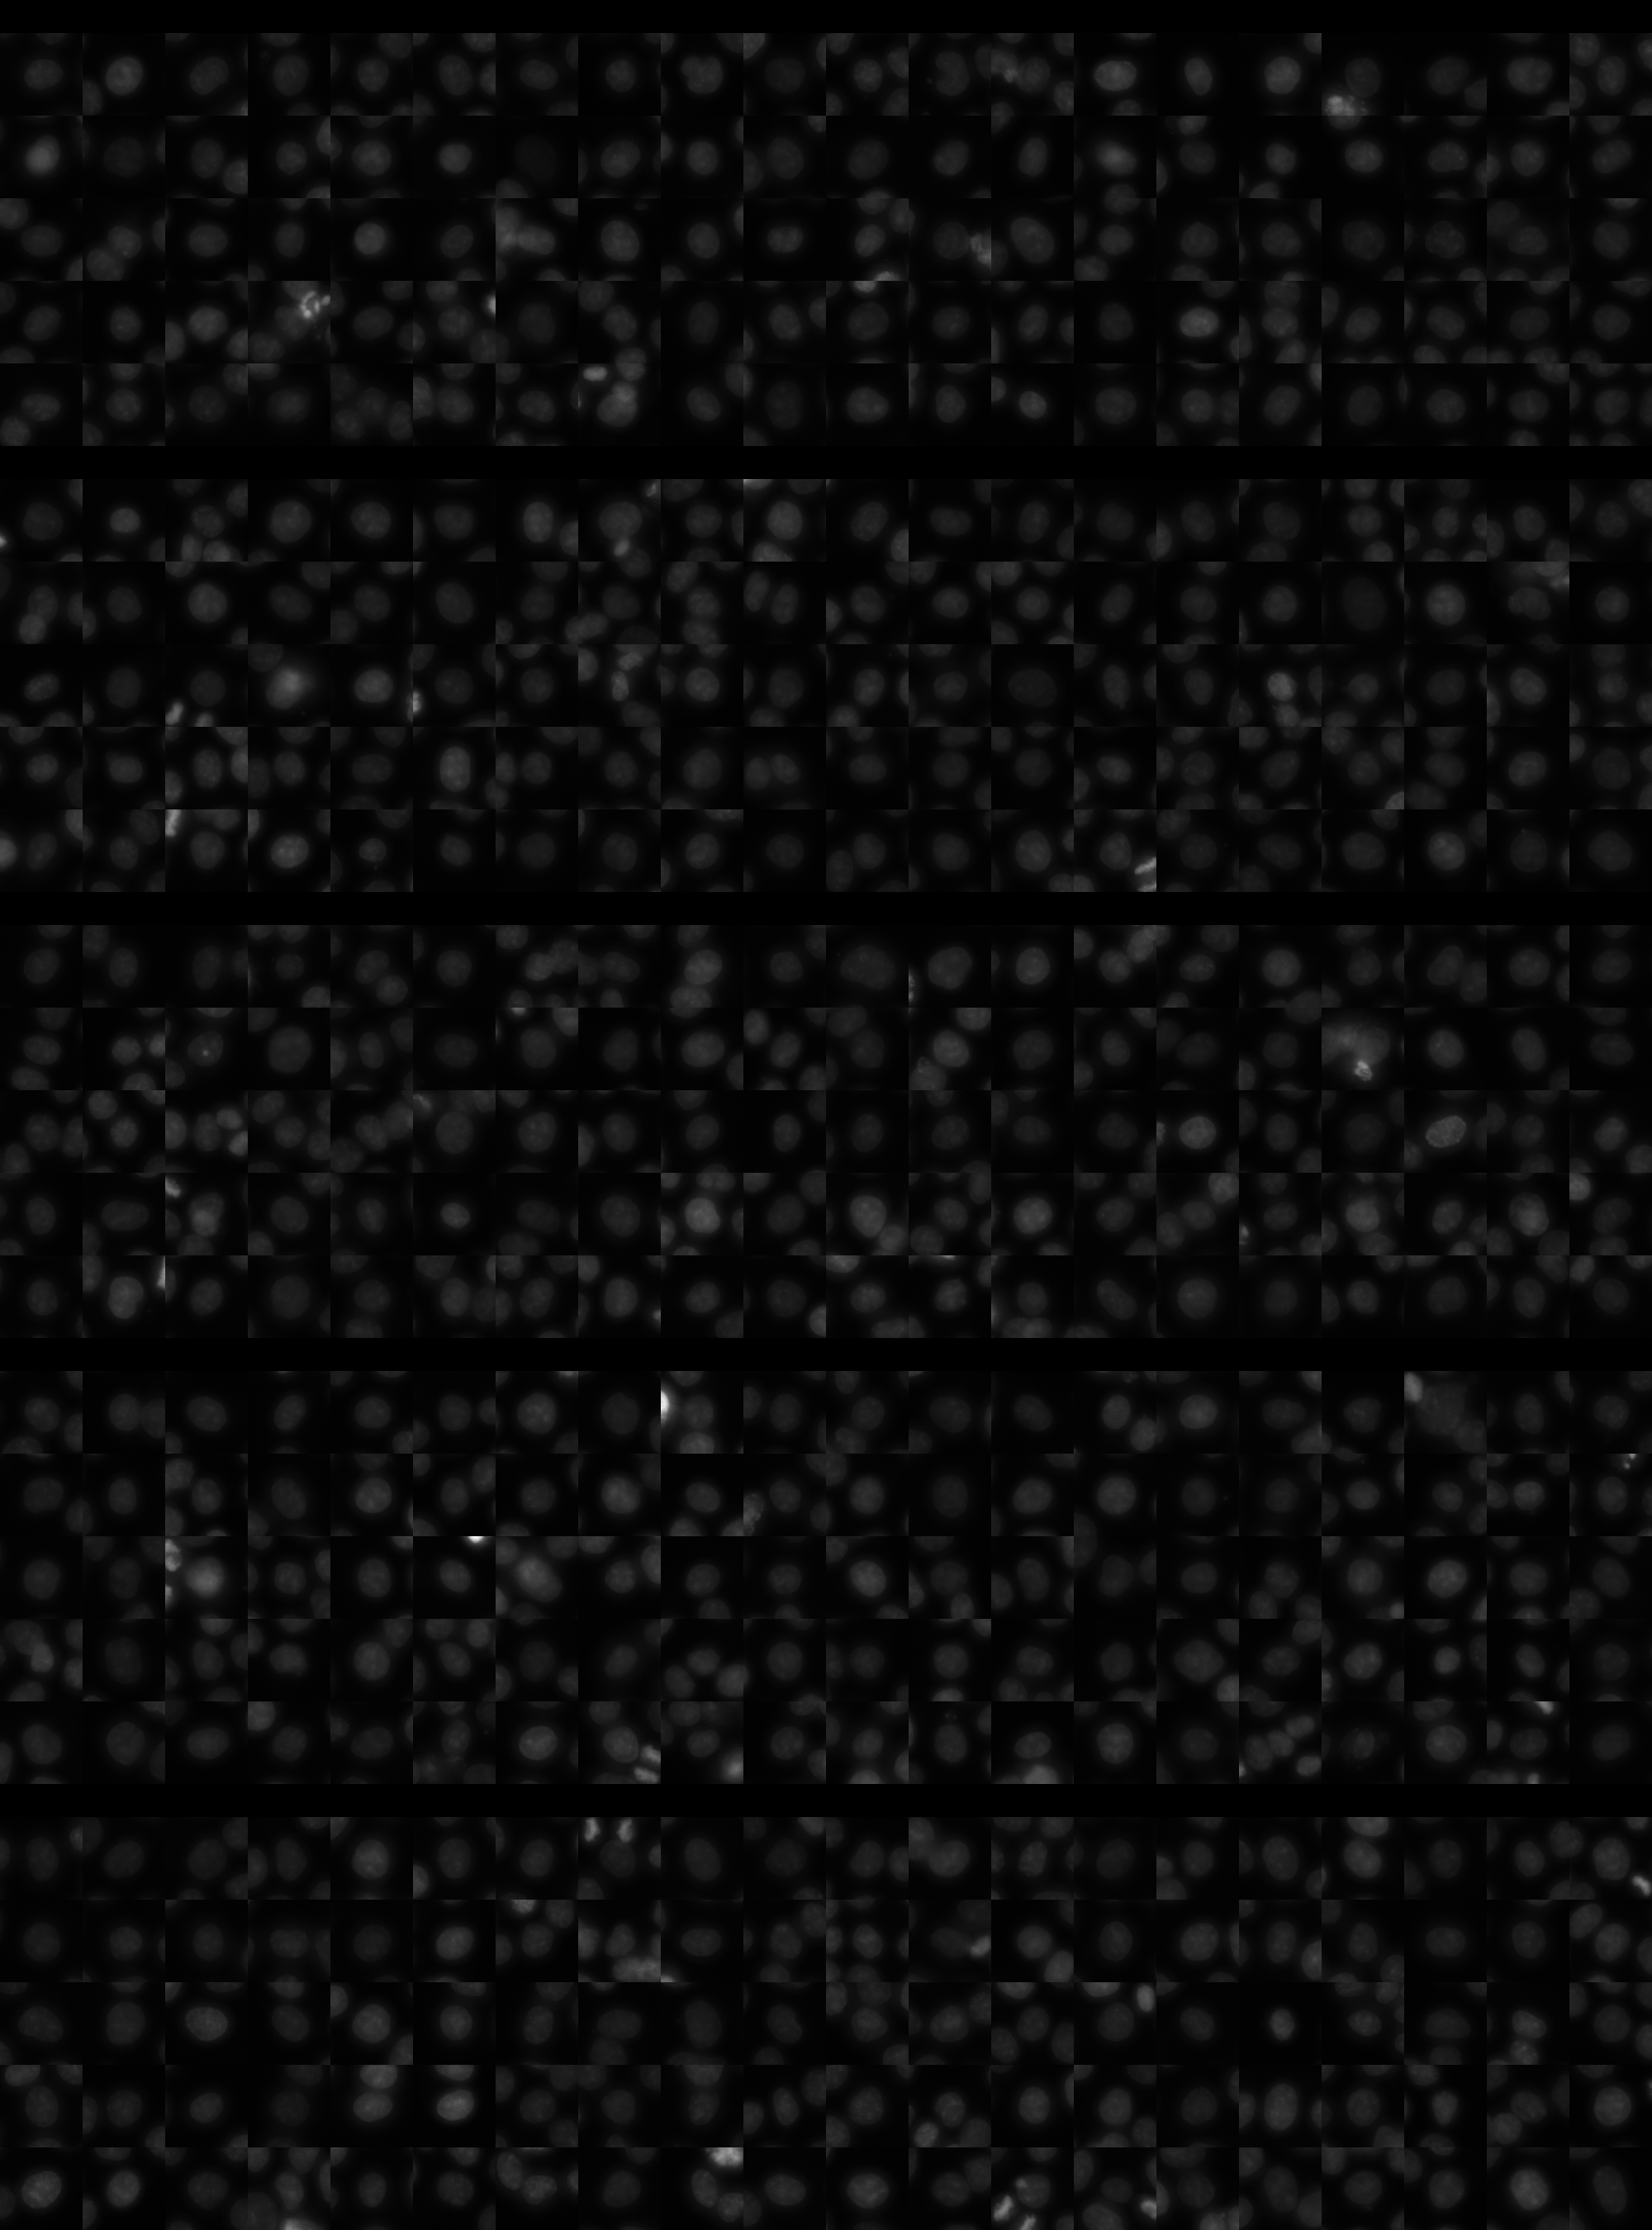
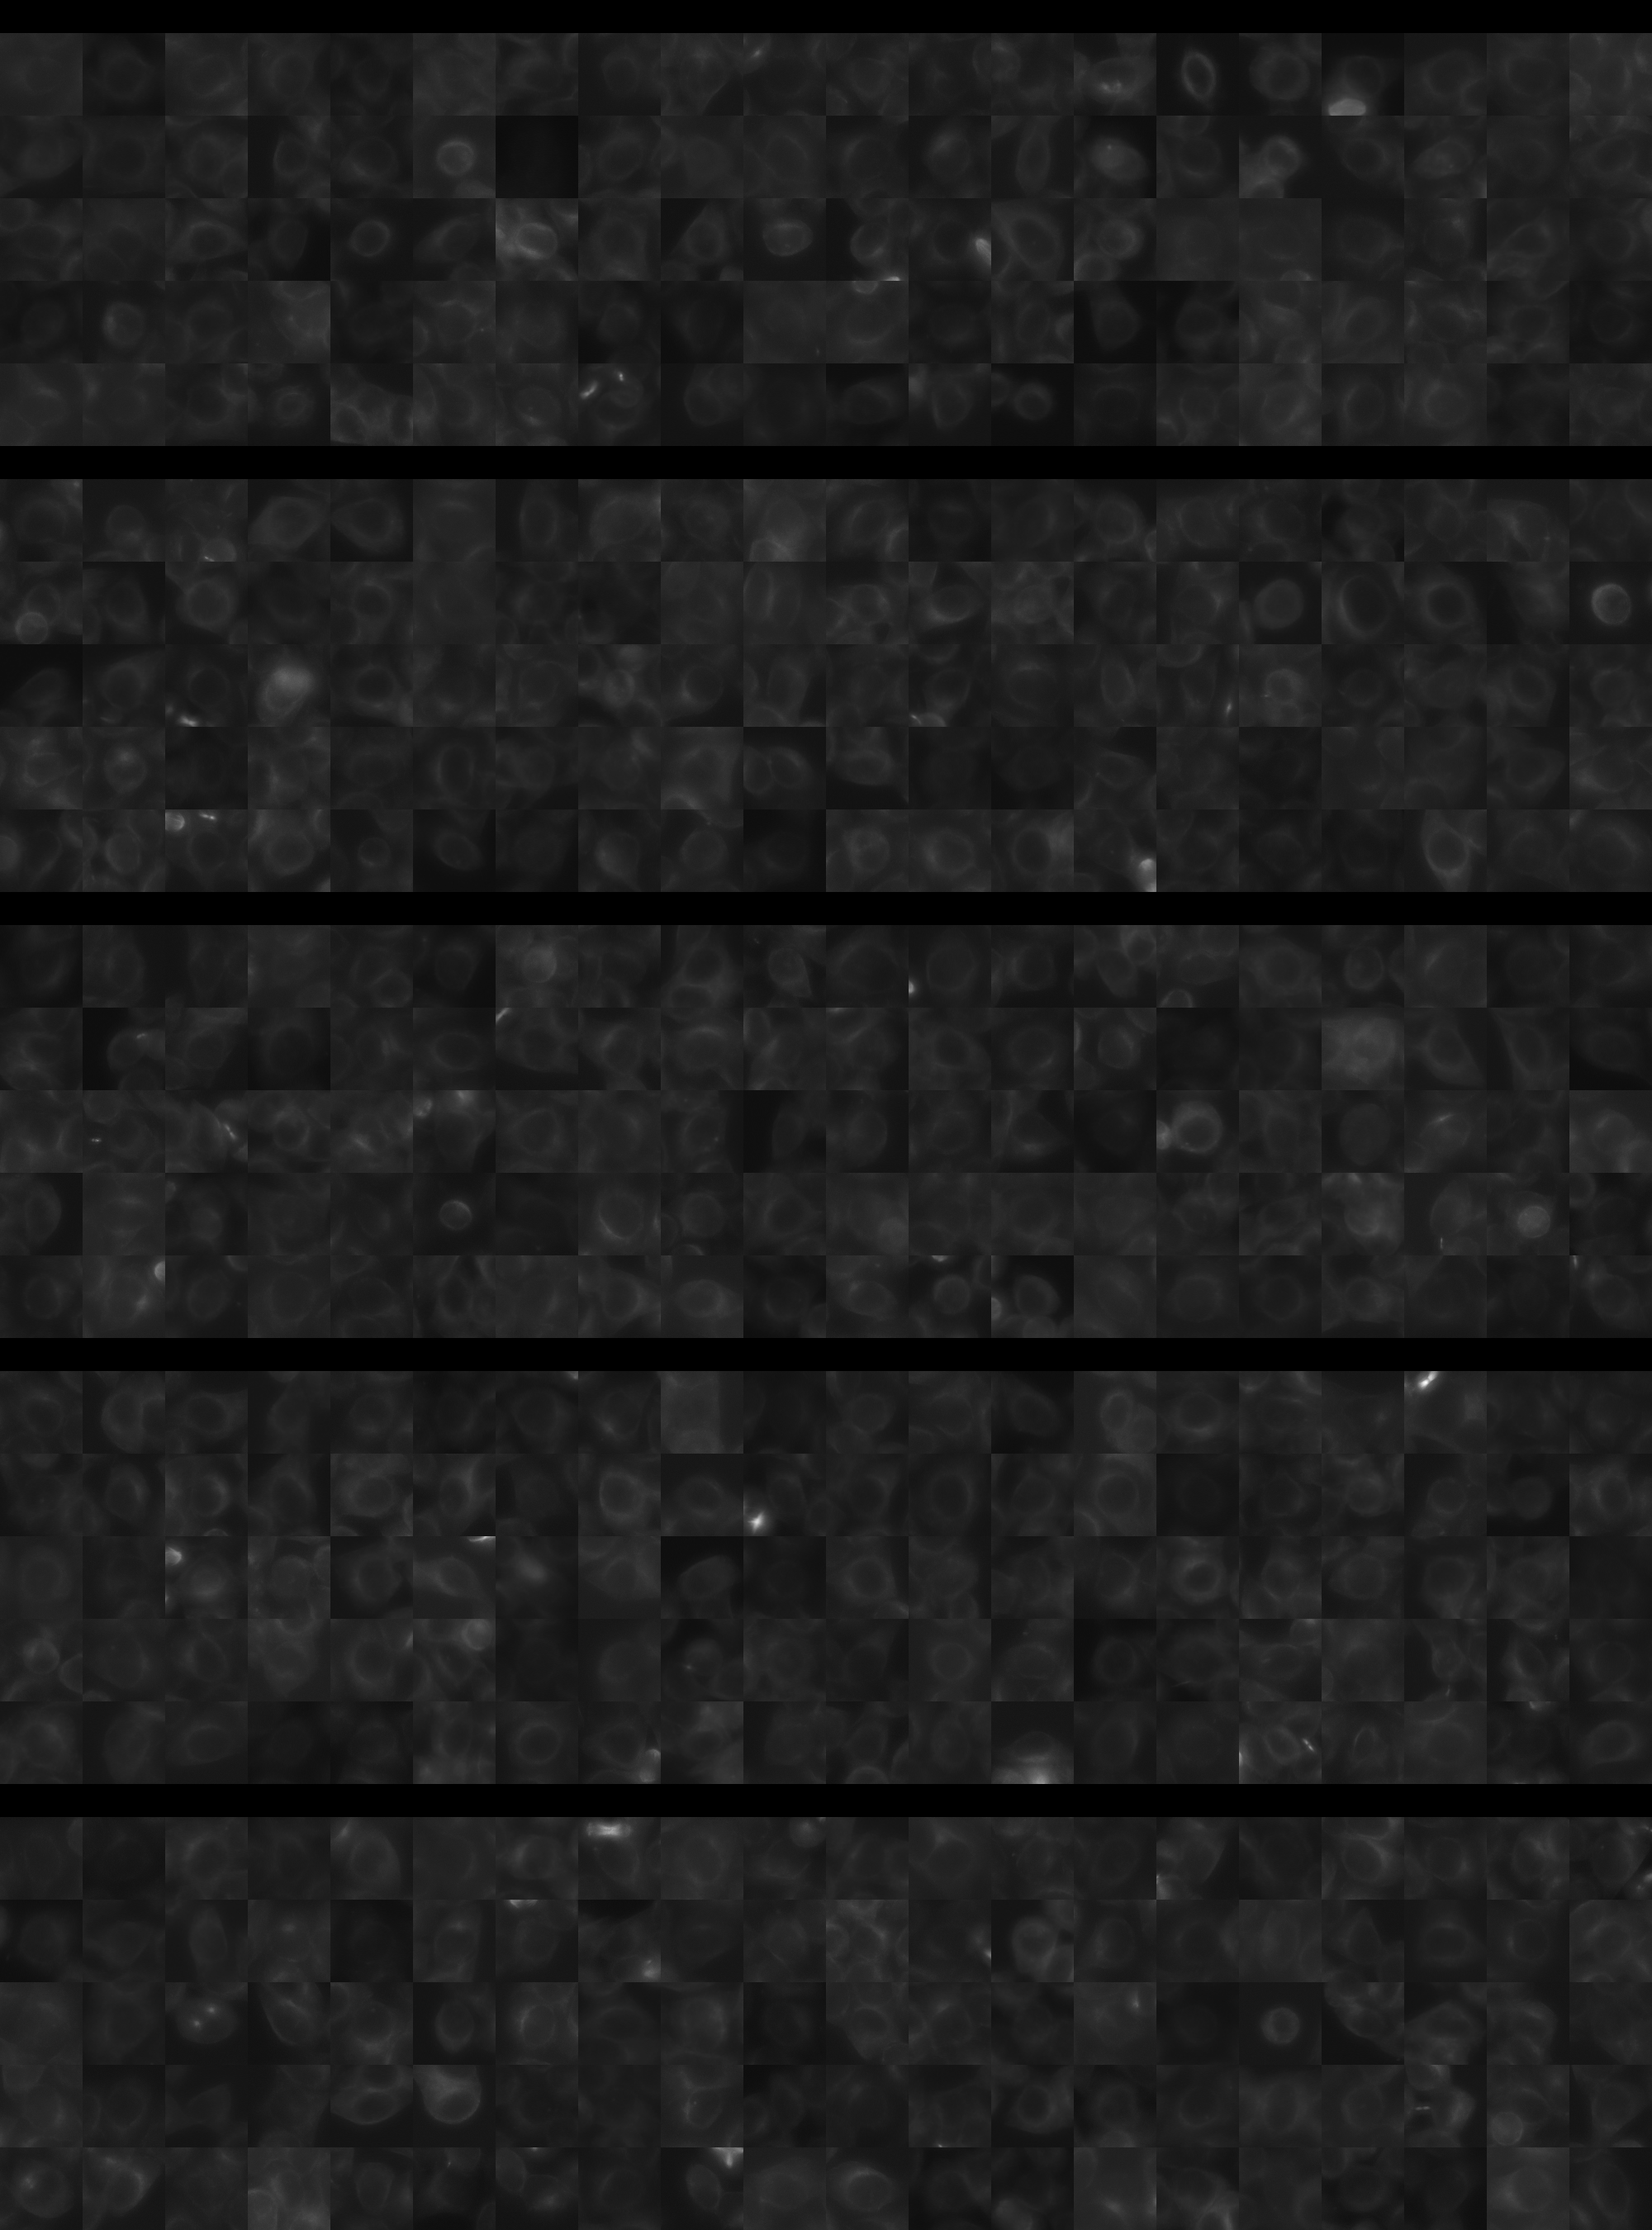
Each montage below shows randomly selected individual cell images for the same target gene separated by sgRNA, along with an example montage of cells expressing a non-targeting negative control sgRNA at the bottom. sgRNA labels in the montages correspond to the numbered sgRNA sequences in the gene info table above. The DNA (blue) and tubulin (green) channels are displayed by default, with gH2AX (grayscale) and actin (yellow) available using the check boxes. Channel brightness, contrast, and opacity are adjustable by clicking the arrow next to the channel name. When only one channel is selected, the display defaults to grayscale. Click the “Zoom” checkbox above the channel controls to enable image zooming (via scrolling) and panning (via click-and-drag).

The cell boxes displayed for this gene are square, 30.36 μm per side for the interphase montage and 30.36 μm per side for the mitotic montage.
Features

Interphase Score Rank FDR q-value
Nucleus DNA Integrated -4.213e-02 4727 of 5322 0.411
Nucleus DNA Mean 0.028 1191 of 5322 0.493
Nucleus gH2AX Mean 0.030 4038 of 5322 0.433
Nucleus DNA - gH2AX Correlation 0.076 245 of 5322 0.024
Nucleus Shape Area -1.680e-01 4999 of 5322 1.633e-04
Nucleus Shape Eccentricity -1.857e-01 5252 of 5322 4.529e-04
Nucleus Shape Form Factor 0.039 141 of 5322 0.202
Nucleus Shape Solidity -1.252e-02 1016 of 5322 0.749
Cell DNA Mass Displacement -3.505e-02 5229 of 5322 0.447
Cell Tubulin Mean 0.001 2729 of 5322 0.953
Cell Tubulin Mass Displacement -3.055e-02 4401 of 5322 0.582
Cell Actin Mean 0.089 935 of 5322 0.044
Cell Tubulin - Actin Correlation 0.050 1409 of 5322 0.220
Cell DNA - Tubulin Correlation -9.409e-02 5179 of 5322 0.004
Cell Shape Area -2.613e-02 3953 of 5322 0.542
Cell Shape Eccentricity -1.519e-02 4584 of 5322 0.900
Mitotic Score Rank FDR q-value
Nucleus DNA Integrated 0.206 1208 of 5322 0.834
Nucleus DNA Mean 0.119 1242 of 5322 1.000
Nucleus DNA Mass Displacement 0.096 1973 of 5322 0.999
Nucleus DNA Mean Frac 3 -9.234e-03 3271 of 5322 1.000
Nucleus gH2AX Mean -1.906e-01 4885 of 5322 1.000
Nucleus gH2AX Mean Frac 0 -1.172e-01 4035 of 5322 1.000
Nucleus Tubulin Mean Frac 0 0.176 1049 of 5322 0.999
Nucleus Tubulin Mean Edge -1.482e-01 4665 of 5322 0.996
Nucleus Tubulin Std Edge -1.133e-01 4026 of 5322 0.999
Nucleus Shape Area 0.176 1720 of 5322 0.930
Nucleus Shape Eccentricity -3.021e-01 4963 of 5322 1.000
Nucleus Shape Form Factor -4.373e-02 2010 of 5322 0.998
Cell Tubulin Mean -1.743e-01 4985 of 5322 0.975
Cell Tubulin Mean Frac 3 0.007 1614 of 5322 0.999
Cell Actin Mean -1.428e-01 4752 of 5322 0.997
Cell Shape Area 0.231 1122 of 5322 0.976
( Reset Zoom )
Brightness
Contrast
Opacity
Brightness
Contrast
Opacity
Brightness
Contrast
Opacity
Brightness
Contrast
Opacity
Brightness
Contrast
Opacity

( Reset Zoom )
Brightness
Contrast
Opacity
Brightness
Contrast
Opacity
Brightness
Contrast
Opacity
Brightness
Contrast
Opacity
Brightness
Contrast
Opacity

MIT Central Accessability