NUP98

Gene symbol: NUP98
Gene: 4928
Uniprot Function: Plays a role in the nuclear pore complex (NPC) assembly and/or maintenance. NUP98 and NUP96 are involved in the bidirectional transport across the NPC. May anchor NUP153 and TPR to the NPC. In cooperation with DHX9, plays a role in transcription and alternative splicing activation of a subset of genes (PubMed:28221134). Involved in the localization of DHX9 in discrete intranuclear foci (GLFG-body) (PubMed:28221134).
Mitotic Index 0.0218
Interphase Cluster: #104 (23 genes)
Mitotic Cluster: #180 (14 genes)
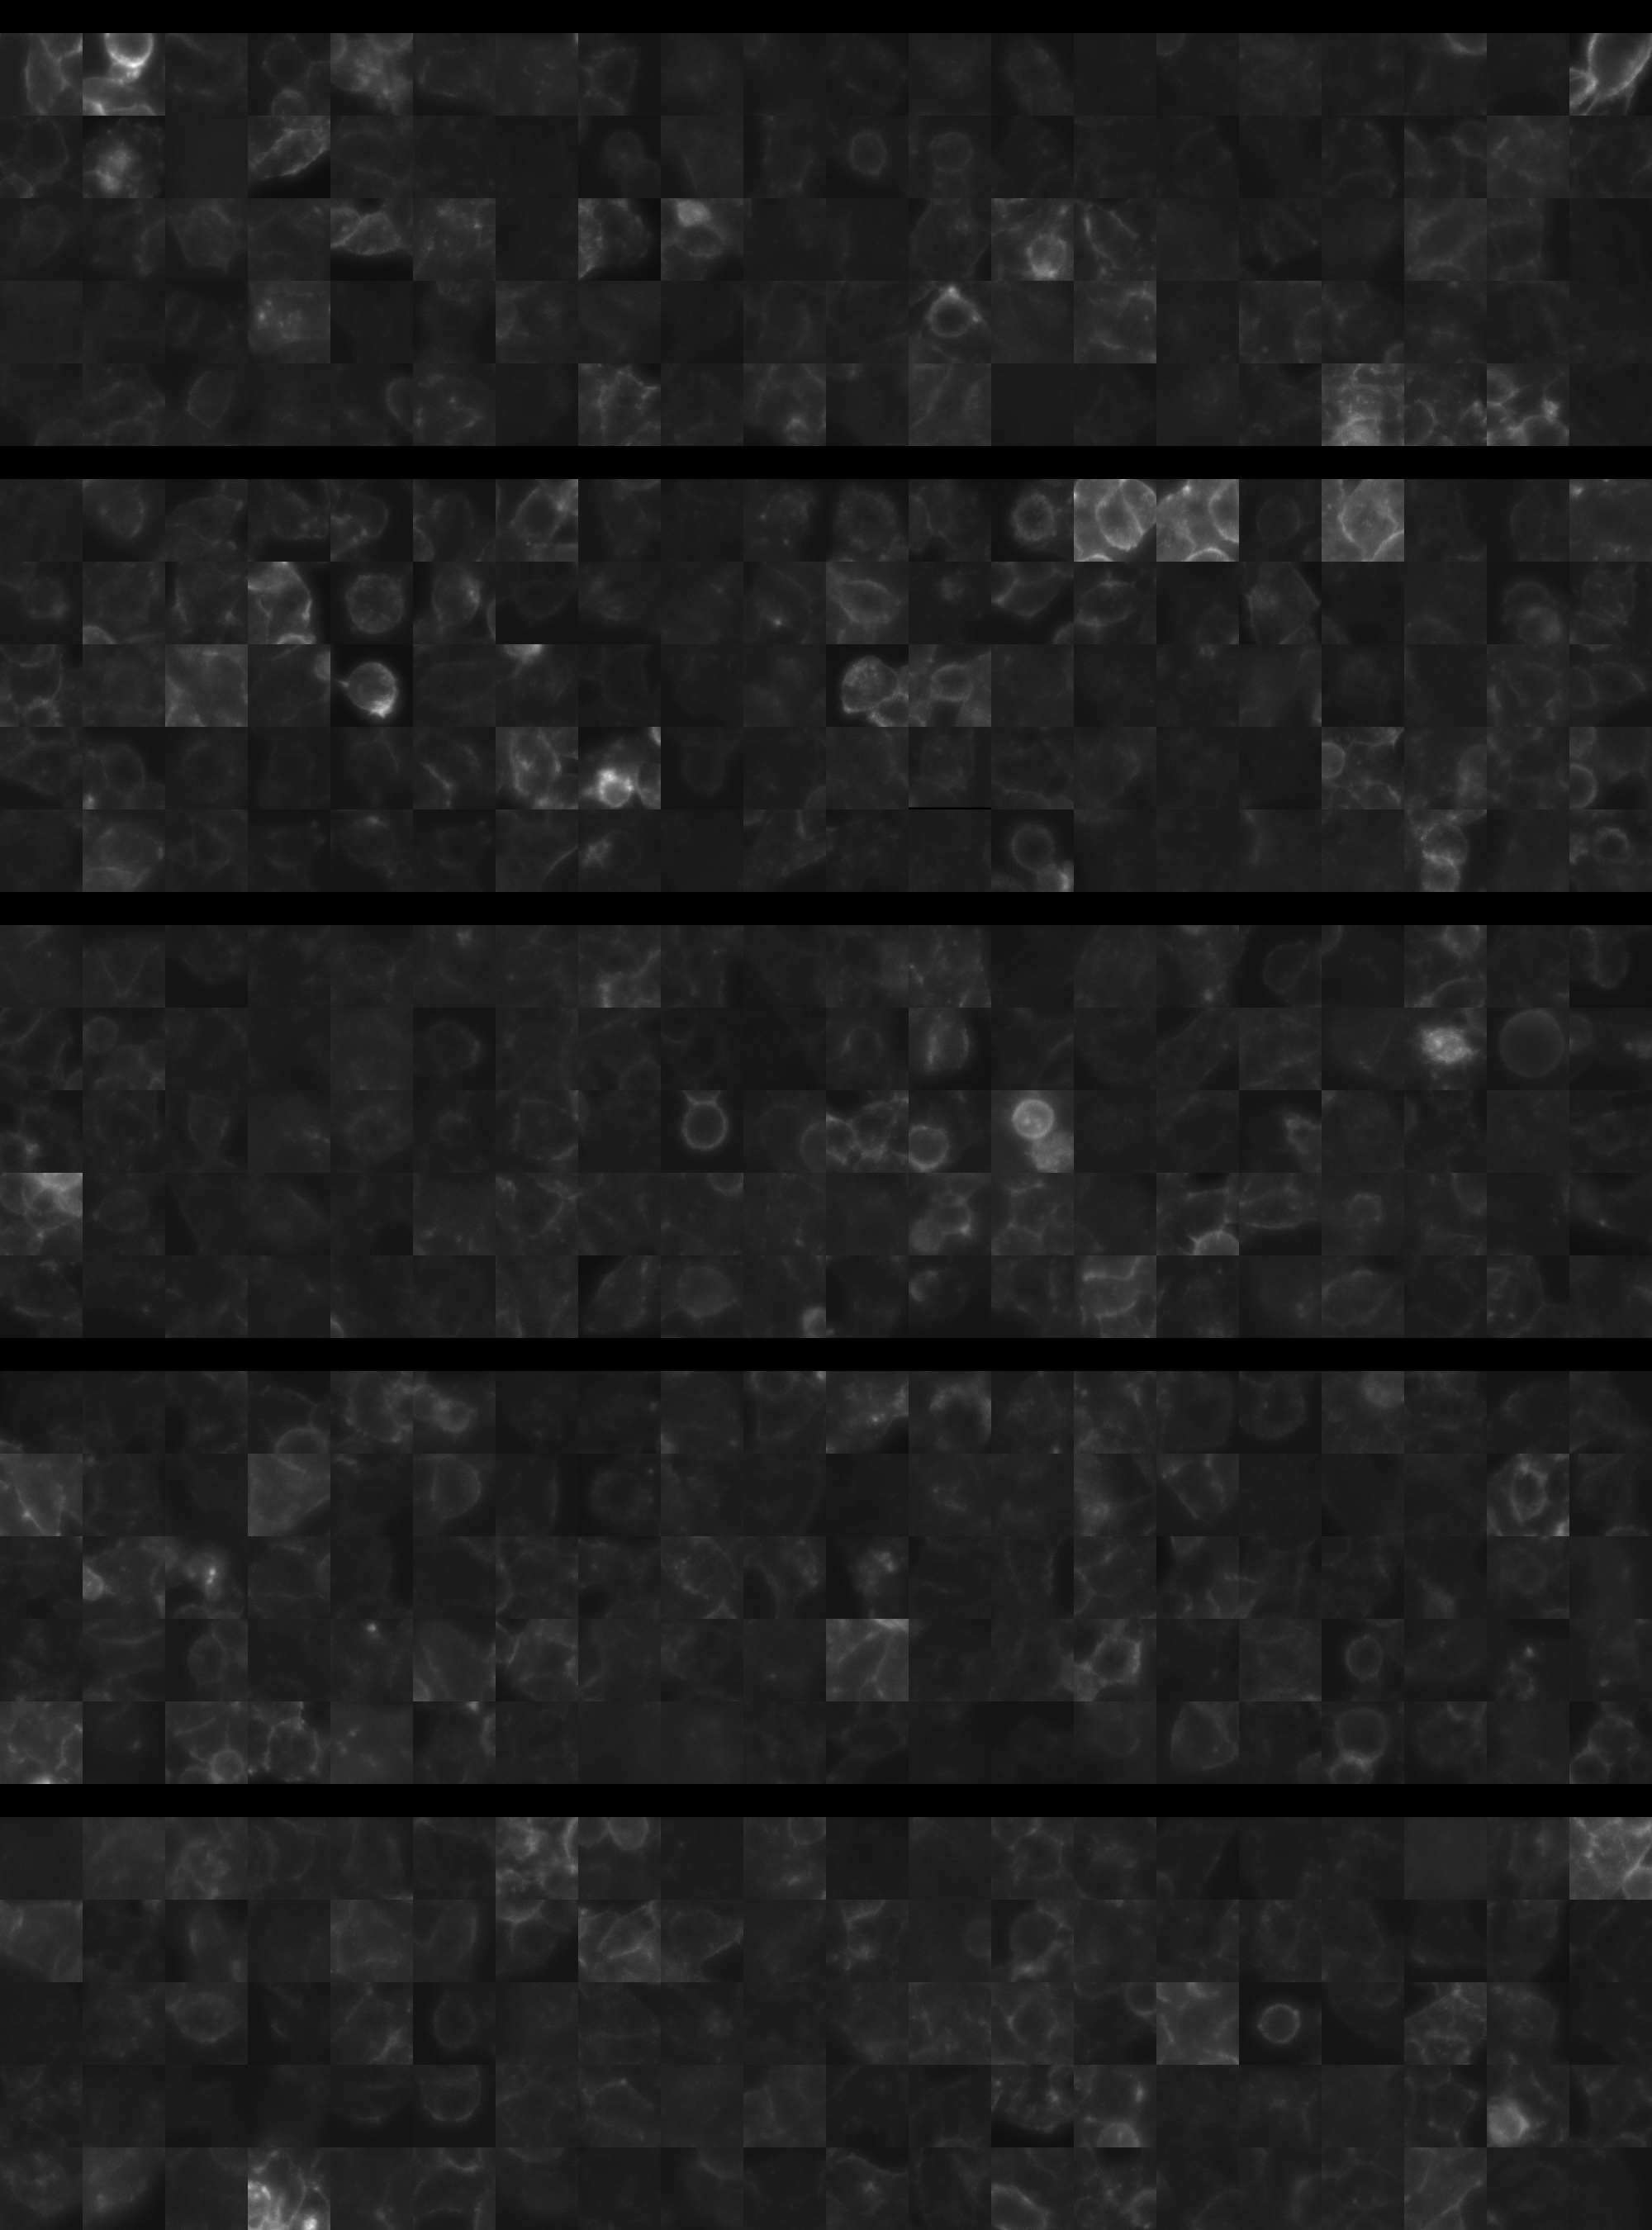
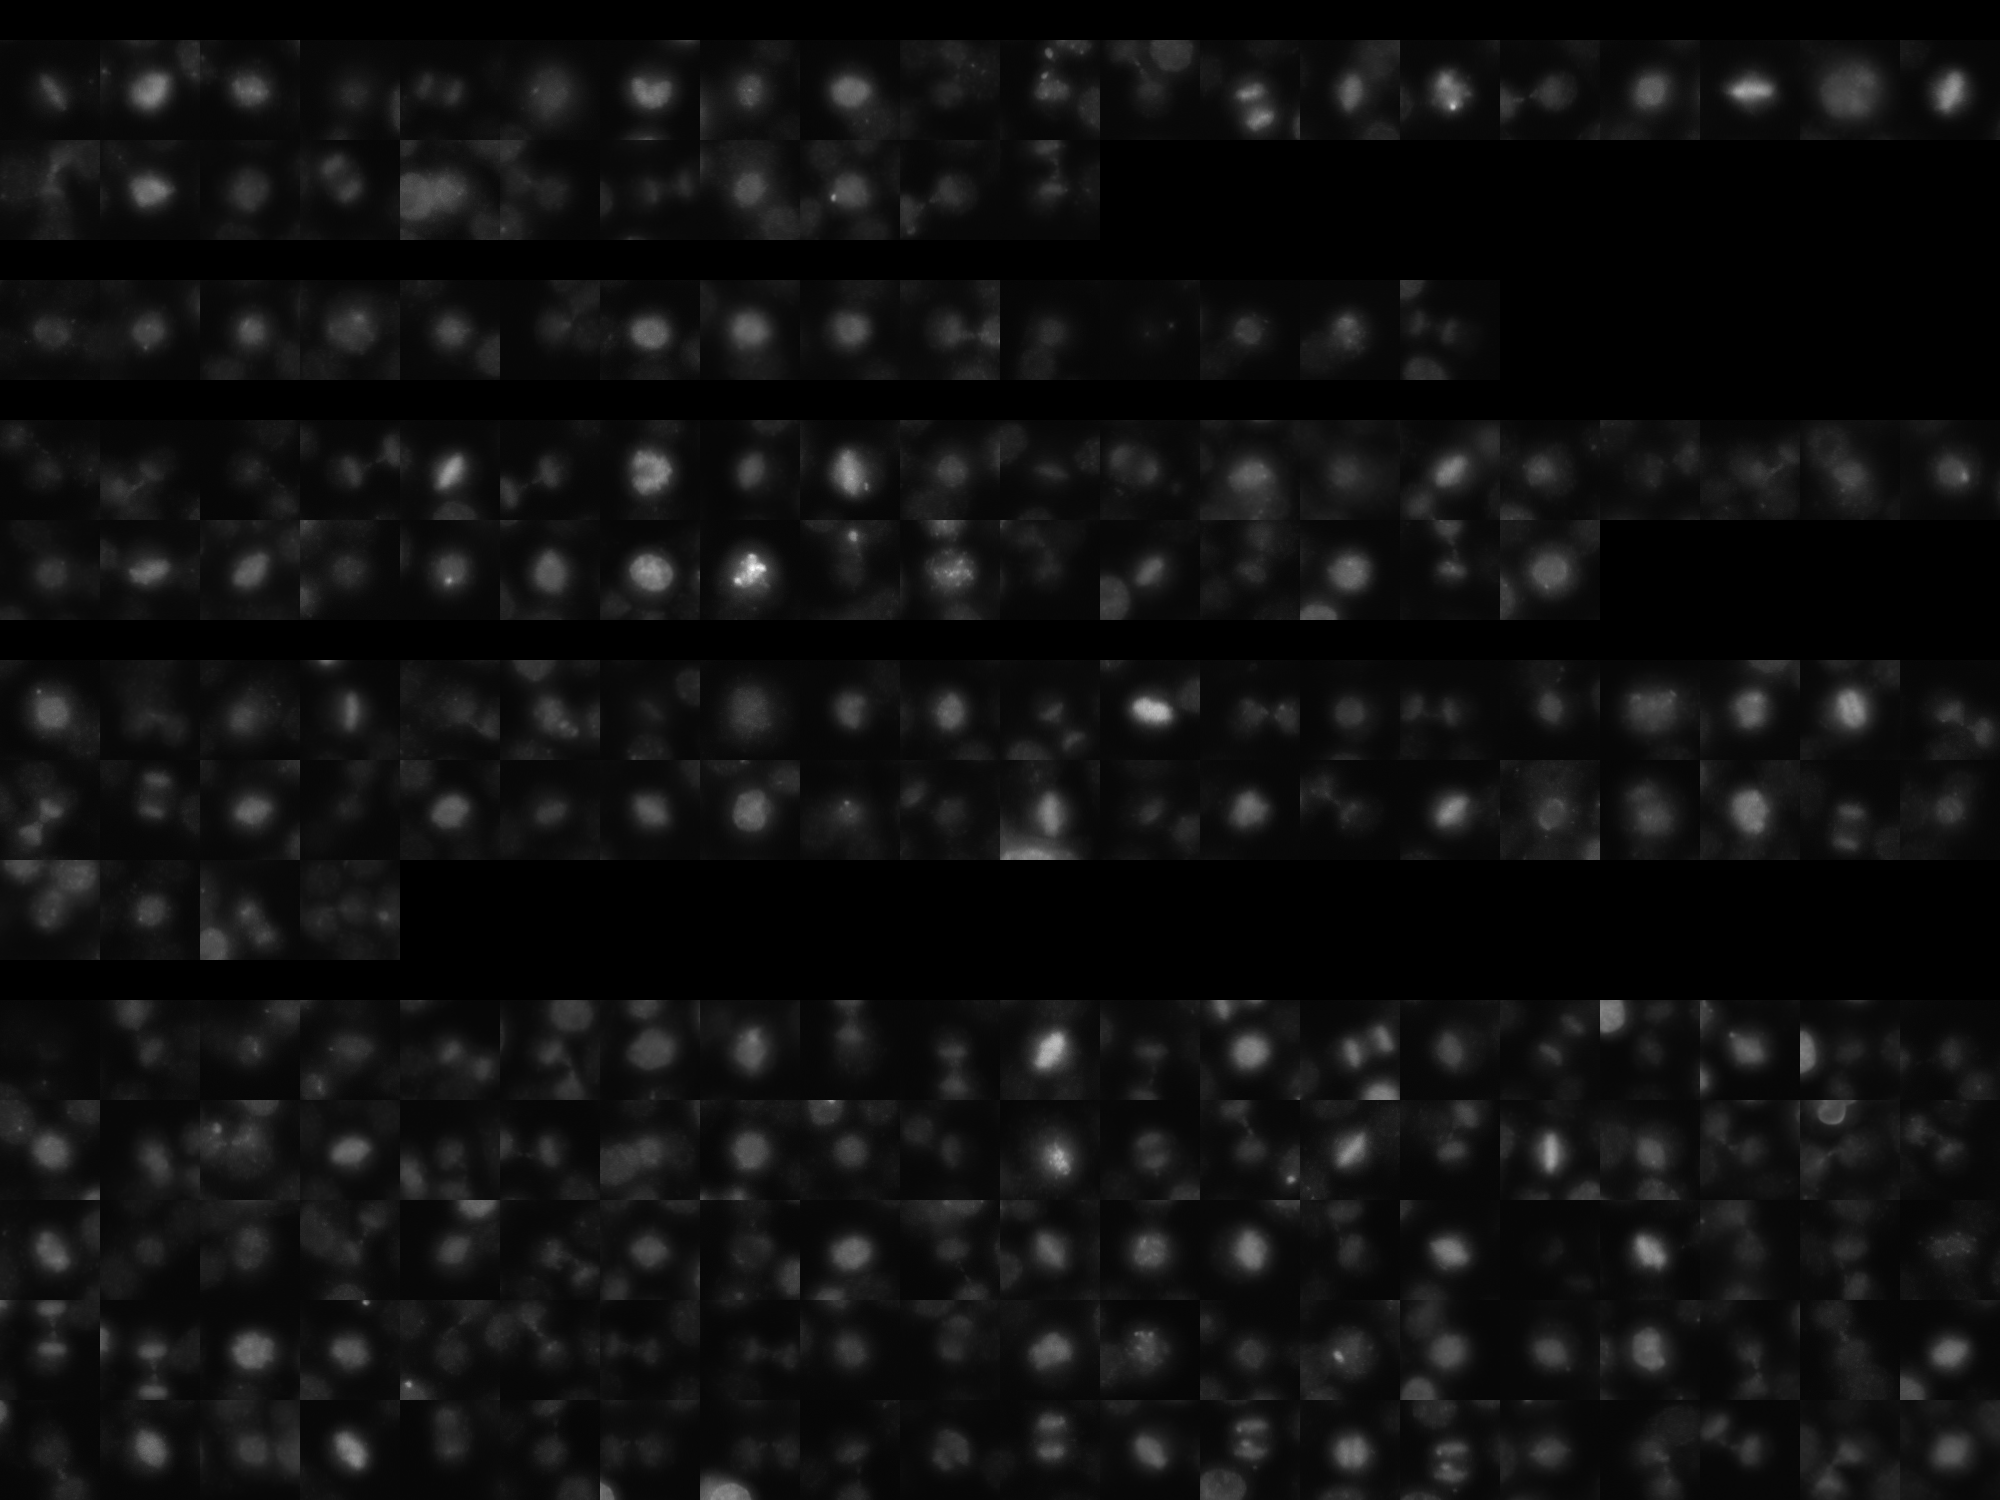
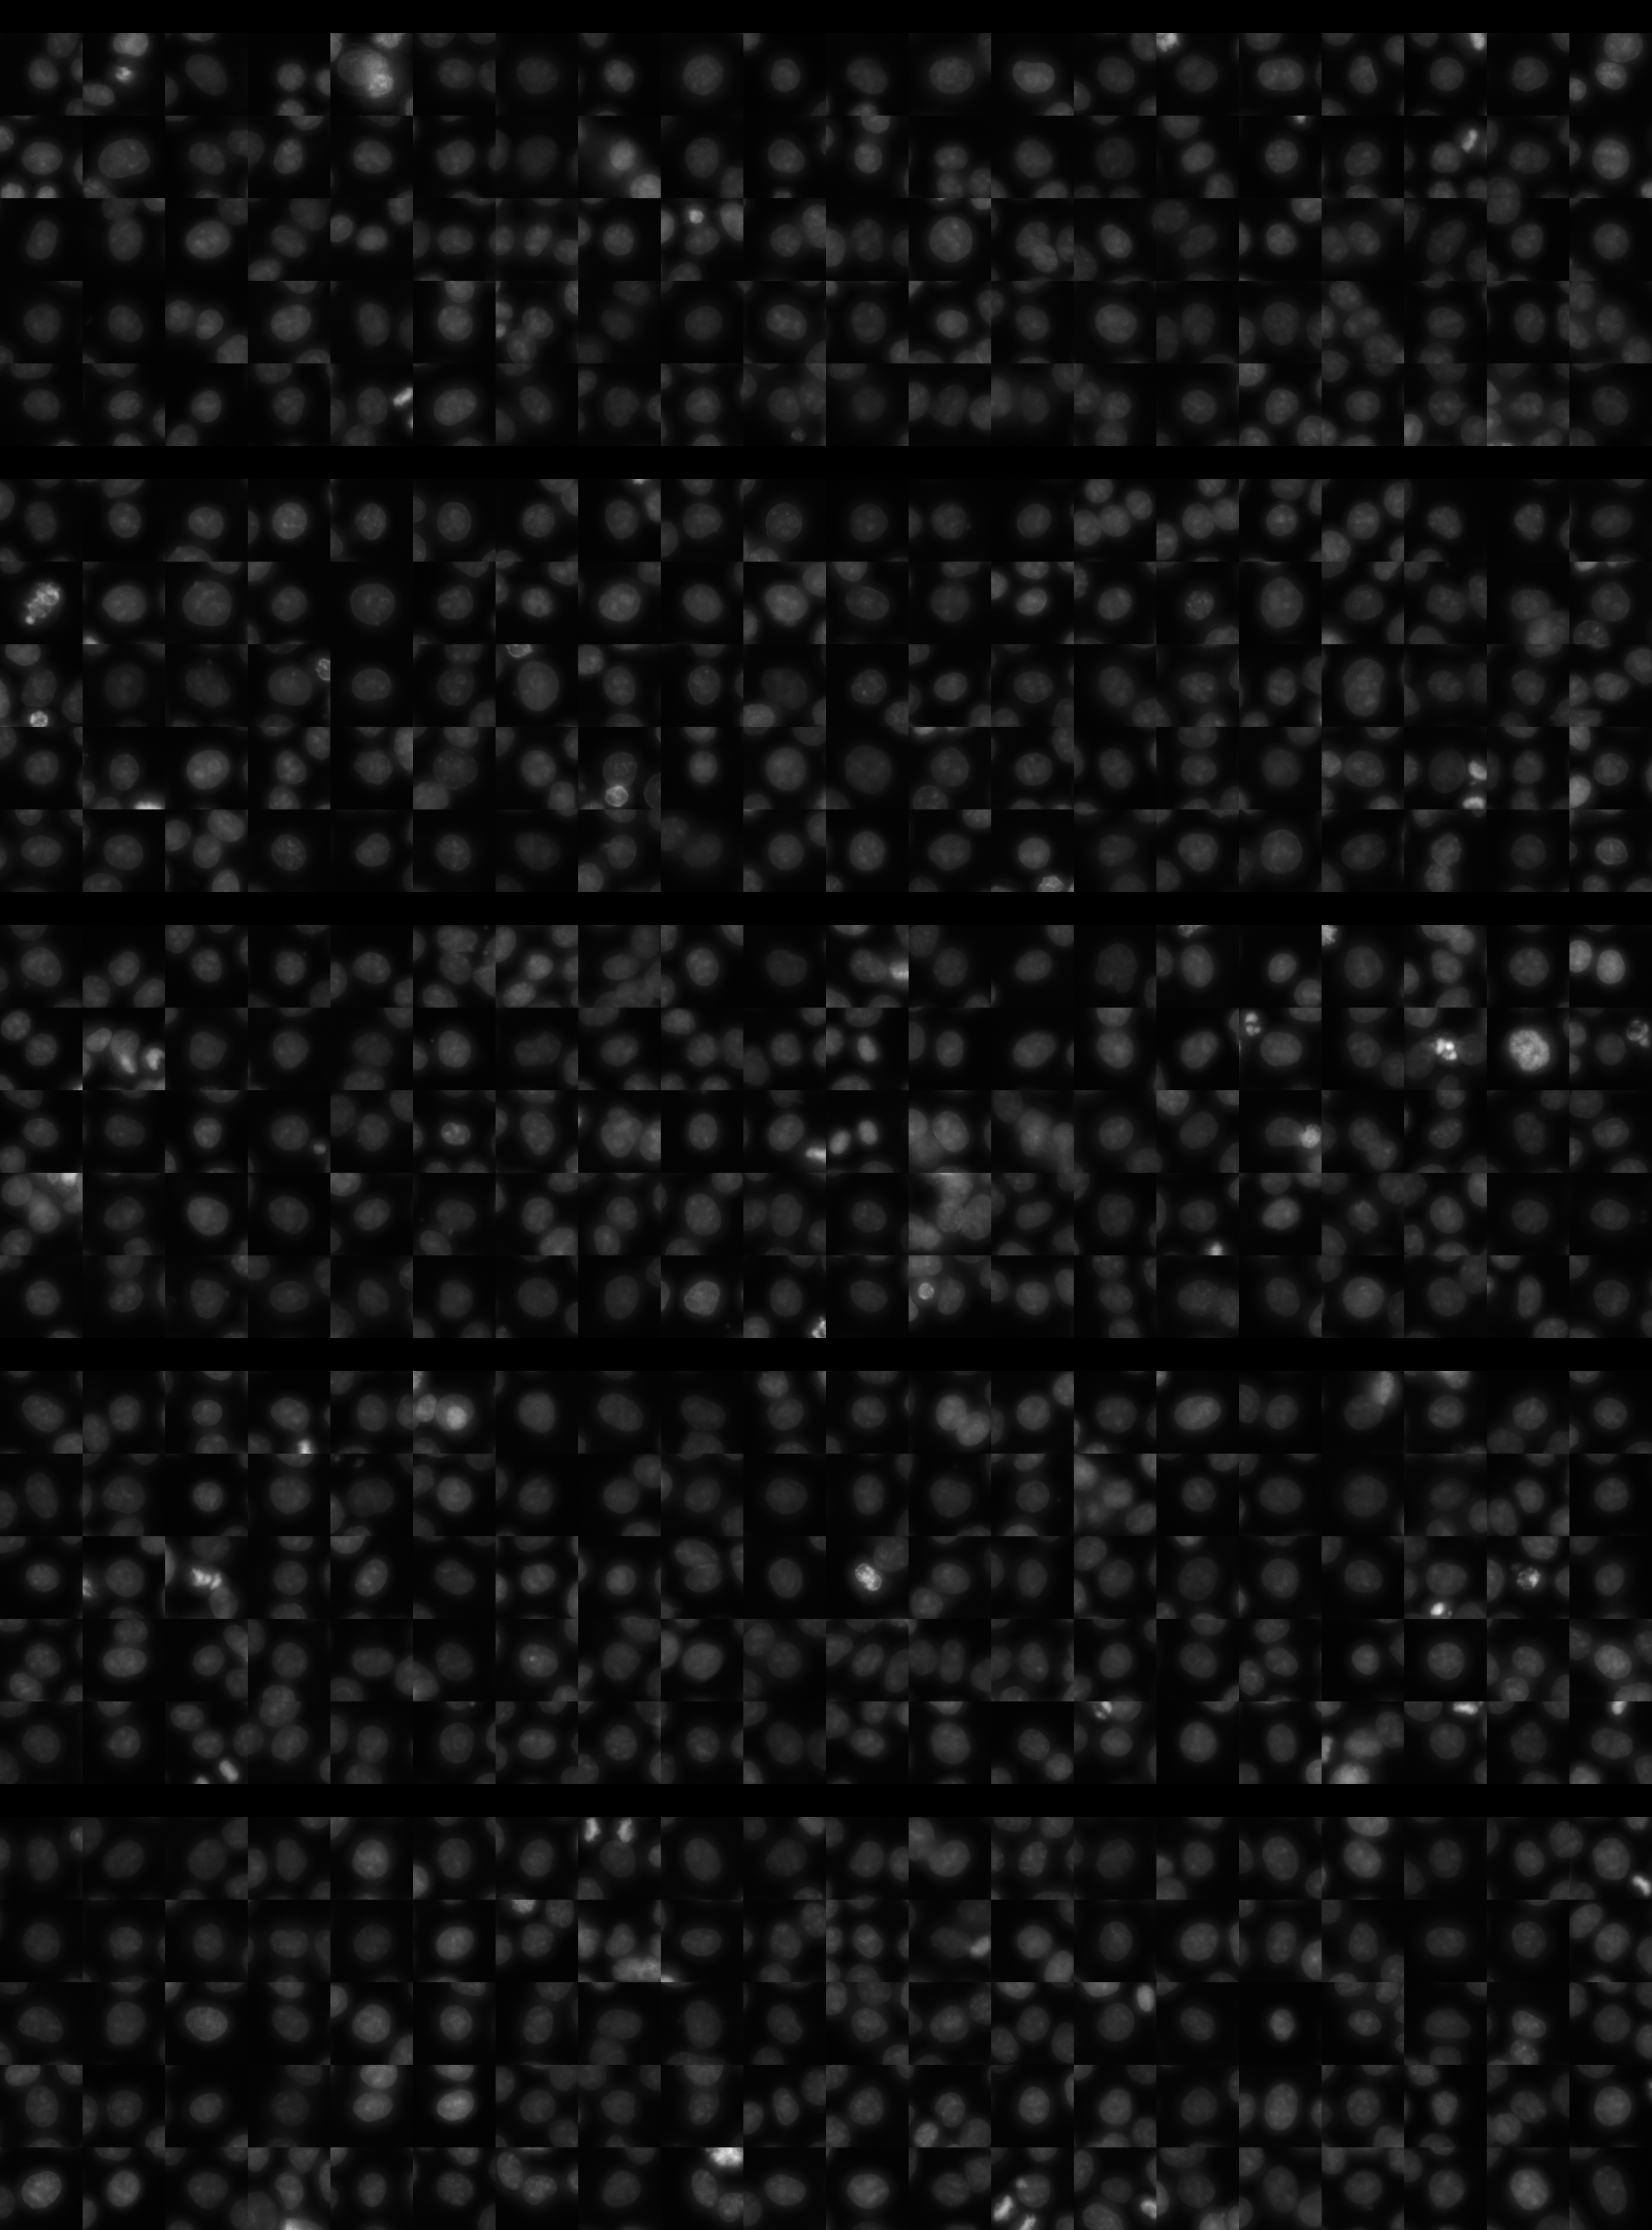
sgRNA 1: ACAACCAACCTAAGATTGGA (interphase cells: 1562, mitotic cells: 31)
sgRNA 2: ATATGAAAGCAAGTCACTAG (interphase cells: 1085, mitotic cells: 15)
sgRNA 3: GATTTCACTATTGGTCGGAA (interphase cells: 1115, mitotic cells: 36)
sgRNA 4: GGTTCTAGCAACAATACTGG (interphase cells: 1905, mitotic cells: 44)

Interphase Cluster

Mitotic Cluster

Overview

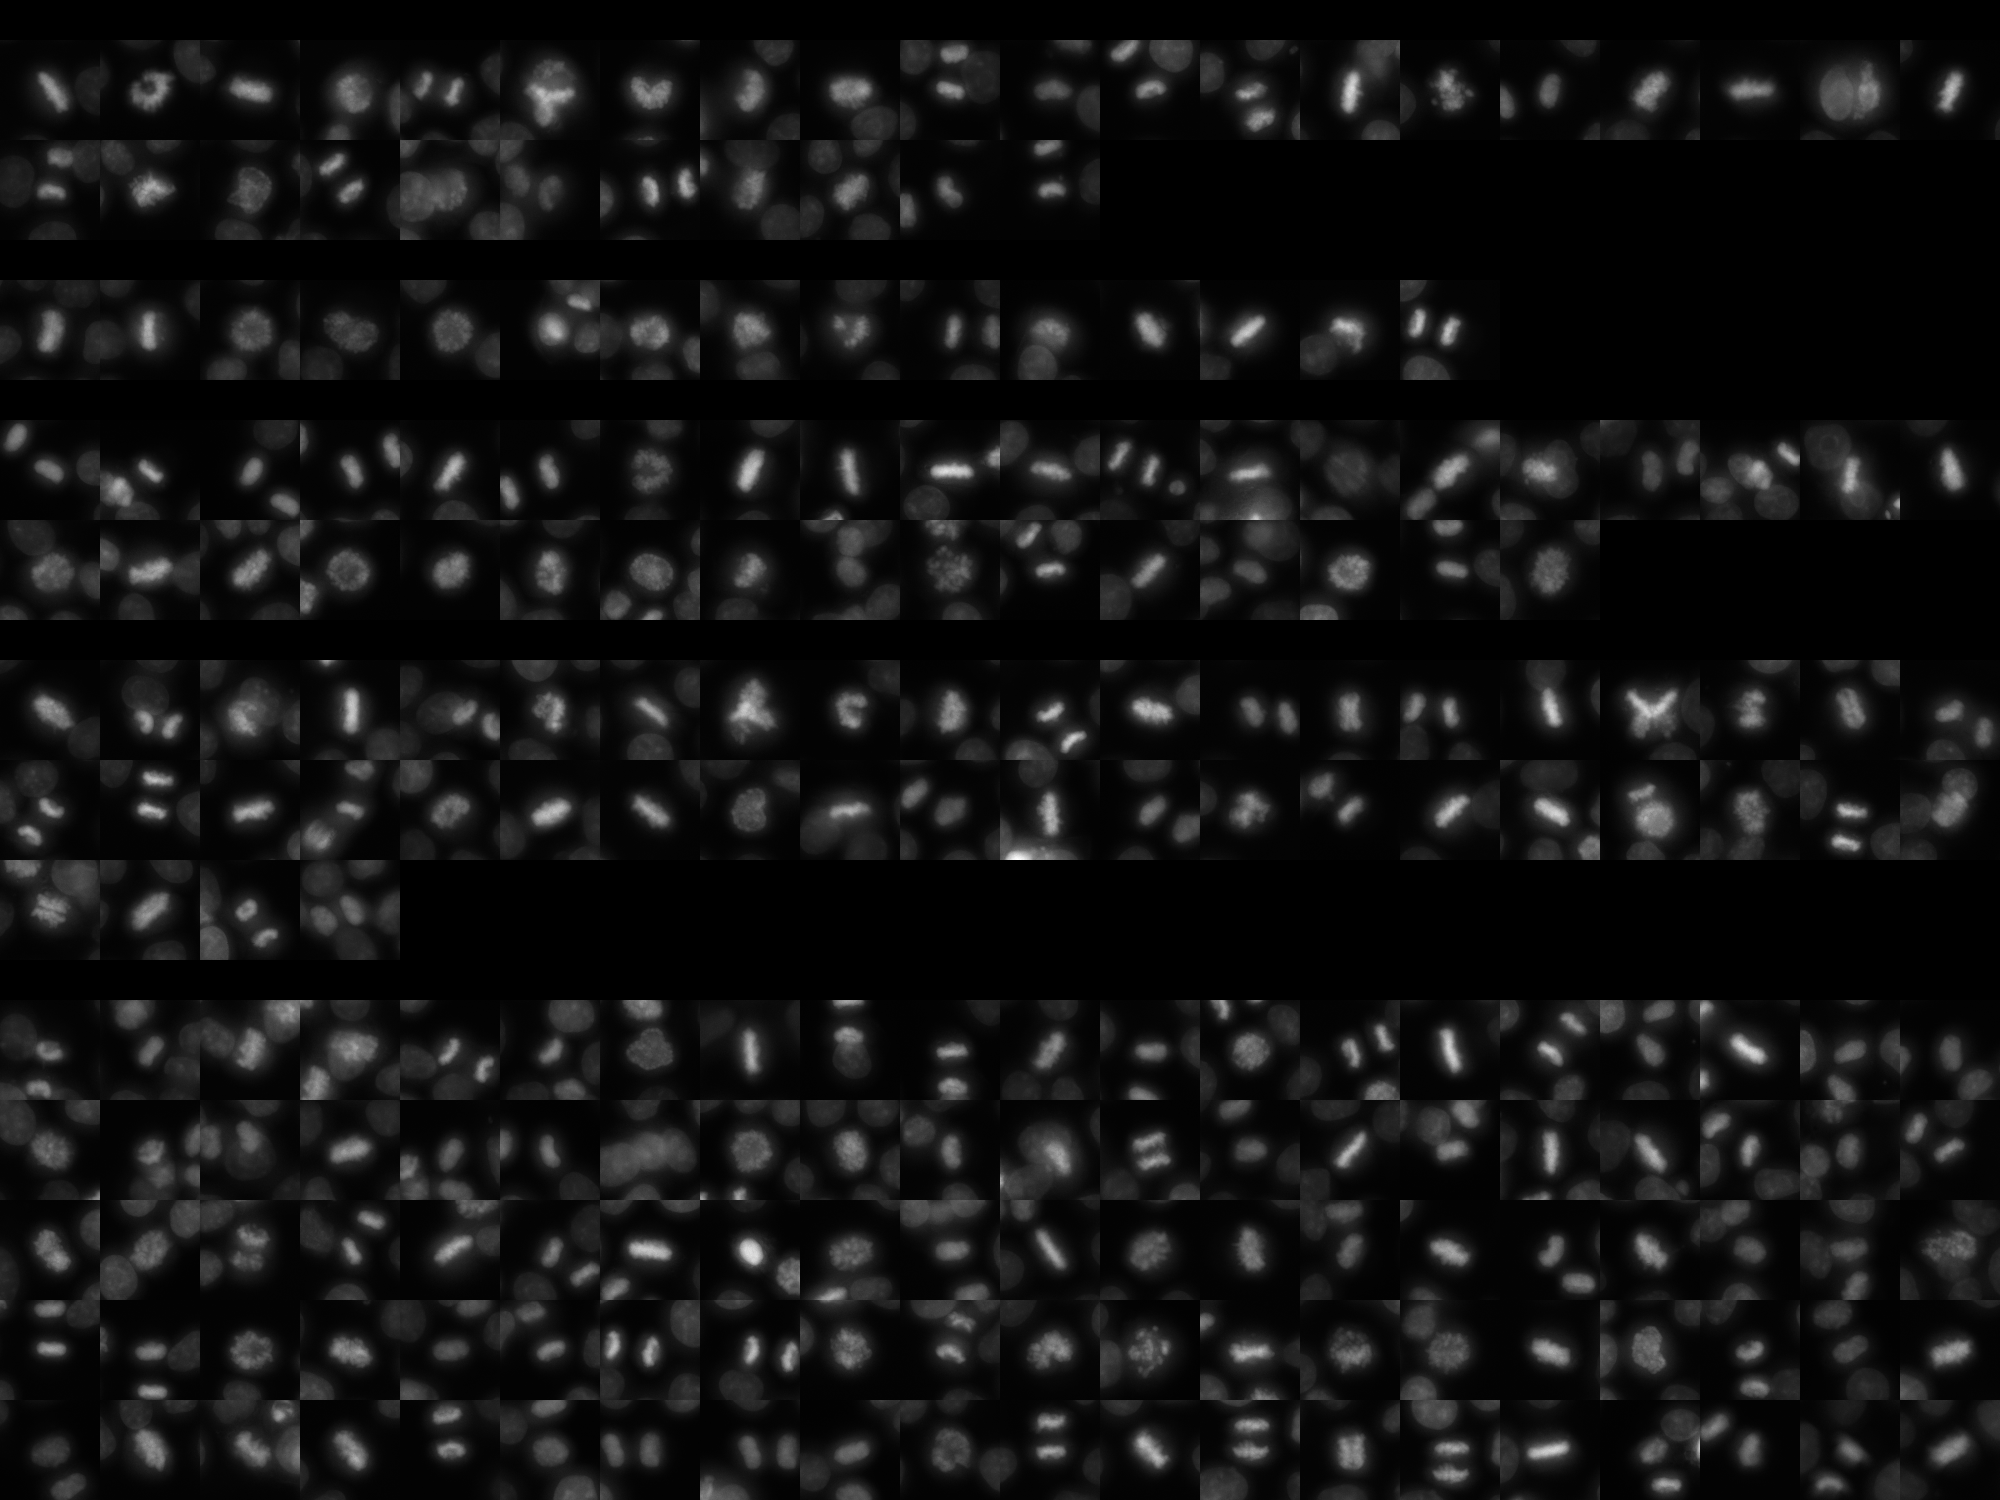
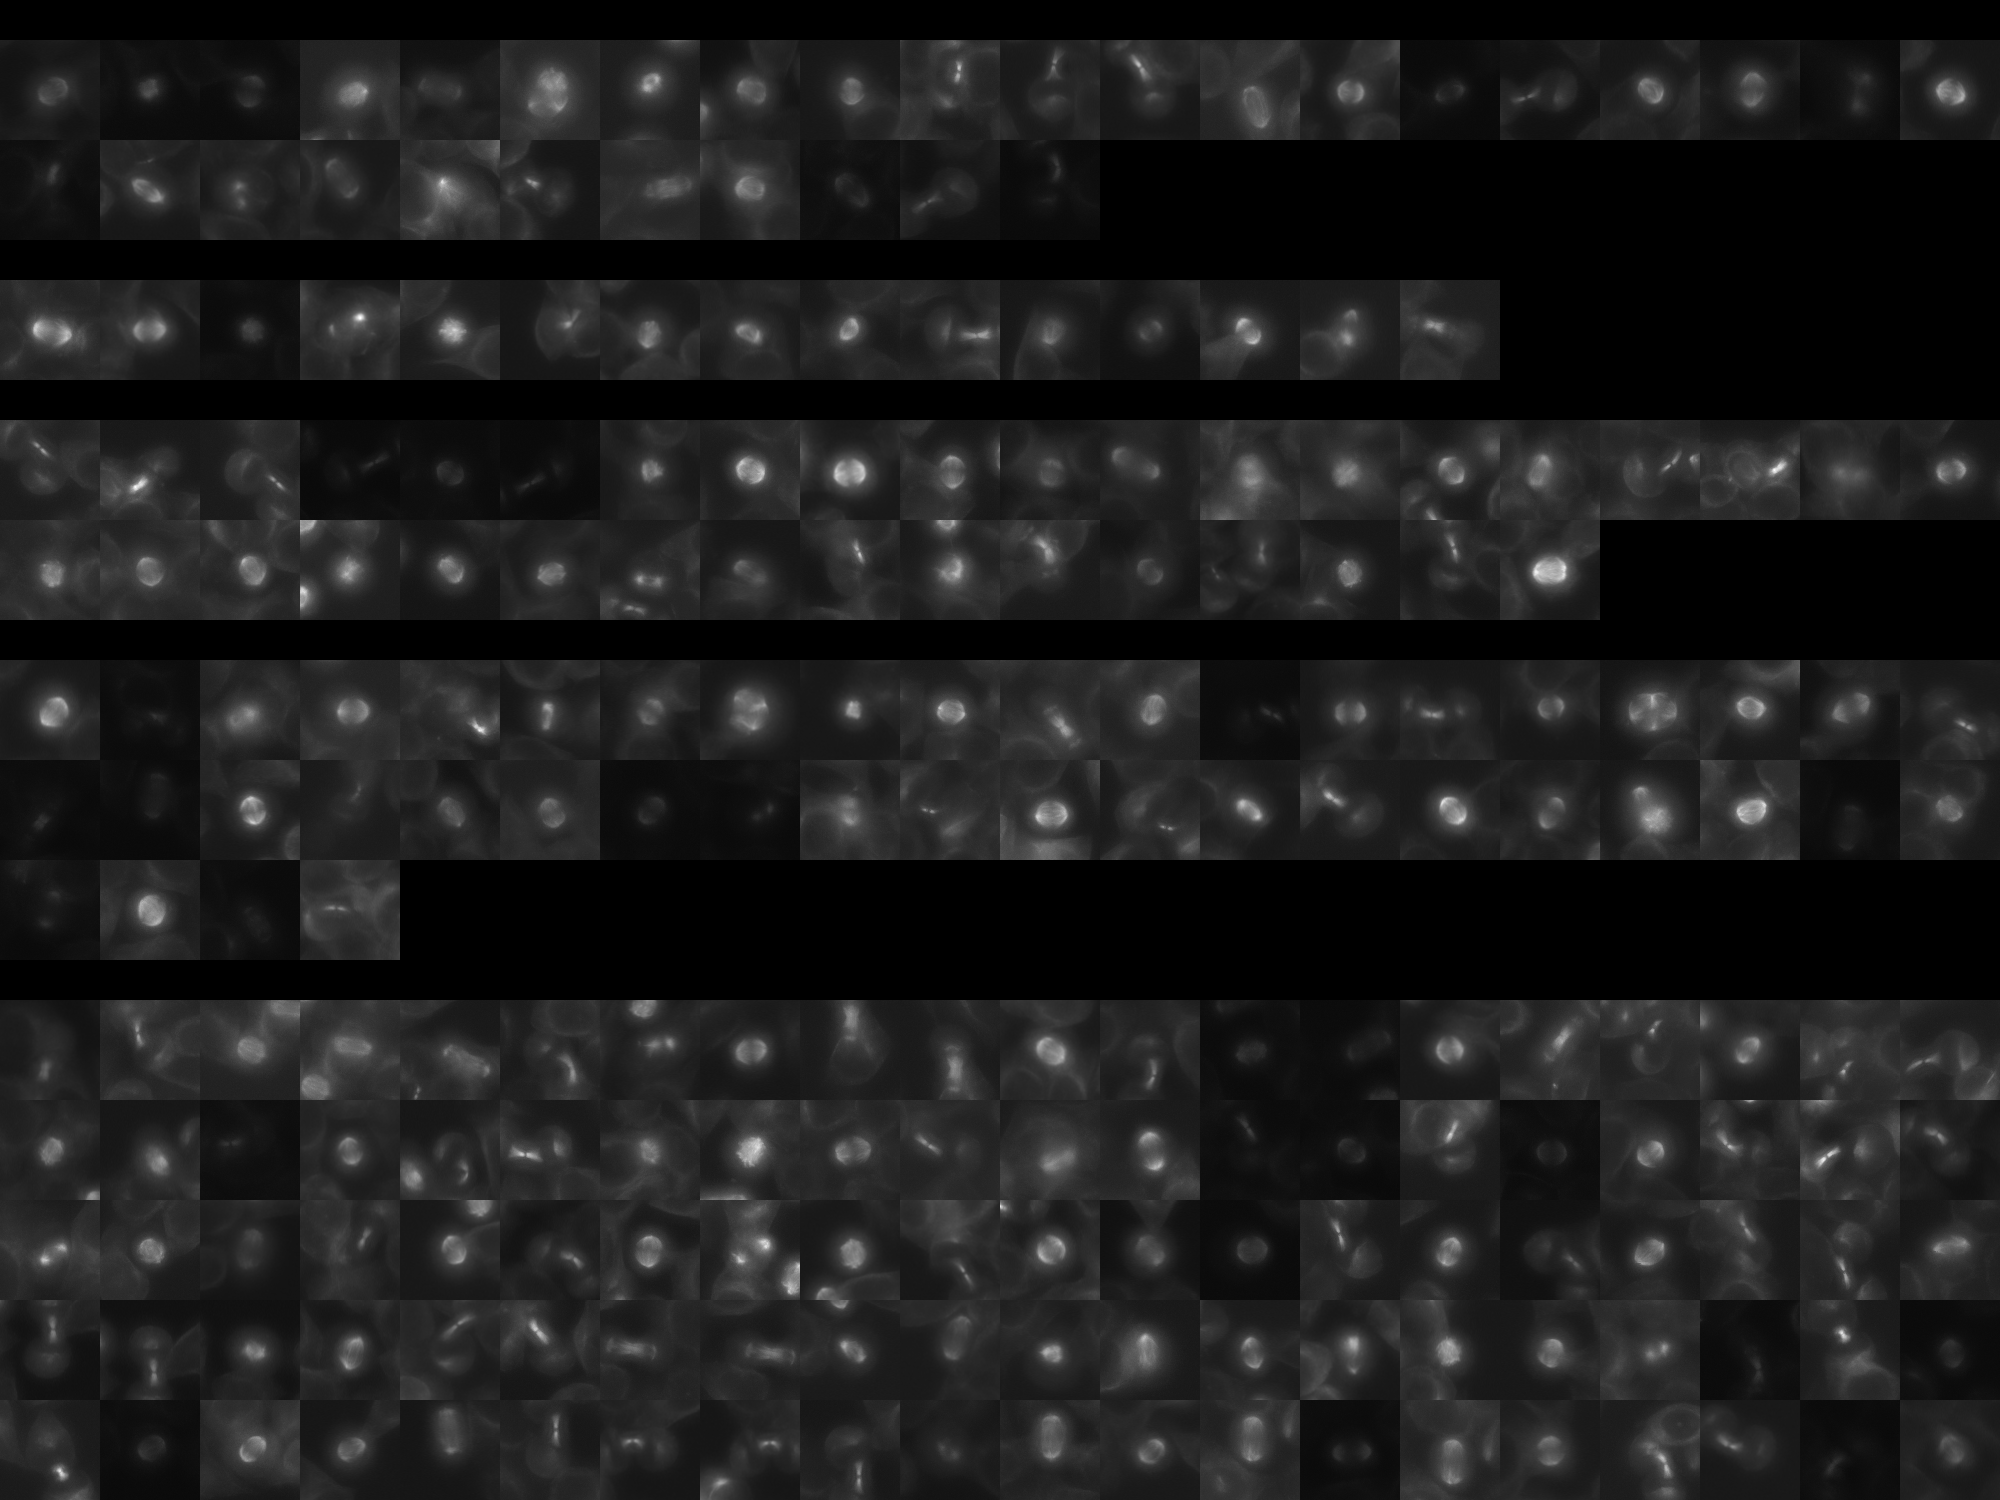
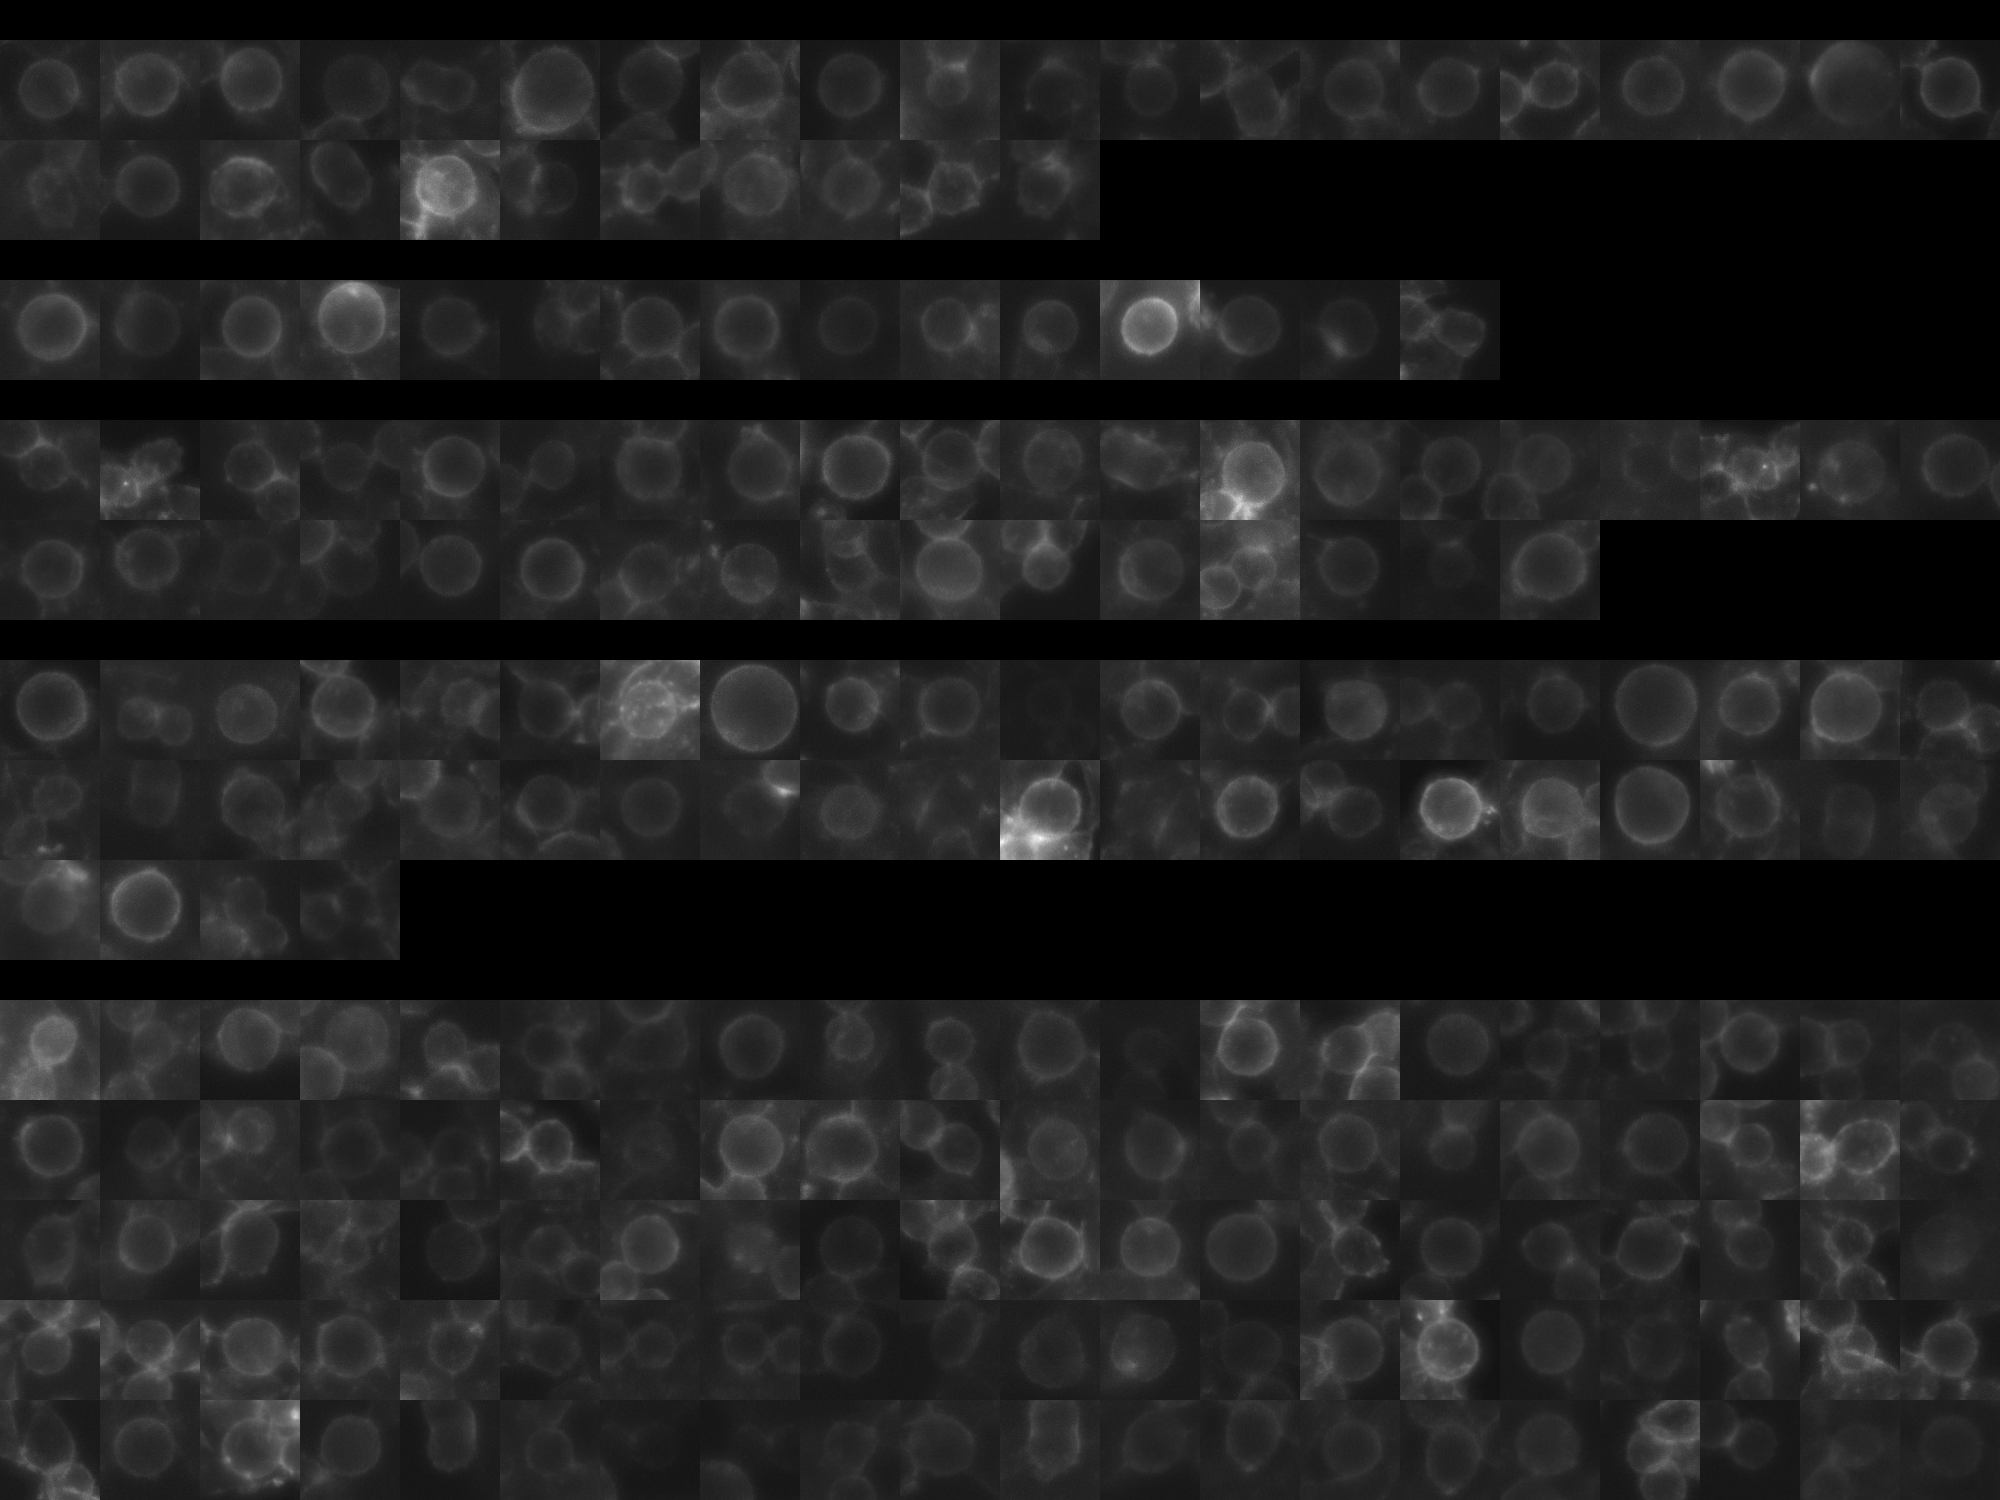
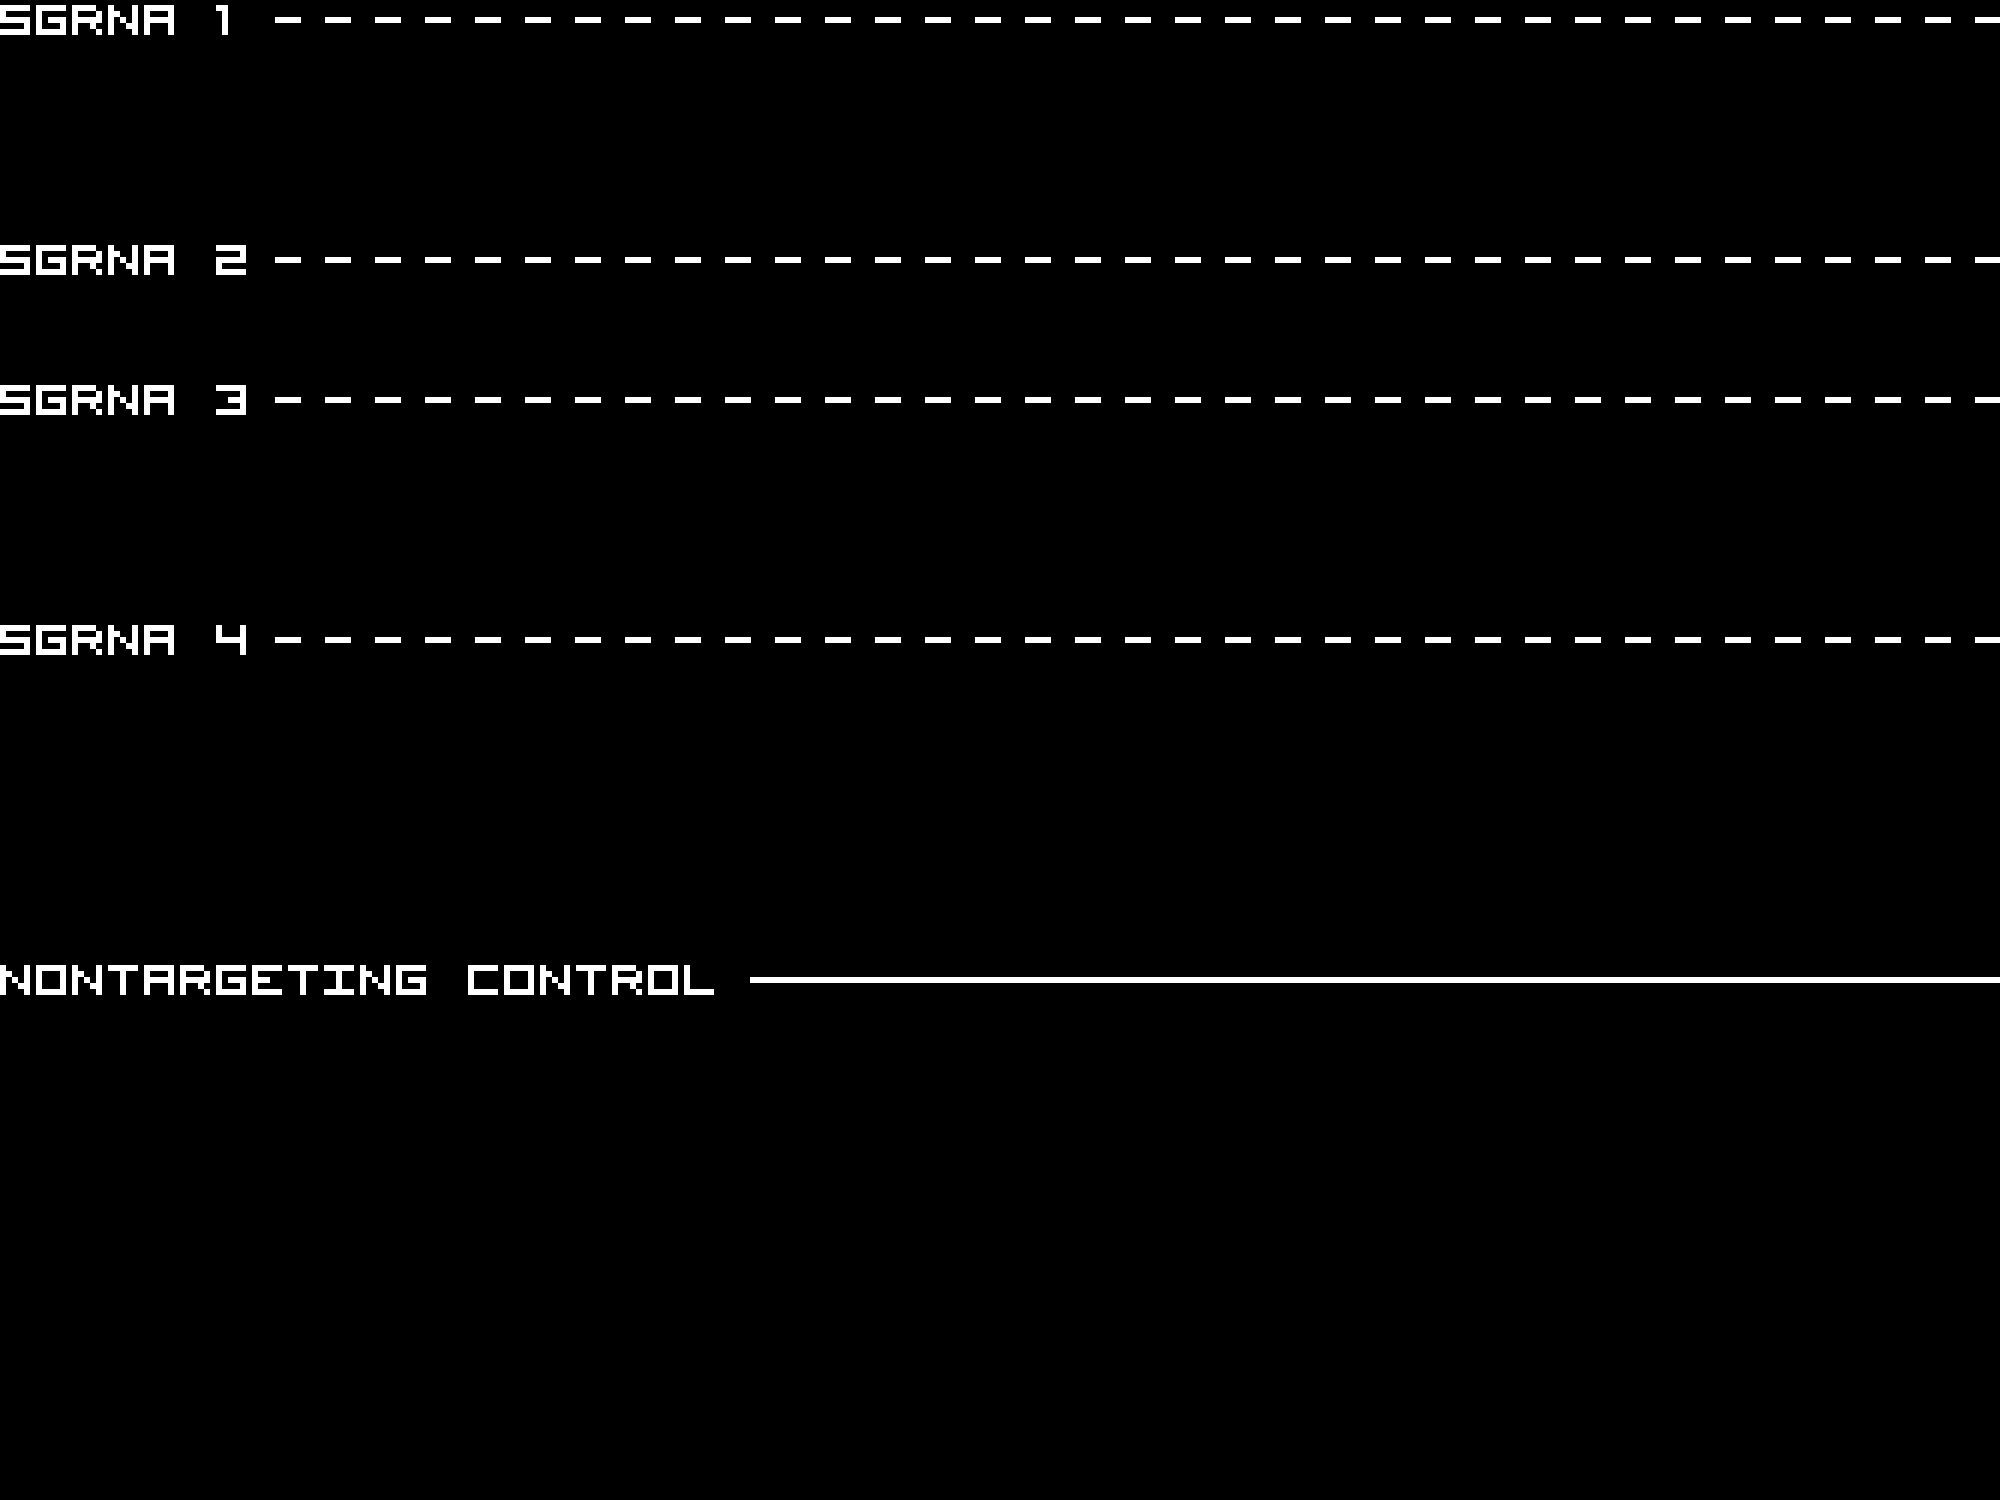
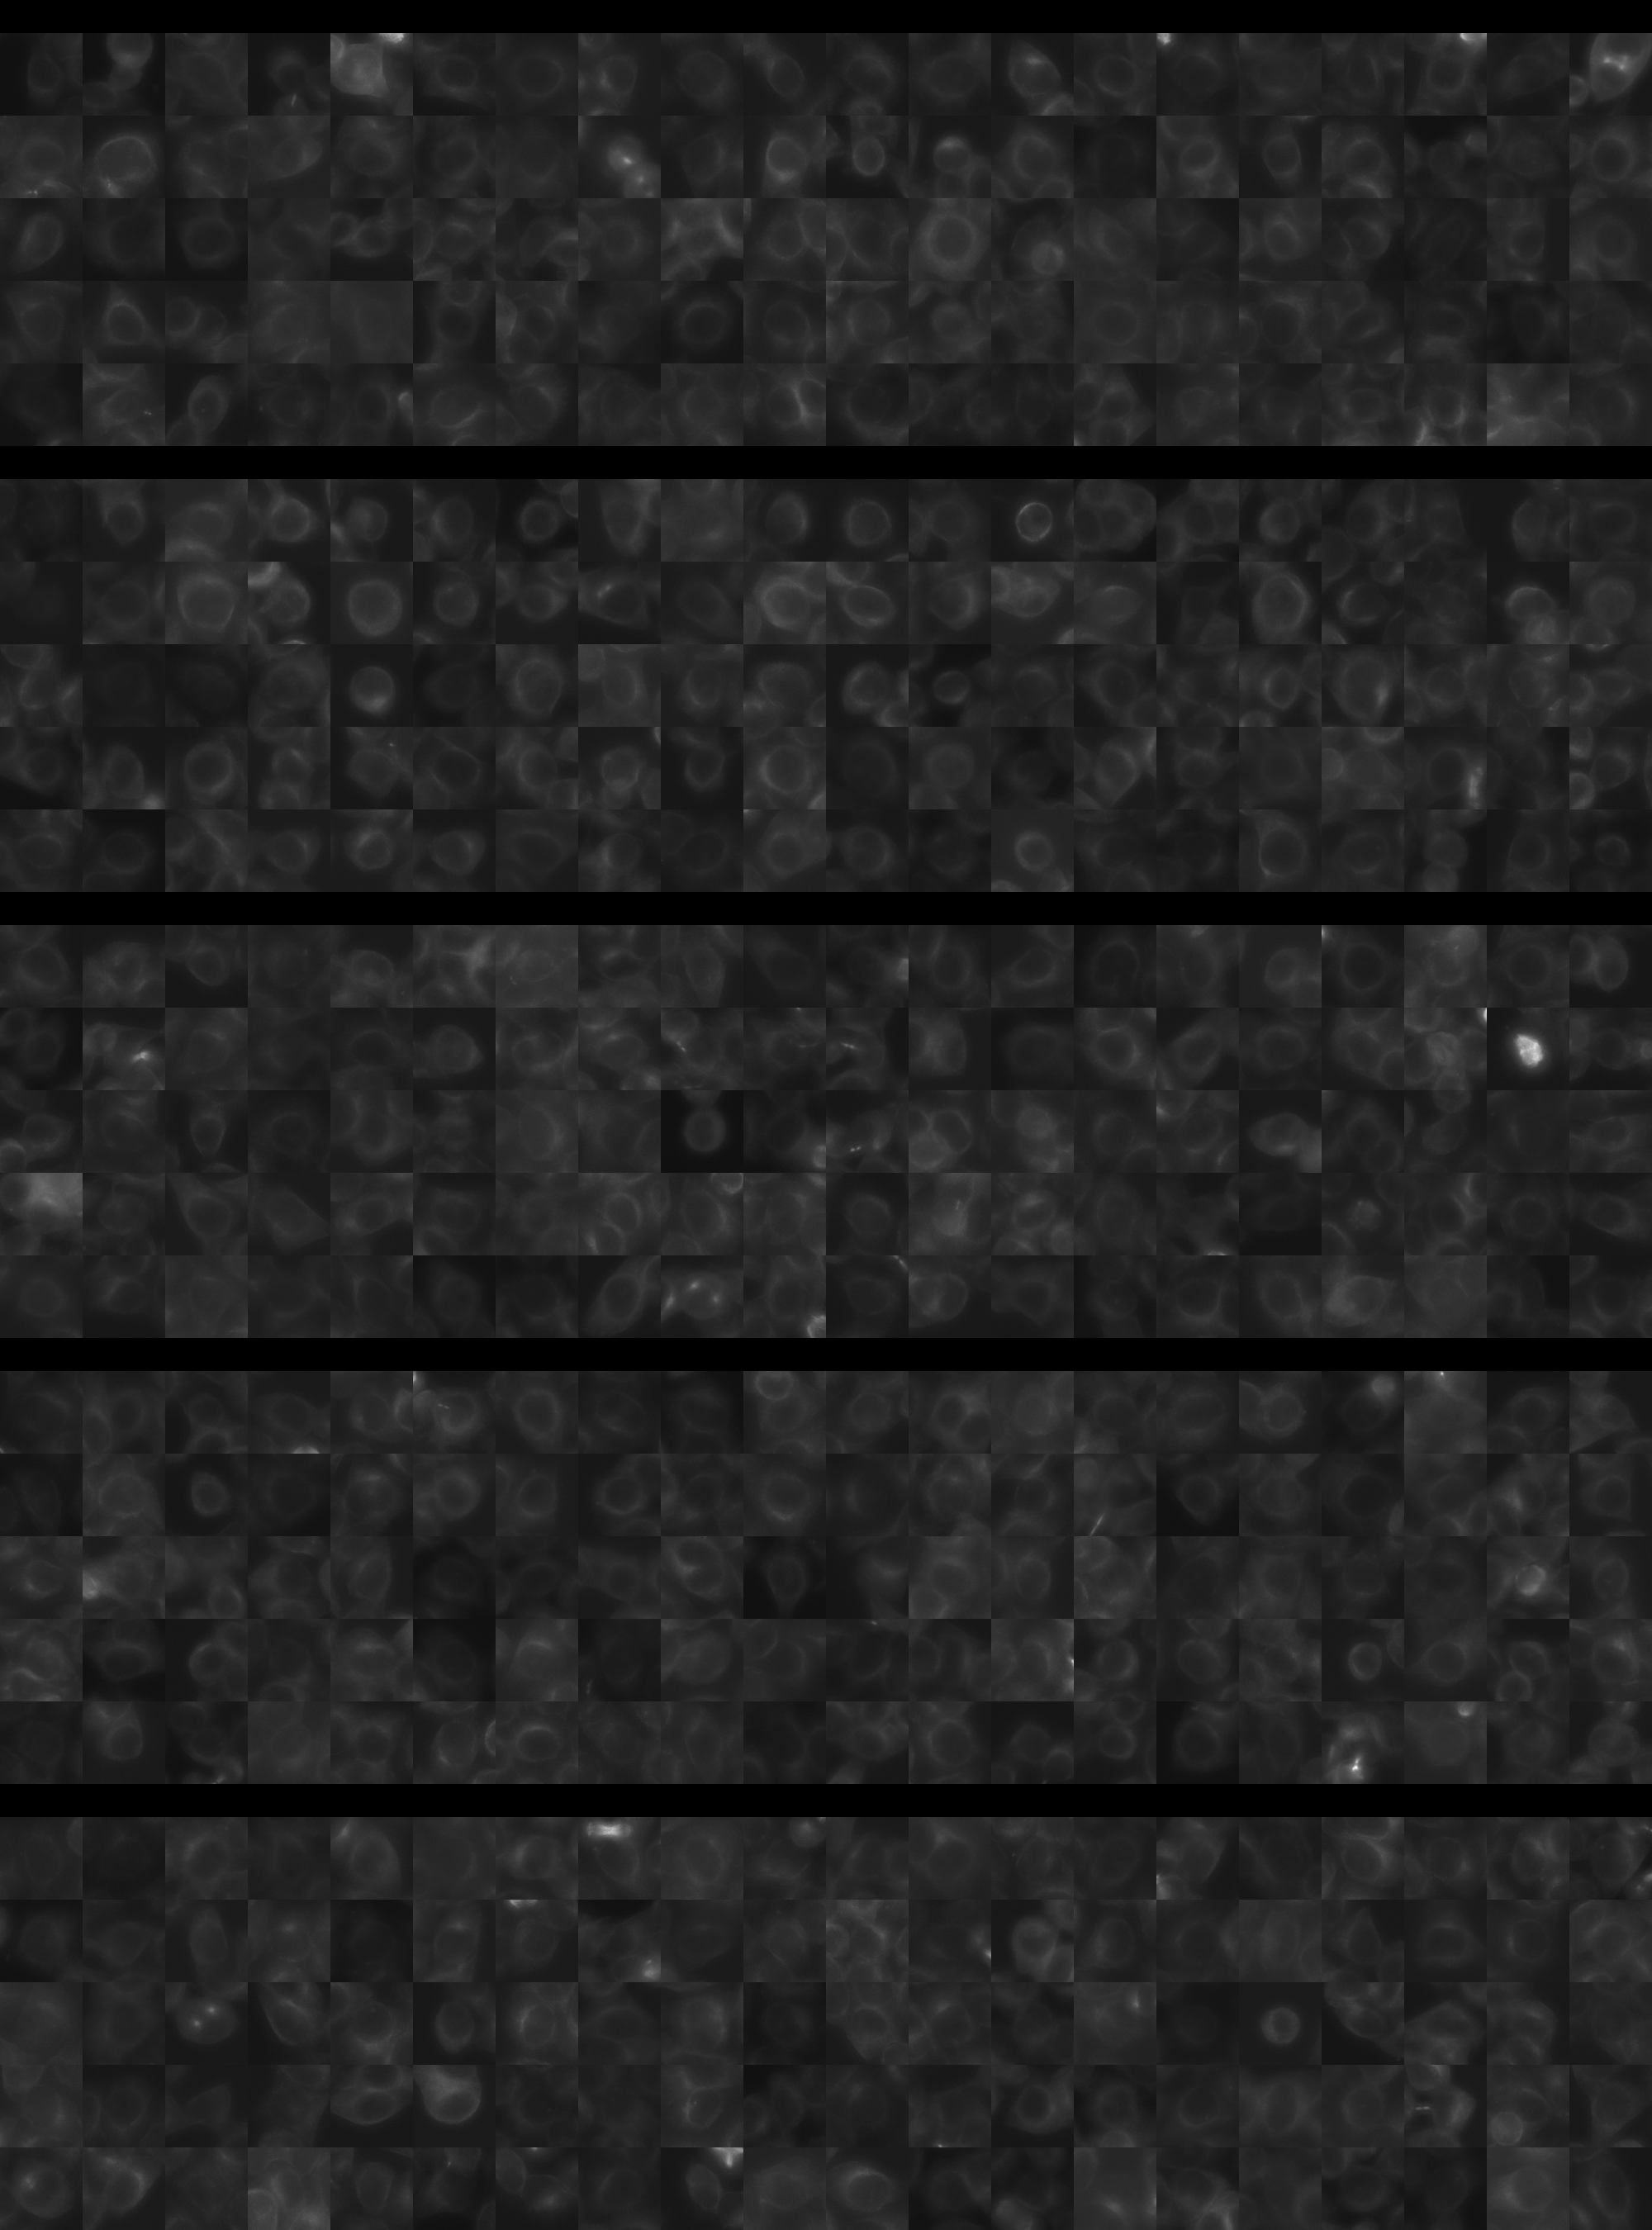
Each montage below shows randomly selected individual cell images for the same target gene separated by sgRNA, along with an example montage of cells expressing a non-targeting negative control sgRNA at the bottom. sgRNA labels in the montages correspond to the numbered sgRNA sequences in the gene info table above. The DNA (blue) and tubulin (green) channels are displayed by default, with gH2AX (grayscale) and actin (yellow) available using the check boxes. Channel brightness, contrast, and opacity are adjustable by clicking the arrow next to the channel name. When only one channel is selected, the display defaults to grayscale. Click the “Zoom” checkbox above the channel controls to enable image zooming (via scrolling) and panning (via click-and-drag).

The cell boxes displayed for this gene are square, 30.36 μm per side for the interphase montage and 30.36 μm per side for the mitotic montage.
Features

Interphase Score Rank FDR q-value
Nucleus DNA Integrated -4.315e-02 4745 of 5322 0.407
Nucleus DNA Mean 0.026 1244 of 5322 0.548
Nucleus gH2AX Mean 0.094 2108 of 5322 0.022
Nucleus DNA - gH2AX Correlation -1.092e-01 4205 of 5322 1.021e-04
Nucleus Shape Area -6.899e-02 4663 of 5322 0.083
Nucleus Shape Eccentricity -2.241e-01 5275 of 5322 4.529e-04
Nucleus Shape Form Factor 0.007 490 of 5322 0.757
Nucleus Shape Solidity -6.047e-02 3156 of 5322 0.076
Cell DNA Mass Displacement 0.032 2115 of 5322 0.614
Cell Tubulin Mean -3.673e-02 4010 of 5322 0.480
Cell Tubulin Mass Displacement -3.115e-02 4418 of 5322 0.574
Cell Actin Mean -7.472e-03 3253 of 5322 0.937
Cell Tubulin - Actin Correlation 0.038 1847 of 5322 0.384
Cell DNA - Tubulin Correlation -7.304e-02 5120 of 5322 0.030
Cell Shape Area -3.062e-02 4045 of 5322 0.489
Cell Shape Eccentricity -2.062e-02 4763 of 5322 0.839
Mitotic Score Rank FDR q-value
Nucleus DNA Integrated 0.279 655 of 5322 0.737
Nucleus DNA Mean 0.219 485 of 5322 1.000
Nucleus DNA Mass Displacement 0.027 3083 of 5322 0.999
Nucleus DNA Mean Frac 3 -9.412e-02 4371 of 5322 1.000
Nucleus gH2AX Mean 0.035 2452 of 5322 1.000
Nucleus gH2AX Mean Frac 0 0.184 396 of 5322 1.000
Nucleus Tubulin Mean Frac 0 0.203 830 of 5322 0.999
Nucleus Tubulin Mean Edge -2.402e-01 5008 of 5322 0.938
Nucleus Tubulin Std Edge -2.503e-01 4826 of 5322 0.999
Nucleus Shape Area 0.289 840 of 5322 0.740
Nucleus Shape Eccentricity -2.700e-02 2519 of 5322 1.000
Nucleus Shape Form Factor -1.171e-01 3097 of 5322 0.998
Cell Tubulin Mean 0.009 3365 of 5322 1.000
Cell Tubulin Mean Frac 3 -8.614e-02 2748 of 5322 0.999
Cell Actin Mean 0.164 1159 of 5322 0.997
Cell Shape Area 0.144 2040 of 5322 0.998
( Reset Zoom )
Brightness
Contrast
Opacity
Brightness
Contrast
Opacity
Brightness
Contrast
Opacity
Brightness
Contrast
Opacity
Brightness
Contrast
Opacity

( Reset Zoom )
Brightness
Contrast
Opacity
Brightness
Contrast
Opacity
Brightness
Contrast
Opacity
Brightness
Contrast
Opacity
Brightness
Contrast
Opacity

MIT Central Accessability