NME5

Gene symbol: NME5
Gene: 8382
Uniprot Function: Does not seem to have NDK kinase activity. Confers protection from cell death by Bax and alters the cellular levels of several antioxidant enzymes including Gpx5. May play a role in spermiogenesis by increasing the ability of late-stage spermatids to eliminate reactive oxygen species (By similarity).
Mitotic Index 0.0229
Interphase Cluster: #67 (29 genes)
Mitotic Cluster: #18 (40 genes)
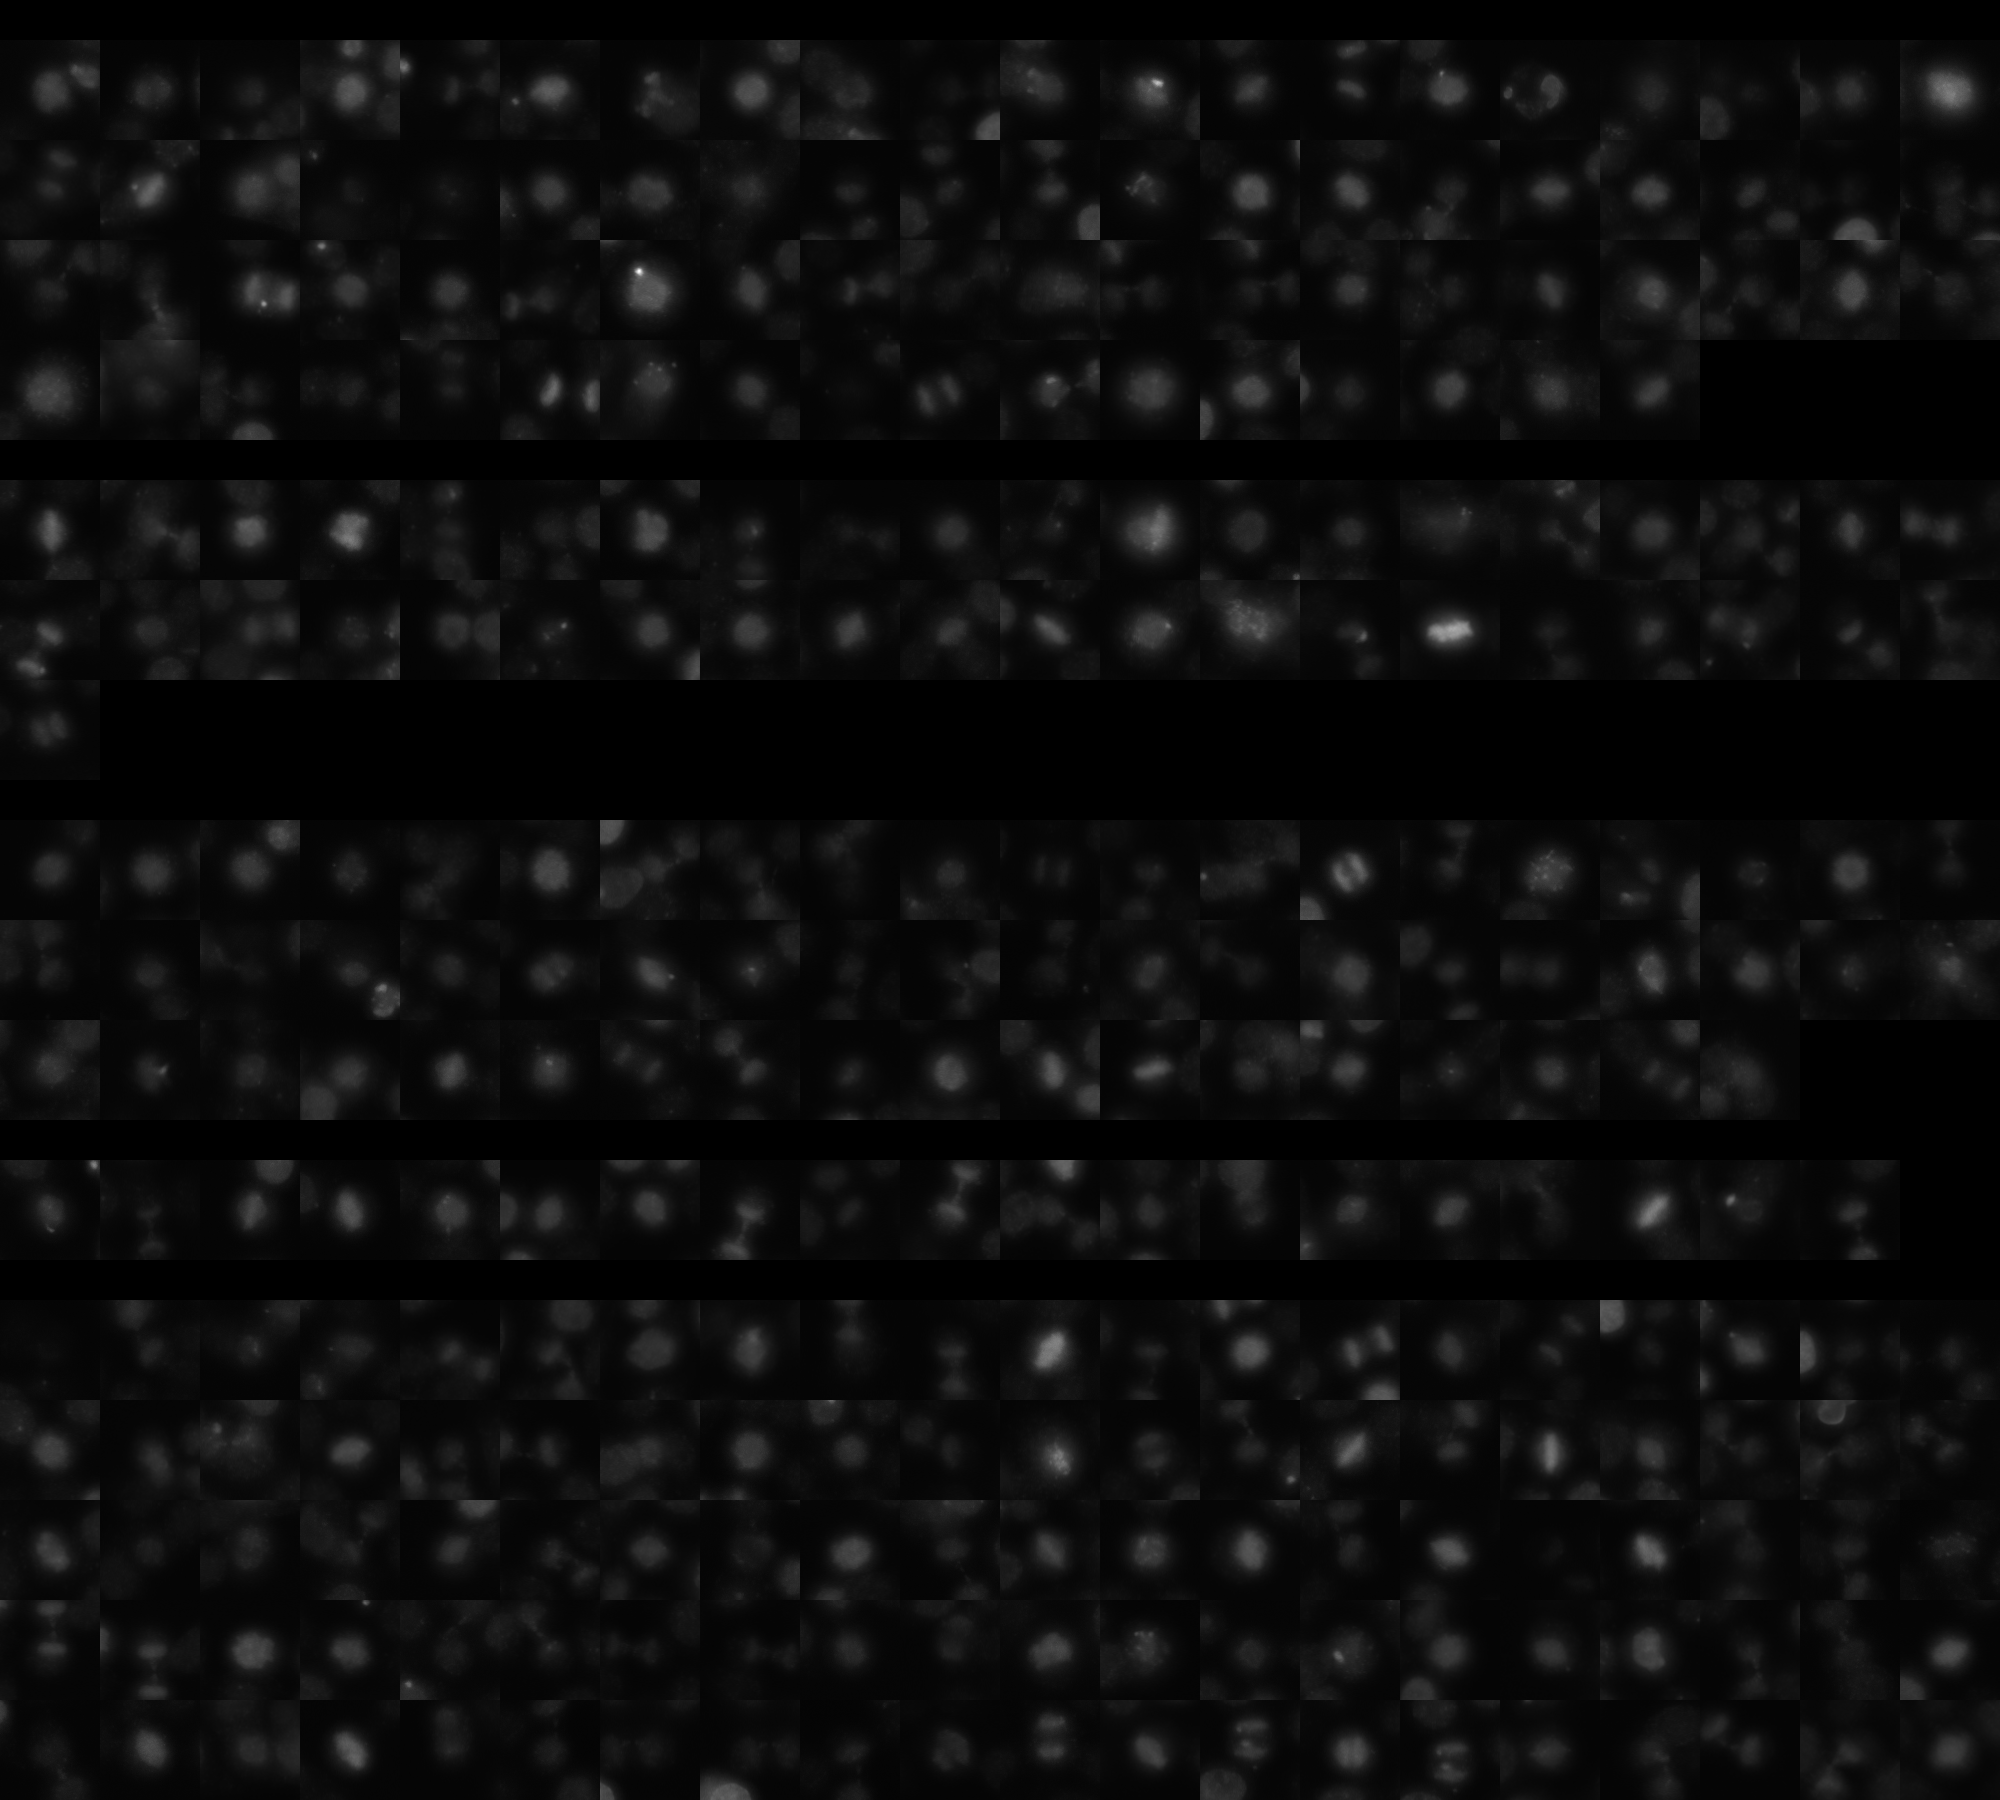
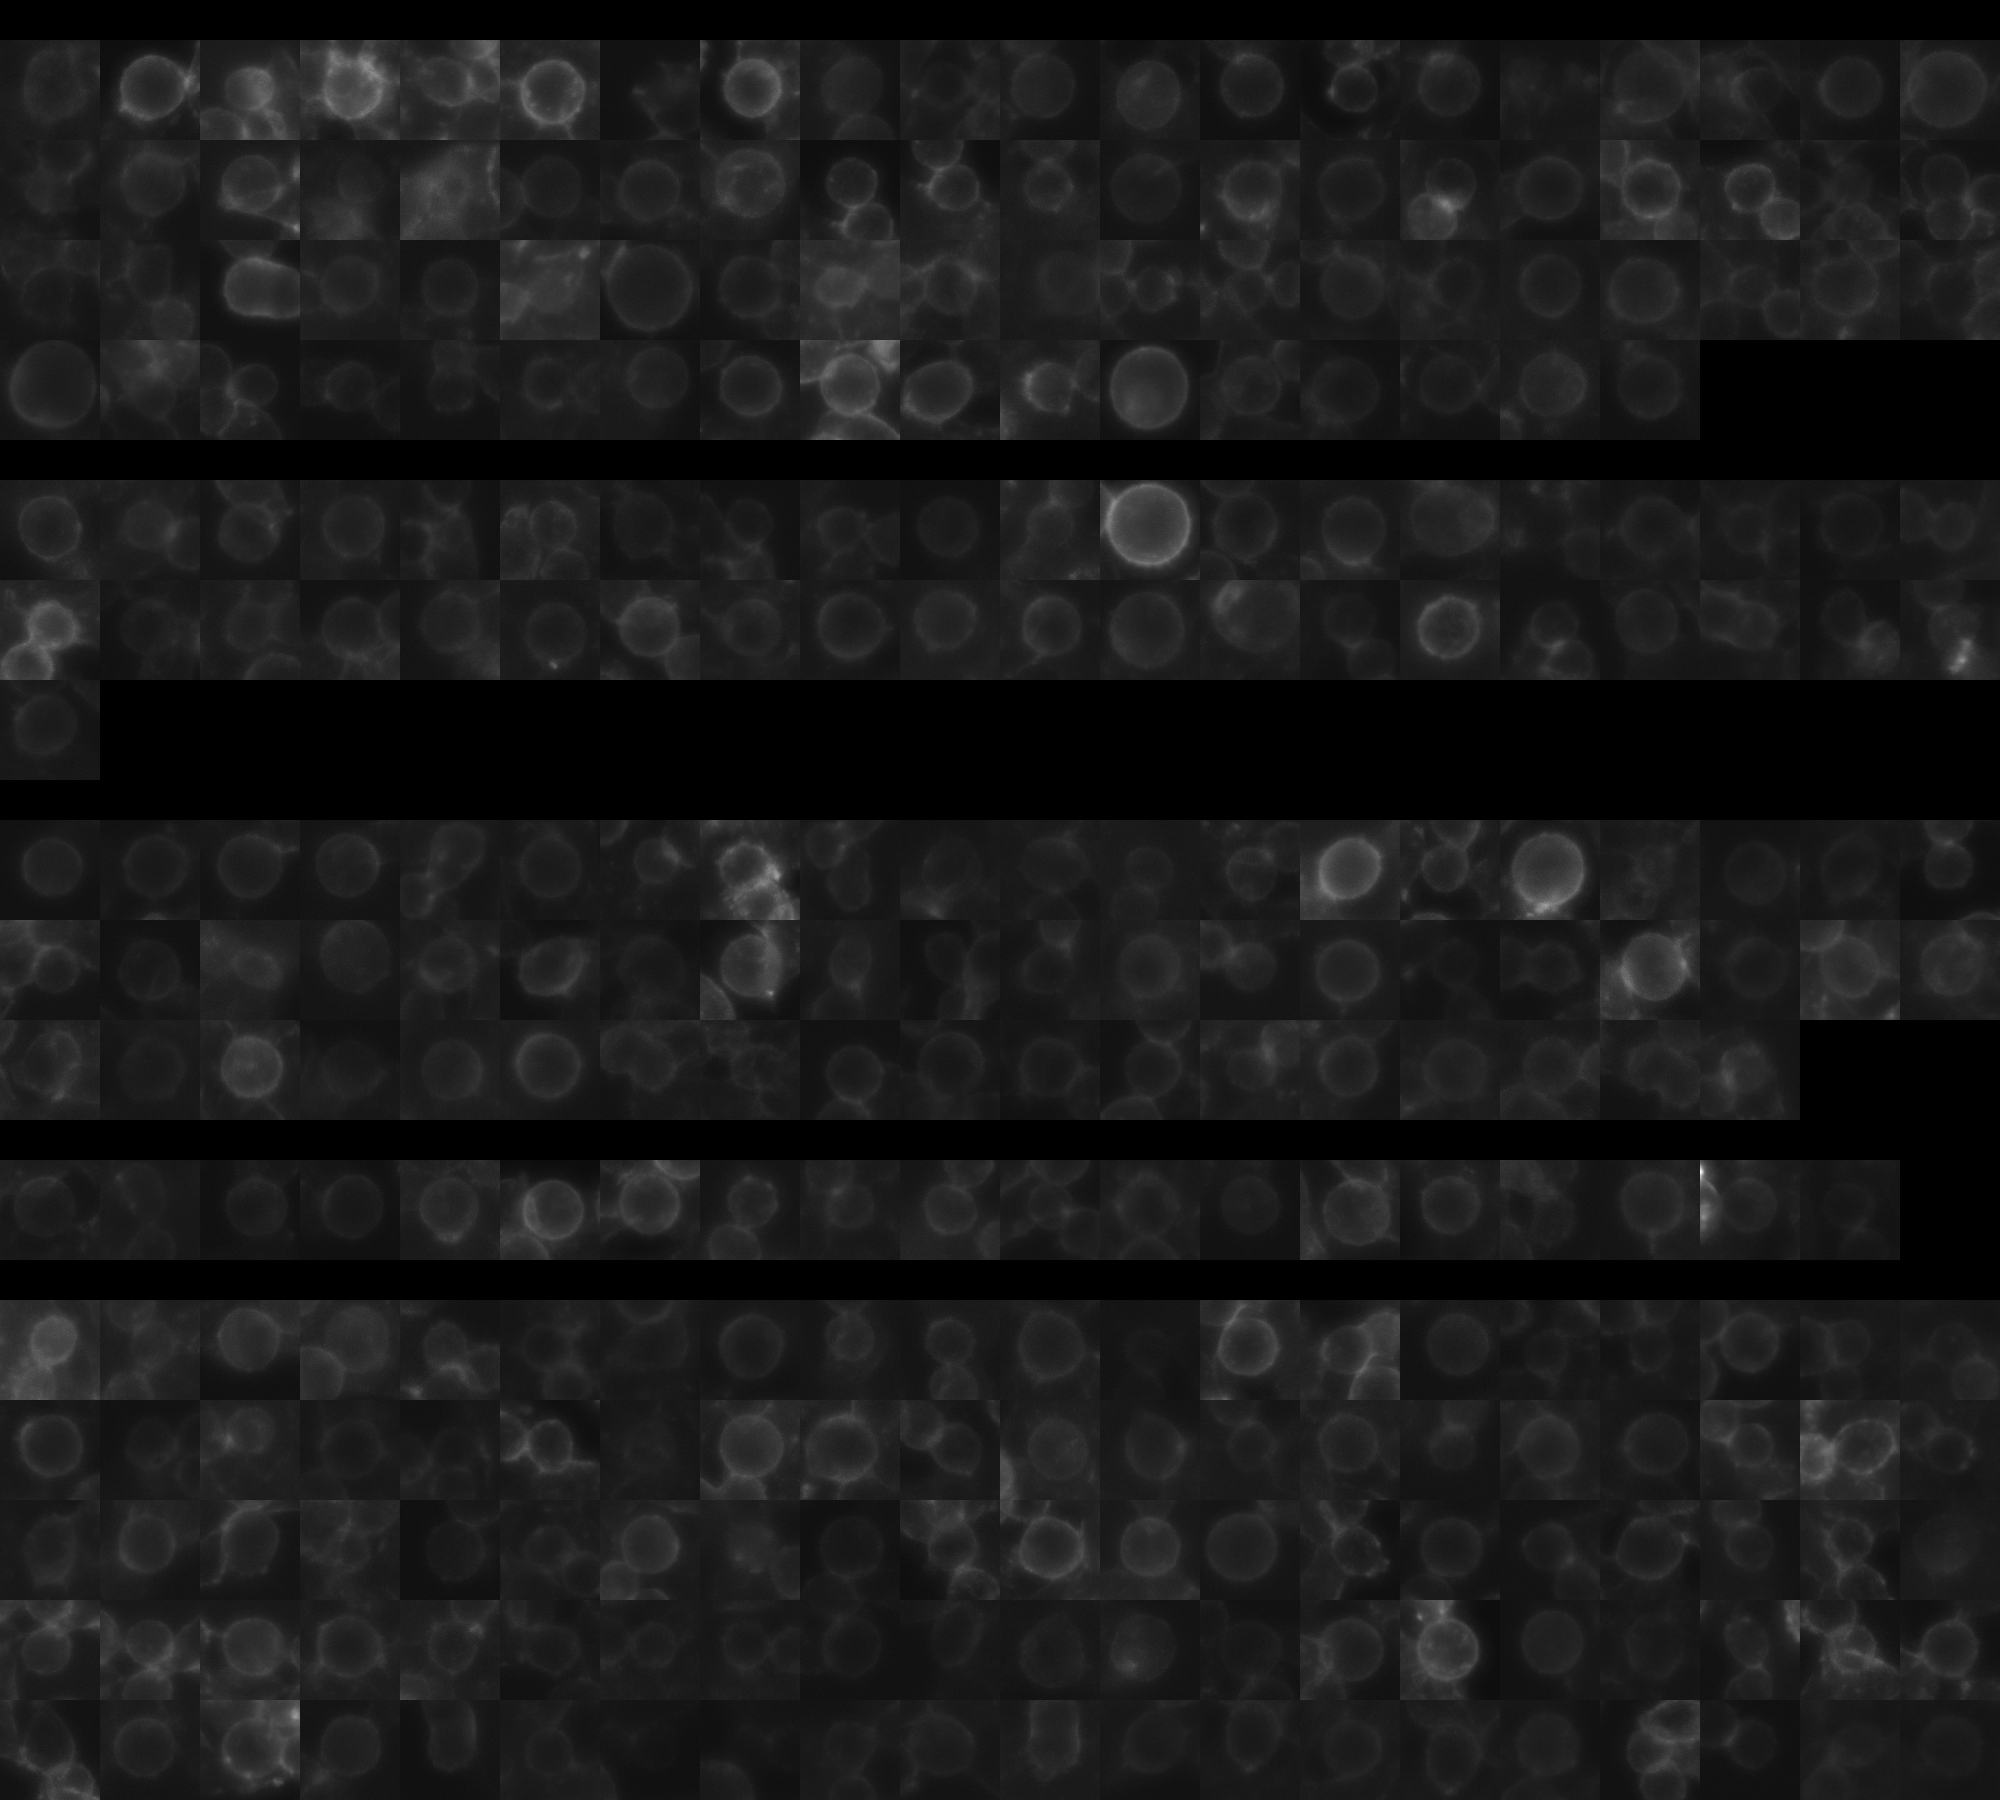
sgRNA 1: AAAAGTTACTACATTGCTCA (interphase cells: 3122, mitotic cells: 77)
sgRNA 2: AAGTTCTAACCAATAAGAGA (interphase cells: 1871, mitotic cells: 41)
sgRNA 3: ACCTAAGGAATGCACTTCAT (interphase cells: 2221, mitotic cells: 58)
sgRNA 4: GCTAATATCATGGCGACAAG (interphase cells: 1111, mitotic cells: 19)

Interphase Cluster

Mitotic Cluster

Overview

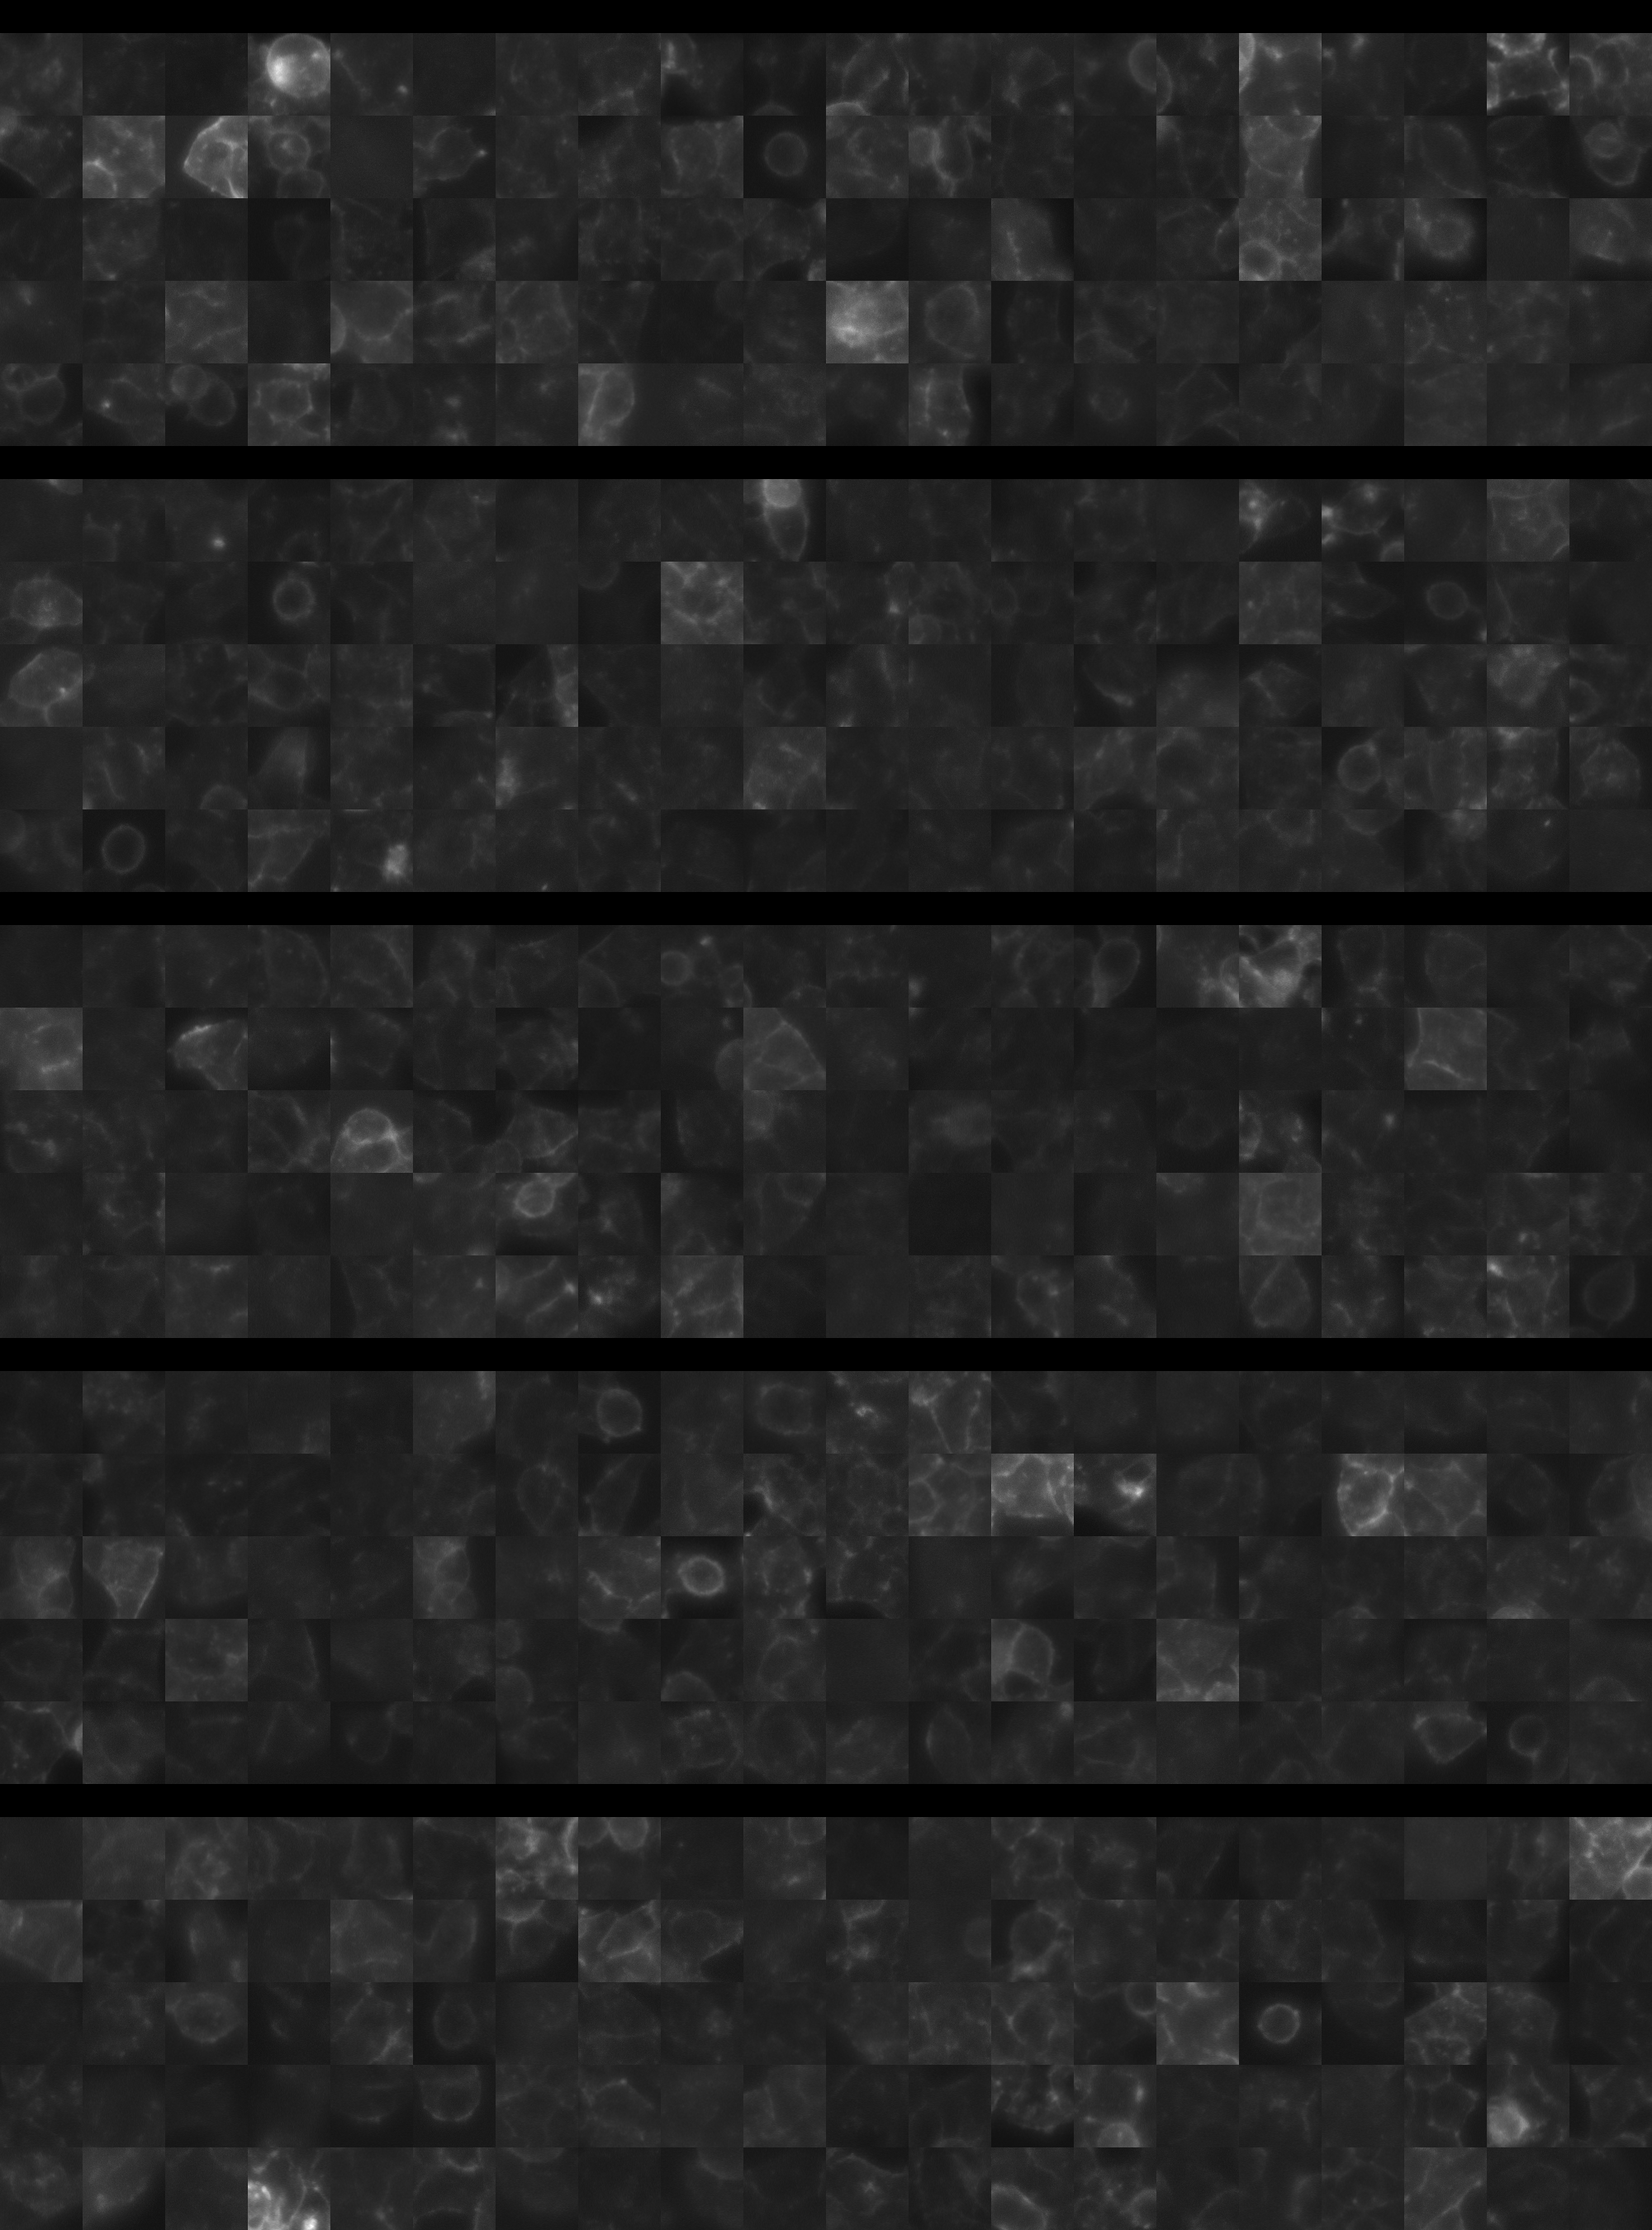
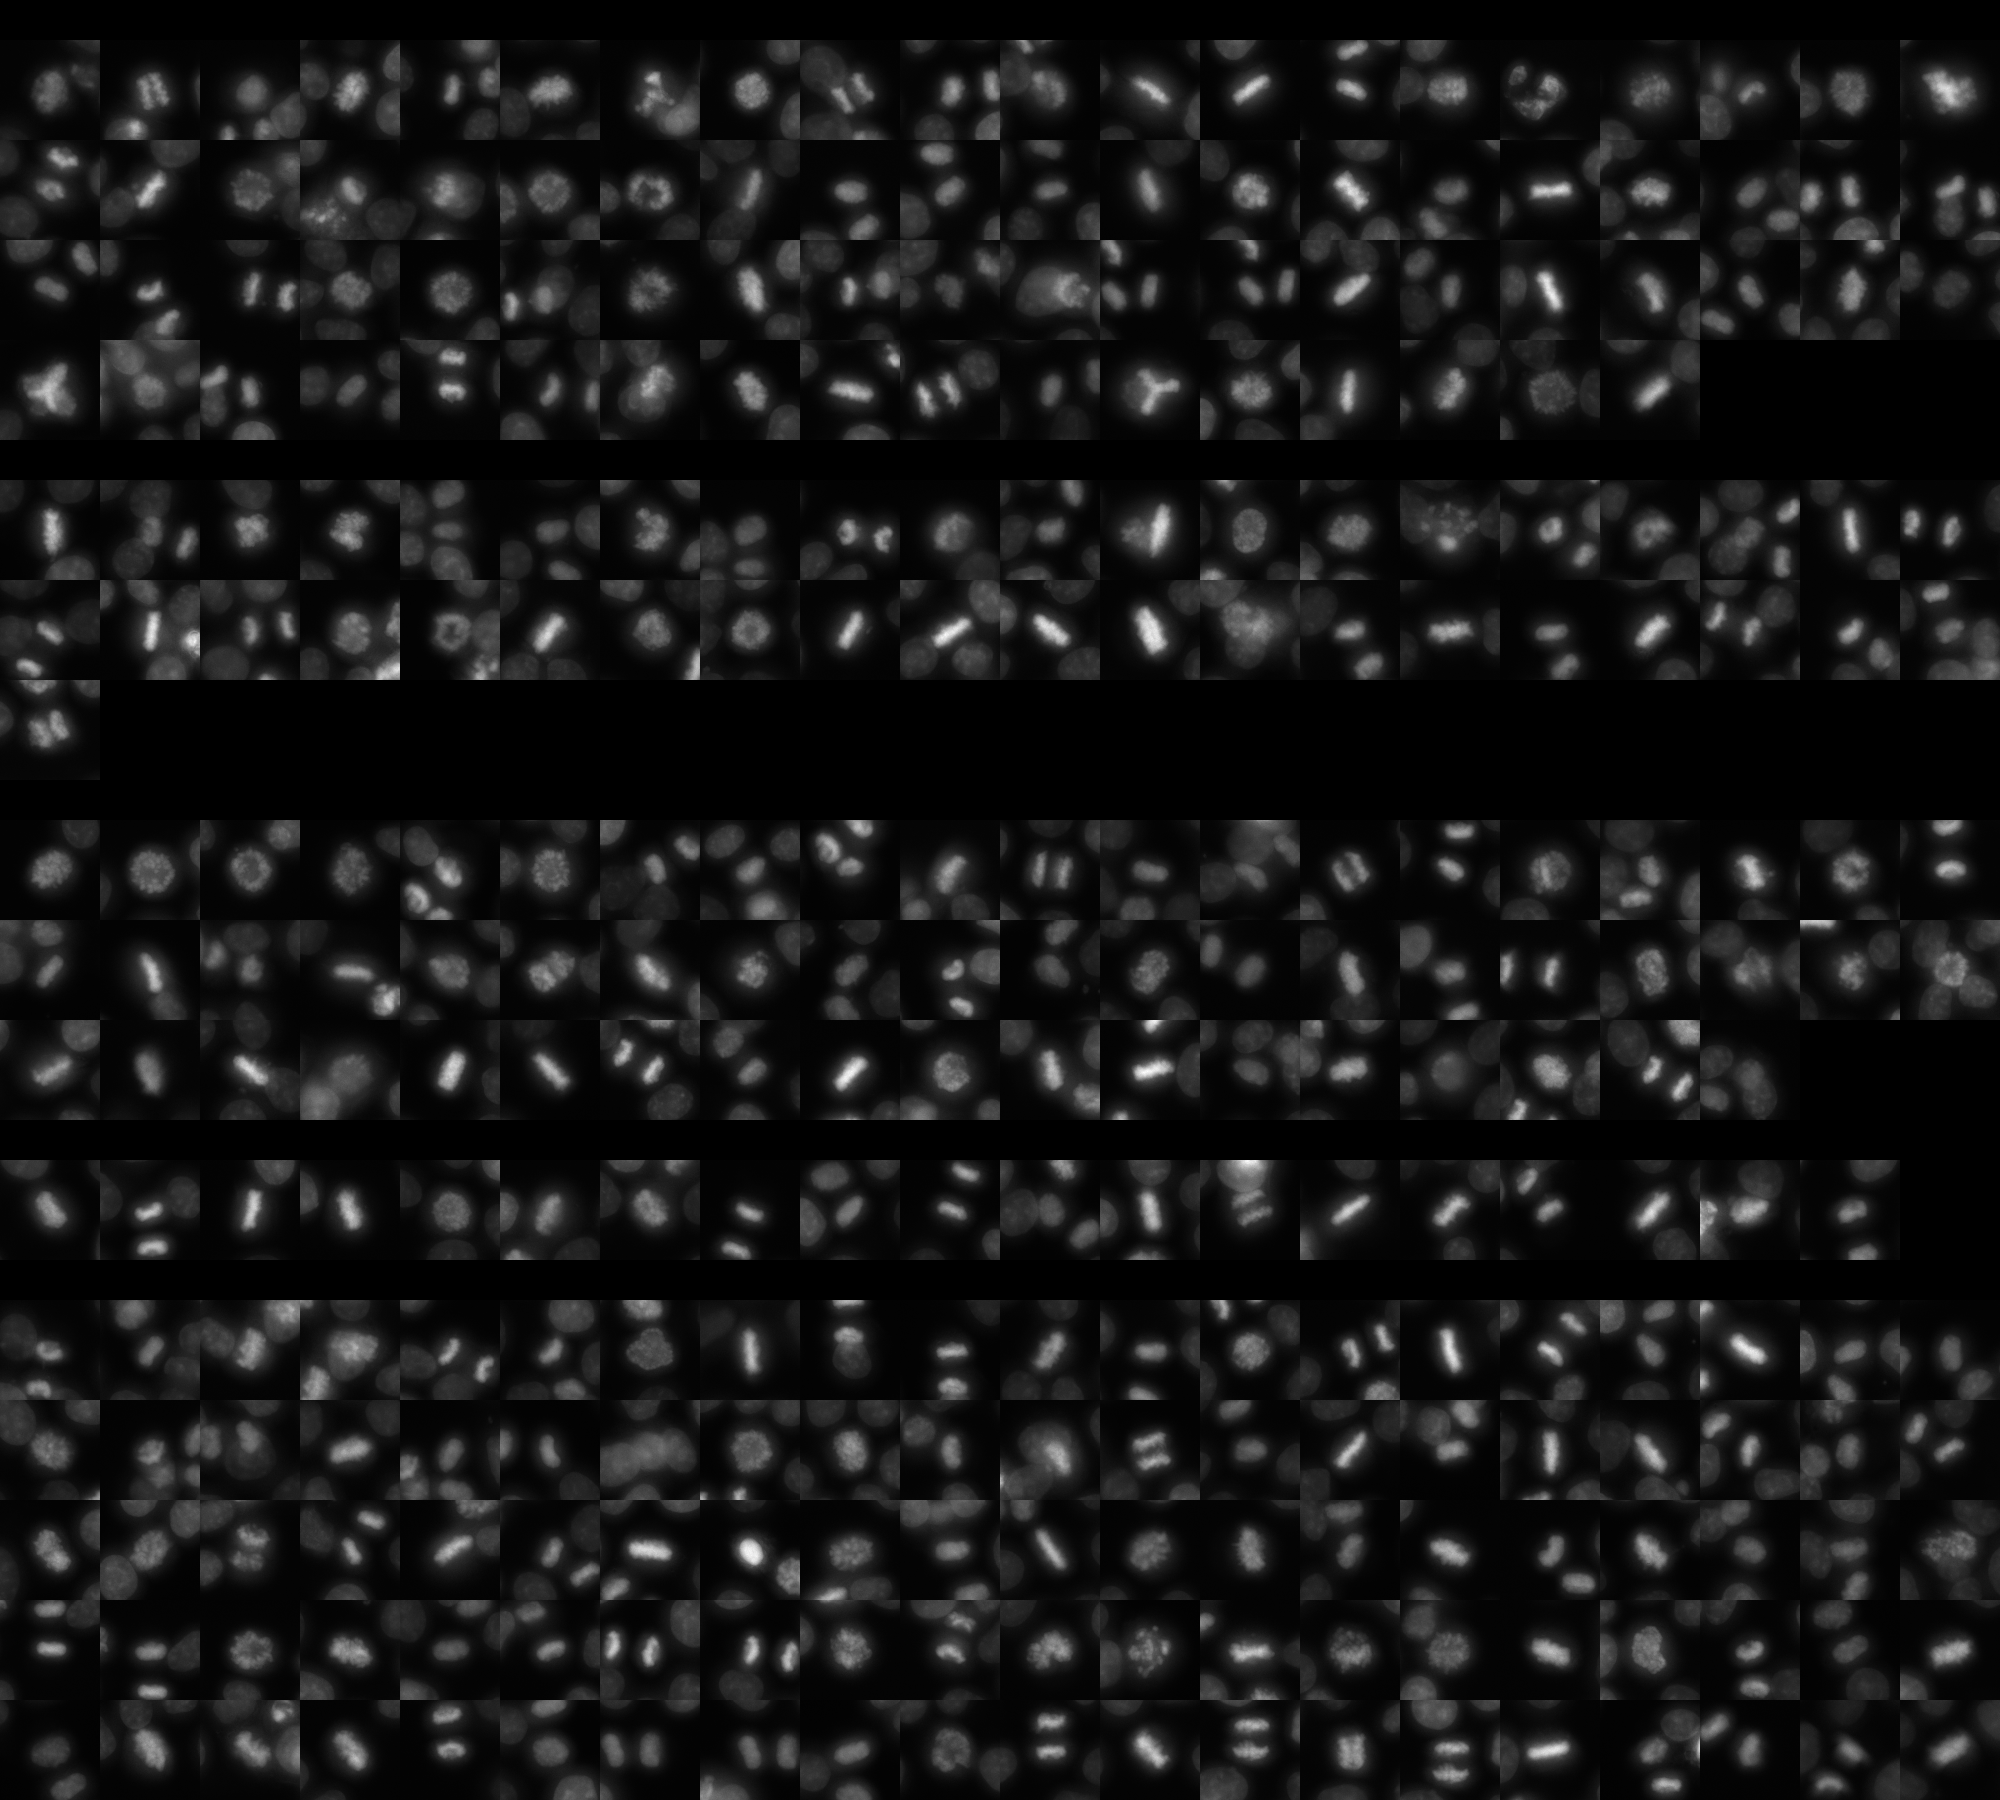
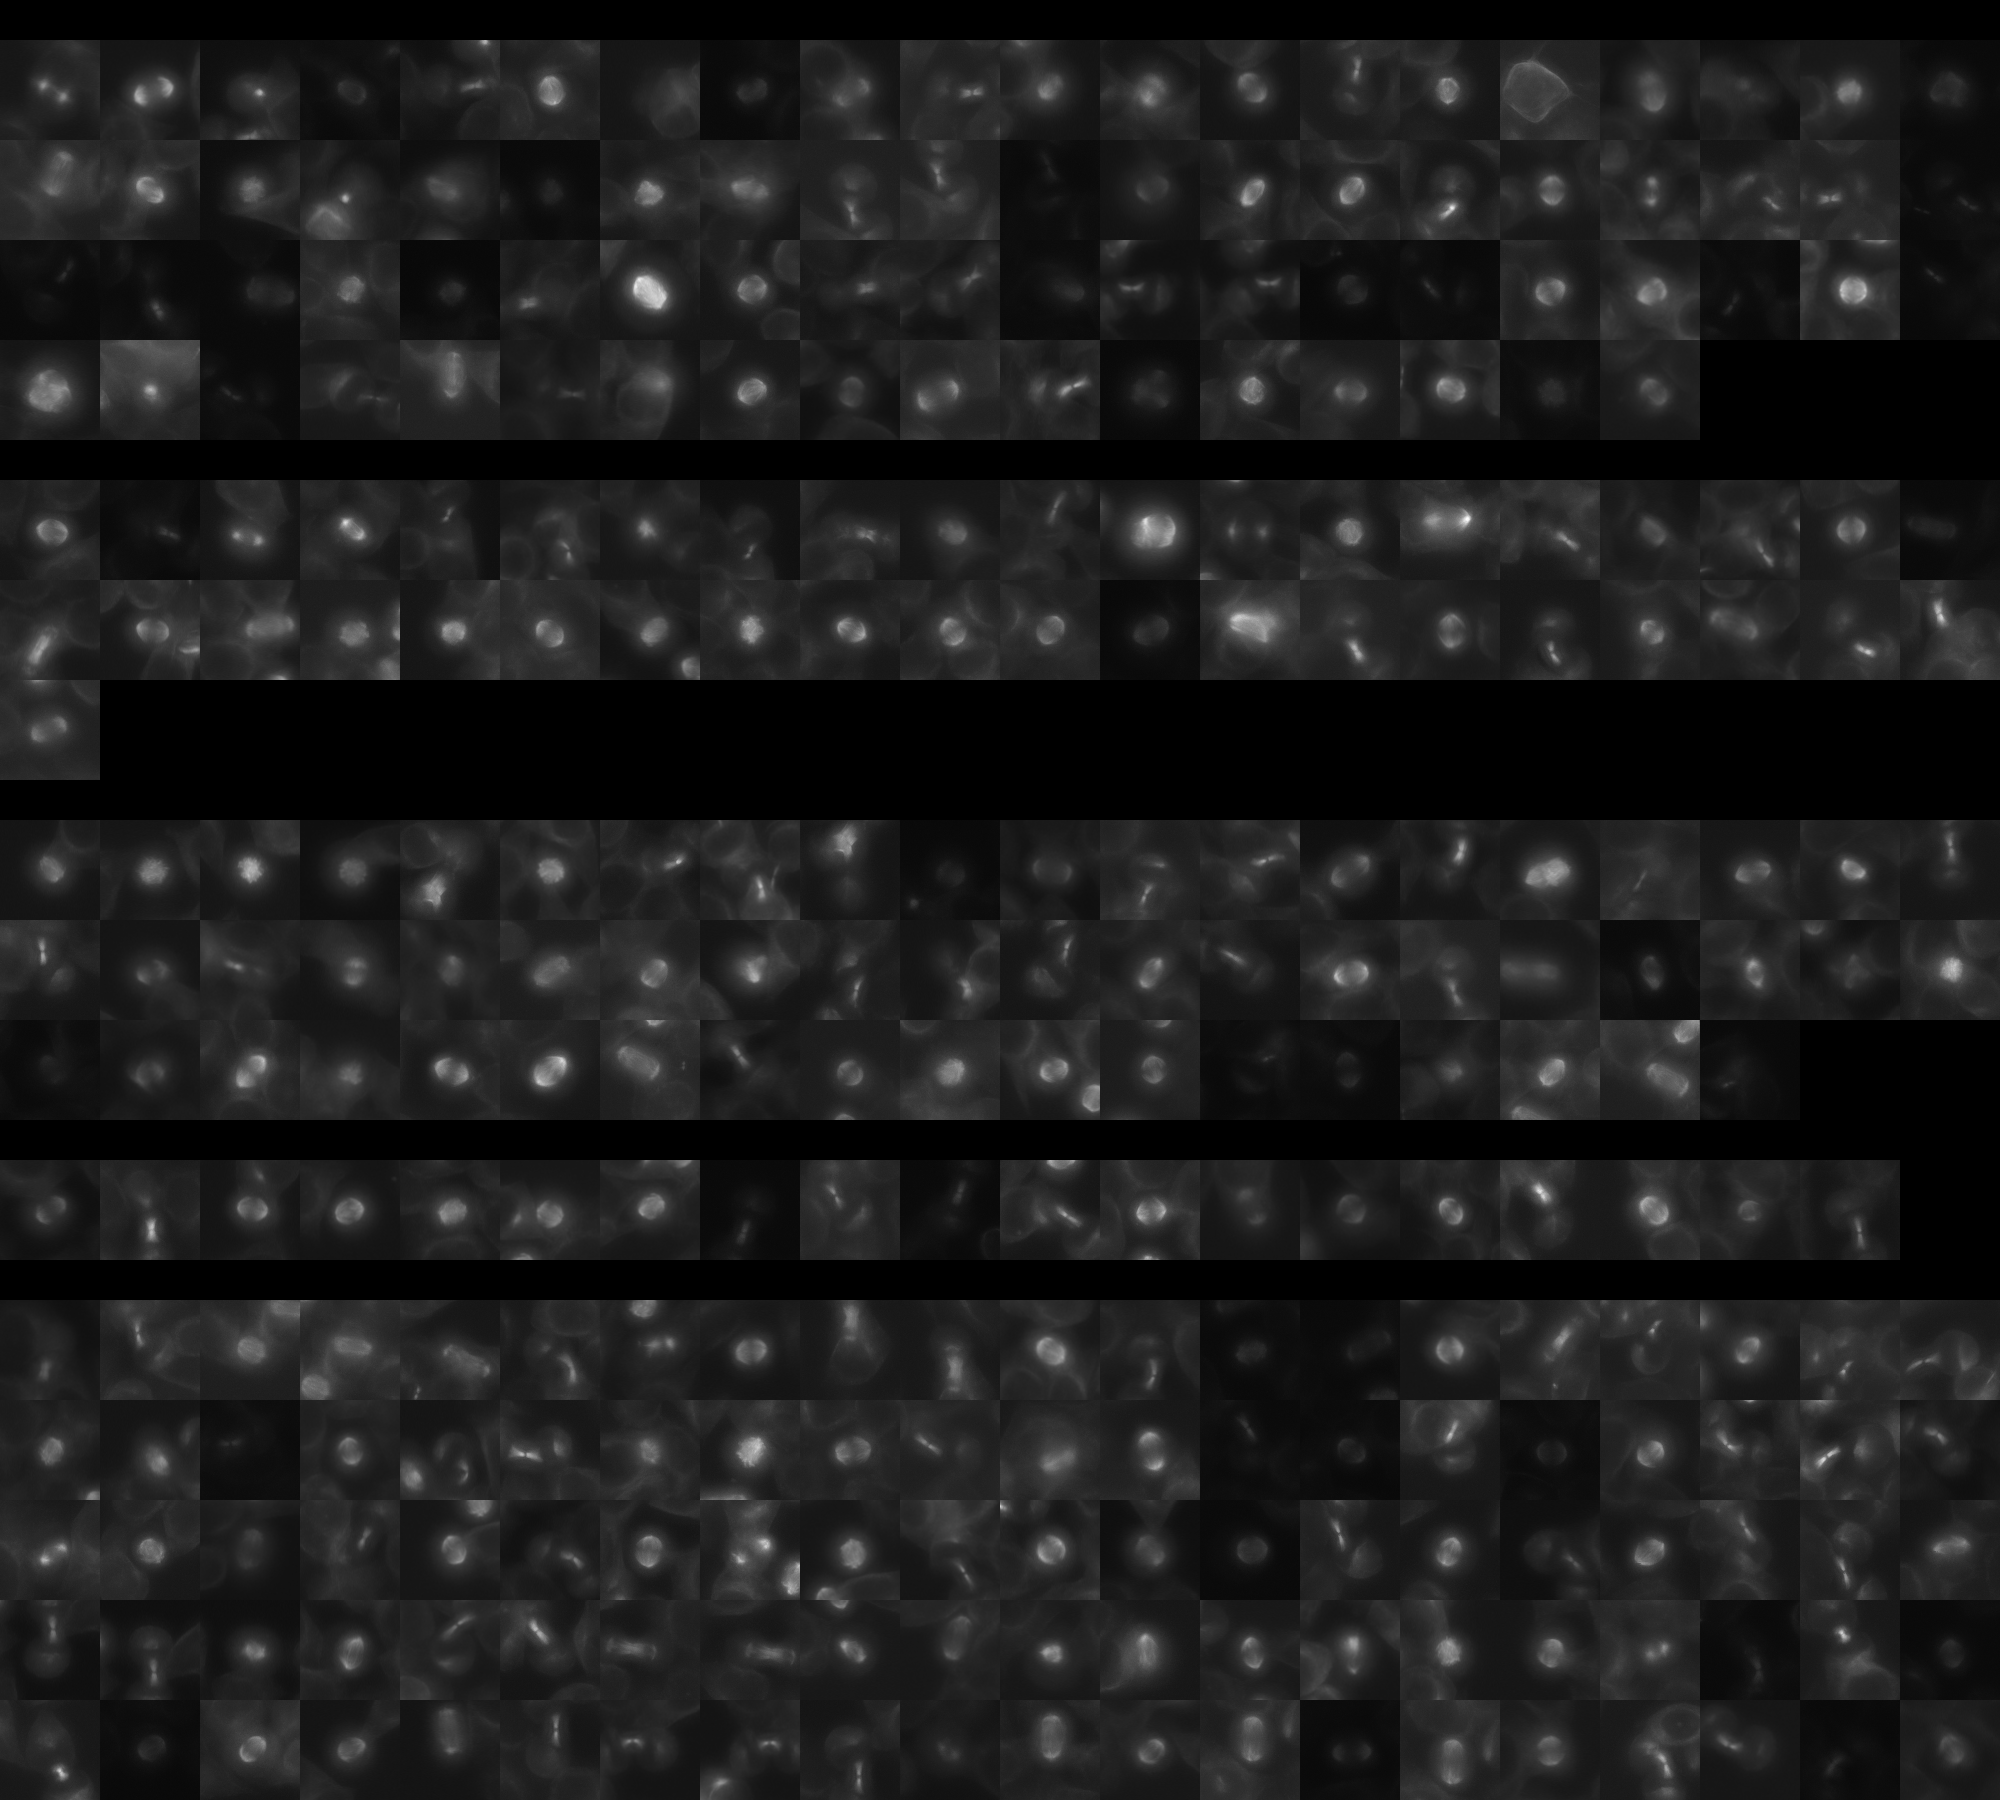
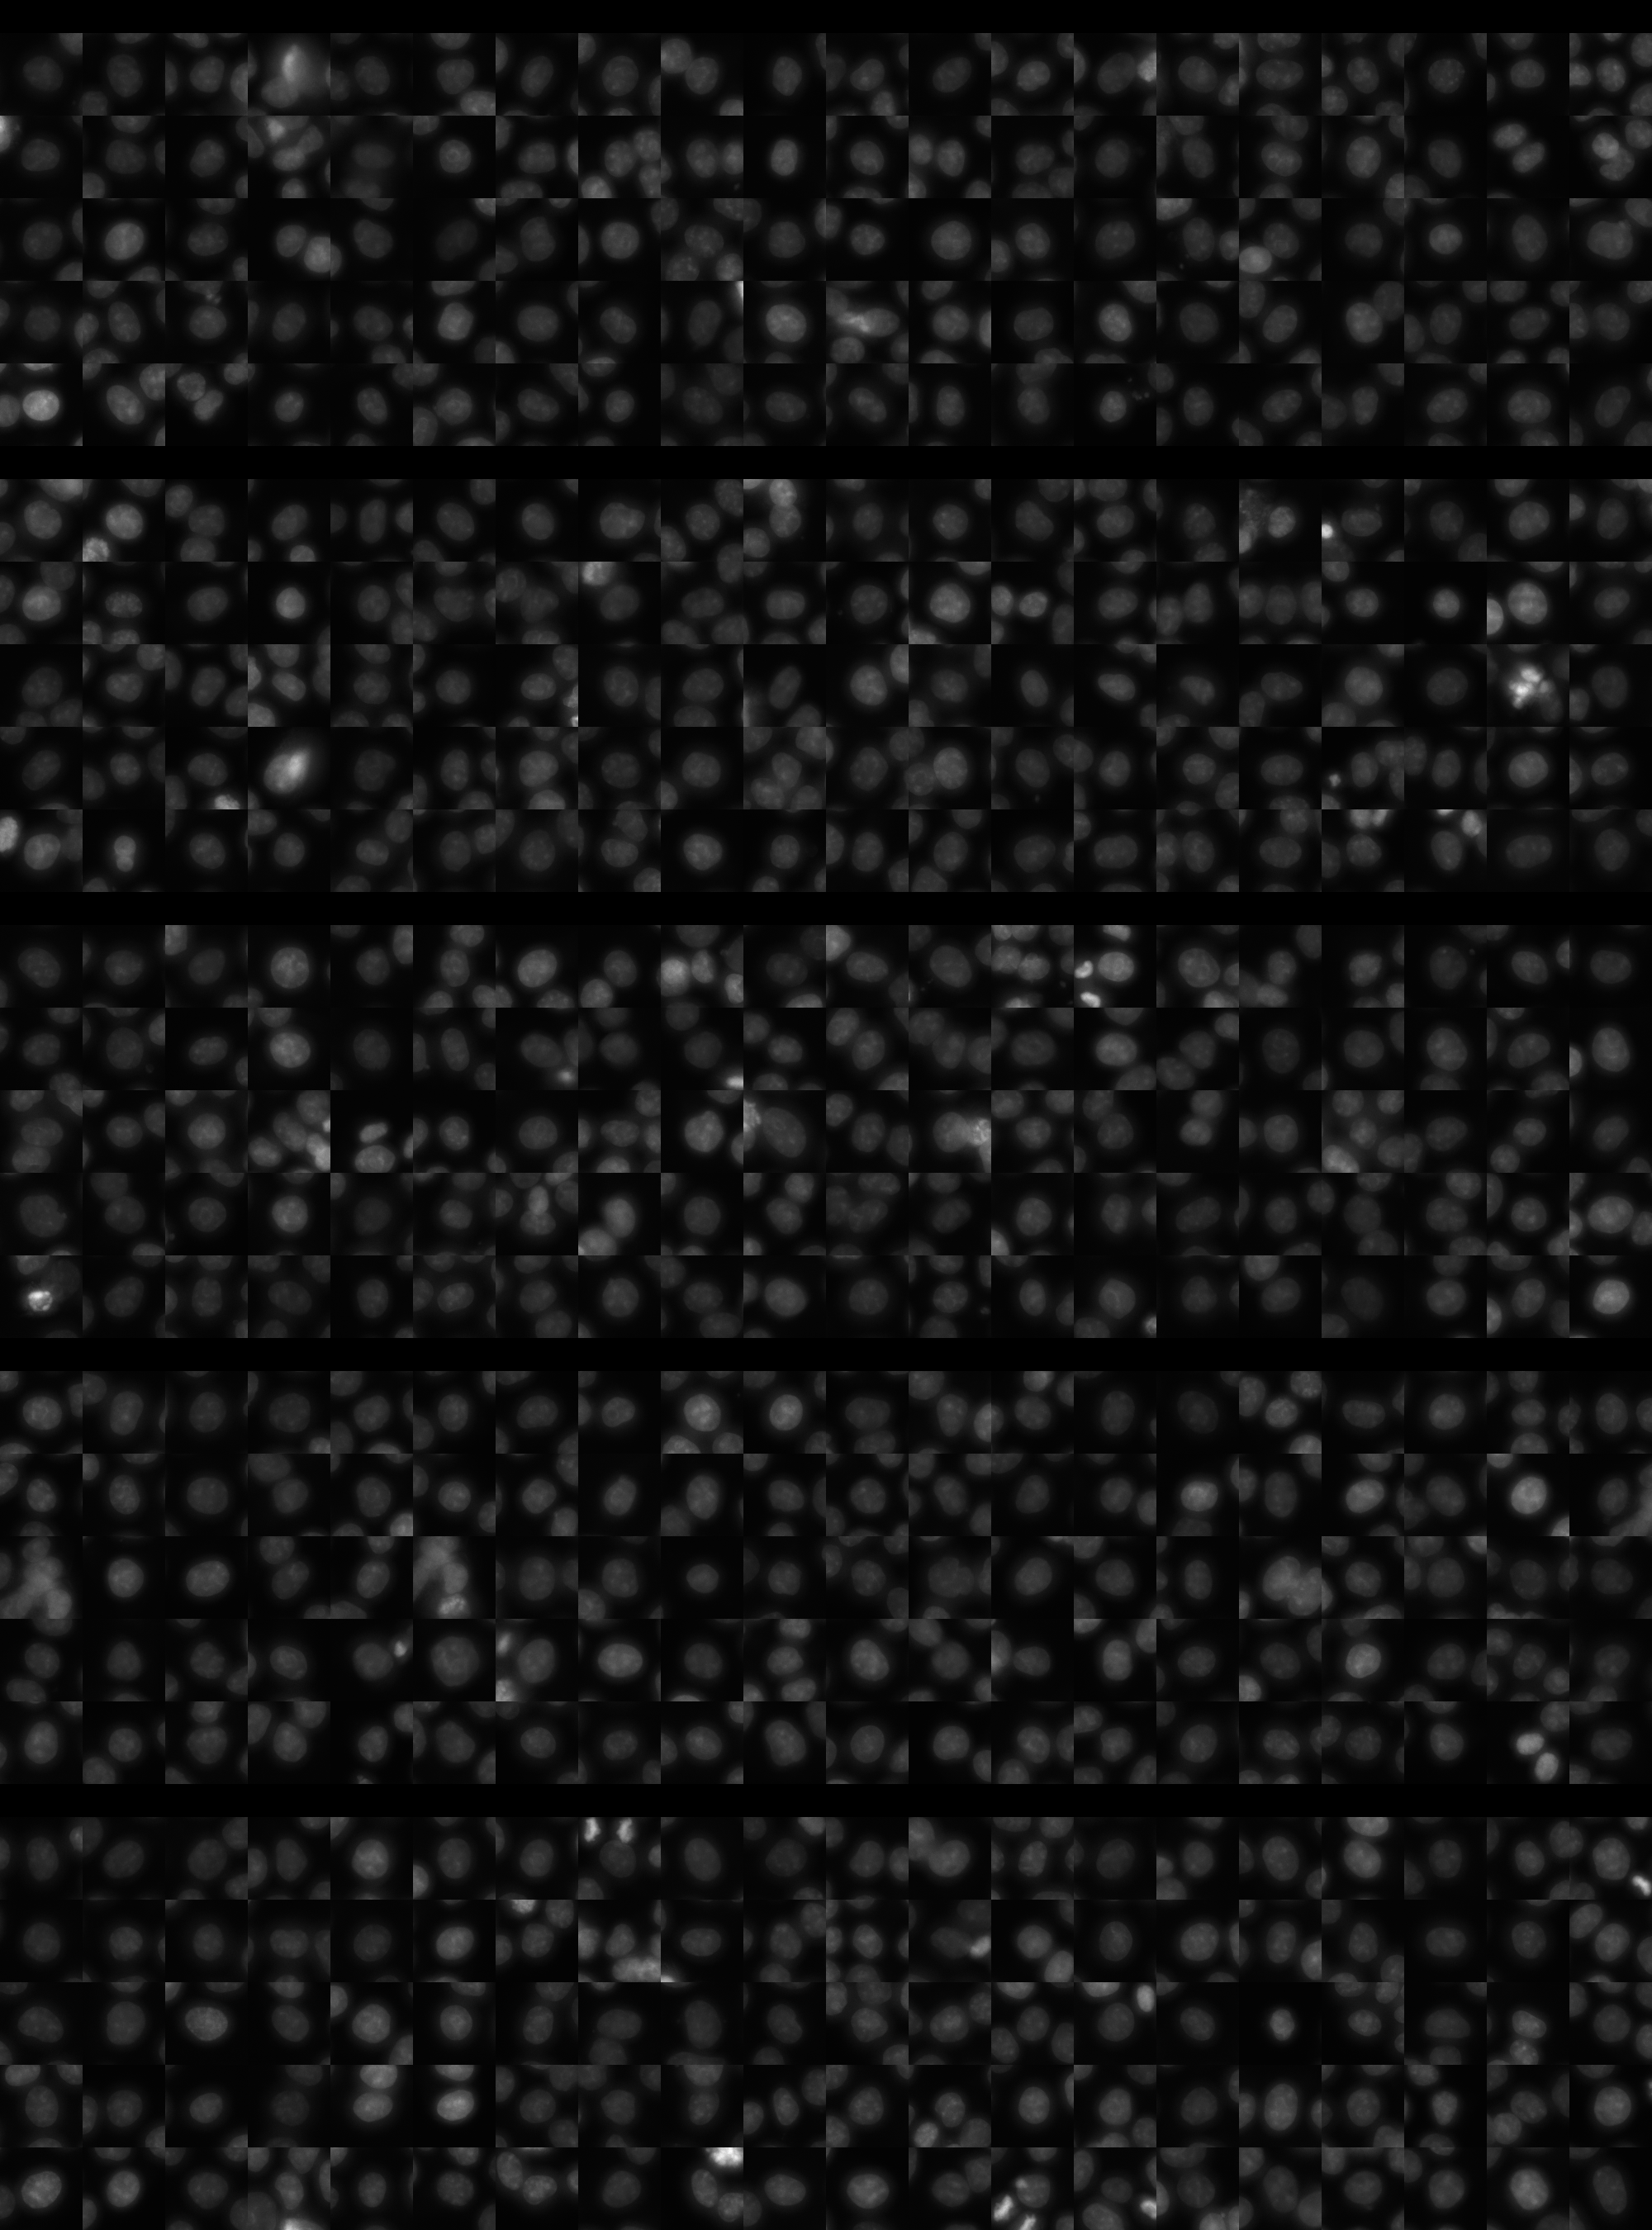
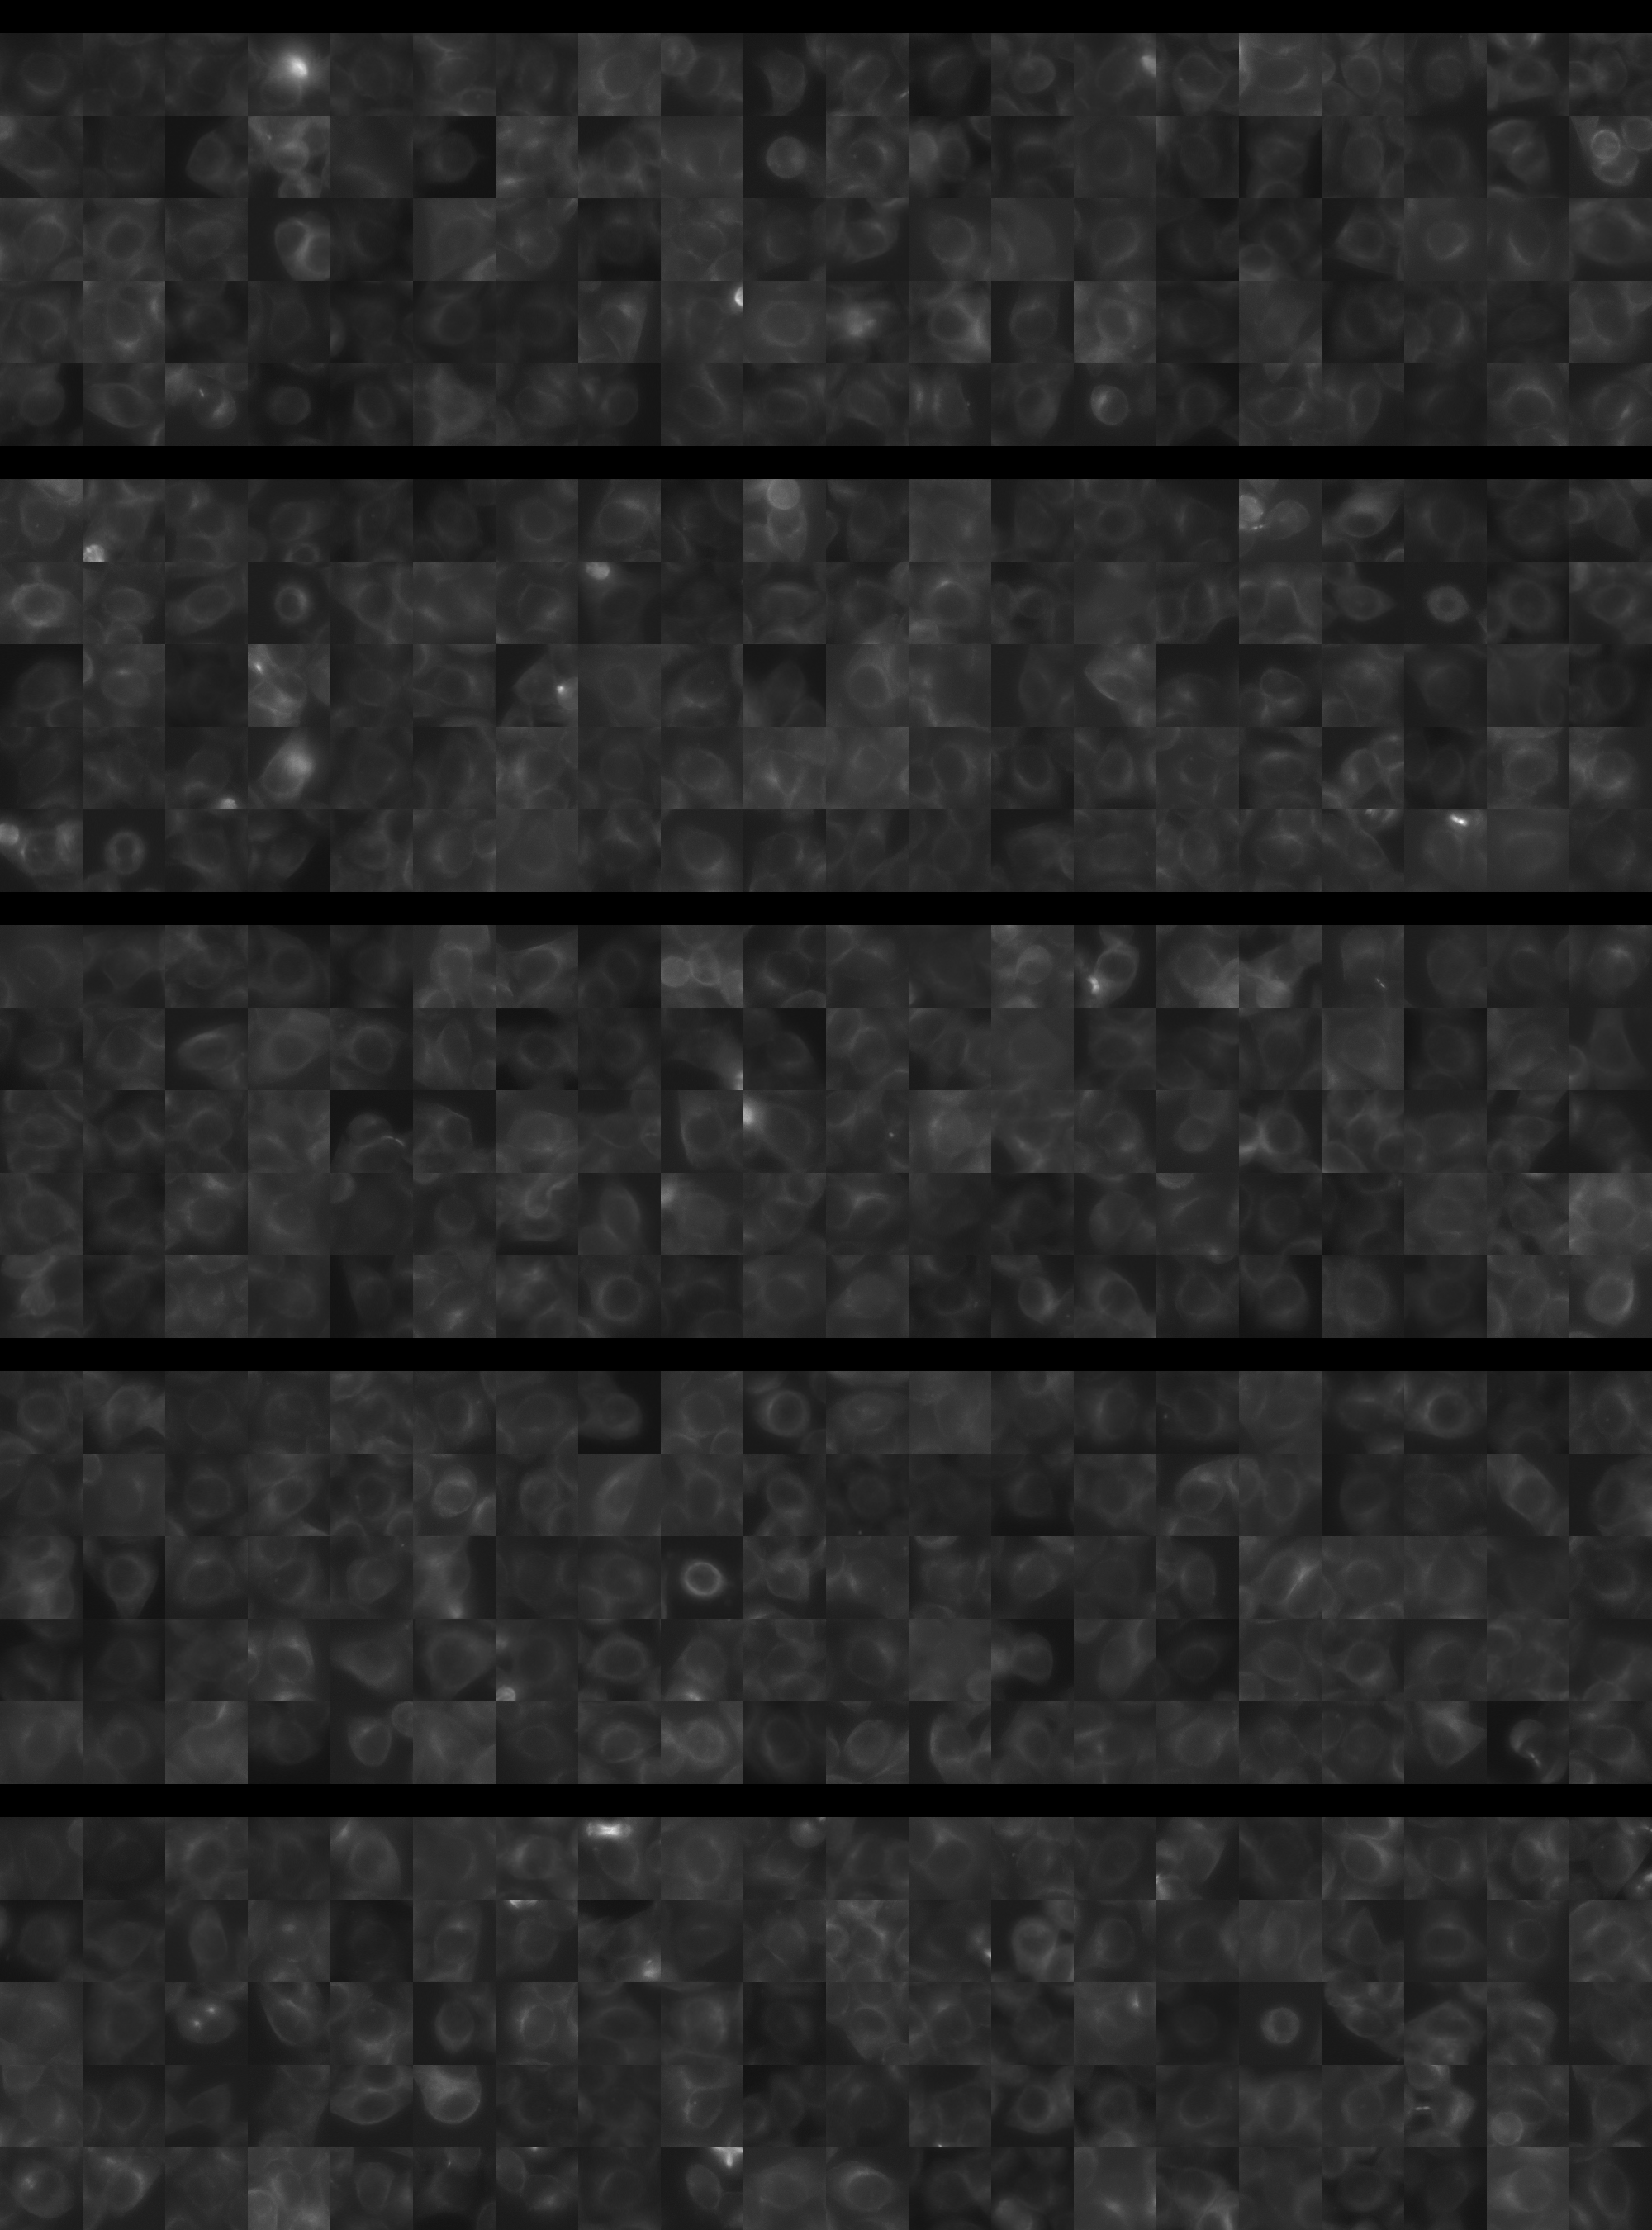
Each montage below shows randomly selected individual cell images for the same target gene separated by sgRNA, along with an example montage of cells expressing a non-targeting negative control sgRNA at the bottom. sgRNA labels in the montages correspond to the numbered sgRNA sequences in the gene info table above. The DNA (blue) and tubulin (green) channels are displayed by default, with gH2AX (grayscale) and actin (yellow) available using the check boxes. Channel brightness, contrast, and opacity are adjustable by clicking the arrow next to the channel name. When only one channel is selected, the display defaults to grayscale. Click the “Zoom” checkbox above the channel controls to enable image zooming (via scrolling) and panning (via click-and-drag).

The cell boxes displayed for this gene are square, 30.36 μm per side for the interphase montage and 30.36 μm per side for the mitotic montage.
Features

Interphase Score Rank FDR q-value
Nucleus DNA Integrated -2.728e-02 4305 of 5322 0.620
Nucleus DNA Mean -2.458e-02 2798 of 5322 0.626
Nucleus gH2AX Mean 0.020 4254 of 5322 0.588
Nucleus DNA - gH2AX Correlation -4.487e-02 2226 of 5322 0.095
Nucleus Shape Area -3.164e-02 4161 of 5322 0.435
Nucleus Shape Eccentricity -7.905e-03 3723 of 5322 0.920
Nucleus Shape Form Factor -1.556e-02 1082 of 5322 0.744
Nucleus Shape Solidity -2.141e-02 1371 of 5322 0.535
Cell DNA Mass Displacement 0.029 2384 of 5322 0.626
Cell Tubulin Mean -3.595e-03 2930 of 5322 0.991
Cell Tubulin Mass Displacement 0.011 2303 of 5322 0.870
Cell Actin Mean 0.010 2678 of 5322 0.861
Cell Tubulin - Actin Correlation 0.020 2643 of 5322 0.656
Cell DNA - Tubulin Correlation 0.039 2281 of 5322 0.283
Cell Shape Area -4.316e-02 4266 of 5322 0.295
Cell Shape Eccentricity 0.013 2637 of 5322 0.880
Mitotic Score Rank FDR q-value
Nucleus DNA Integrated 0.063 3038 of 5322 0.979
Nucleus DNA Mean -8.418e-02 4110 of 5322 1.000
Nucleus DNA Mass Displacement 0.019 3218 of 5322 0.999
Nucleus DNA Mean Frac 3 0.226 456 of 5322 1.000
Nucleus gH2AX Mean 0.169 964 of 5322 1.000
Nucleus gH2AX Mean Frac 0 -1.415e-01 4310 of 5322 1.000
Nucleus Tubulin Mean Frac 0 0.059 2595 of 5322 0.999
Nucleus Tubulin Mean Edge -7.645e-02 4126 of 5322 0.999
Nucleus Tubulin Std Edge -1.054e-01 3949 of 5322 0.999
Nucleus Shape Area 0.155 1949 of 5322 0.951
Nucleus Shape Eccentricity -1.535e-01 4163 of 5322 1.000
Nucleus Shape Form Factor -1.005e-01 2853 of 5322 0.998
Cell Tubulin Mean 0.167 1264 of 5322 0.997
Cell Tubulin Mean Frac 3 0.010 1577 of 5322 0.999
Cell Actin Mean 0.003 3151 of 5322 1.000
Cell Shape Area 0.019 3668 of 5322 1.000
( Reset Zoom )
Brightness
Contrast
Opacity
Brightness
Contrast
Opacity
Brightness
Contrast
Opacity
Brightness
Contrast
Opacity
Brightness
Contrast
Opacity

( Reset Zoom )
Brightness
Contrast
Opacity
Brightness
Contrast
Opacity
Brightness
Contrast
Opacity
Brightness
Contrast
Opacity
Brightness
Contrast
Opacity

MIT Central Accessability