NGRN

Gene symbol: NGRN
Gene: 51335
Uniprot Function: Plays an essential role in mitochondrial ribosome biogenesis. As a component of a functional protein-RNA module, consisting of RCC1L, NGRN, RPUSD3, RPUSD4, TRUB2, FASTKD2 and 16S mitochondrial ribosomal RNA (16S mt-rRNA), controls 16S mt-rRNA abundance and is required for intra-mitochondrial translation of core subunits of the oxidative phosphorylation system.
Mitotic Index 0.0241
Interphase Cluster: #132 (21 genes)
Mitotic Cluster: #140 (20 genes)
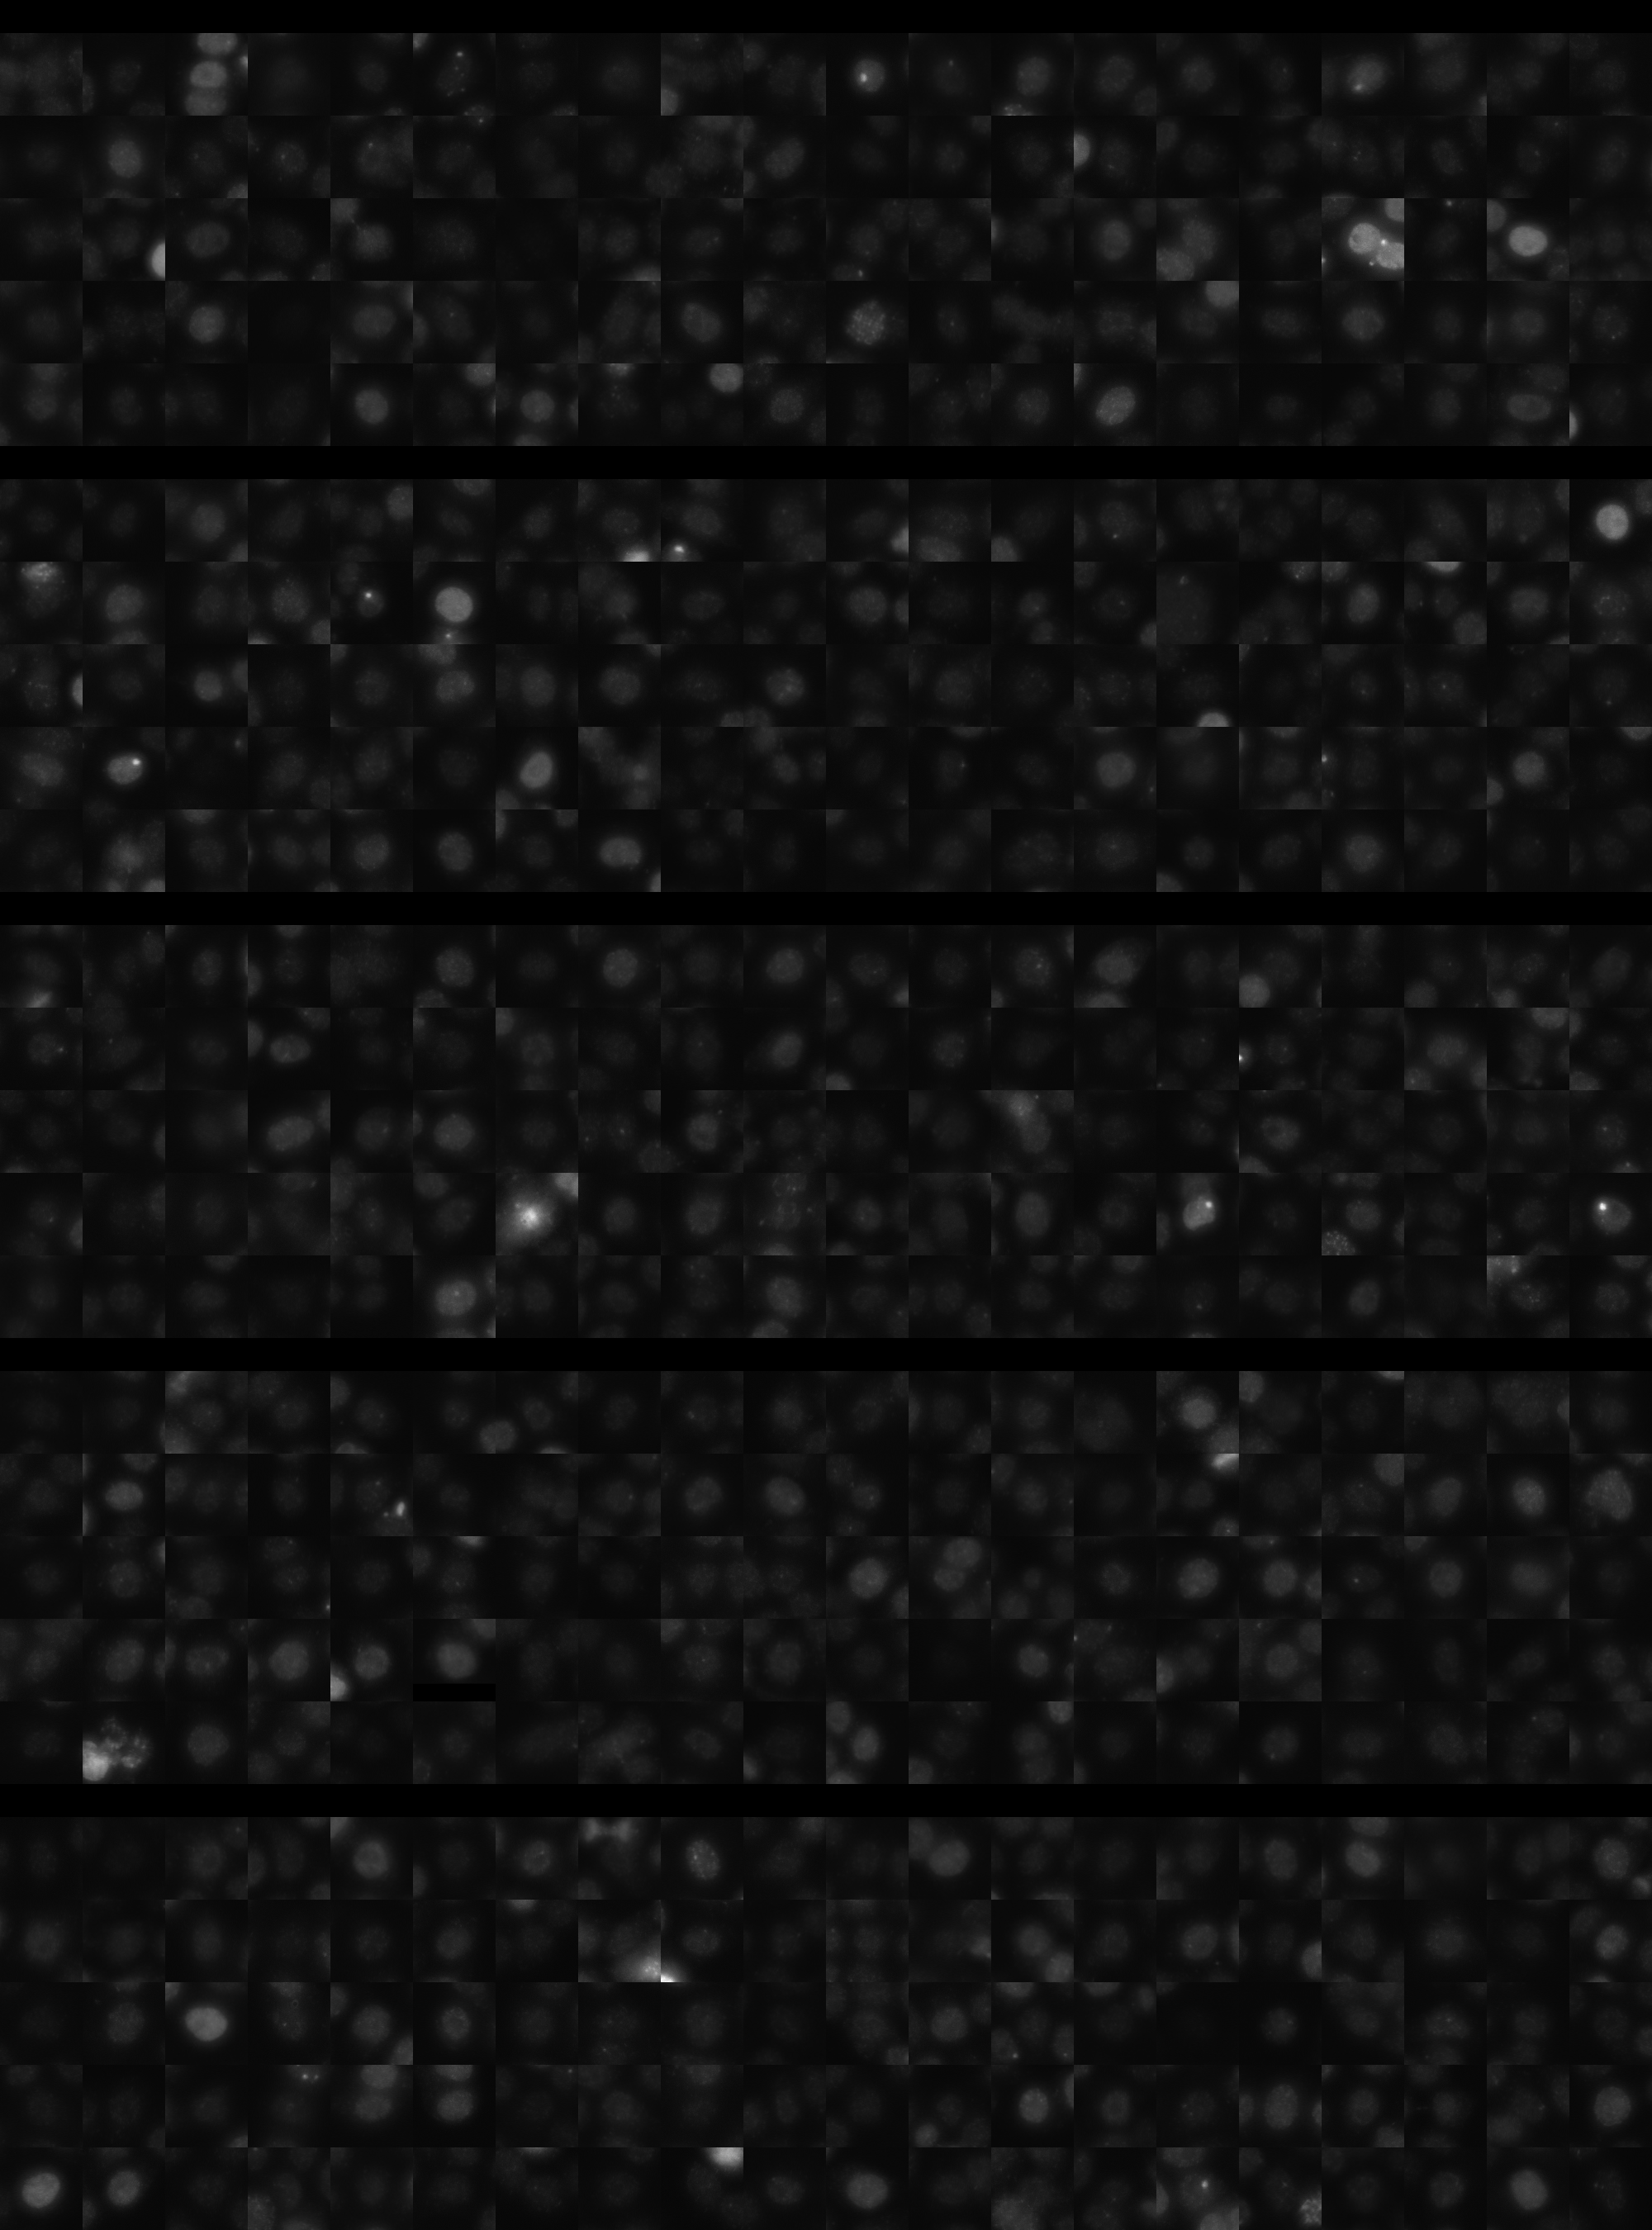
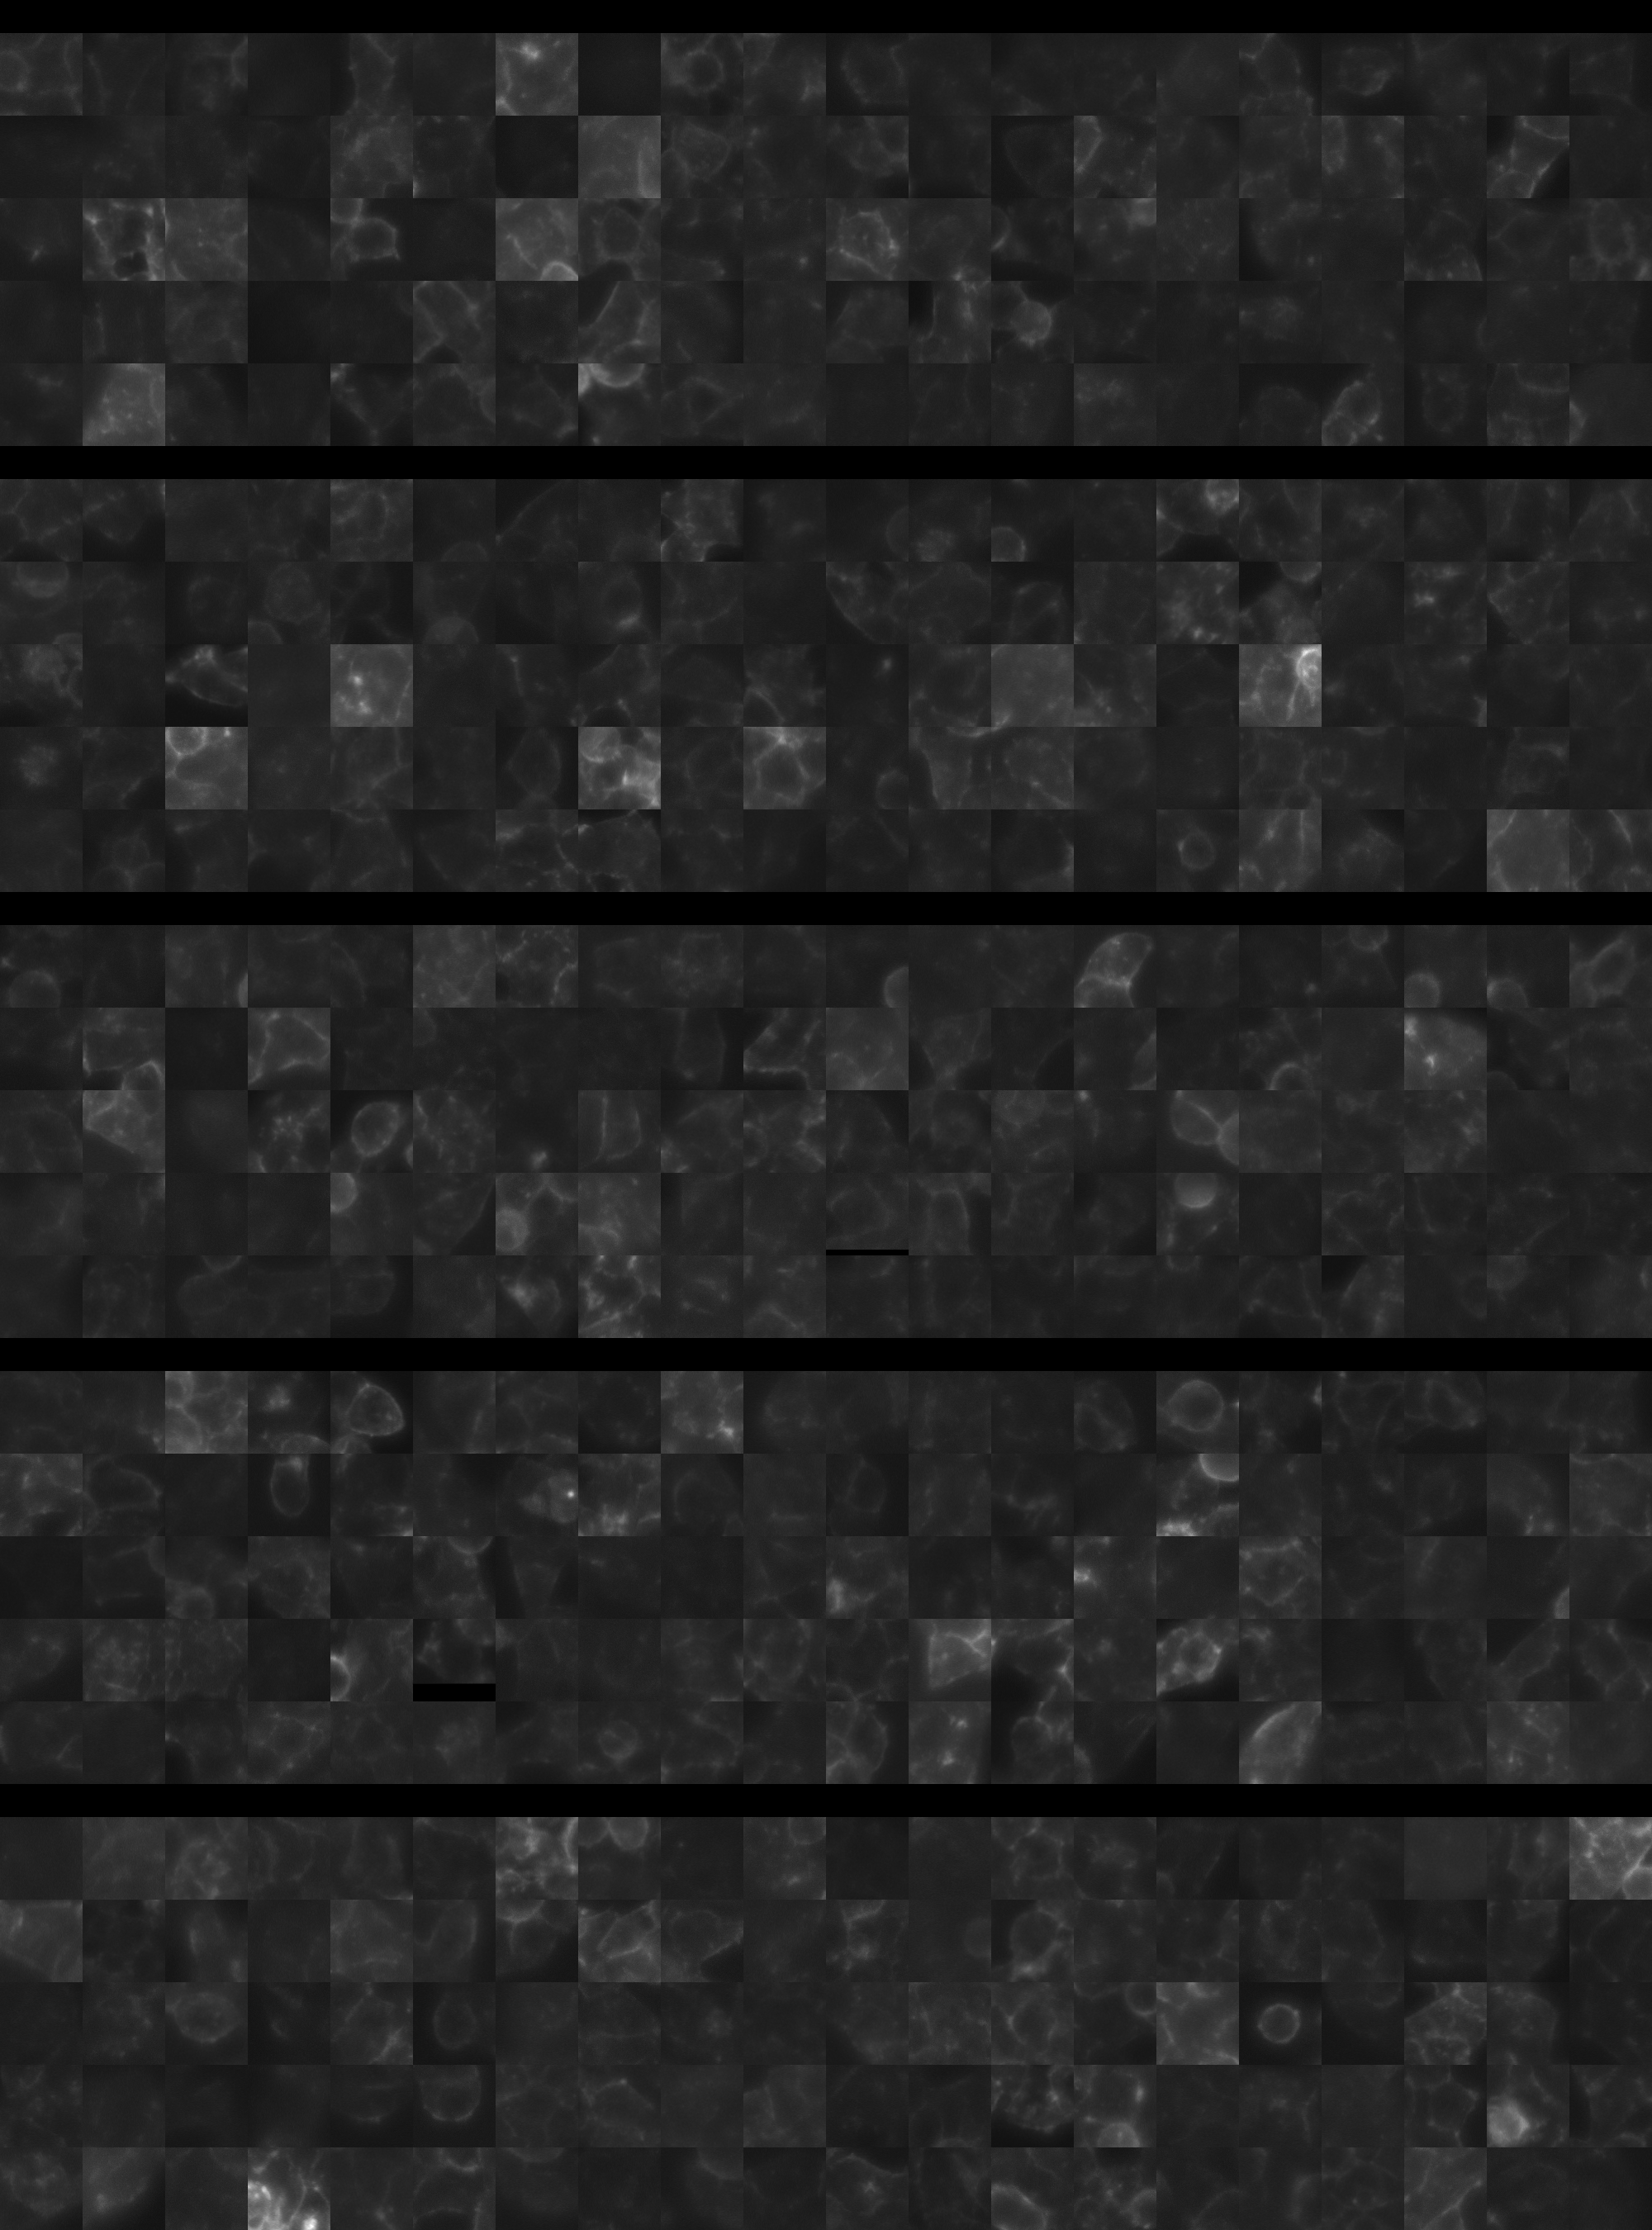
sgRNA 1: AGGTATTTCCAGAGCCCCGG (interphase cells: 1603, mitotic cells: 41)
sgRNA 2: CCGGCTCCCAGTCGGAATCG (interphase cells: 1583, mitotic cells: 39)
sgRNA 3: TCCGATTCCAGAAAATTCGG (interphase cells: 1611, mitotic cells: 27)
sgRNA 4: TTCCCGTAGGTATTTACATG (interphase cells: 2913, mitotic cells: 83)

Interphase Cluster

Mitotic Cluster

Overview

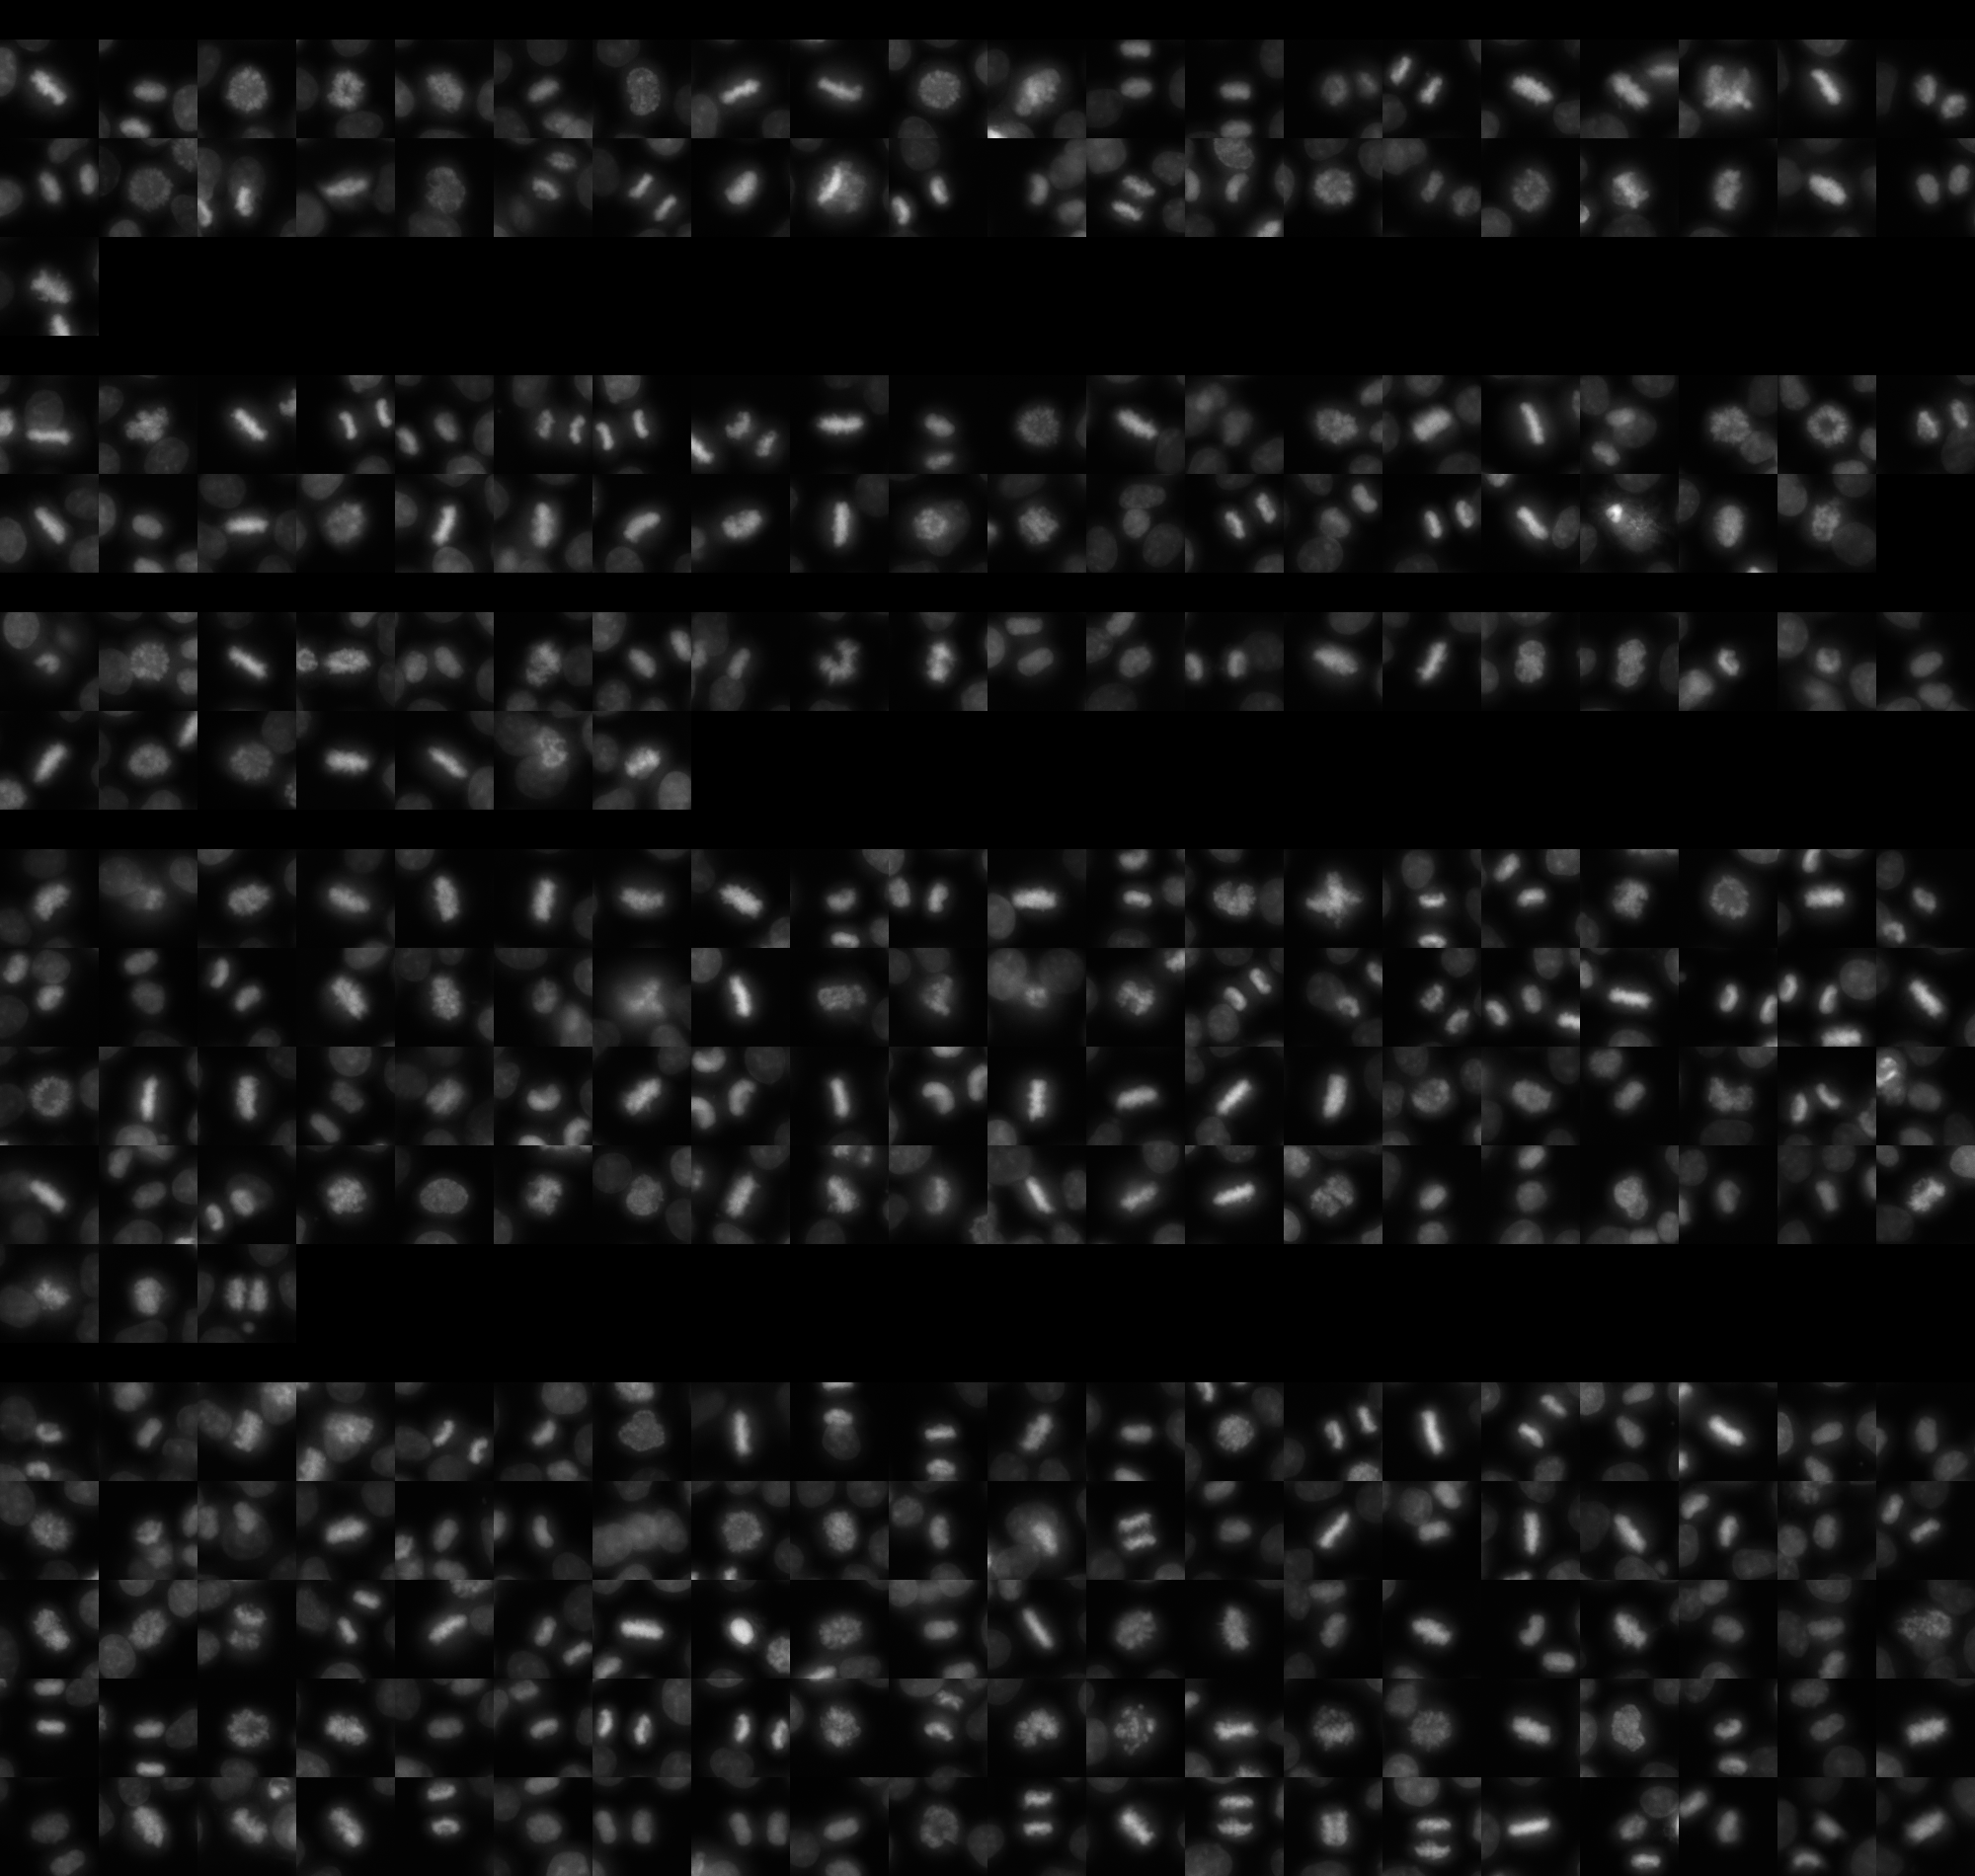
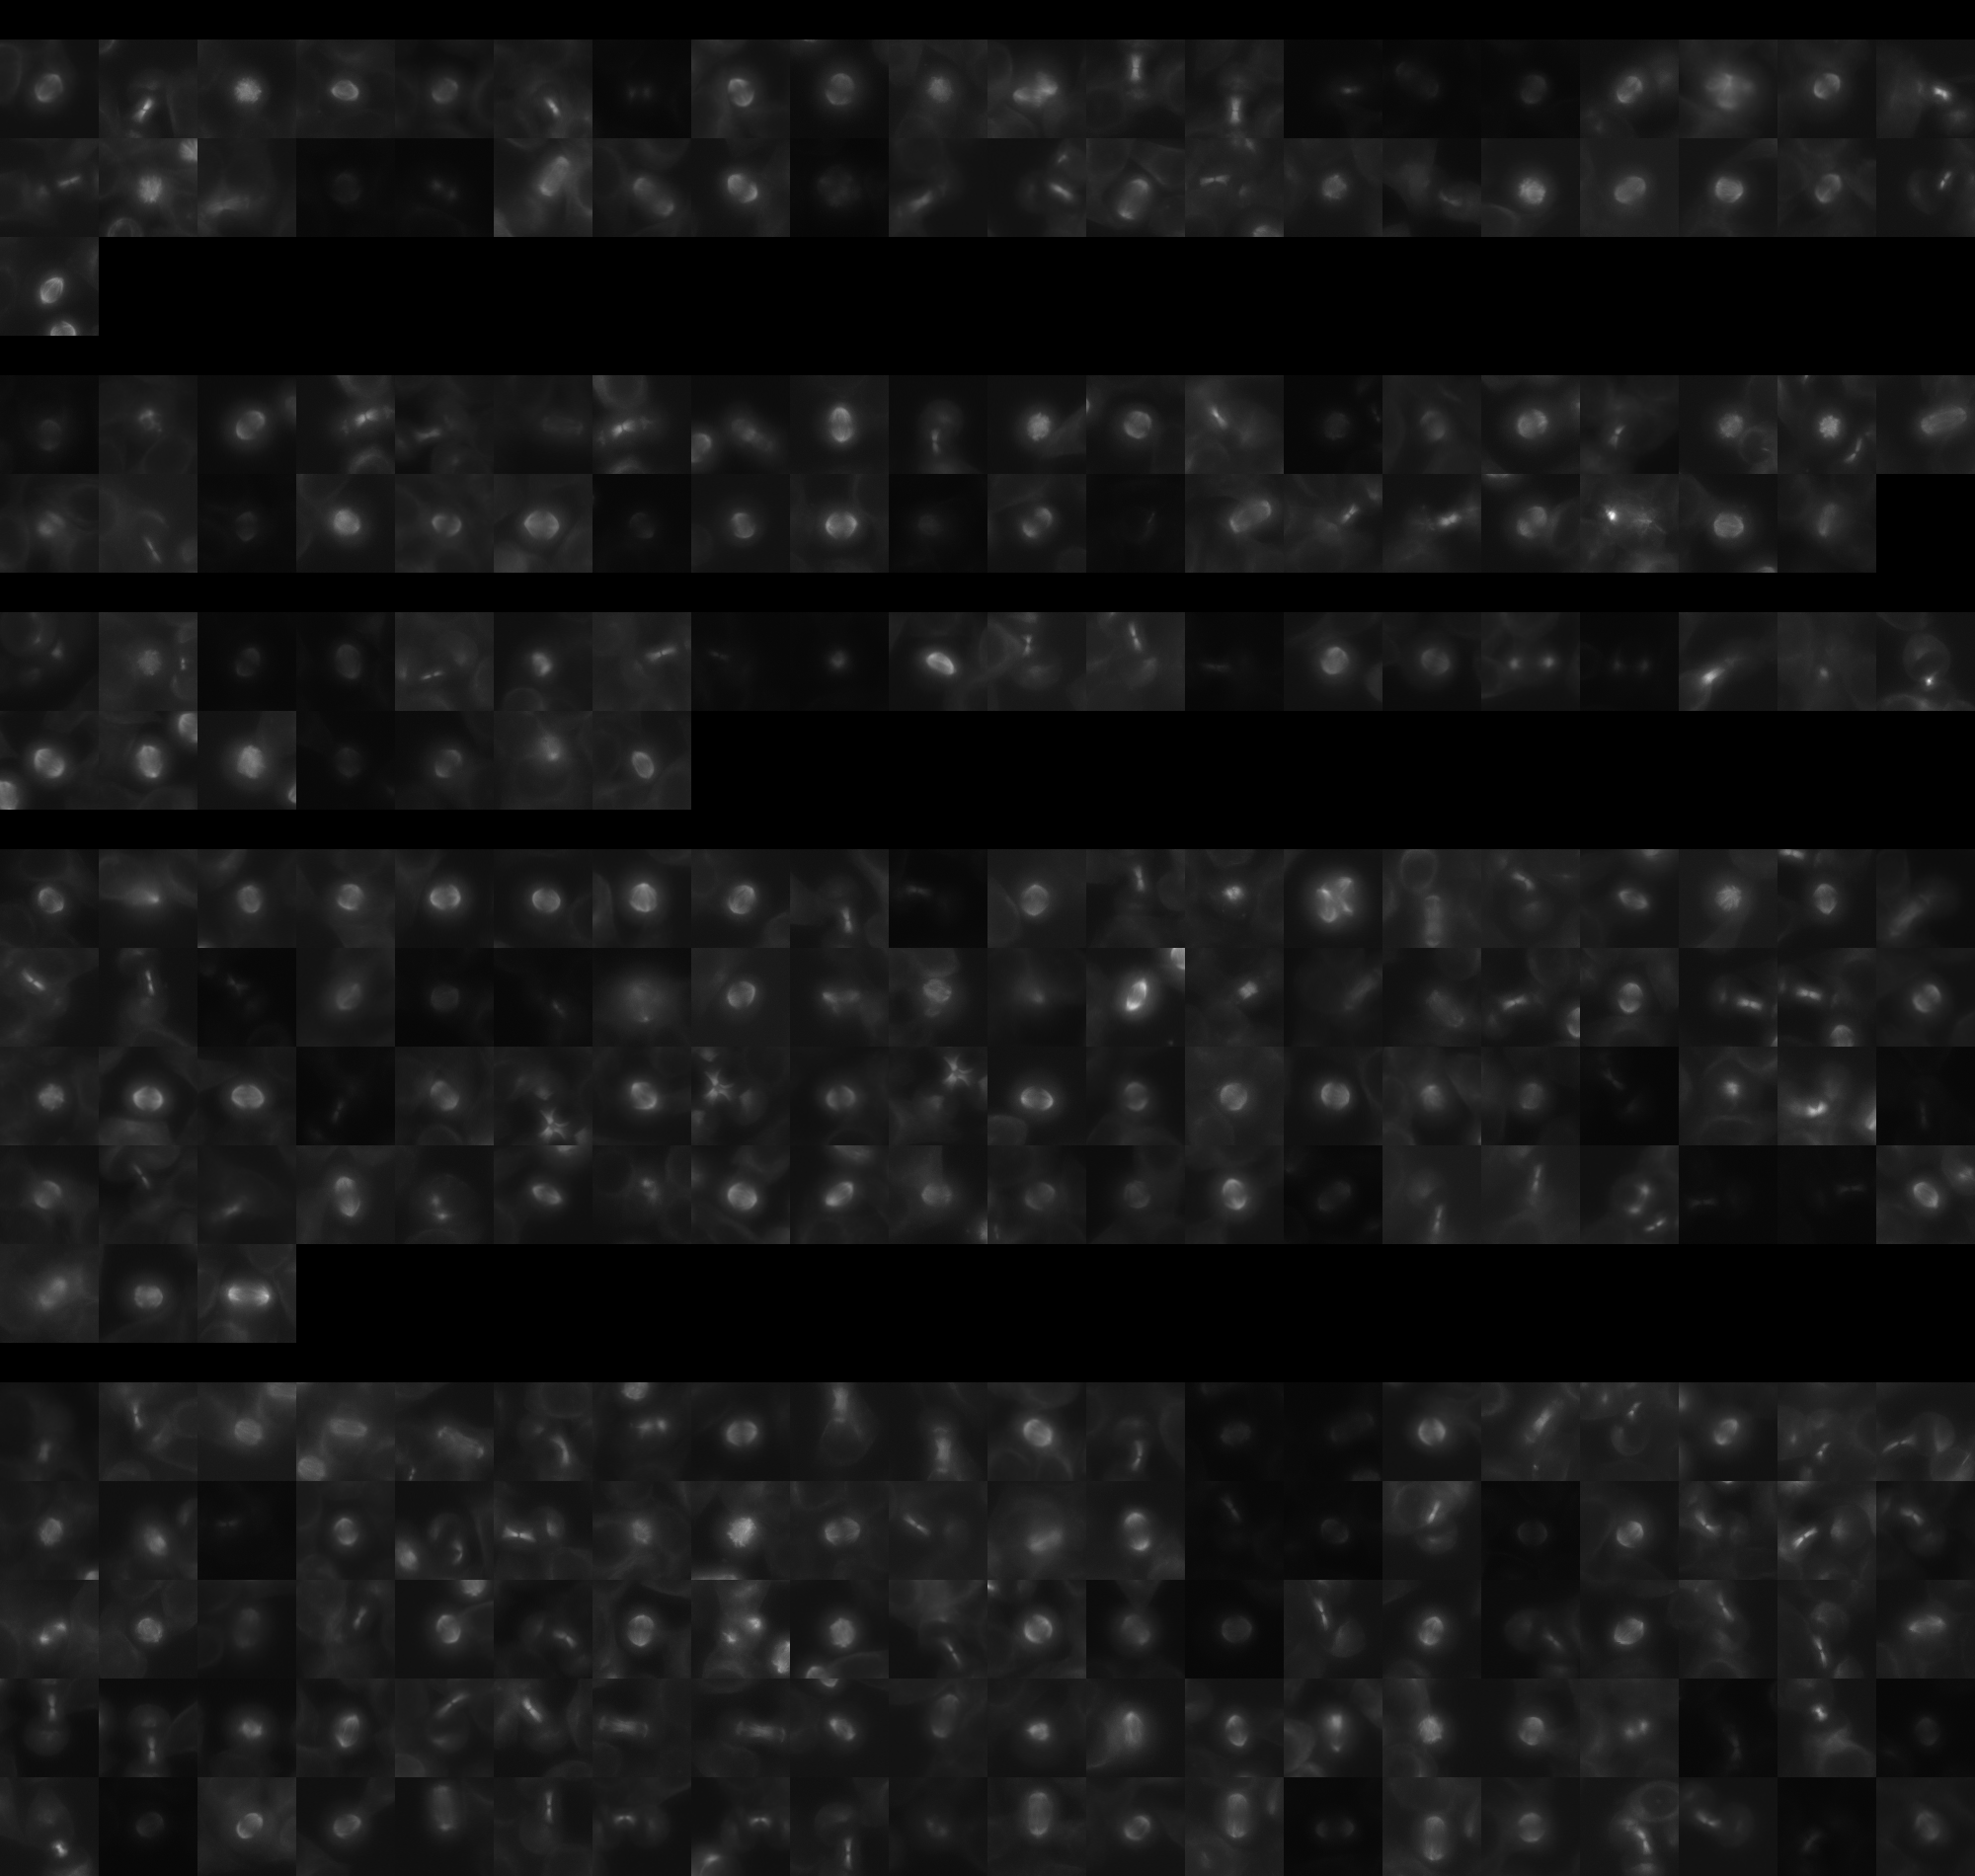
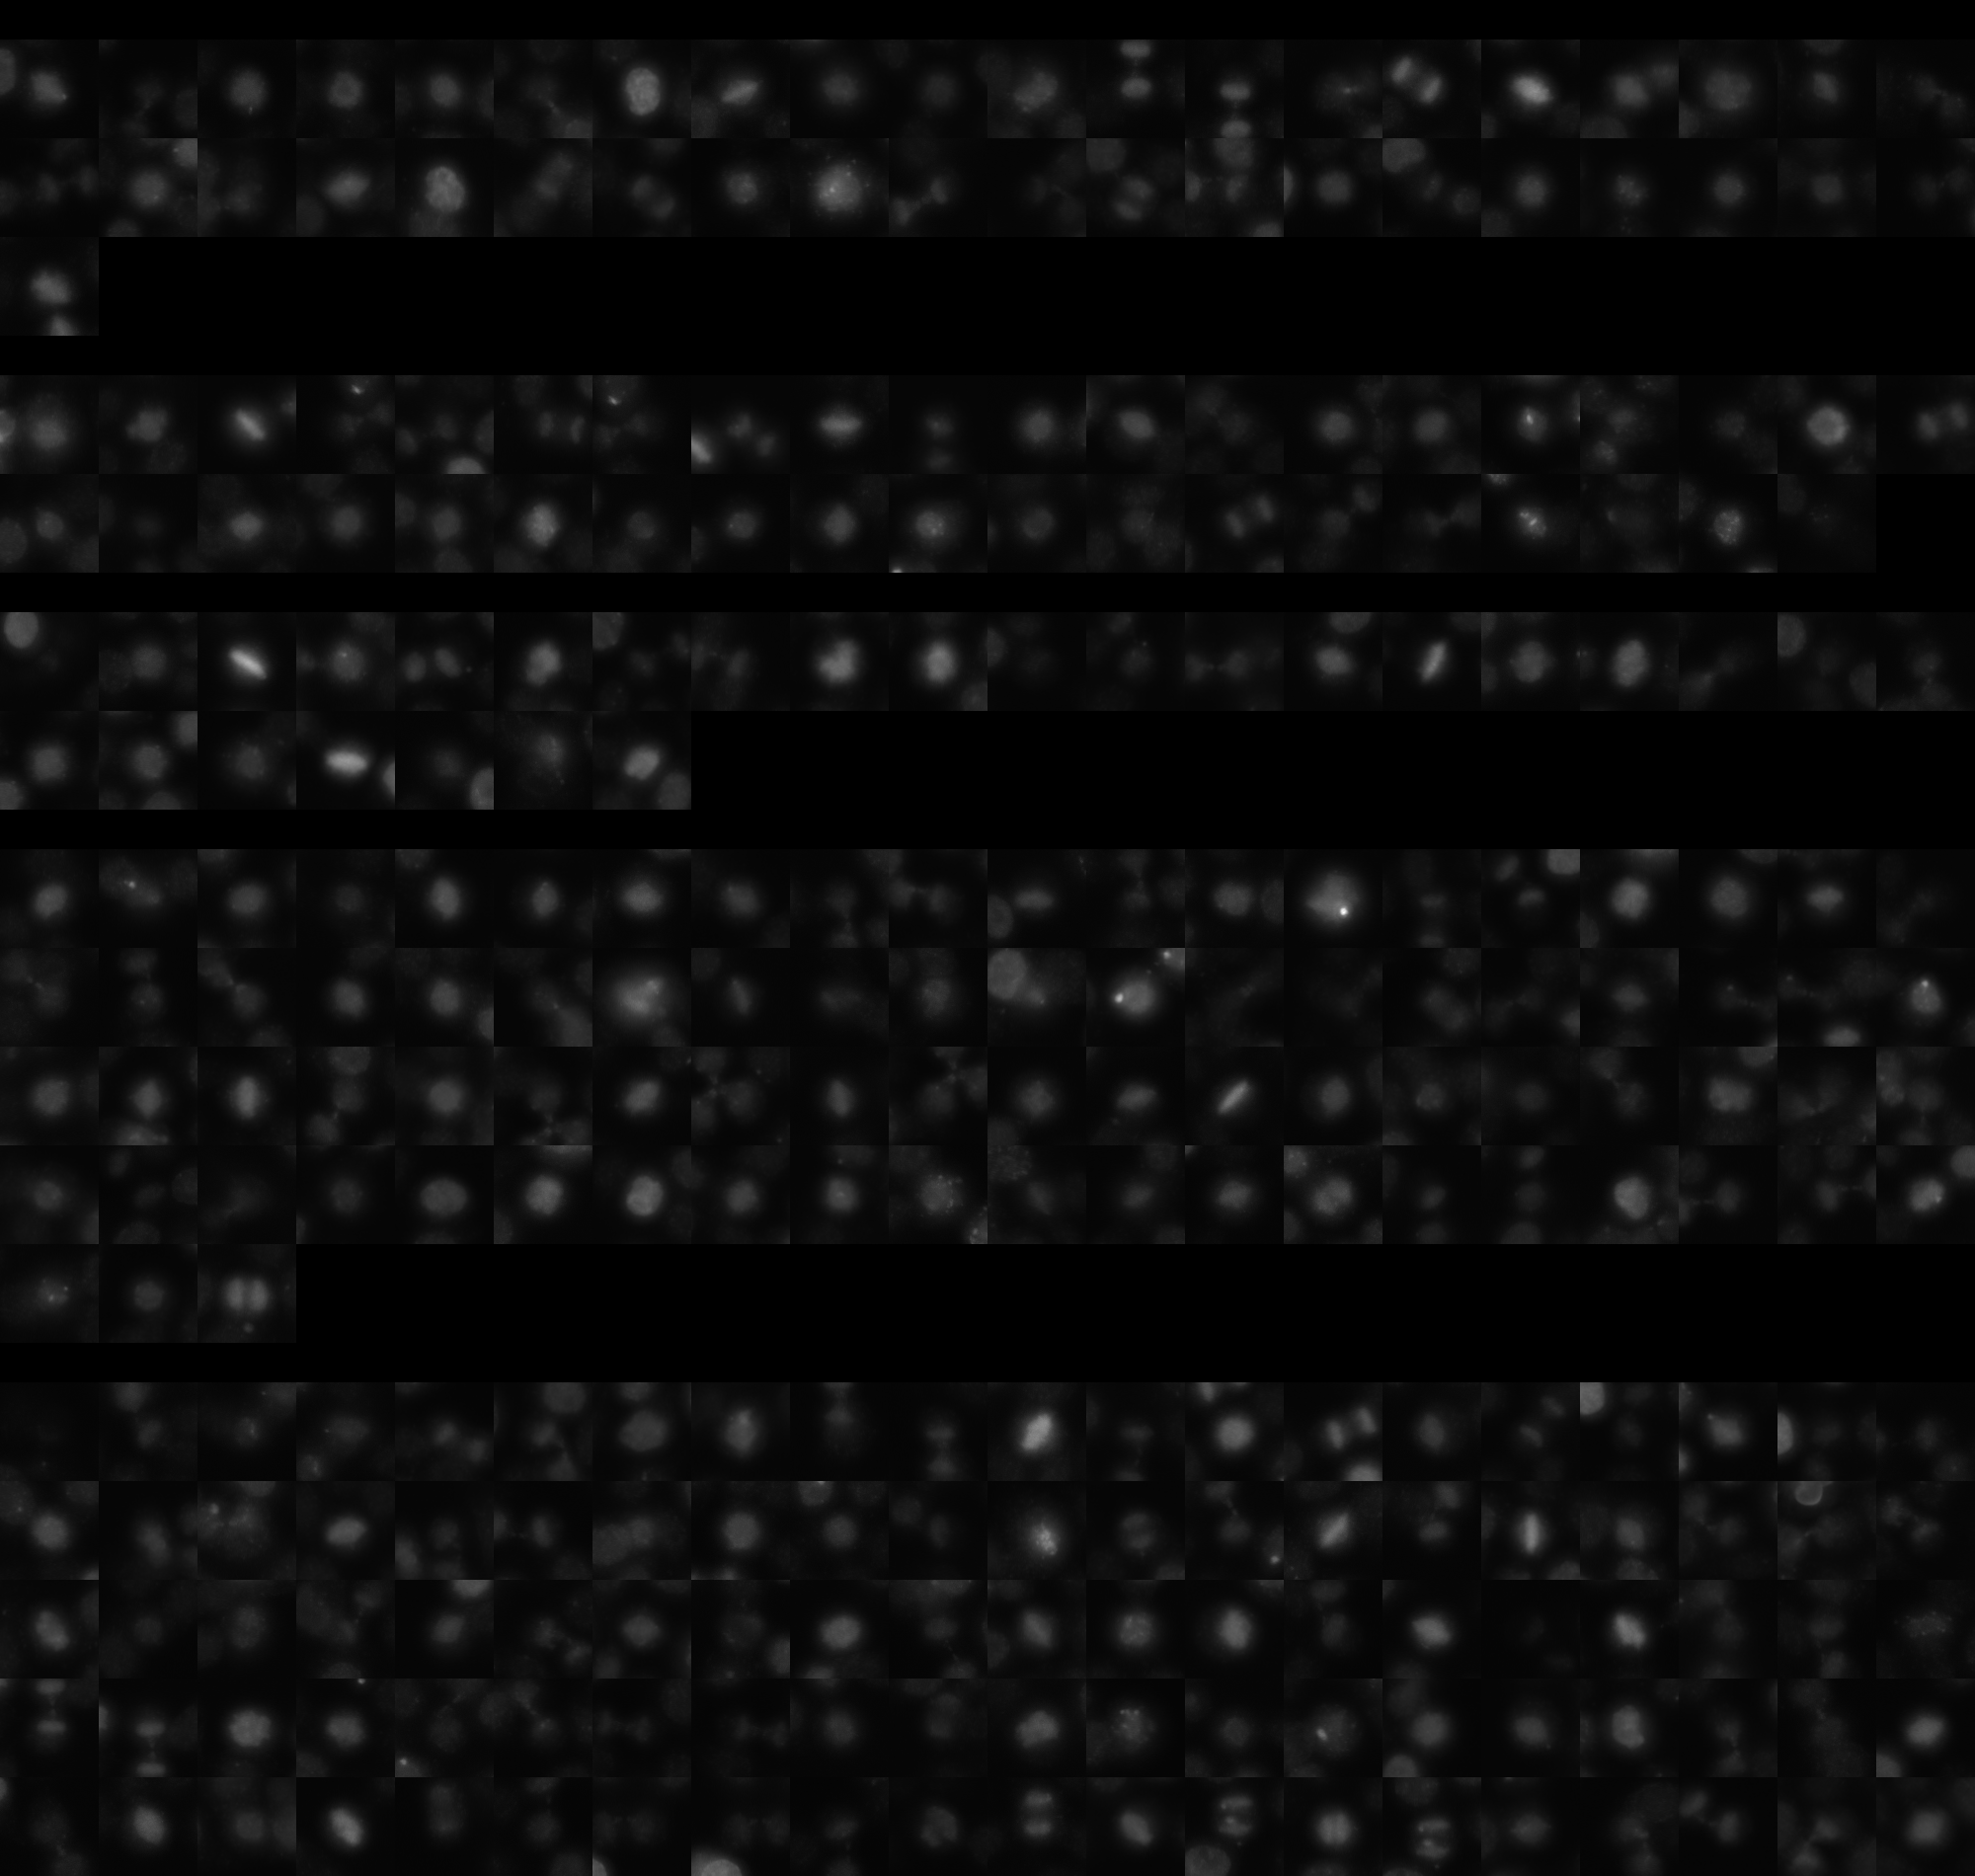
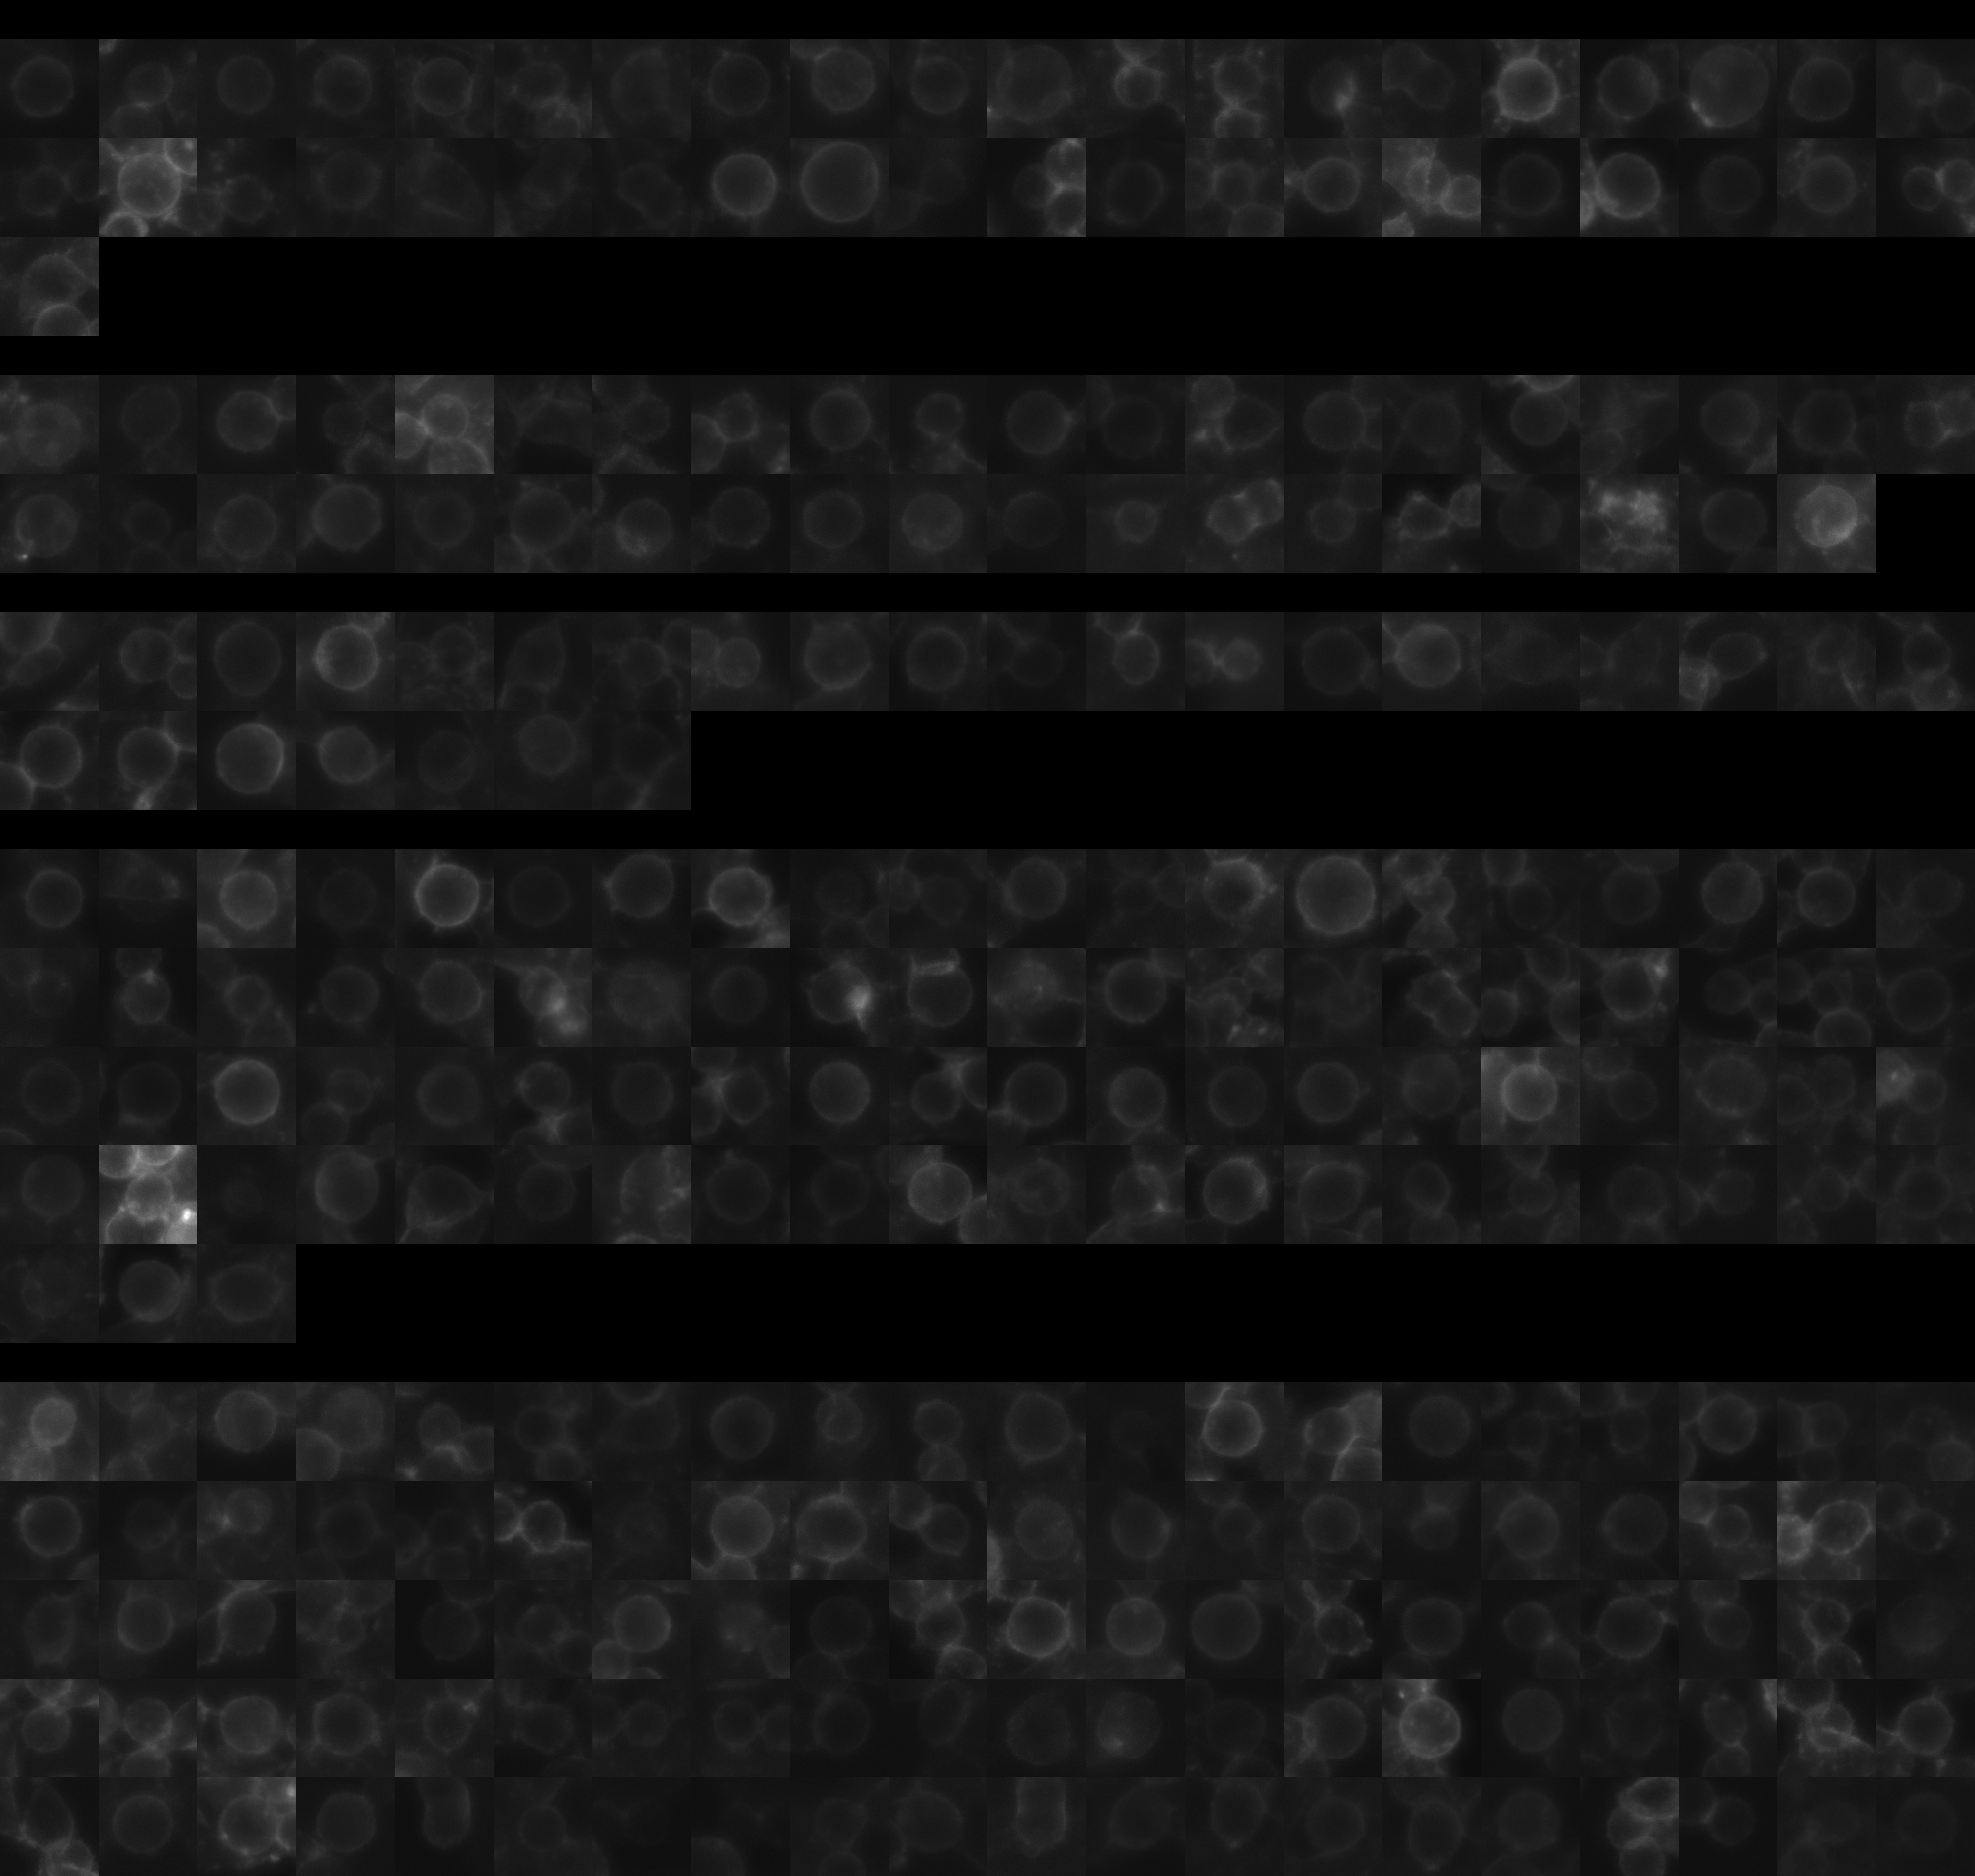
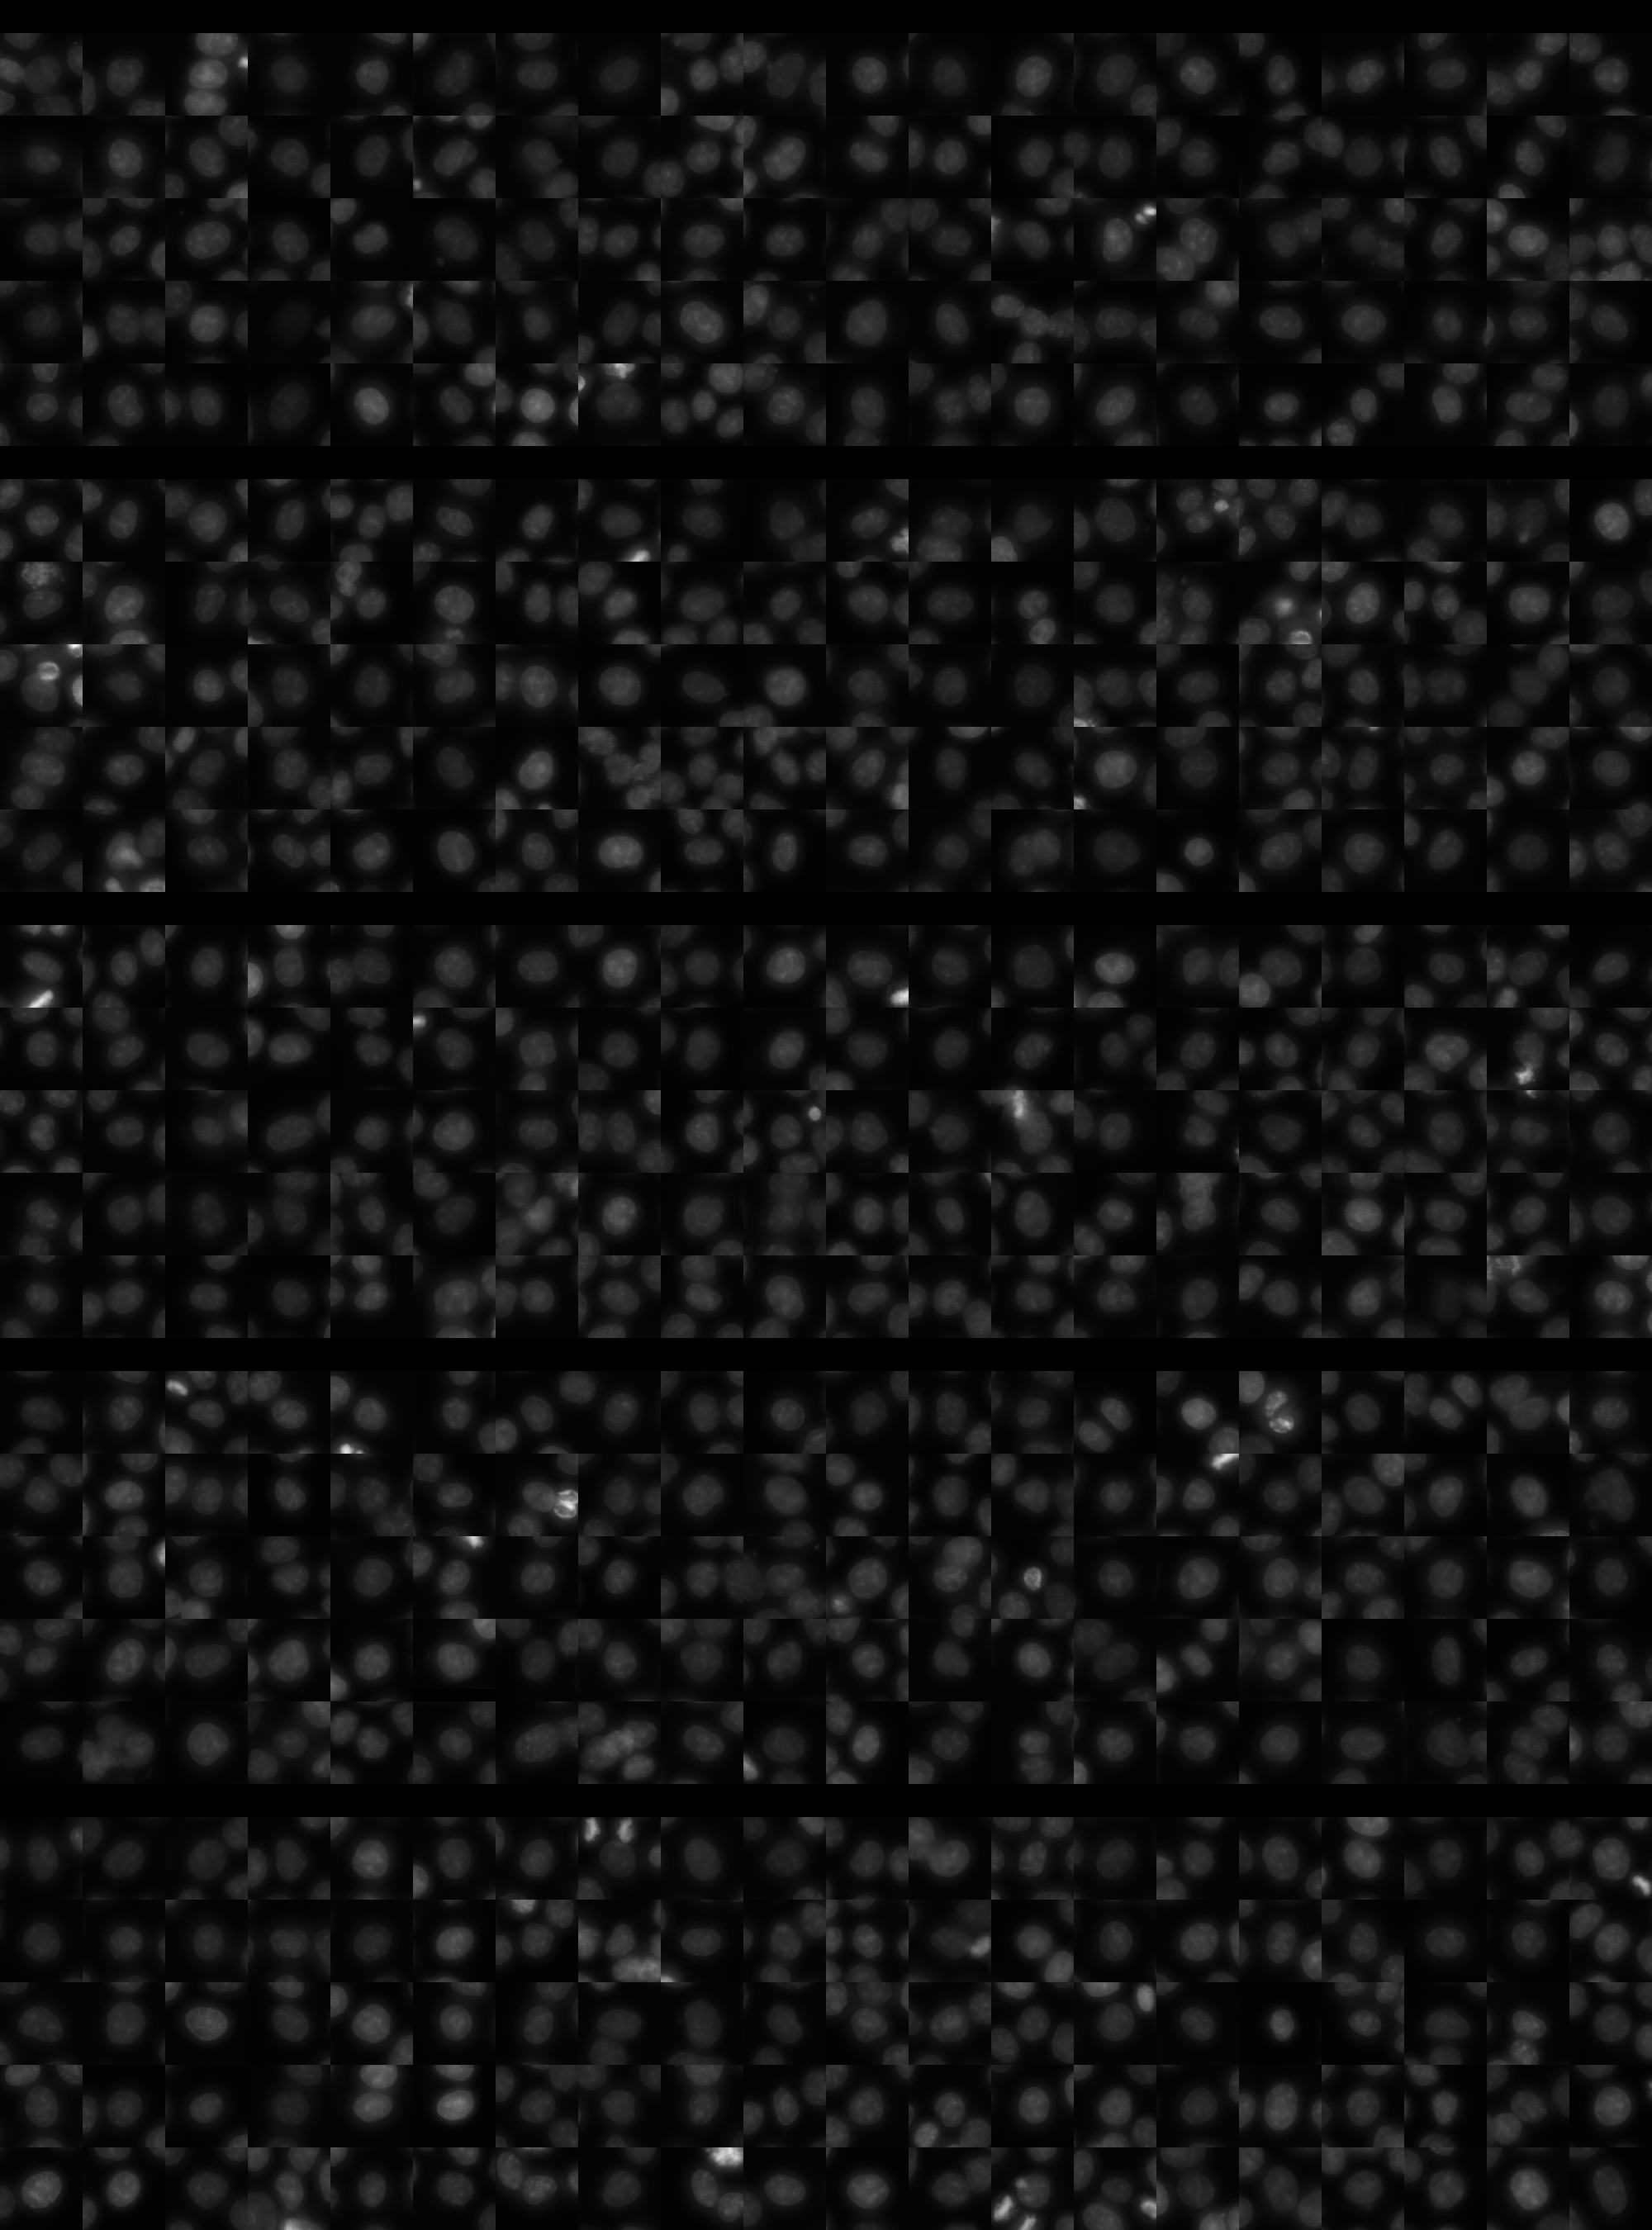
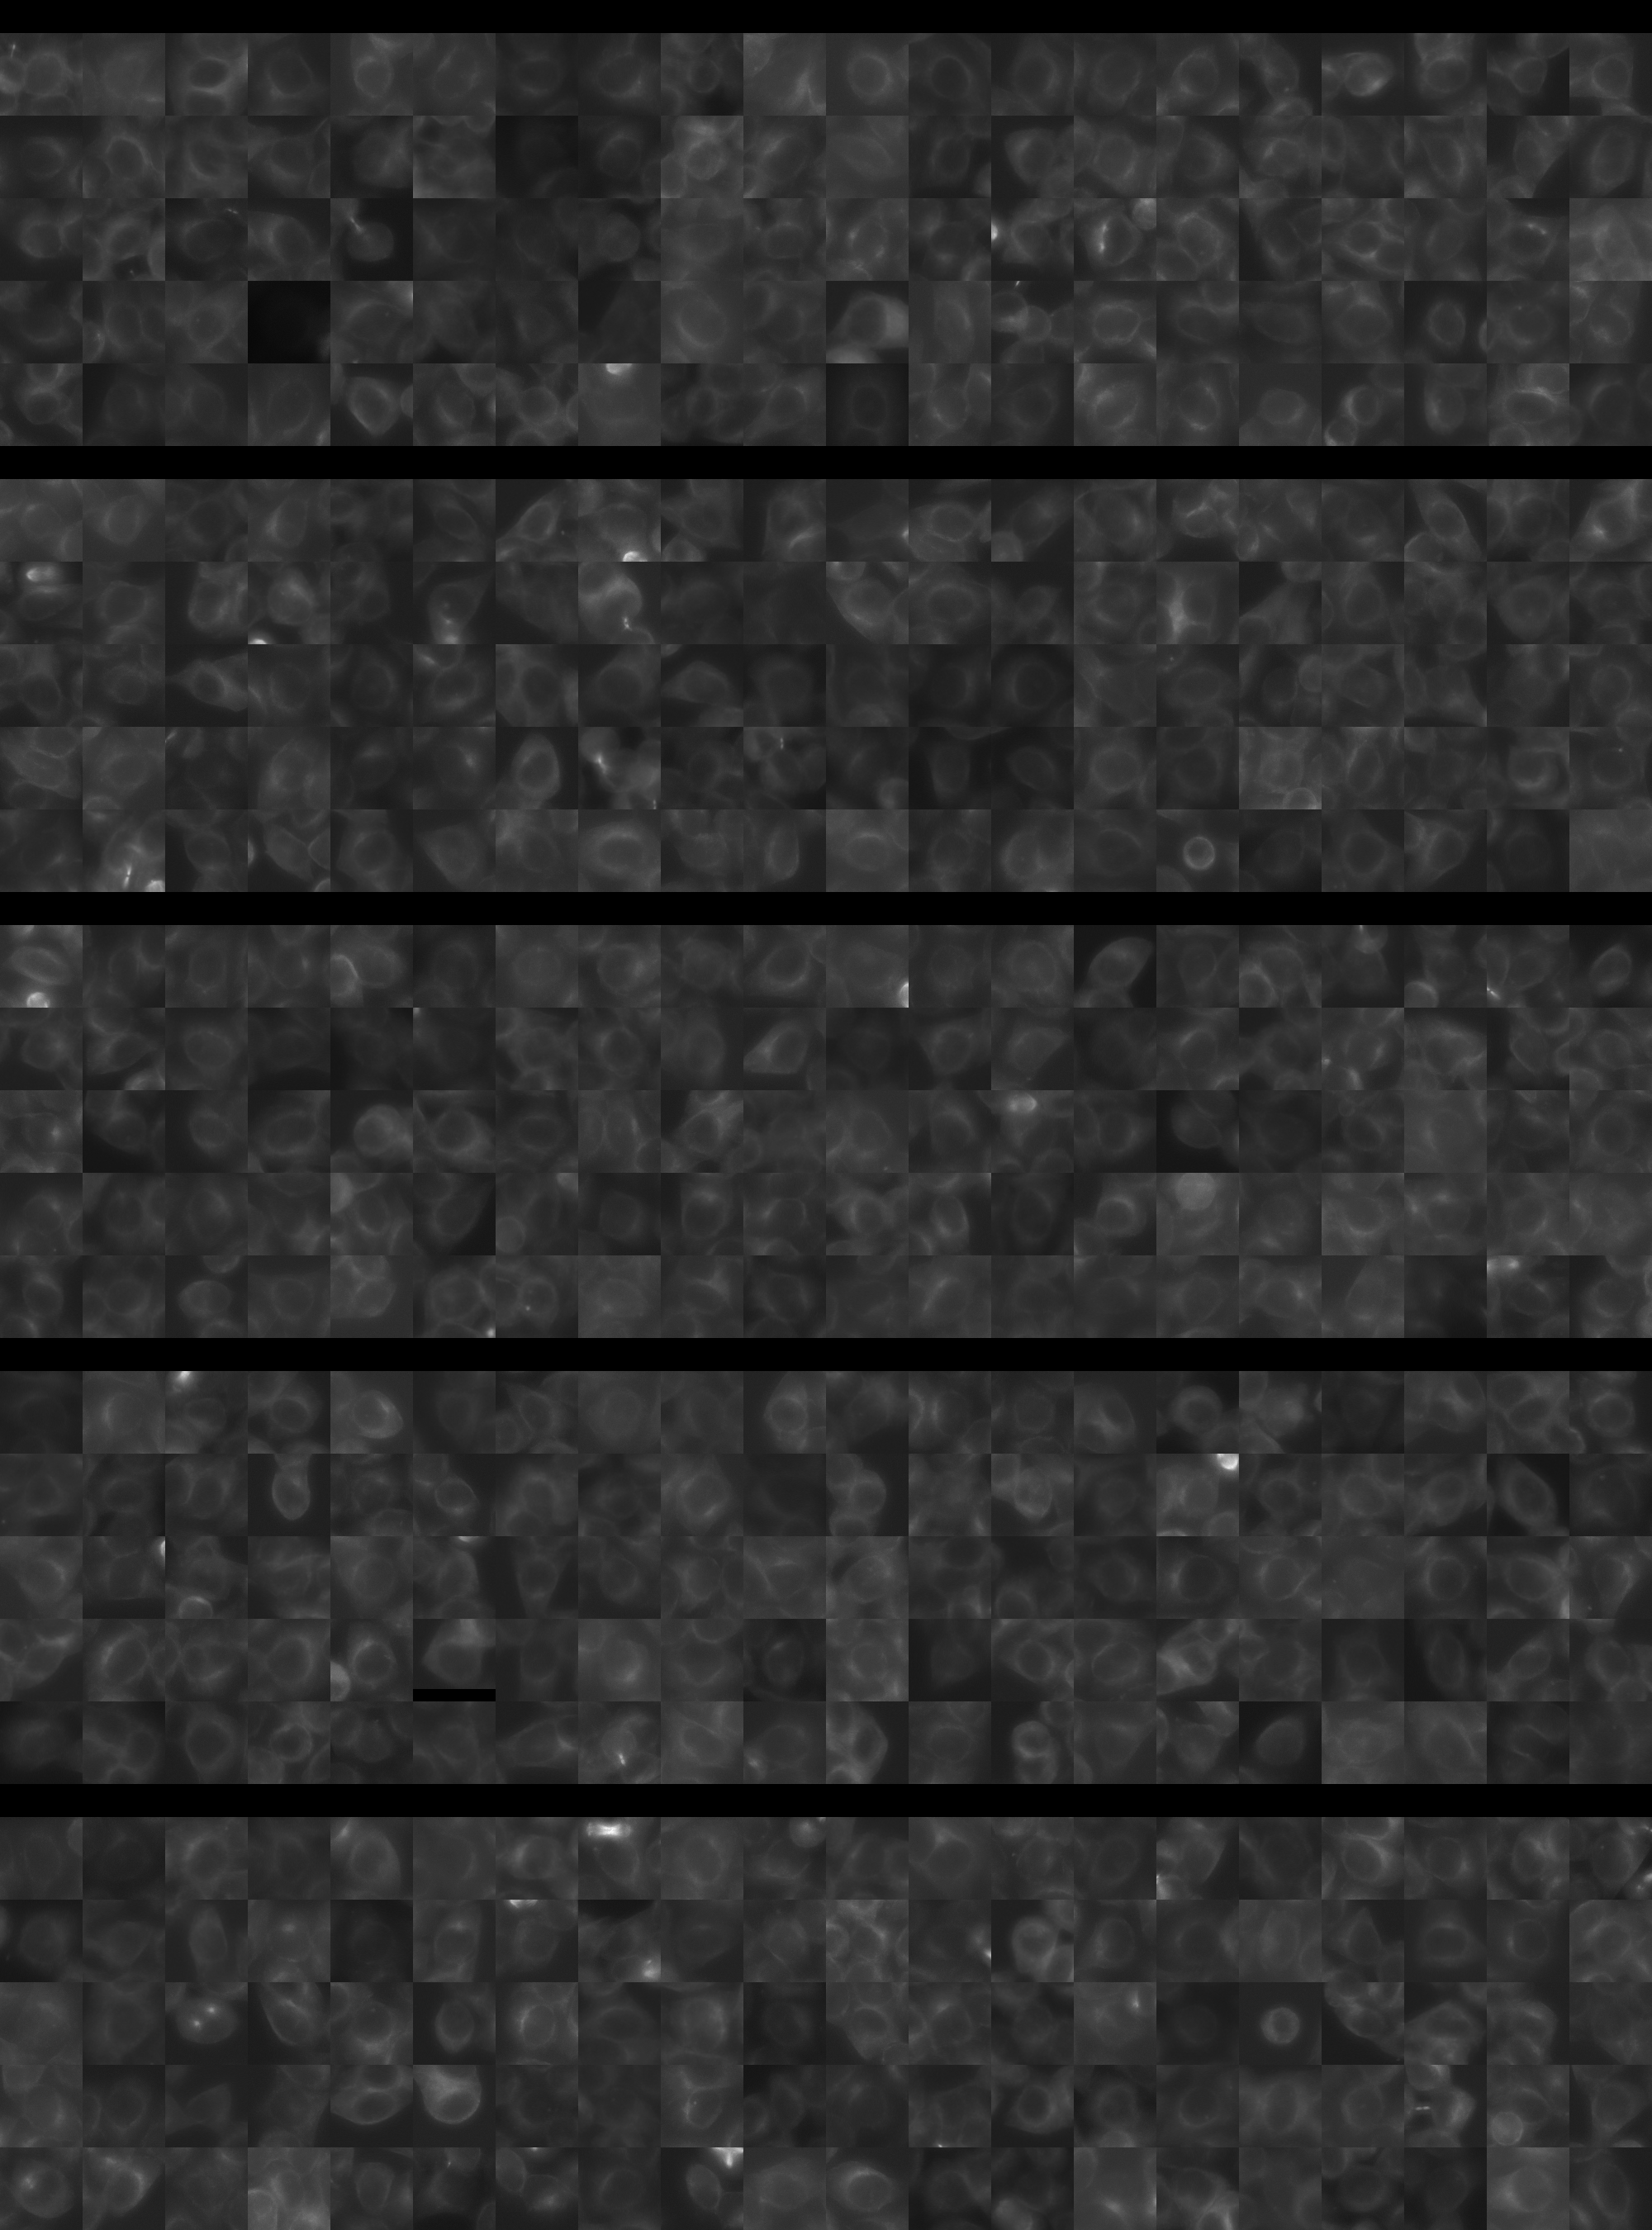
Each montage below shows randomly selected individual cell images for the same target gene separated by sgRNA, along with an example montage of cells expressing a non-targeting negative control sgRNA at the bottom. sgRNA labels in the montages correspond to the numbered sgRNA sequences in the gene info table above. The DNA (blue) and tubulin (green) channels are displayed by default, with gH2AX (grayscale) and actin (yellow) available using the check boxes. Channel brightness, contrast, and opacity are adjustable by clicking the arrow next to the channel name. When only one channel is selected, the display defaults to grayscale. Click the “Zoom” checkbox above the channel controls to enable image zooming (via scrolling) and panning (via click-and-drag).

The cell boxes displayed for this gene are square, 30.36 μm per side for the interphase montage and 30.36 μm per side for the mitotic montage.
Features

Interphase Score Rank FDR q-value
Nucleus DNA Integrated -1.279e-02 3737 of 5322 0.835
Nucleus DNA Mean -4.995e-02 3588 of 5322 0.237
Nucleus gH2AX Mean 0.036 3897 of 5322 0.320
Nucleus DNA - gH2AX Correlation -9.325e-02 3805 of 5322 4.964e-04
Nucleus Shape Area -2.236e-02 3947 of 5322 0.579
Nucleus Shape Eccentricity 0.073 443 of 5322 0.030
Nucleus Shape Form Factor -8.895e-02 4141 of 5322 0.016
Nucleus Shape Solidity -9.011e-02 4087 of 5322 0.005
Cell DNA Mass Displacement 0.024 2744 of 5322 0.693
Cell Tubulin Mean 0.007 2500 of 5322 0.869
Cell Tubulin Mass Displacement 0.012 2269 of 5322 0.860
Cell Actin Mean -3.625e-02 4064 of 5322 0.497
Cell Tubulin - Actin Correlation 0.033 2070 of 5322 0.426
Cell DNA - Tubulin Correlation 0.038 2338 of 5322 0.313
Cell Shape Area -3.201e-02 4073 of 5322 0.450
Cell Shape Eccentricity 0.045 746 of 5322 0.383
Mitotic Score Rank FDR q-value
Nucleus DNA Integrated 0.068 2964 of 5322 0.976
Nucleus DNA Mean -6.697e-02 3922 of 5322 1.000
Nucleus DNA Mass Displacement 0.066 2445 of 5322 0.999
Nucleus DNA Mean Frac 3 0.096 1637 of 5322 1.000
Nucleus gH2AX Mean 0.128 1320 of 5322 1.000
Nucleus gH2AX Mean Frac 0 -2.278e-02 2631 of 5322 1.000
Nucleus Tubulin Mean Frac 0 0.092 2084 of 5322 0.999
Nucleus Tubulin Mean Edge 0.145 1316 of 5322 0.999
Nucleus Tubulin Std Edge 0.192 498 of 5322 0.999
Nucleus Shape Area 0.122 2363 of 5322 0.989
Nucleus Shape Eccentricity 0.005 2014 of 5322 1.000
Nucleus Shape Form Factor -1.127e-01 3034 of 5322 0.998
Cell Tubulin Mean -7.725e-02 4393 of 5322 0.997
Cell Tubulin Mean Frac 3 0.045 1196 of 5322 0.999
Cell Actin Mean -9.658e-02 4370 of 5322 0.997
Cell Shape Area 0.072 2991 of 5322 0.998
( Reset Zoom )
Brightness
Contrast
Opacity
Brightness
Contrast
Opacity
Brightness
Contrast
Opacity
Brightness
Contrast
Opacity
Brightness
Contrast
Opacity

( Reset Zoom )
Brightness
Contrast
Opacity
Brightness
Contrast
Opacity
Brightness
Contrast
Opacity
Brightness
Contrast
Opacity
Brightness
Contrast
Opacity

MIT Central Accessability