NCOA2

Gene symbol: NCOA2
Gene: 10499
Uniprot Function: Transcriptional coactivator for steroid receptors and nuclear receptors. Coactivator of the steroid binding domain (AF-2) but not of the modulating N-terminal domain (AF-1). Required with NCOA1 to control energy balance between white and brown adipose tissues. Critical regulator of glucose metabolism regulation, acts as RORA coactivator to specifically modulate G6PC1 expression. Involved in the positive regulation of the transcriptional activity of the glucocorticoid receptor NR3C1 by sumoylation enhancer RWDD3. Positively regulates the circadian clock by acting as a transcriptional coactivator for the CLOCK-ARNTL/BMAL1 heterodimer (By similarity).
Mitotic Index 0.0218
Interphase Cluster: #83 (26 genes)
Mitotic Cluster: #116 (23 genes)
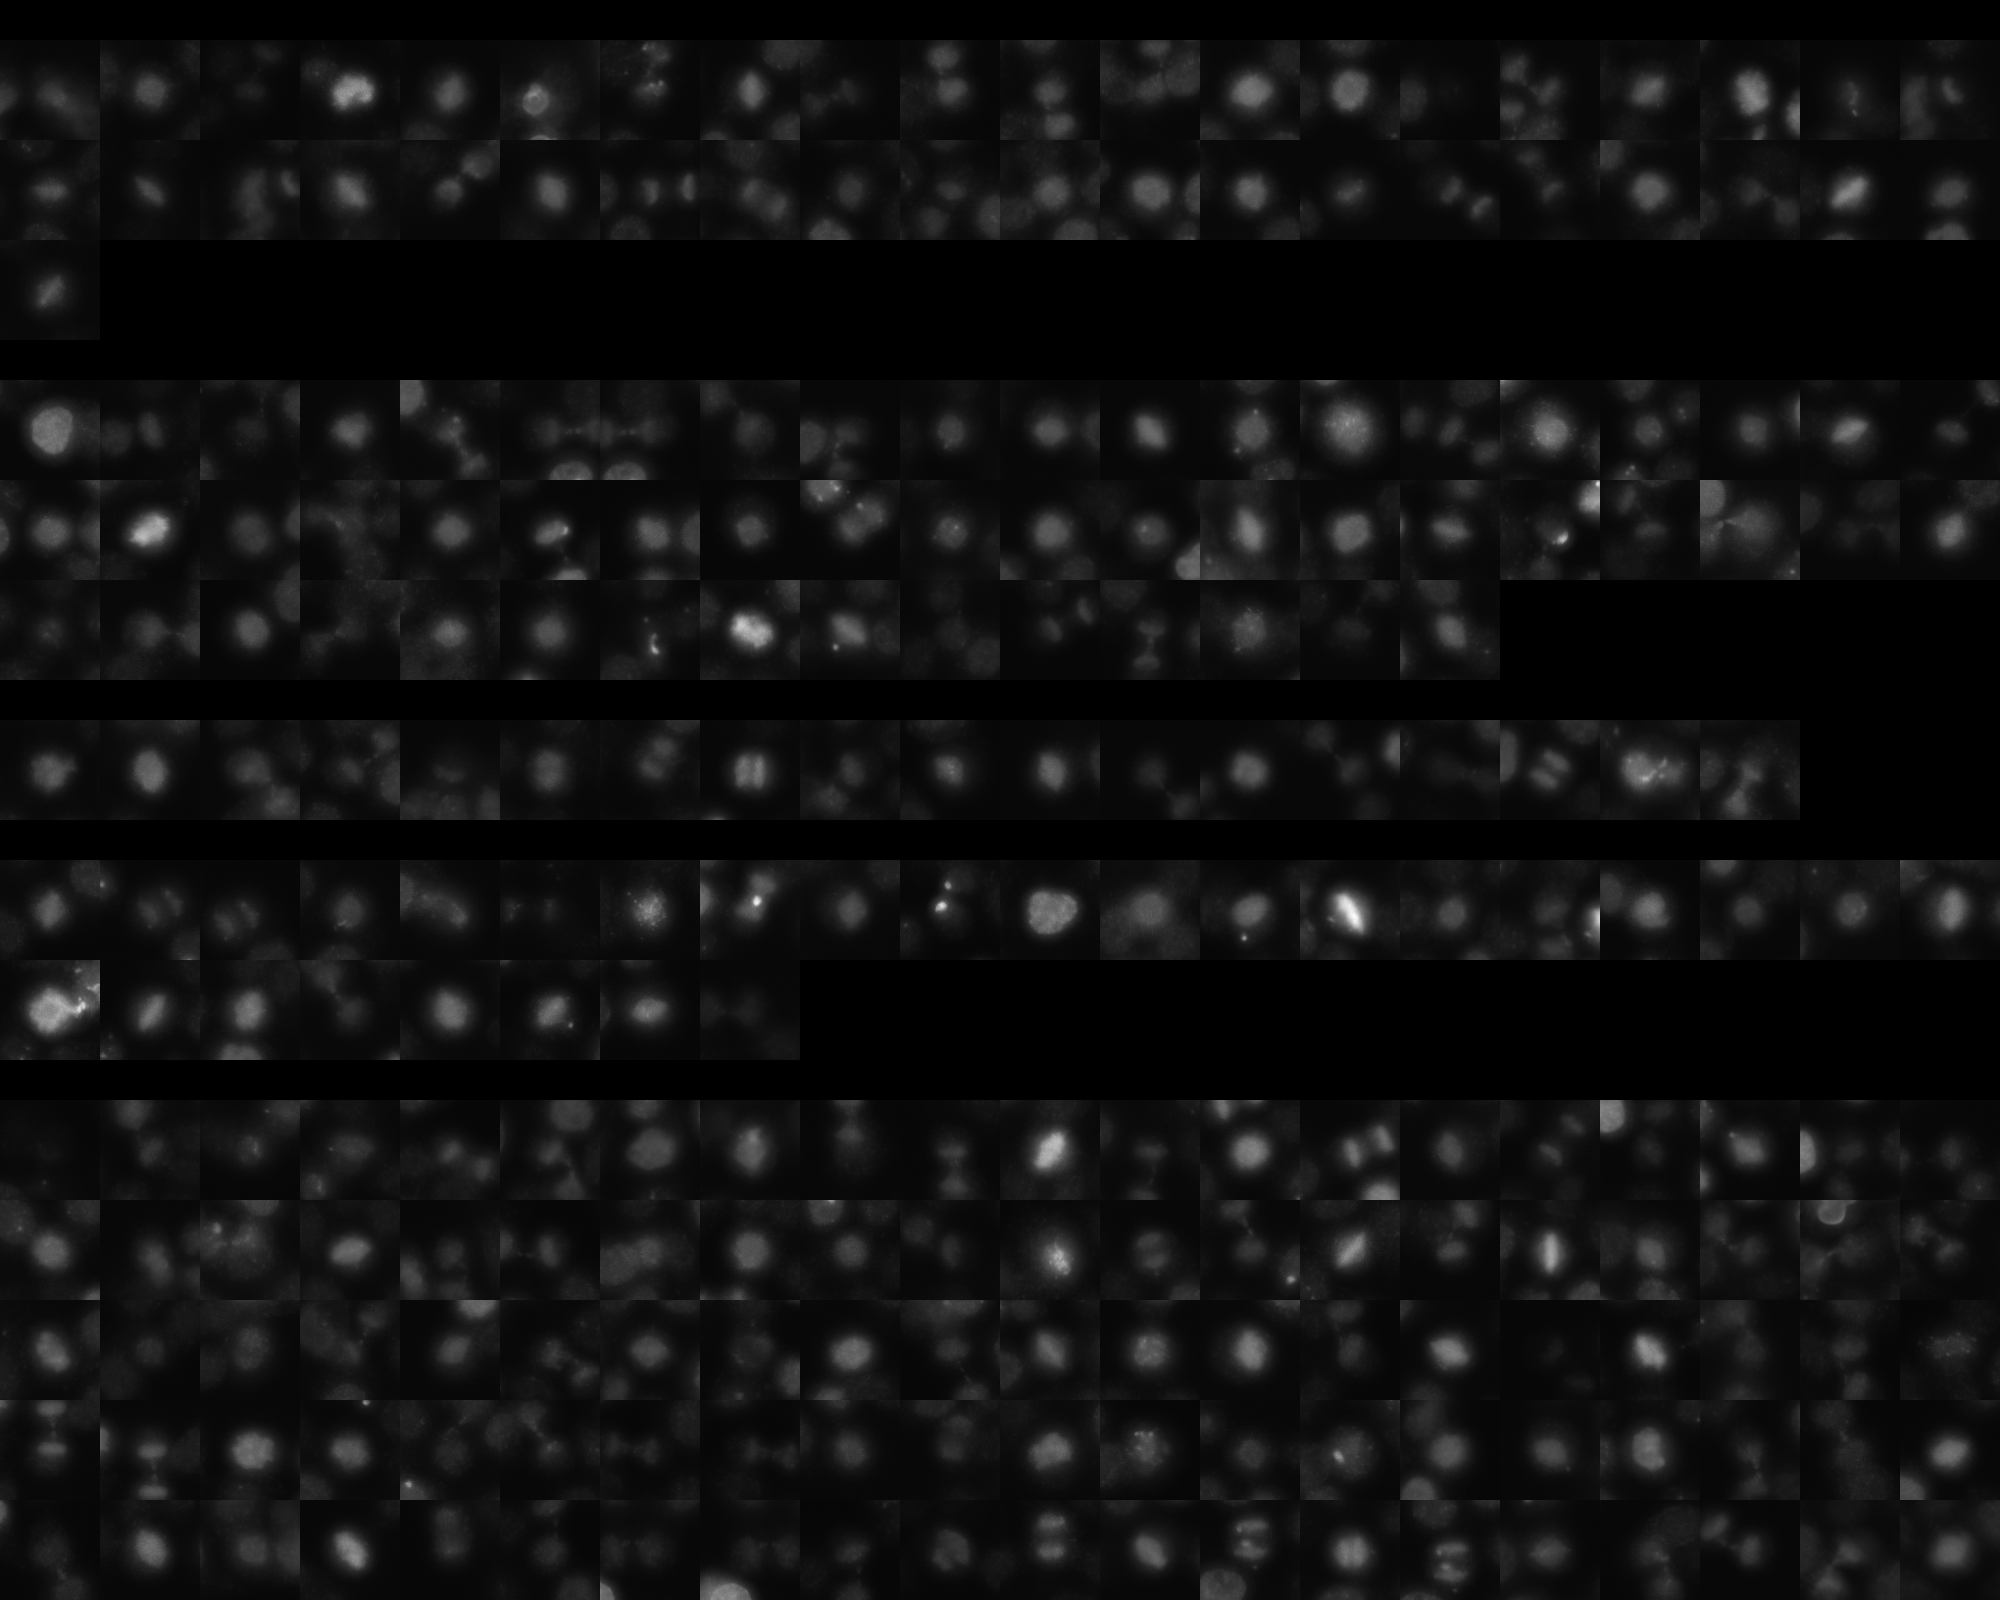
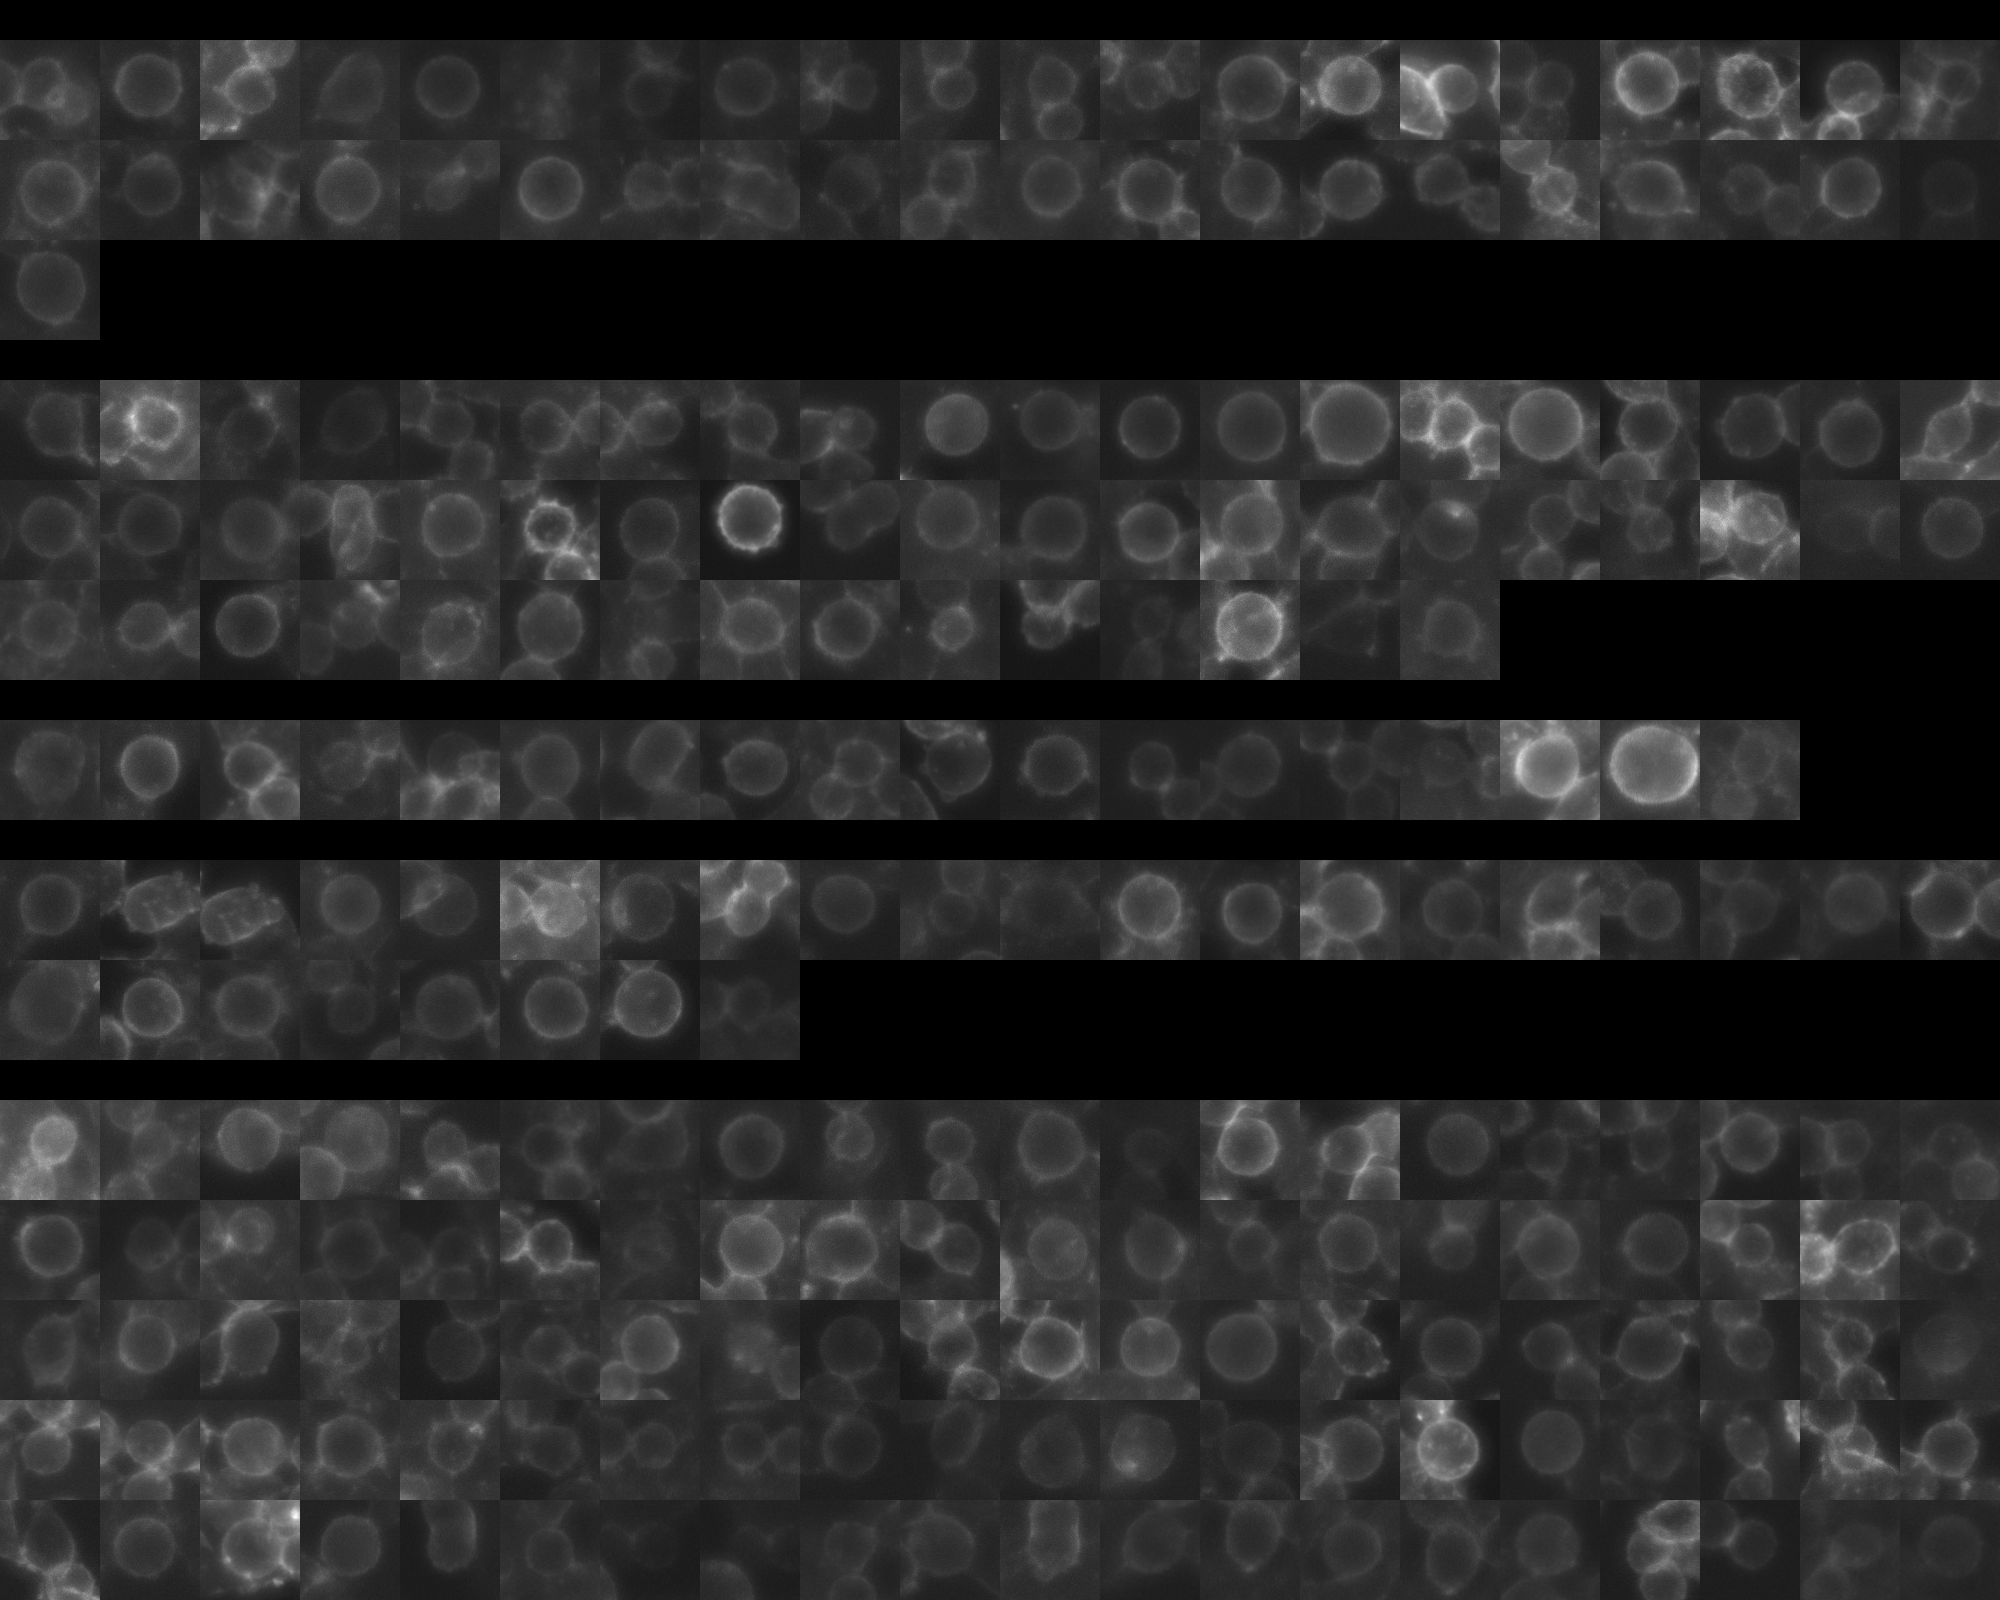
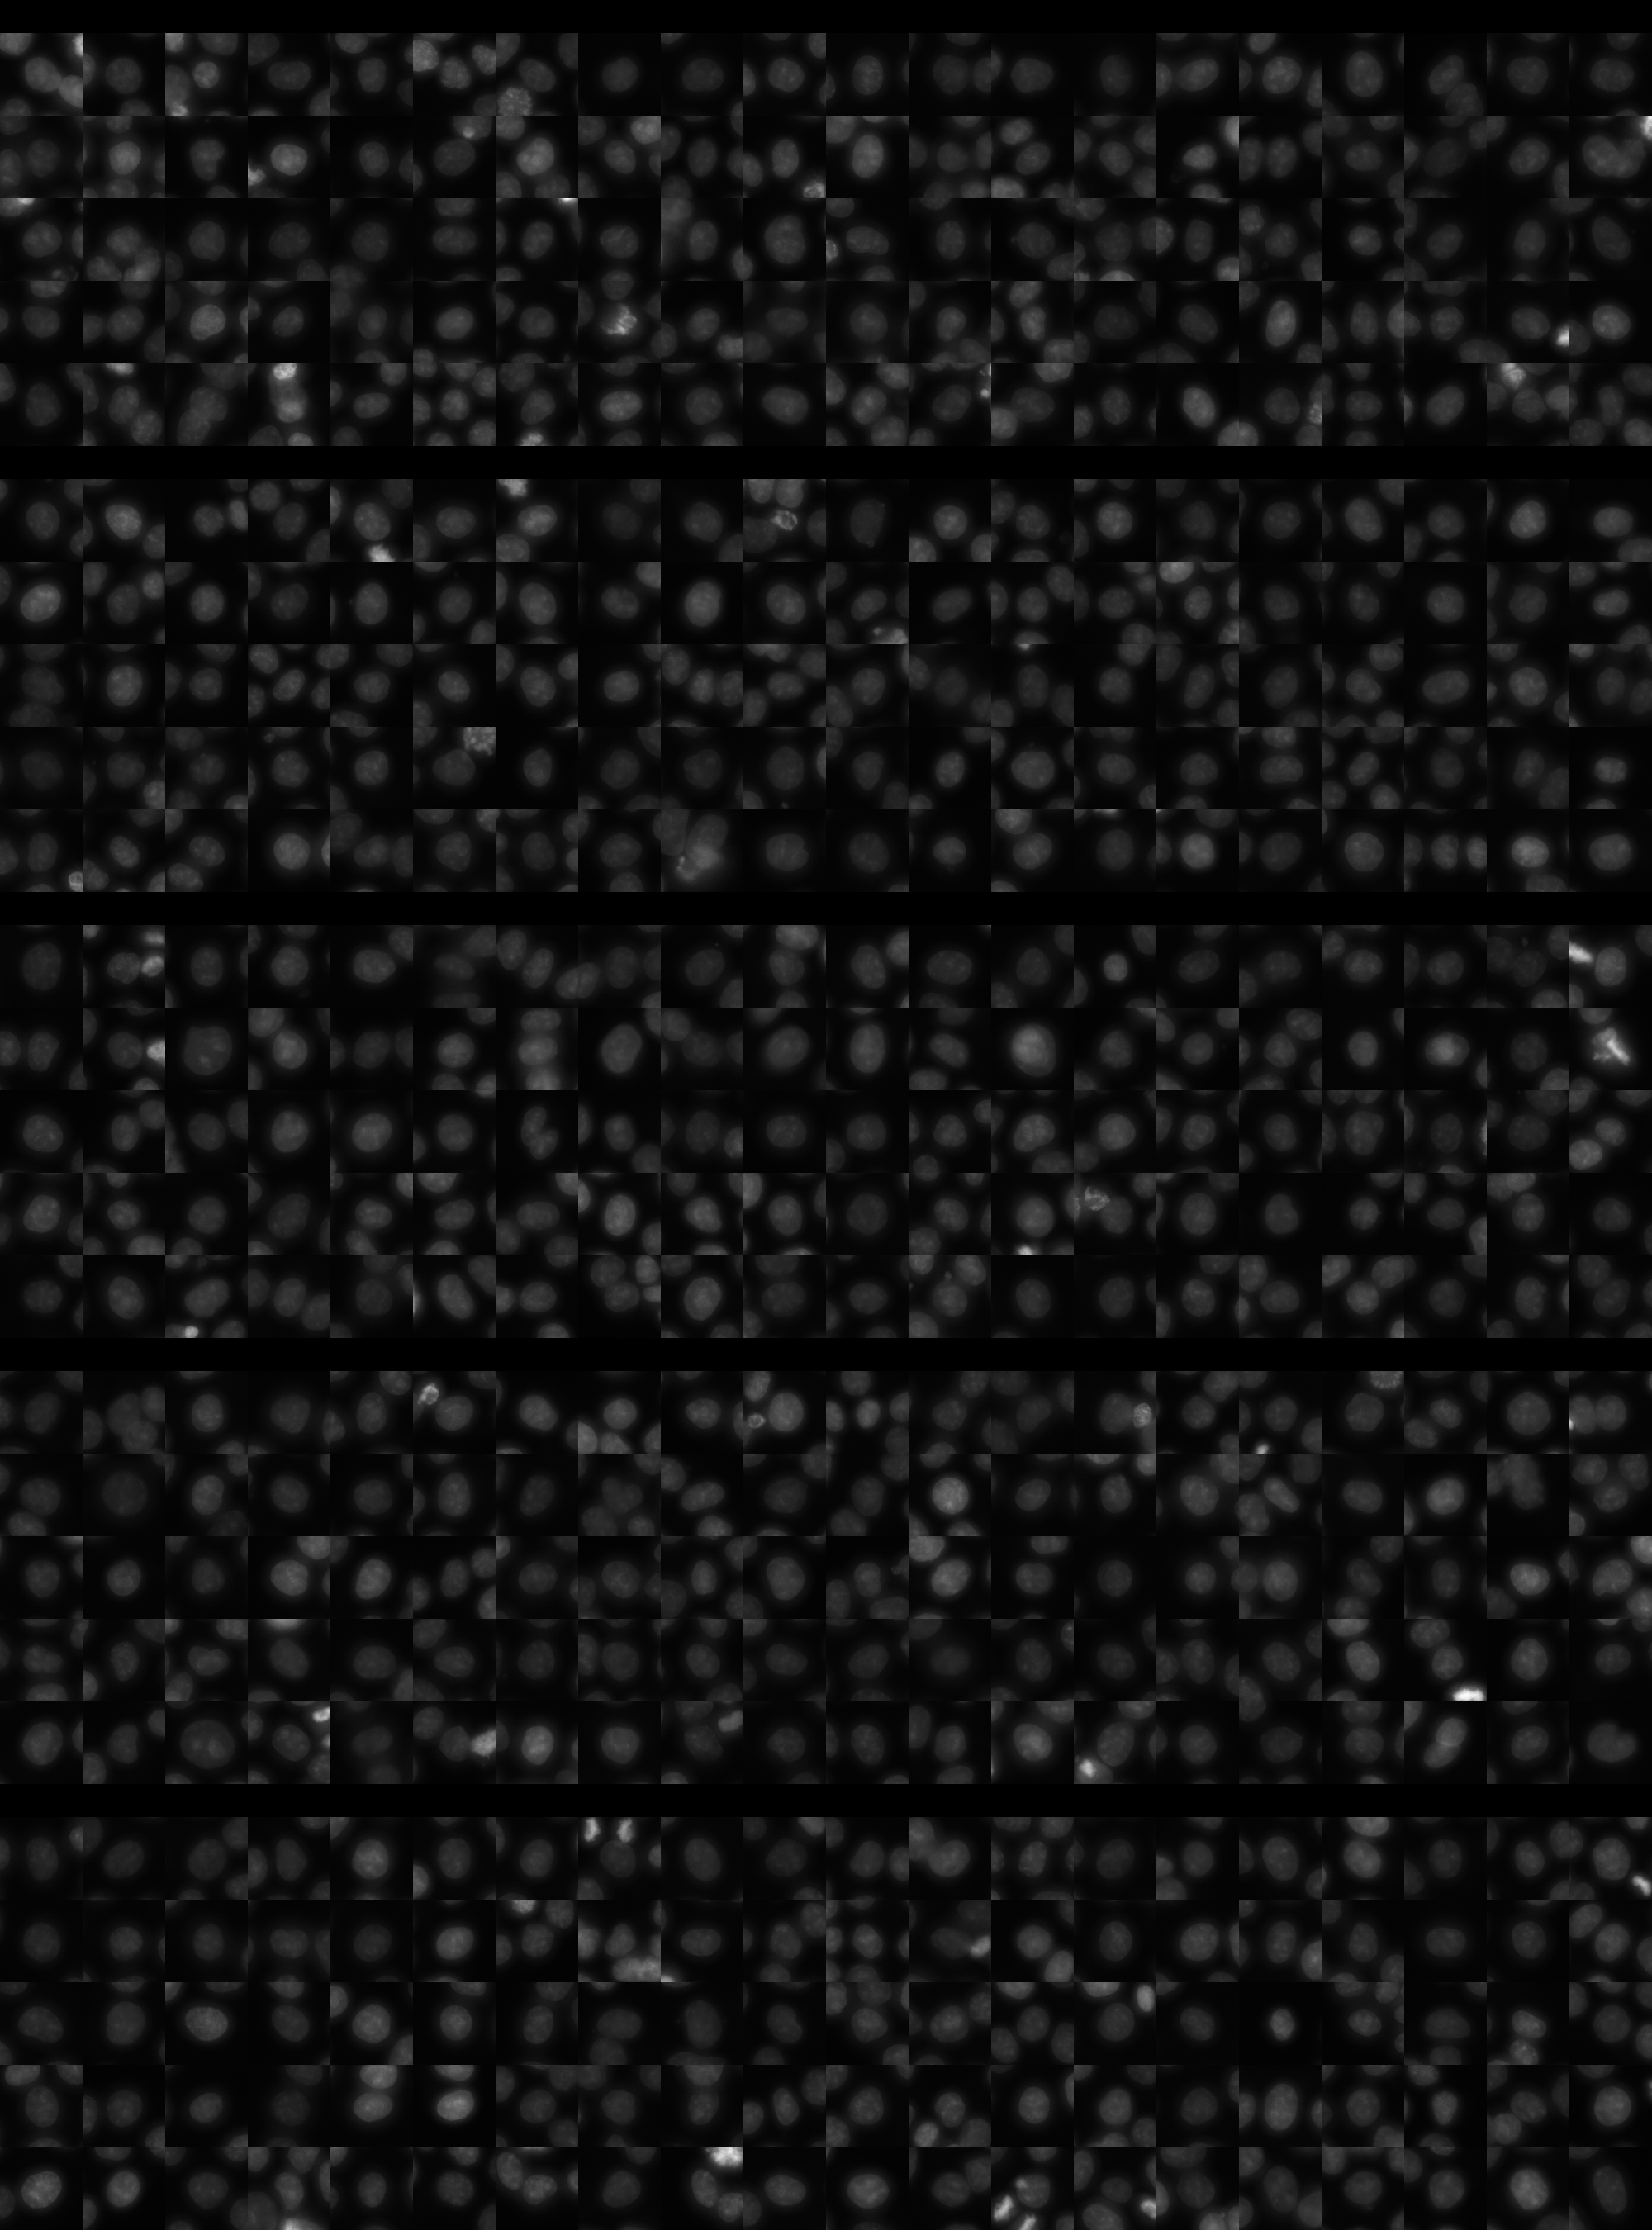
sgRNA 1: CAGGCCATCAAAATTCCGCA (interphase cells: 1722, mitotic cells: 41)
sgRNA 2: GGGAGGATTCATATTAACTG (interphase cells: 2571, mitotic cells: 55)
sgRNA 3: GGTCTGGCGAACCTCCGAGG (interphase cells: 628, mitotic cells: 18)
sgRNA 4: TACACATGGAACCTCGCTCA (interphase cells: 1447, mitotic cells: 28)

Interphase Cluster

Mitotic Cluster

Overview

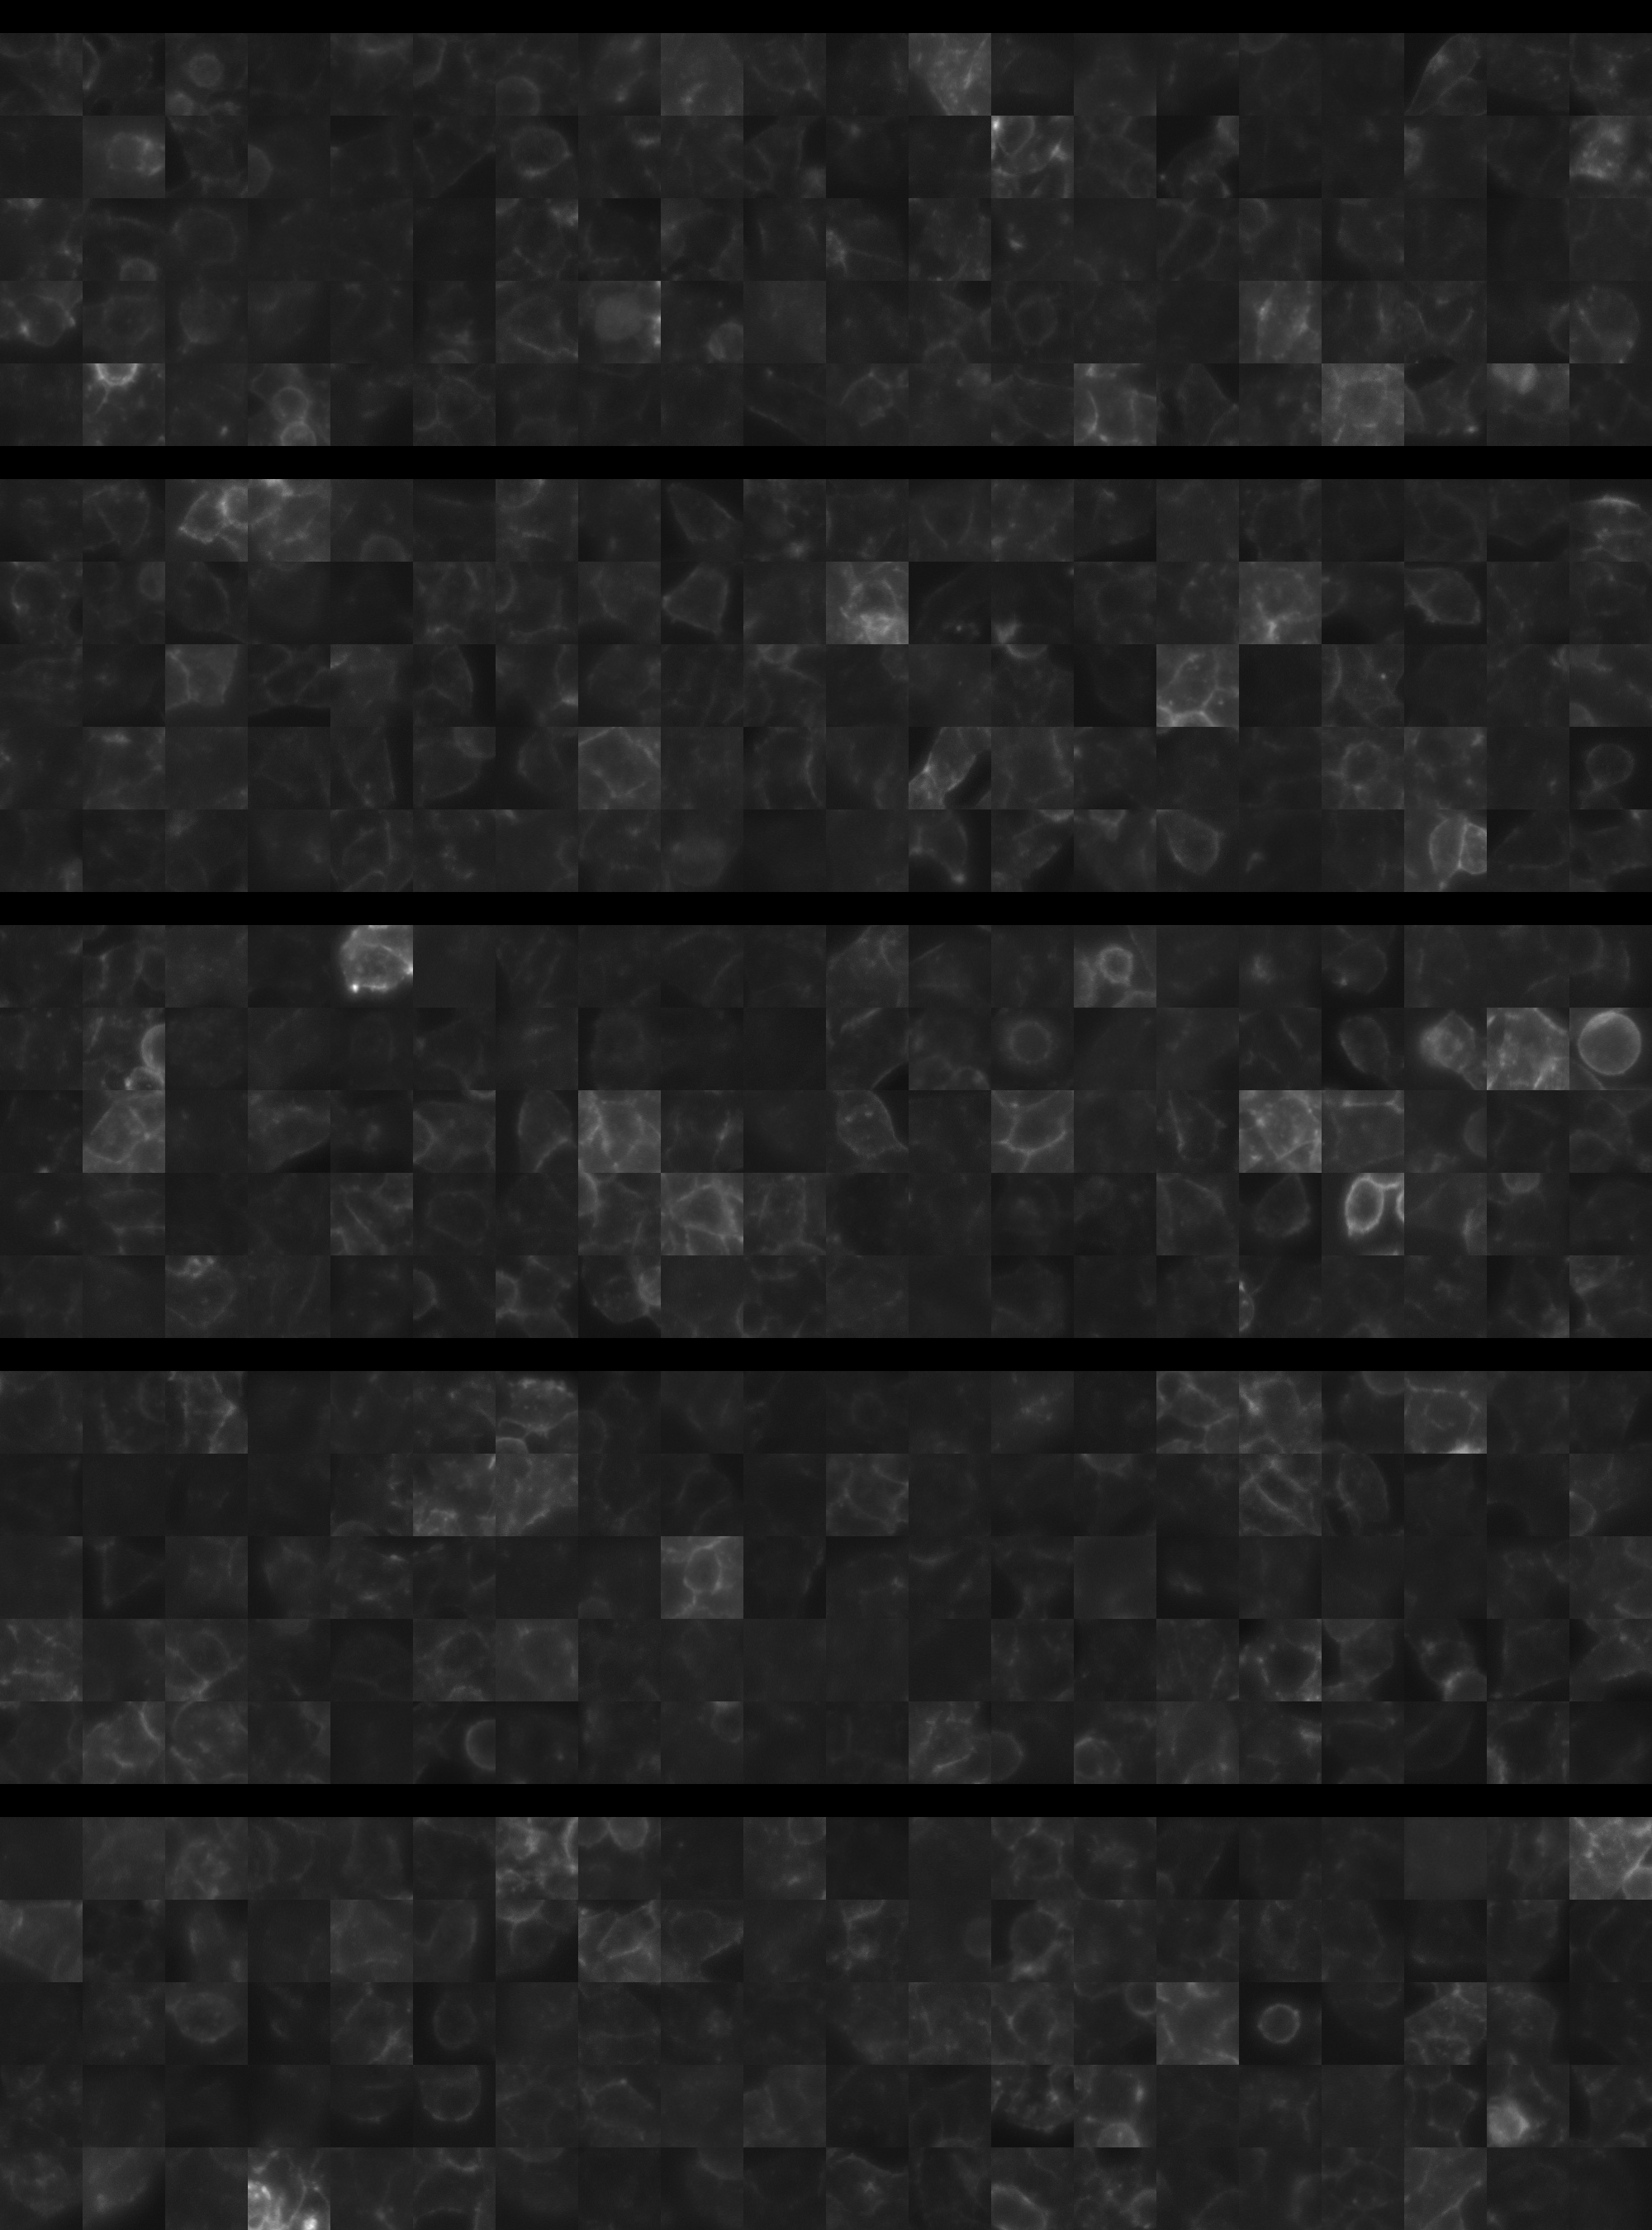
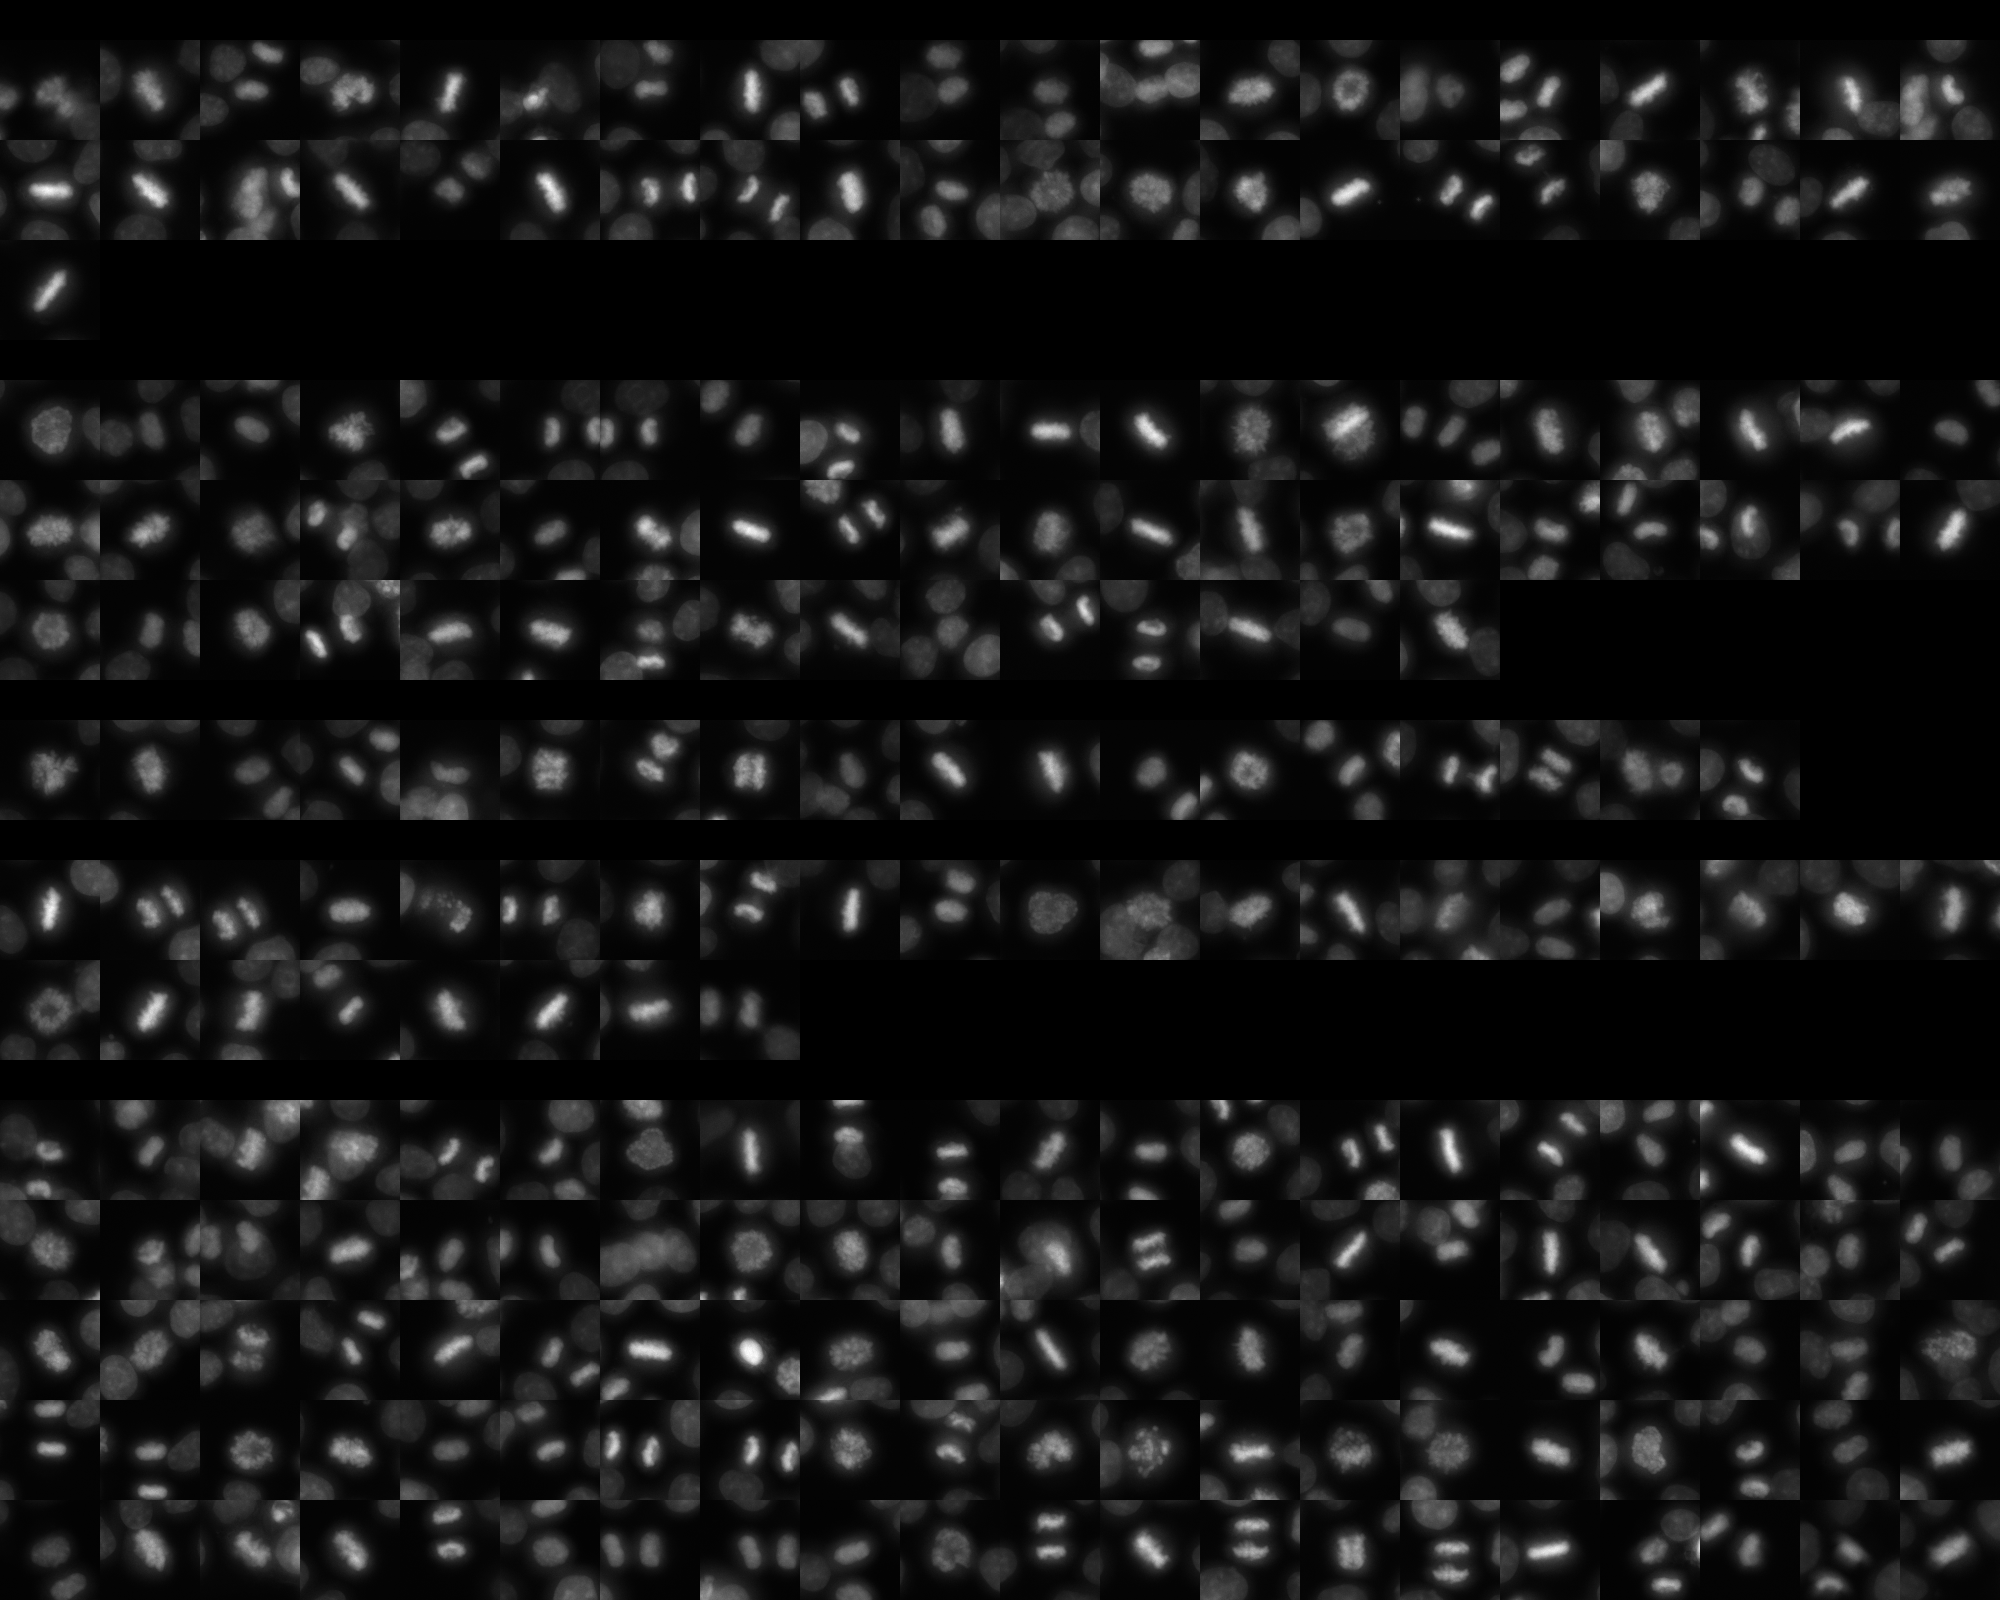
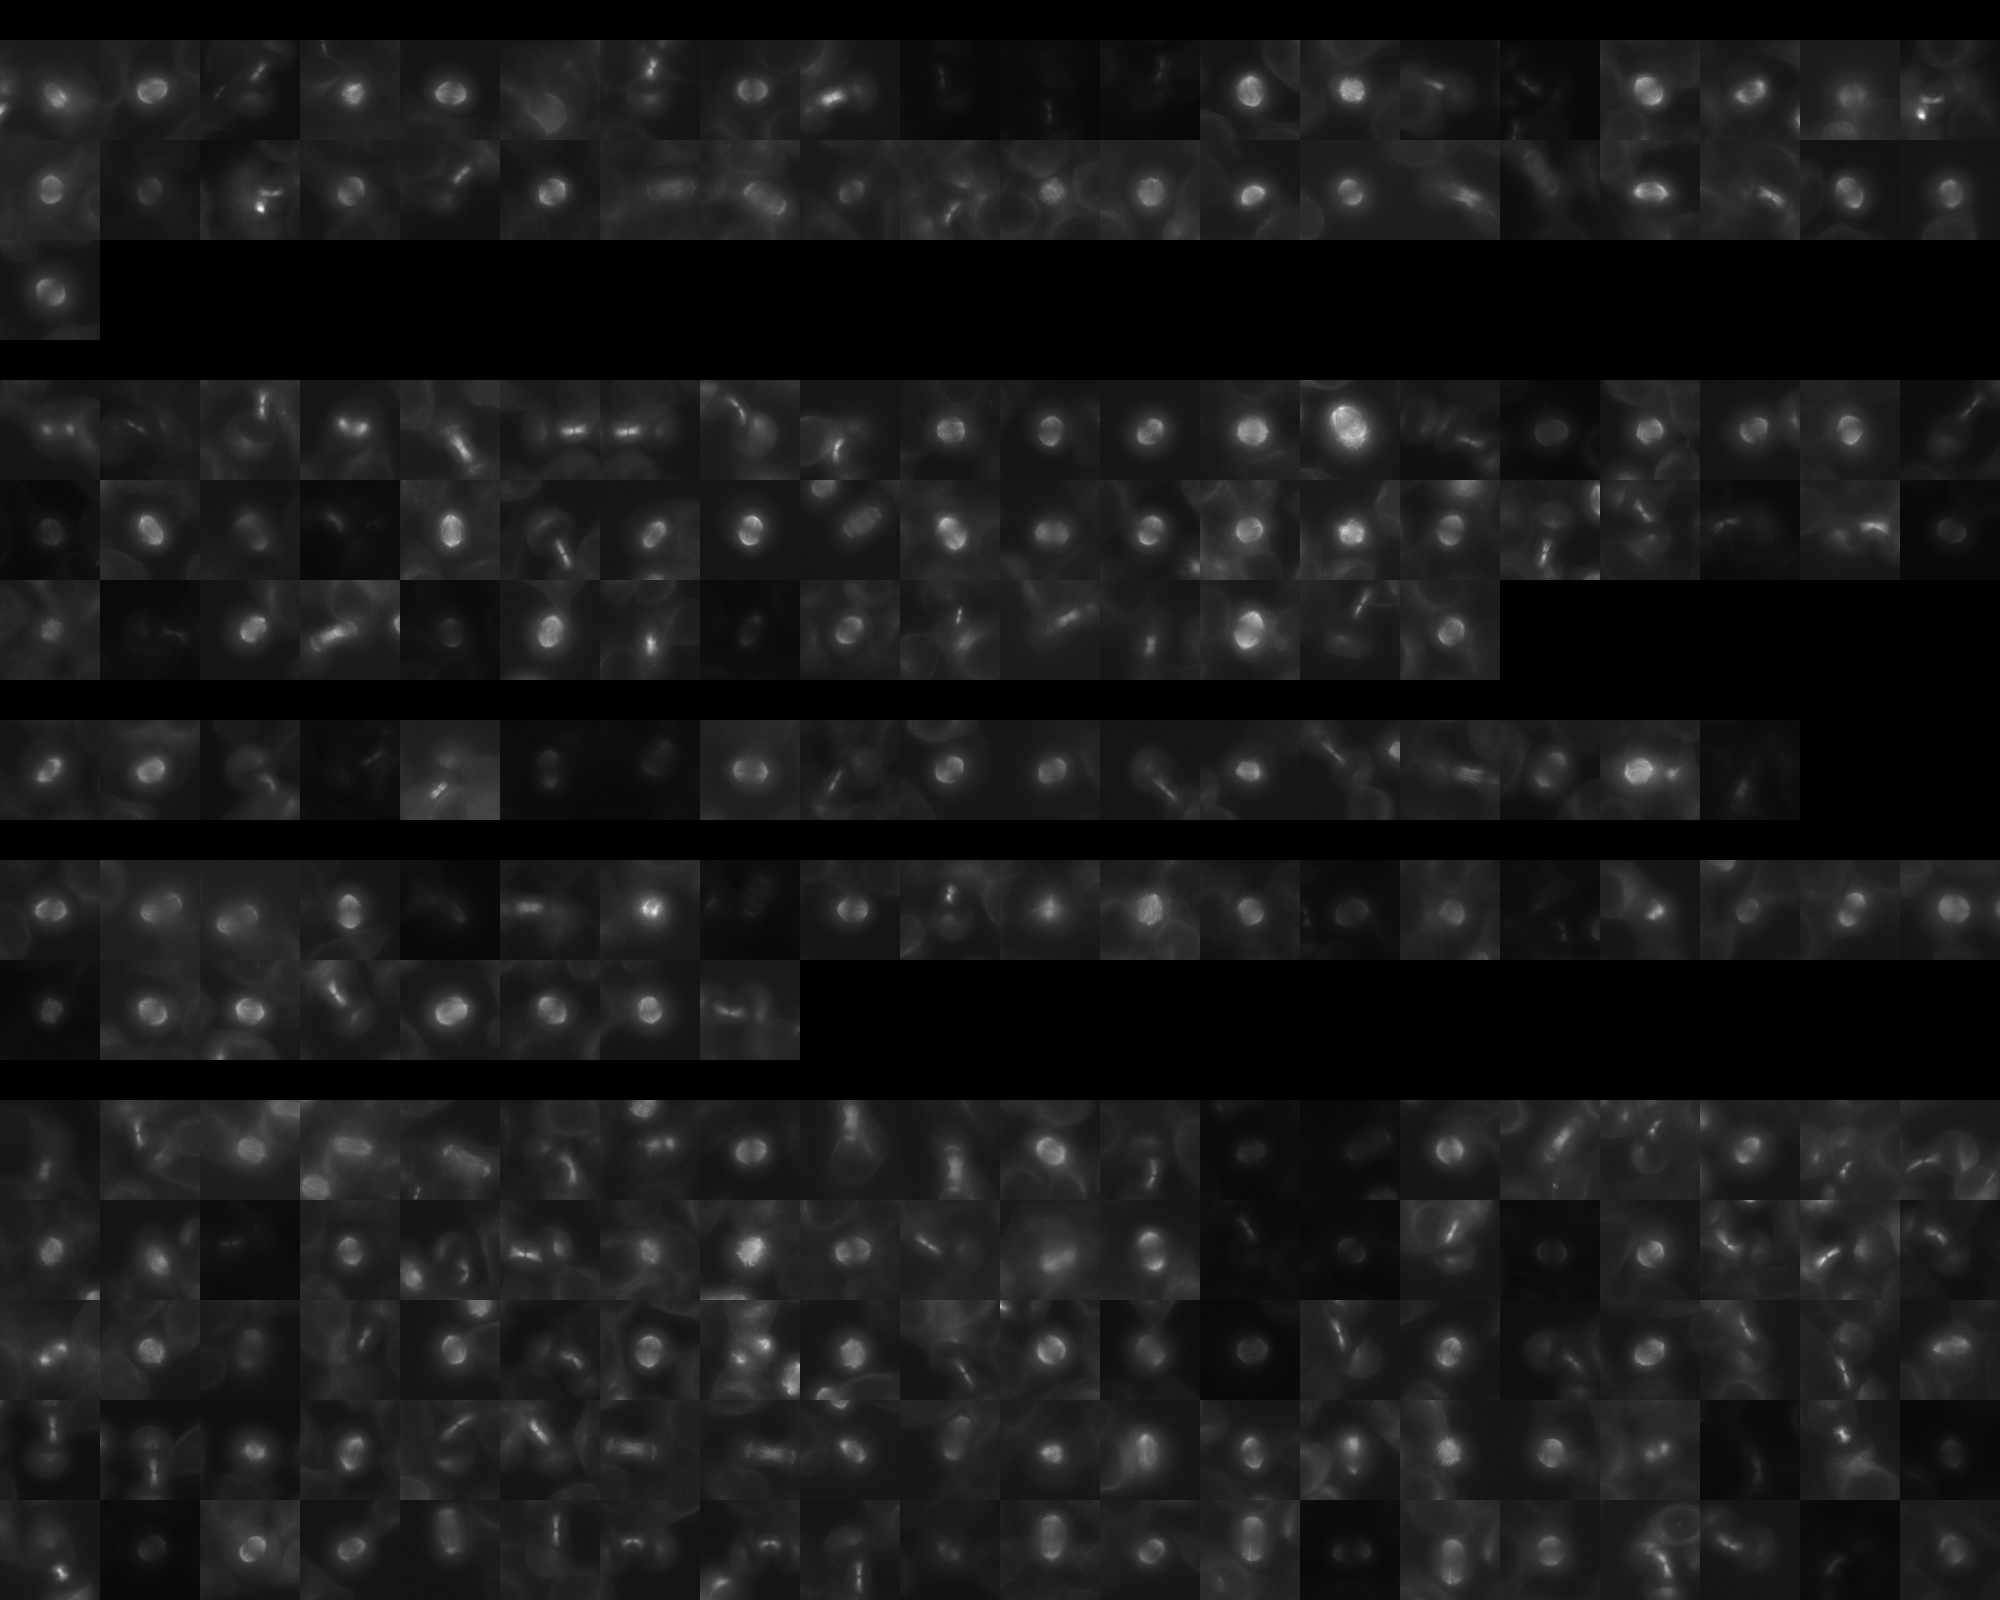
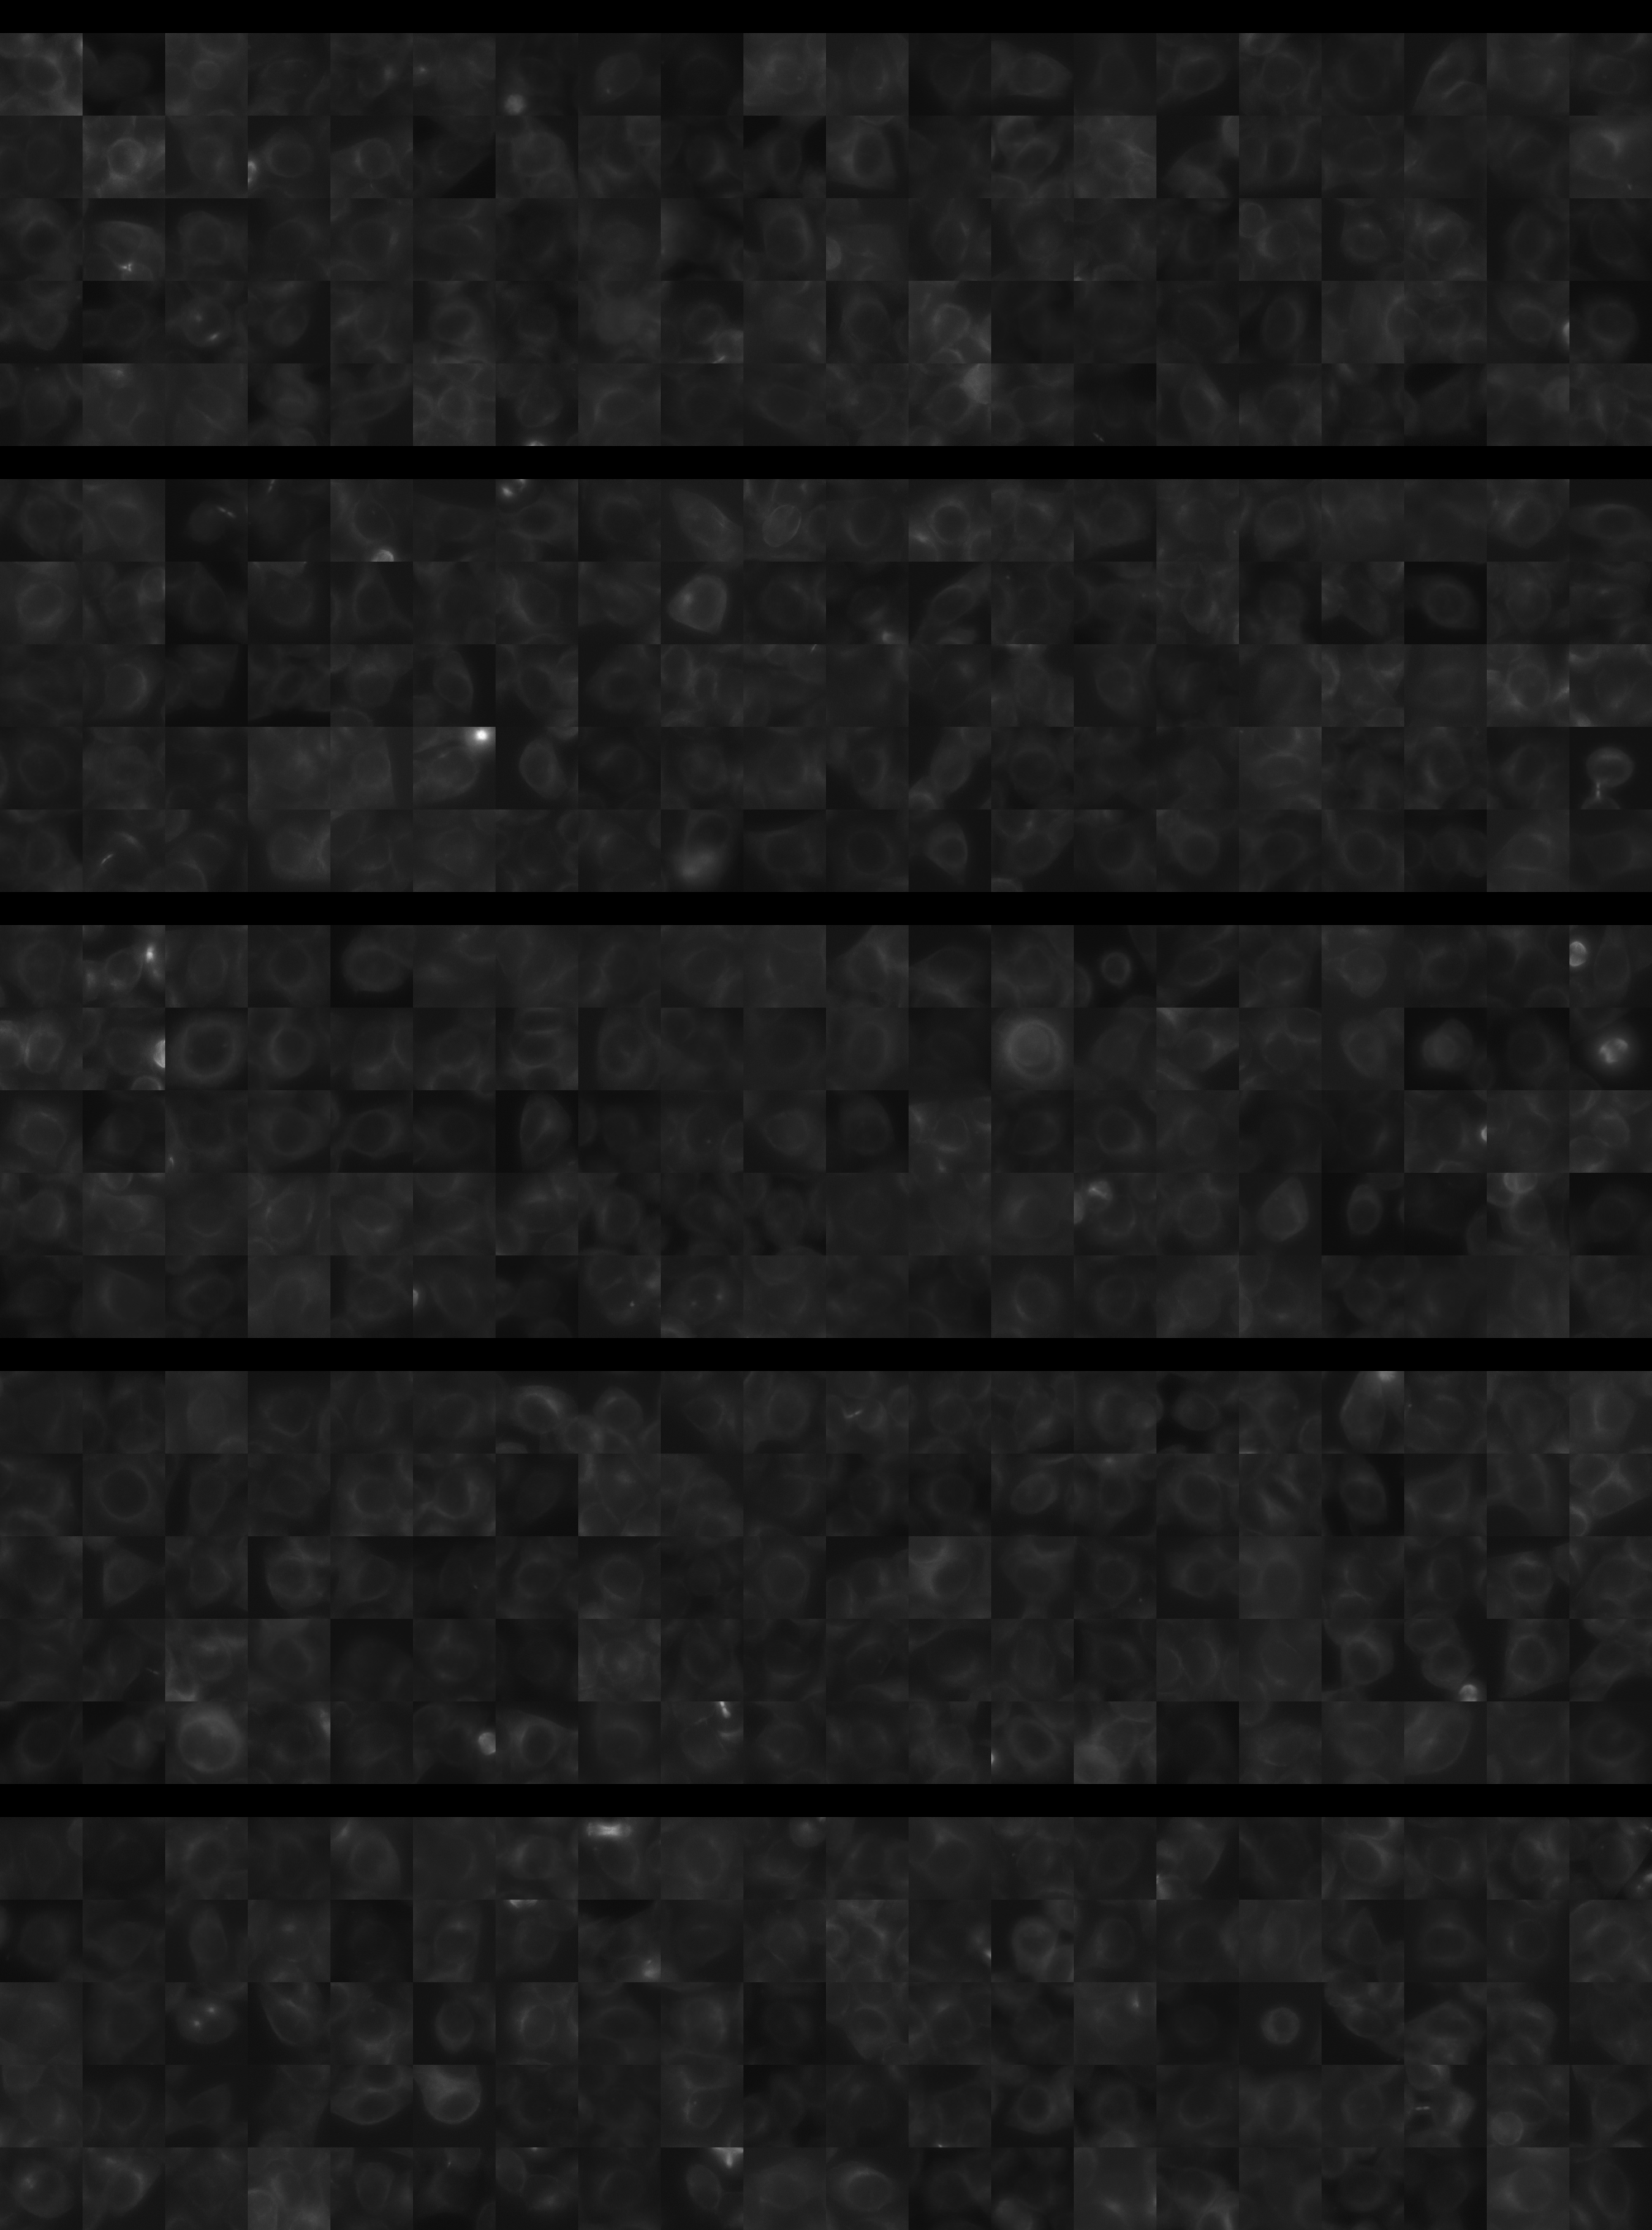
Each montage below shows randomly selected individual cell images for the same target gene separated by sgRNA, along with an example montage of cells expressing a non-targeting negative control sgRNA at the bottom. sgRNA labels in the montages correspond to the numbered sgRNA sequences in the gene info table above. The DNA (blue) and tubulin (green) channels are displayed by default, with gH2AX (grayscale) and actin (yellow) available using the check boxes. Channel brightness, contrast, and opacity are adjustable by clicking the arrow next to the channel name. When only one channel is selected, the display defaults to grayscale. Click the “Zoom” checkbox above the channel controls to enable image zooming (via scrolling) and panning (via click-and-drag).

The cell boxes displayed for this gene are square, 30.36 μm per side for the interphase montage and 30.36 μm per side for the mitotic montage.
Features

Interphase Score Rank FDR q-value
Nucleus DNA Integrated 0.003 2951 of 5322 0.998
Nucleus DNA Mean -4.008e-02 3295 of 5322 0.396
Nucleus gH2AX Mean 0.092 2151 of 5322 0.024
Nucleus DNA - gH2AX Correlation -9.843e-02 3944 of 5322 7.527e-04
Nucleus Shape Area 0.042 1921 of 5322 0.533
Nucleus Shape Eccentricity 0.053 861 of 5322 0.168
Nucleus Shape Form Factor -8.767e-03 874 of 5322 0.915
Nucleus Shape Solidity 0.013 370 of 5322 0.684
Cell DNA Mass Displacement -1.003e-02 4806 of 5322 0.845
Cell Tubulin Mean 0.027 1732 of 5322 0.538
Cell Tubulin Mass Displacement 0.025 1523 of 5322 0.676
Cell Actin Mean 0.030 2047 of 5322 0.583
Cell Tubulin - Actin Correlation -1.223e-02 4194 of 5322 0.821
Cell DNA - Tubulin Correlation 0.034 2472 of 5322 0.408
Cell Shape Area 0.004 3124 of 5322 0.956
Cell Shape Eccentricity 0.015 2472 of 5322 0.874
Mitotic Score Rank FDR q-value
Nucleus DNA Integrated 0.133 2018 of 5322 0.957
Nucleus DNA Mean 0.032 2461 of 5322 1.000
Nucleus DNA Mass Displacement -3.424e-02 4011 of 5322 0.999
Nucleus DNA Mean Frac 3 -8.844e-02 4316 of 5322 1.000
Nucleus gH2AX Mean 0.127 1325 of 5322 1.000
Nucleus gH2AX Mean Frac 0 0.058 1456 of 5322 1.000
Nucleus Tubulin Mean Frac 0 -1.402e-01 4938 of 5322 0.999
Nucleus Tubulin Mean Edge -6.062e-02 3932 of 5322 0.999
Nucleus Tubulin Std Edge -4.429e-02 3181 of 5322 0.999
Nucleus Shape Area 0.077 2964 of 5322 0.990
Nucleus Shape Eccentricity 0.039 1522 of 5322 1.000
Nucleus Shape Form Factor -1.146e-01 3060 of 5322 0.998
Cell Tubulin Mean -1.059e-01 4613 of 5322 0.997
Cell Tubulin Mean Frac 3 -4.442e-02 2223 of 5322 0.999
Cell Actin Mean -8.146e-02 4214 of 5322 0.997
Cell Shape Area 0.073 2972 of 5322 0.998
( Reset Zoom )
Brightness
Contrast
Opacity
Brightness
Contrast
Opacity
Brightness
Contrast
Opacity
Brightness
Contrast
Opacity
Brightness
Contrast
Opacity

( Reset Zoom )
Brightness
Contrast
Opacity
Brightness
Contrast
Opacity
Brightness
Contrast
Opacity
Brightness
Contrast
Opacity
Brightness
Contrast
Opacity

MIT Central Accessability