NCKAP1

Gene symbol: NCKAP1
Gene: 10787
Uniprot Function: Part of the WAVE complex that regulates lamellipodia formation. The WAVE complex regulates actin filament reorganization via its interaction with the Arp2/3 complex. Actin remodeling activity is regulated by RAC1. As component of the WAVE1 complex, required for BDNF-NTRK2 endocytic trafficking and signaling from early endosomes.
Mitotic Index 0.0267
Interphase Cluster: #184 (14 genes)
Mitotic Cluster: #18 (40 genes)
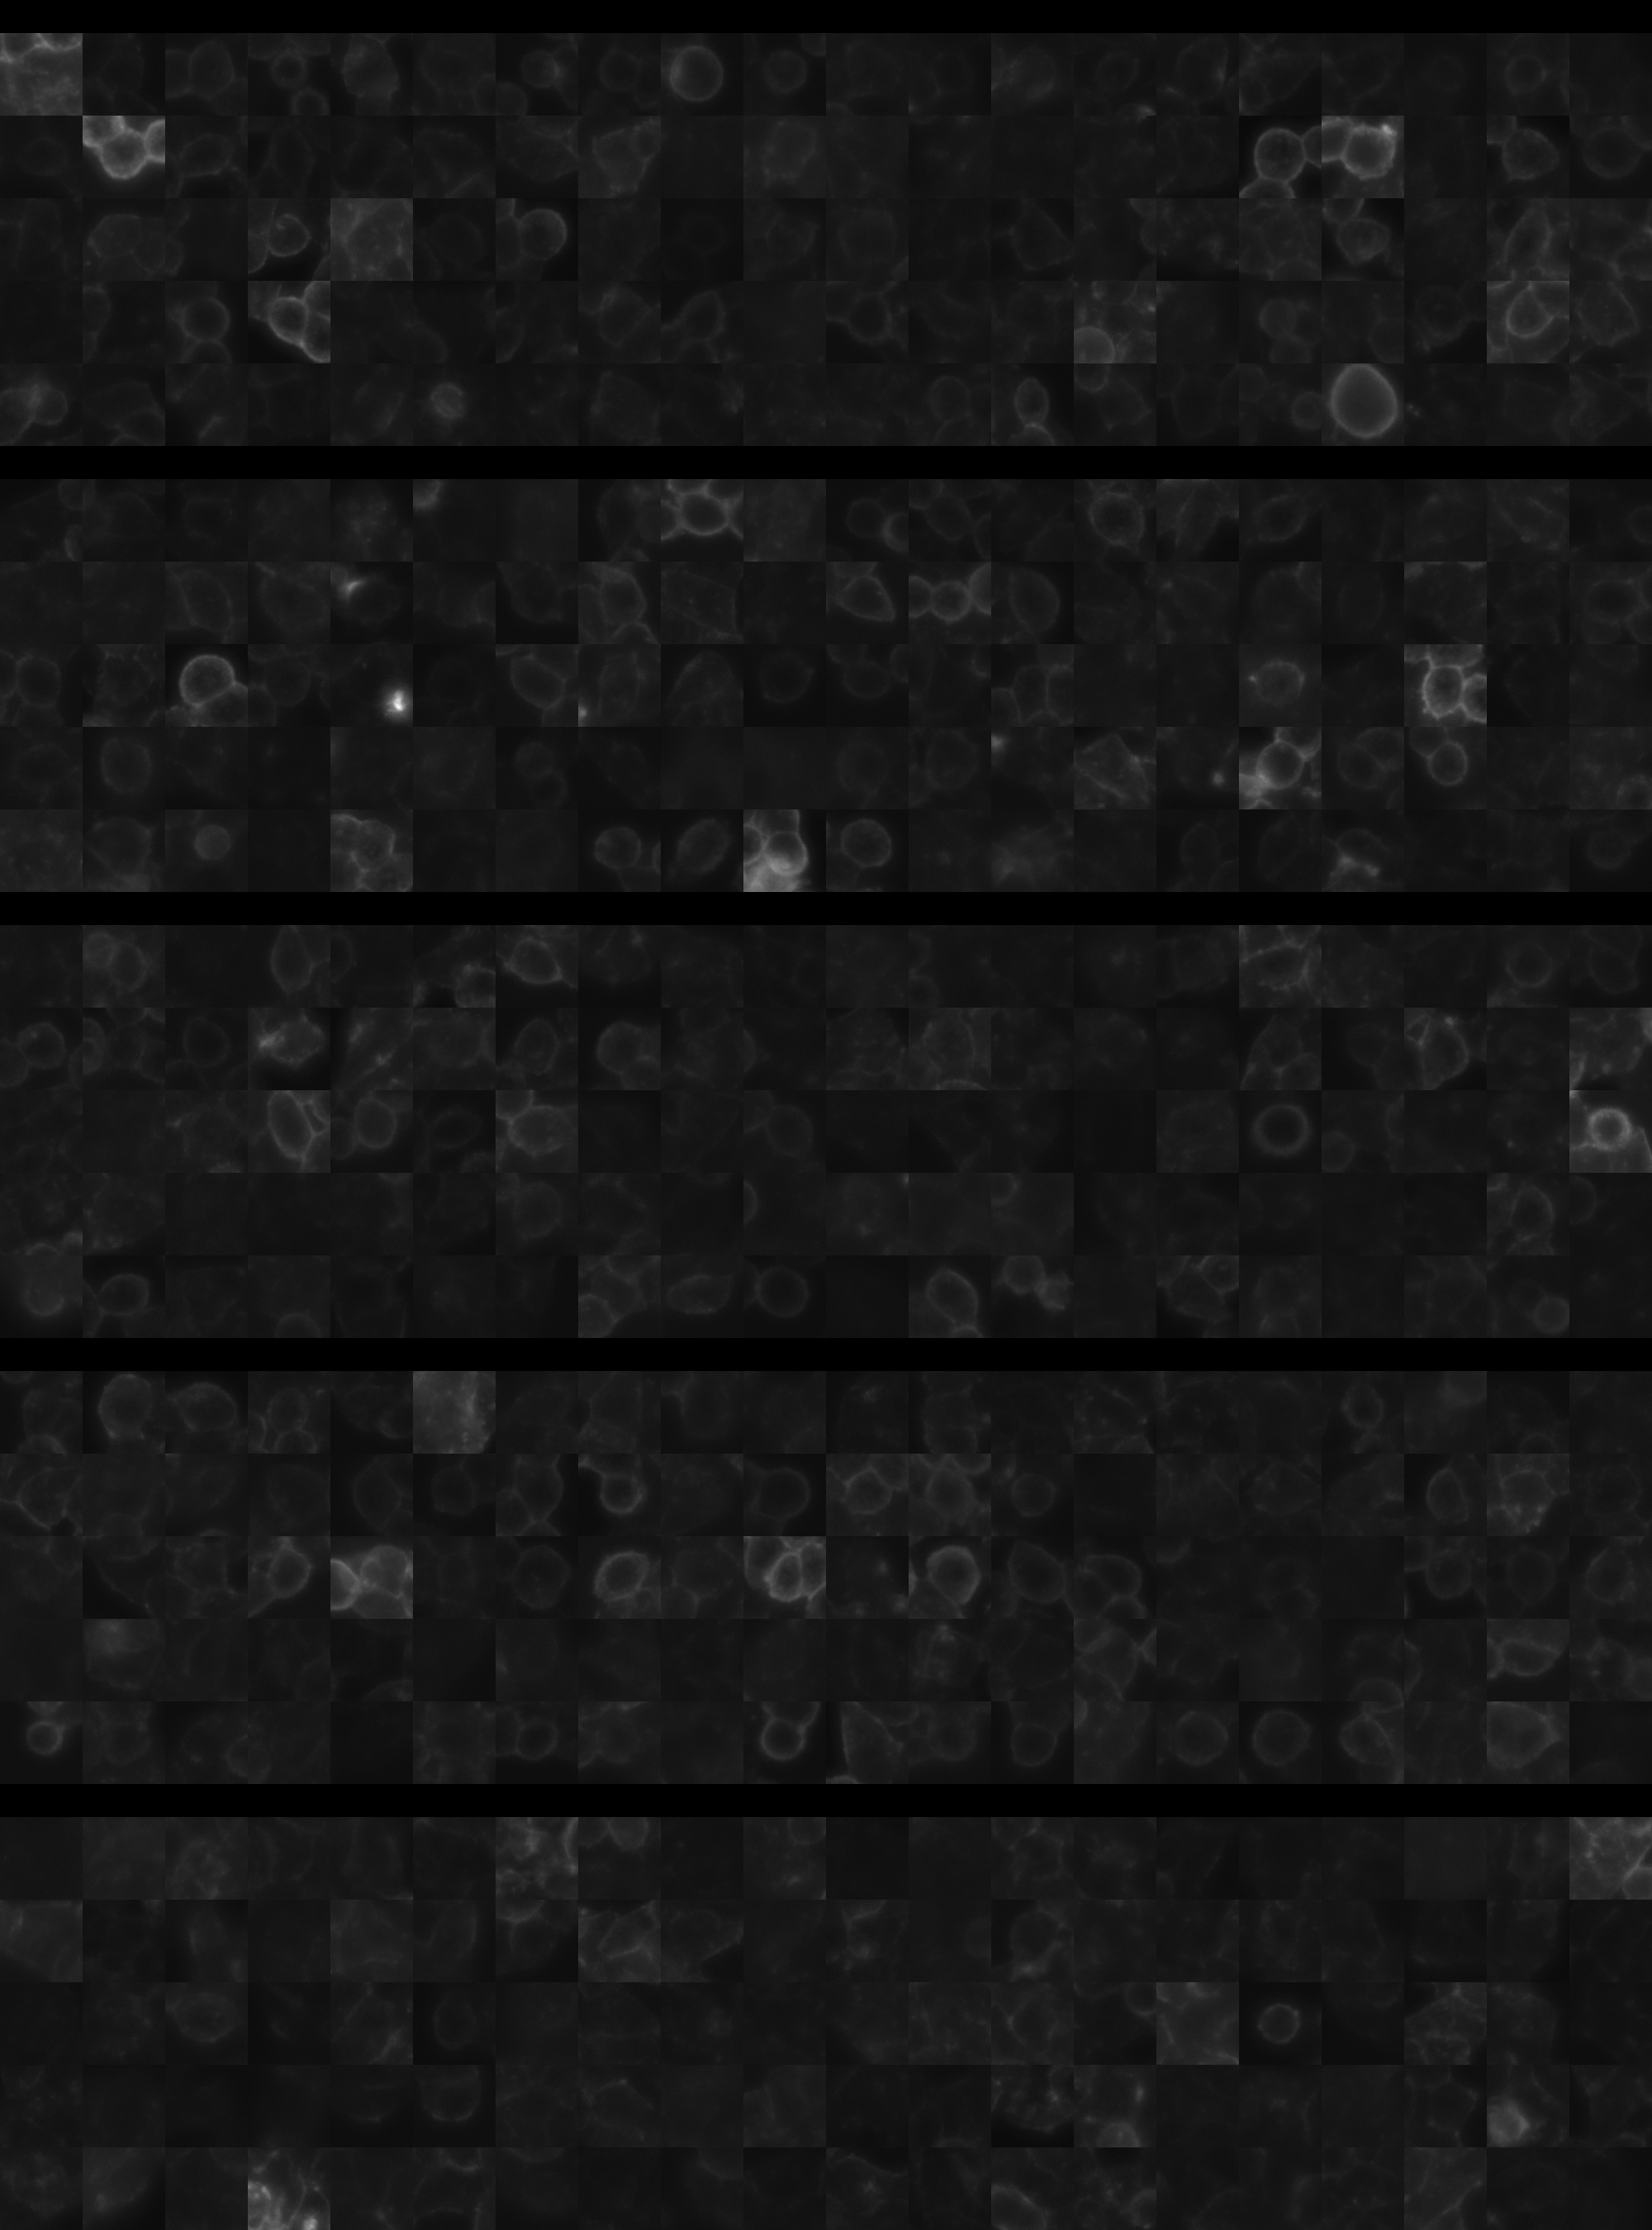
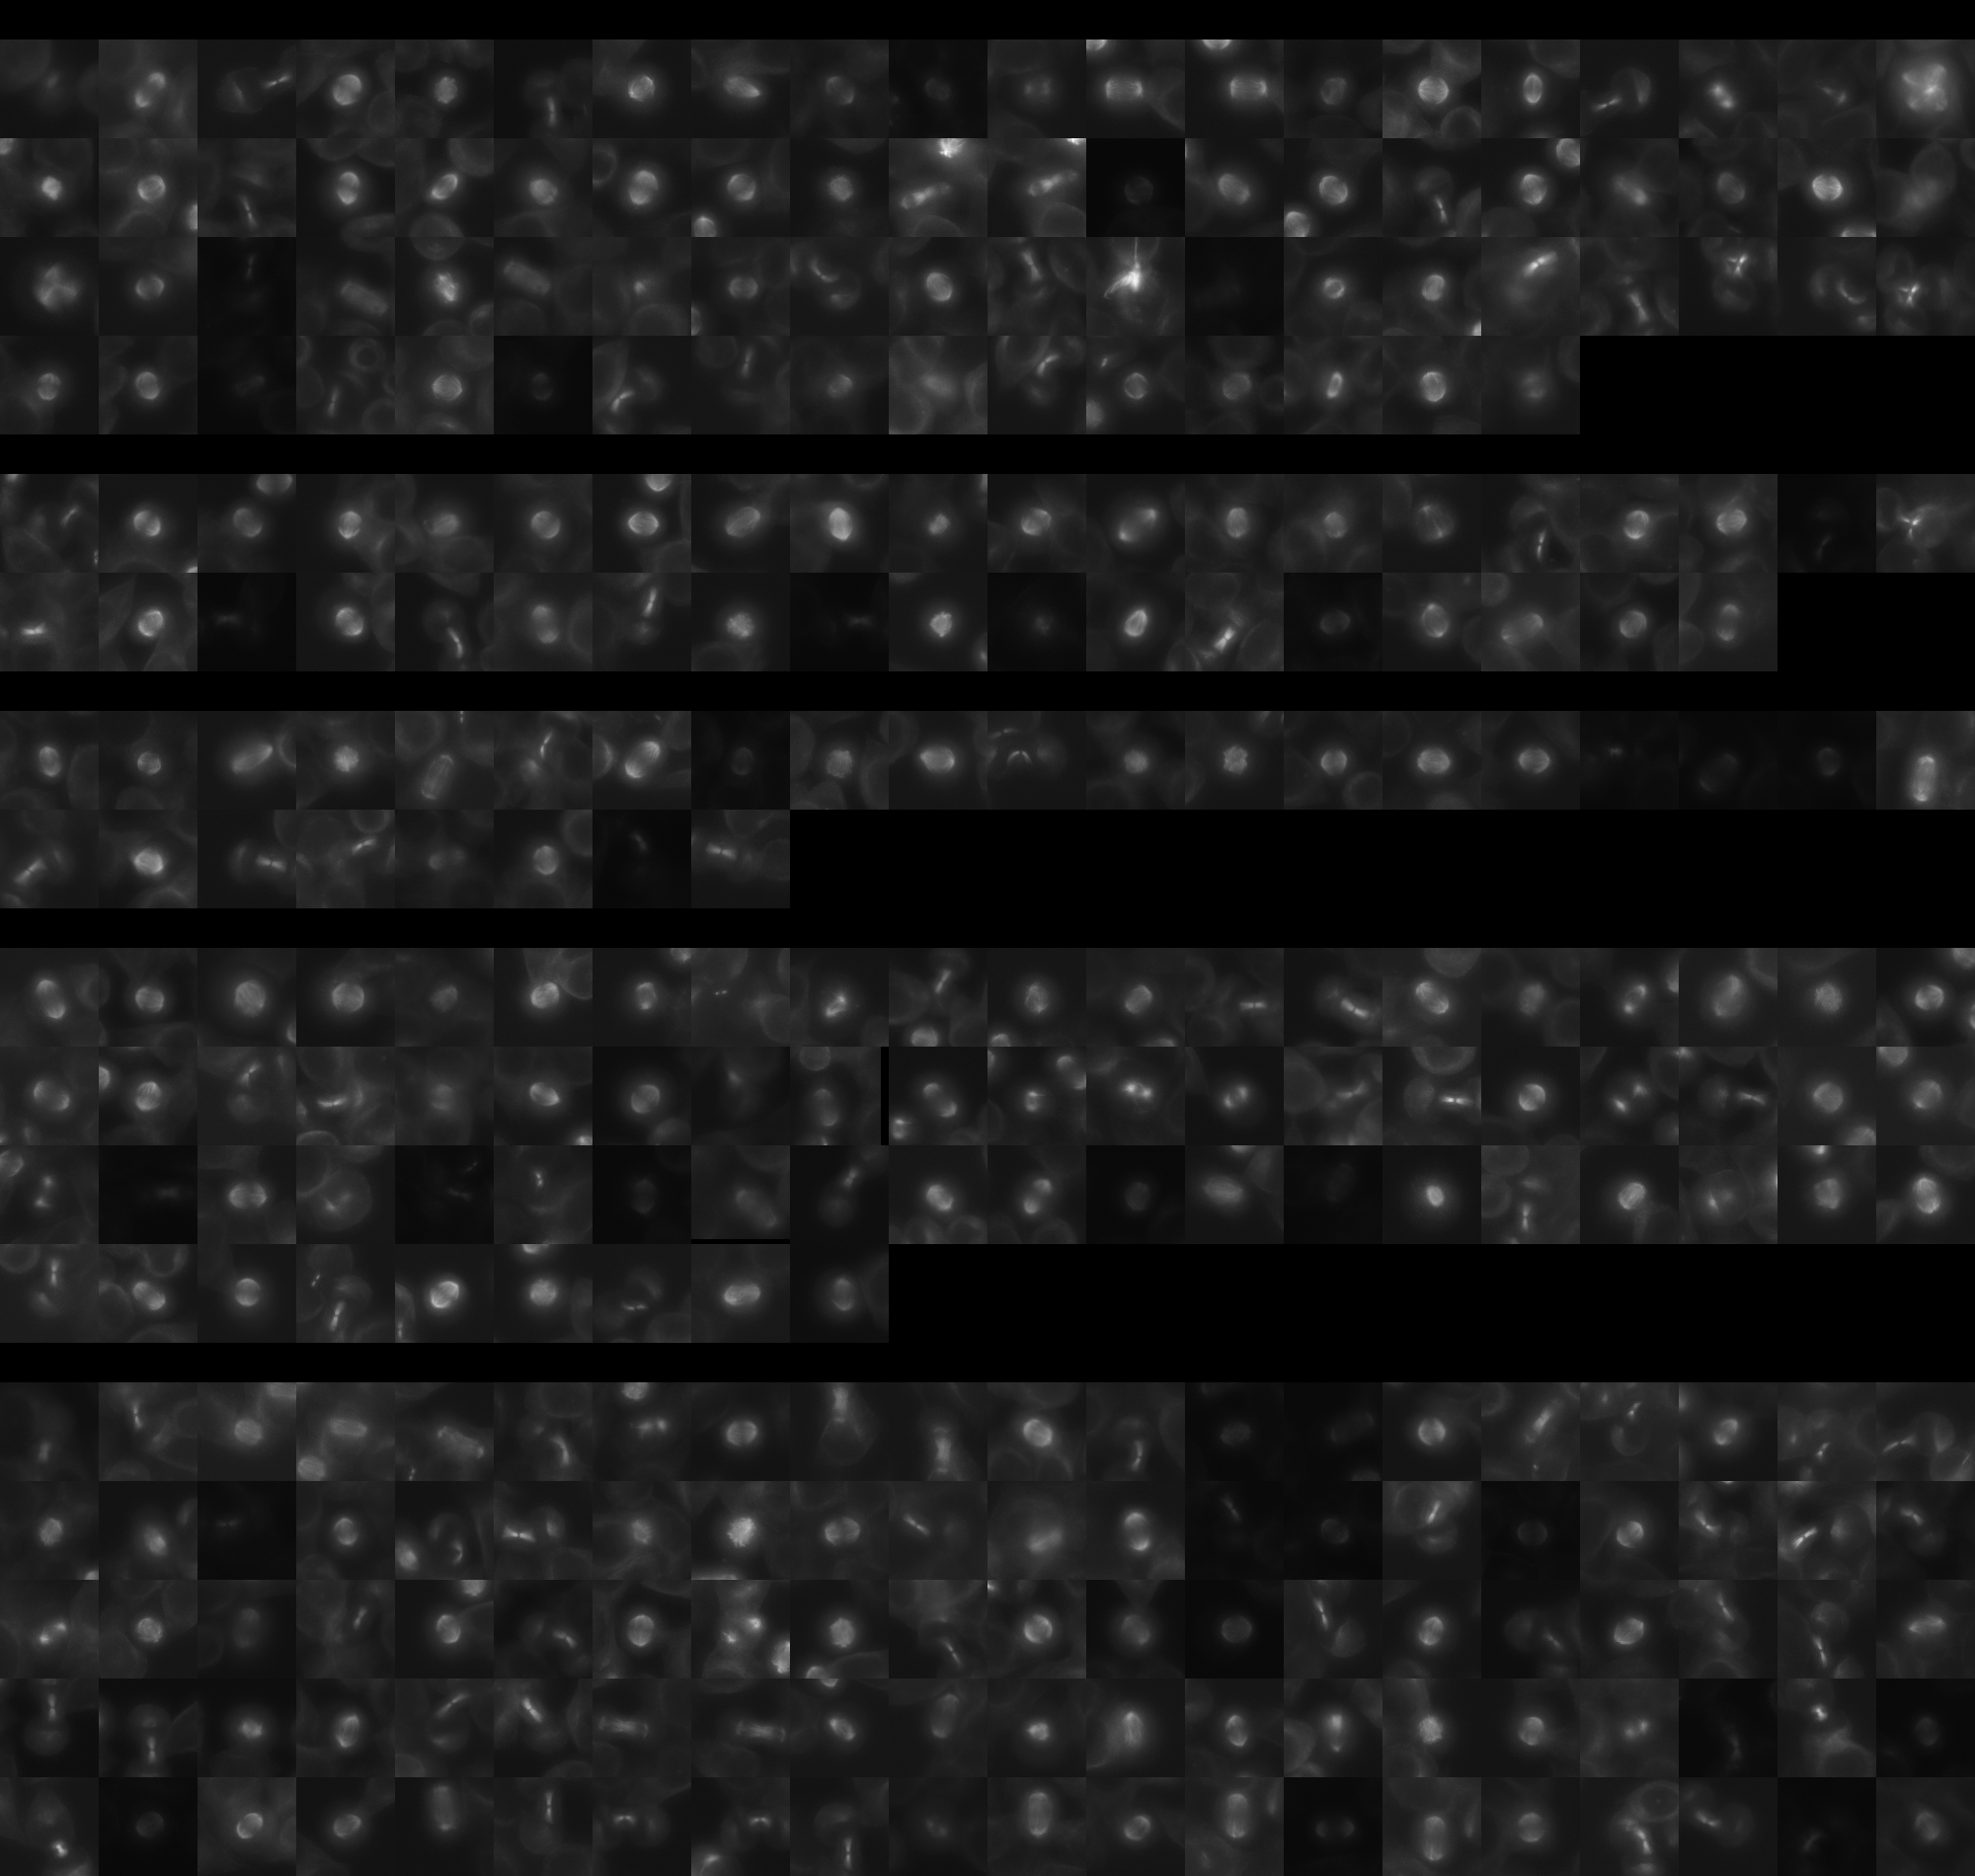
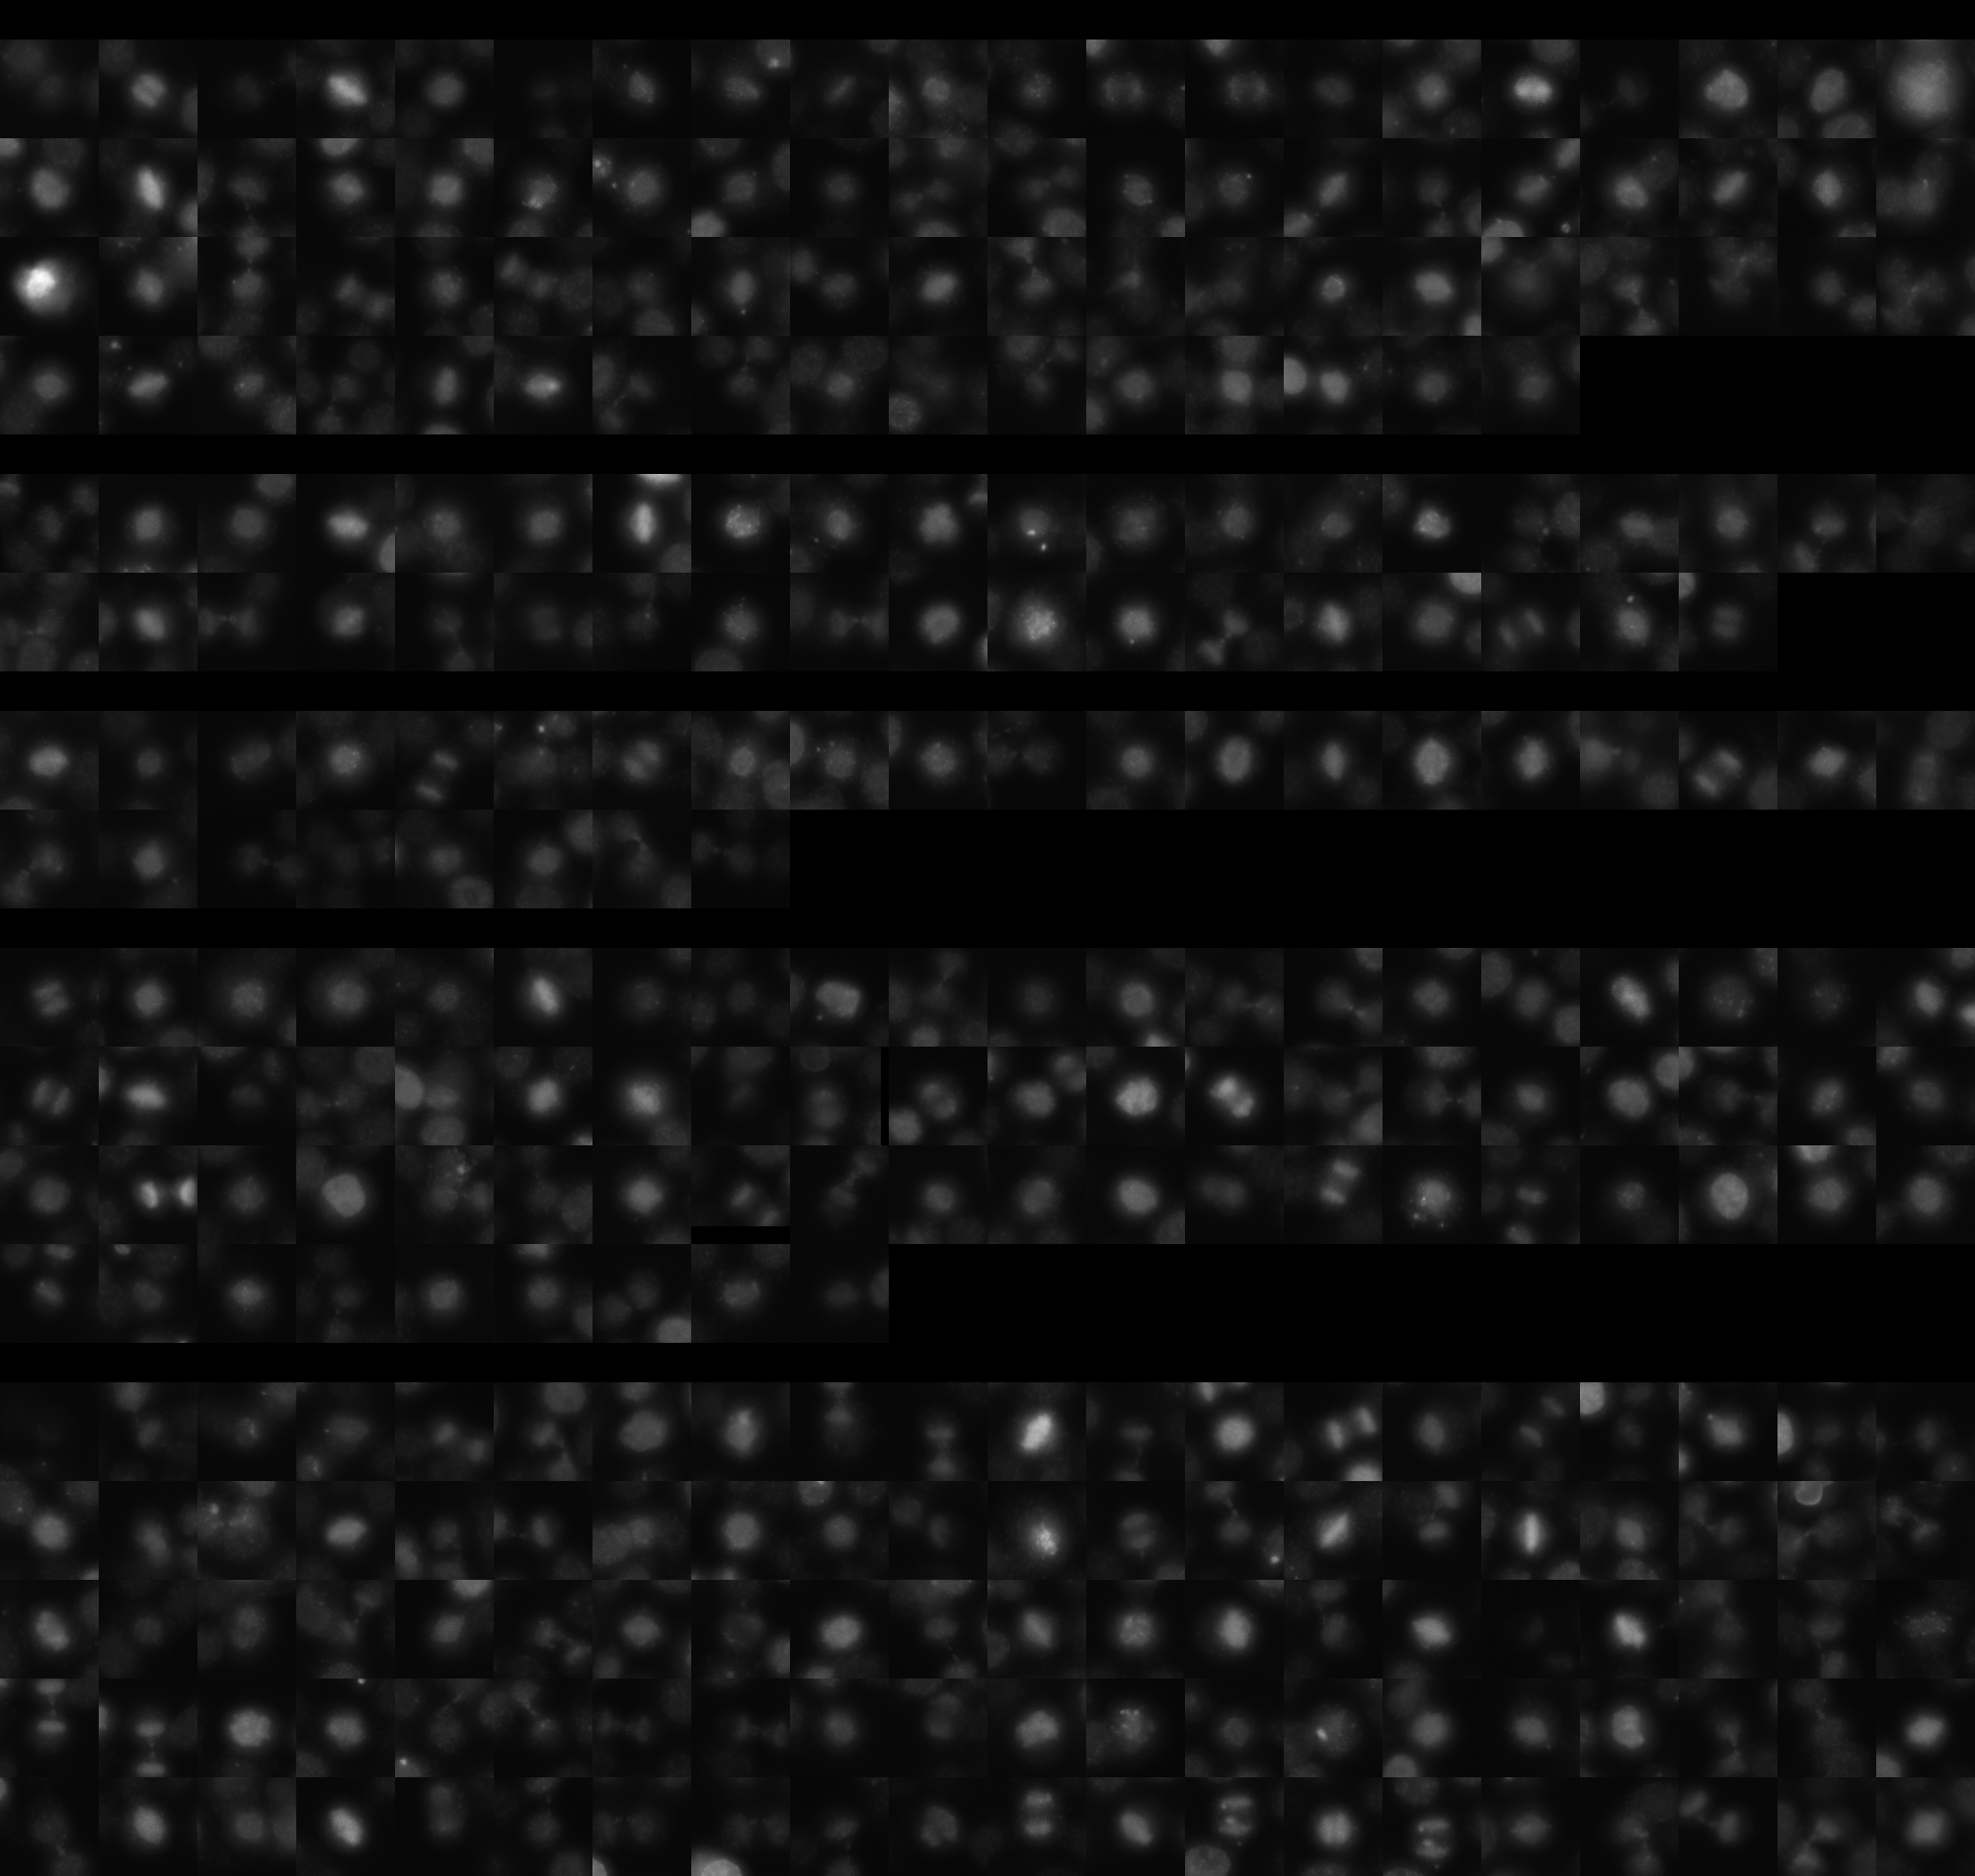
sgRNA 1: AAGAACTTAGAGCACATGTG (interphase cells: 2839, mitotic cells: 76)
sgRNA 2: ACAGTGTACCCTTAGTGACC (interphase cells: 1098, mitotic cells: 38)
sgRNA 3: TATGTATAATCAAGCCACAC (interphase cells: 1177, mitotic cells: 28)
sgRNA 4: TATTCAGCAATTCACAAACA (interphase cells: 2587, mitotic cells: 69)

Interphase Cluster

Mitotic Cluster

Overview

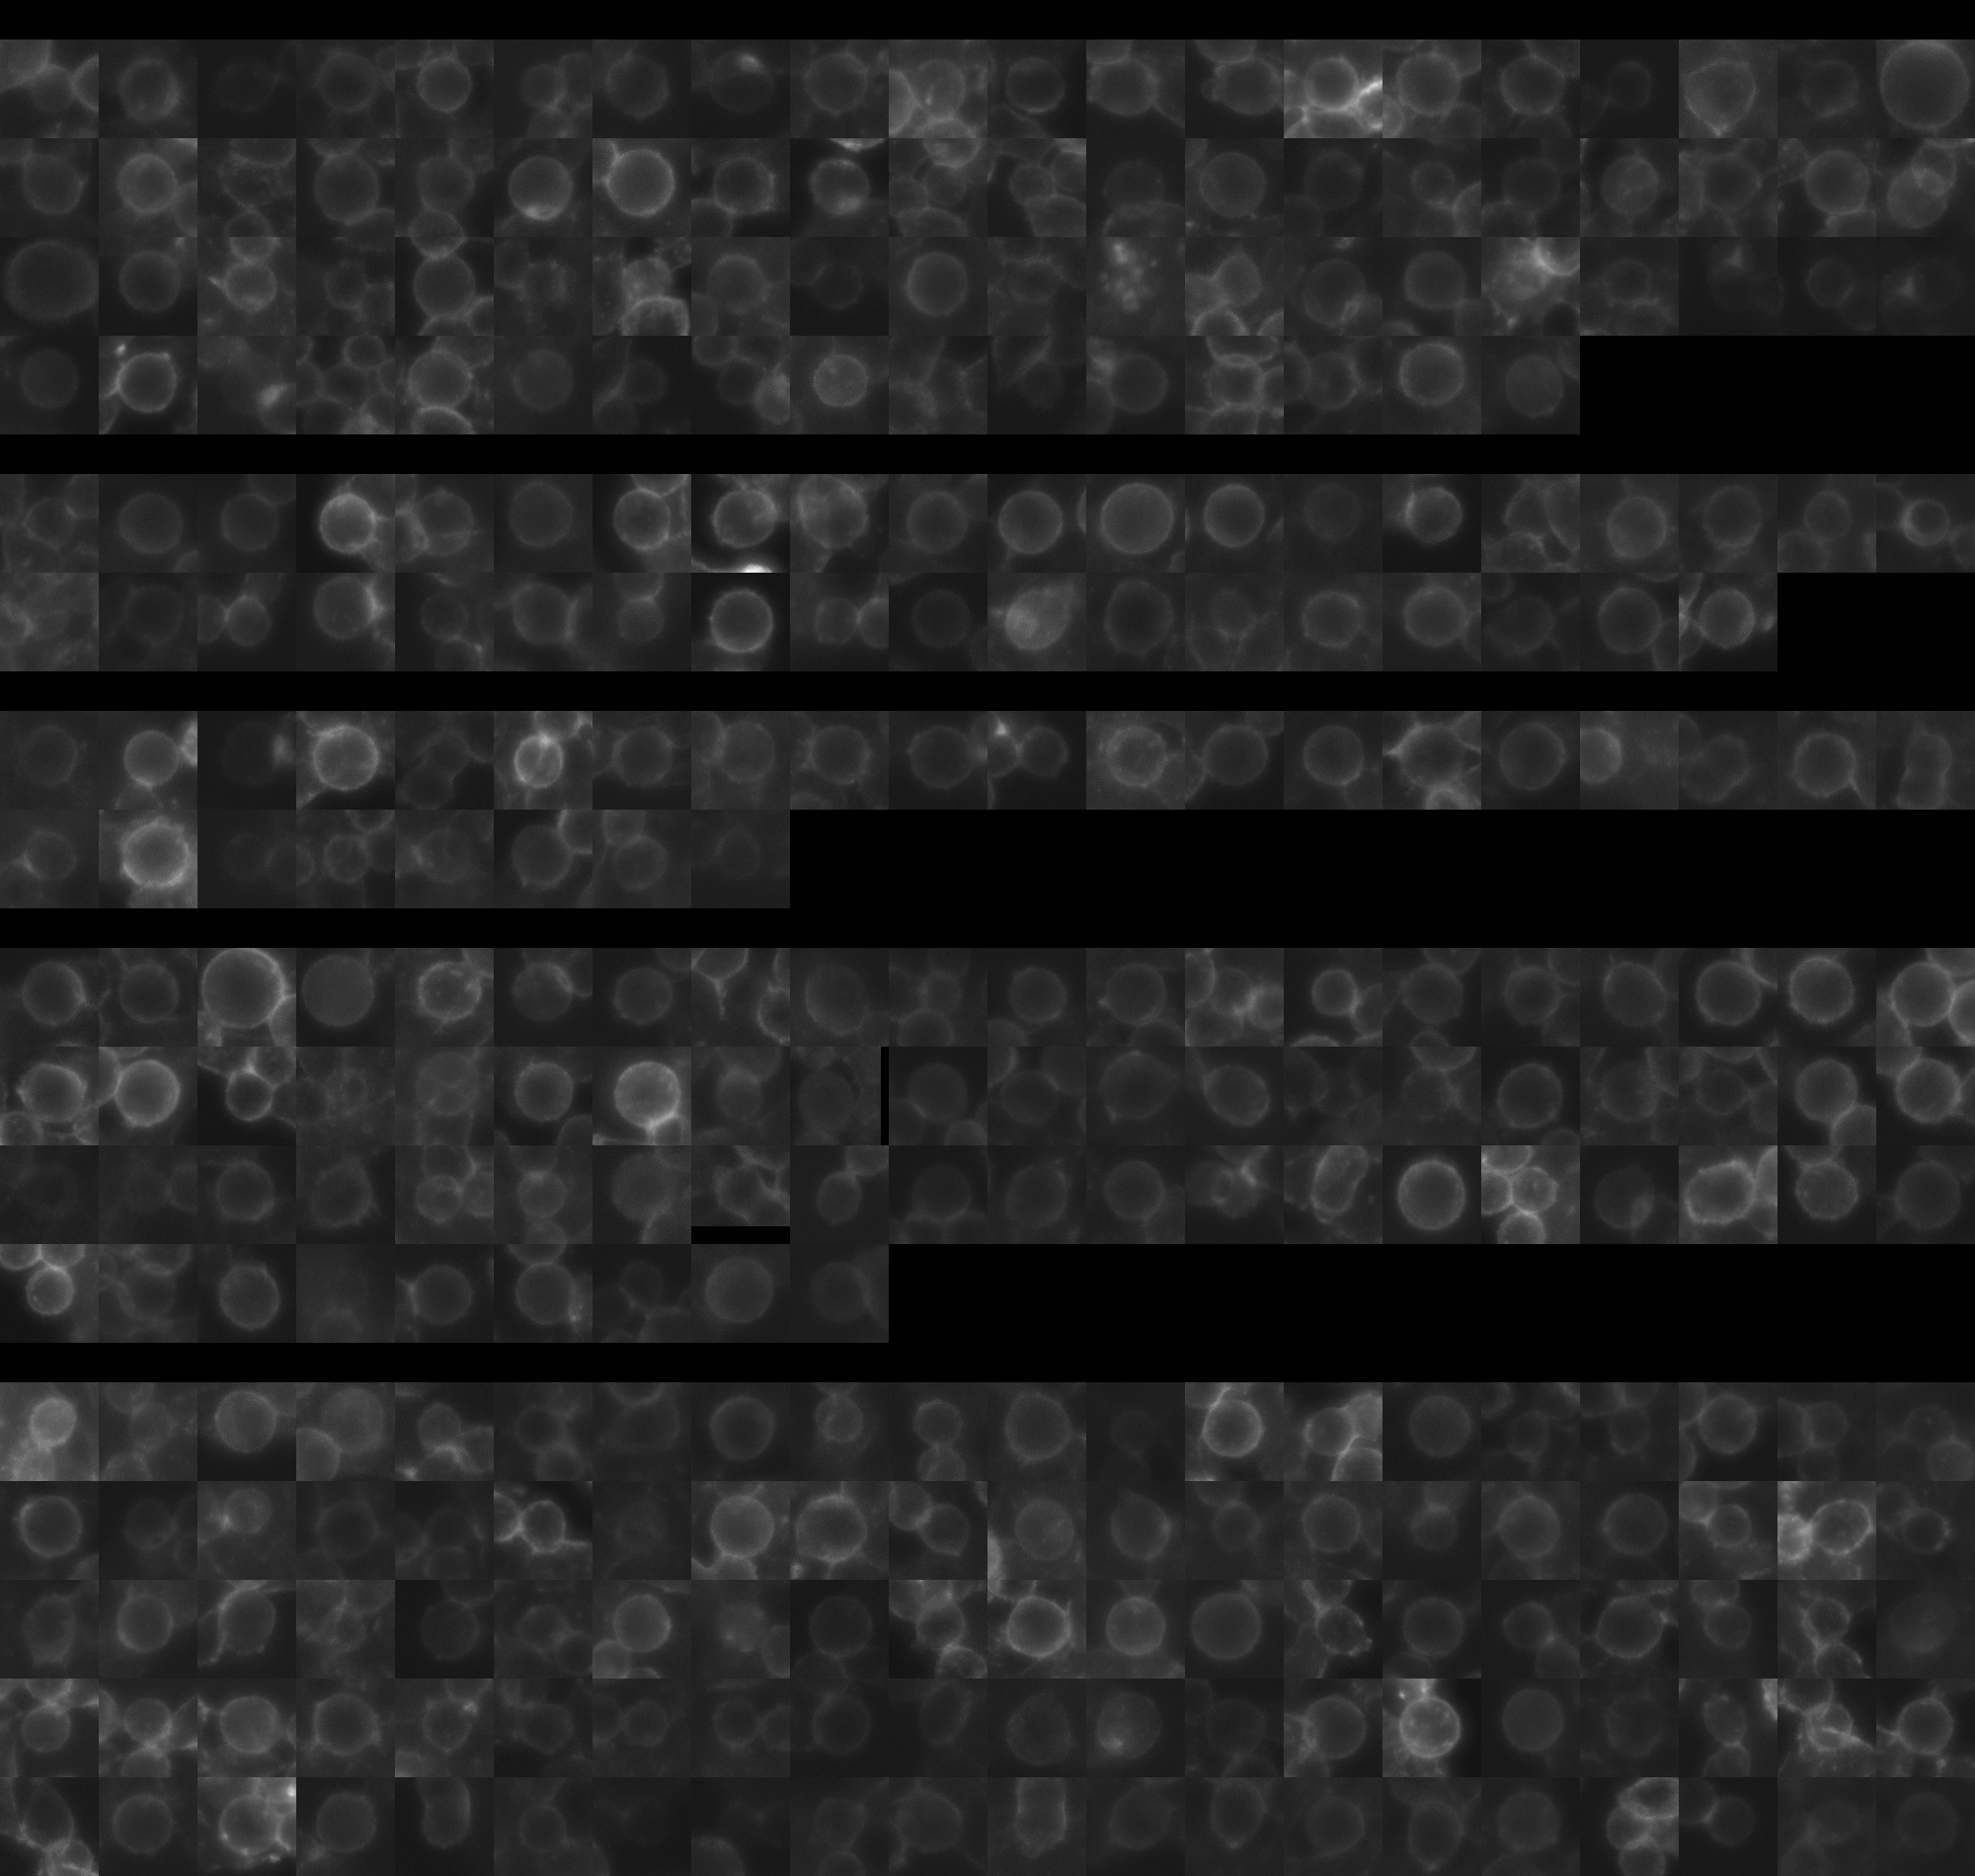
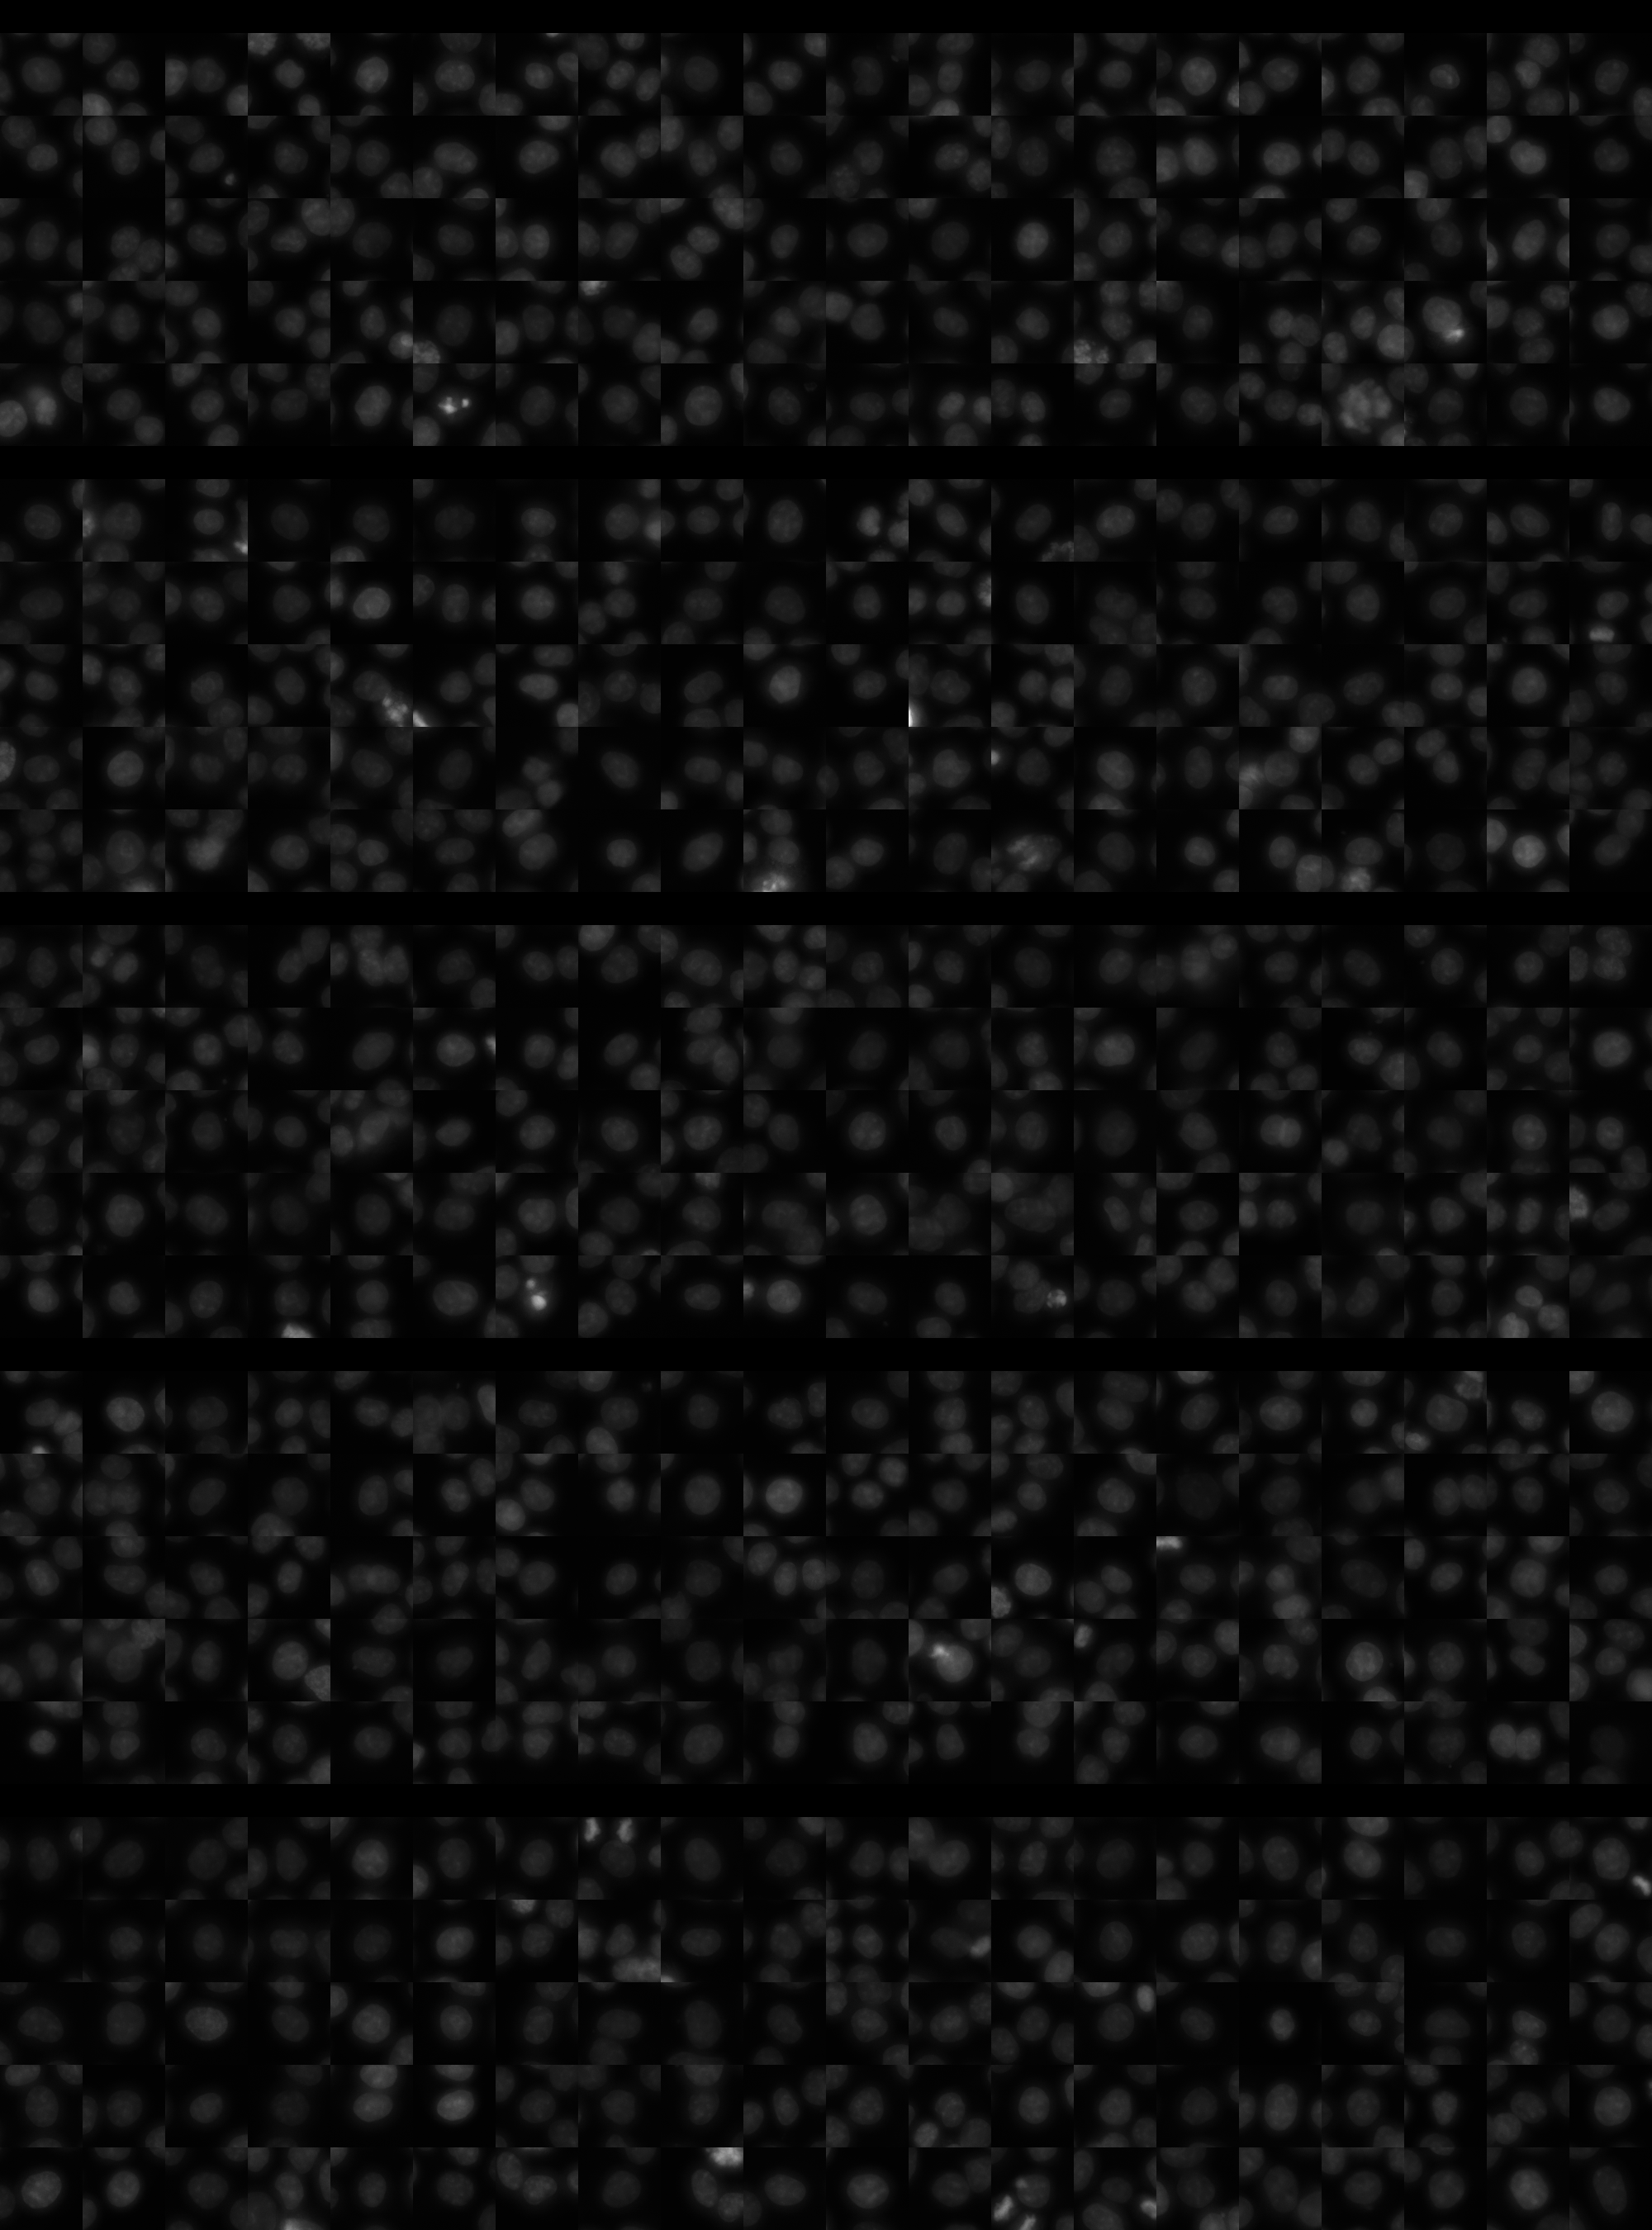
Each montage below shows randomly selected individual cell images for the same target gene separated by sgRNA, along with an example montage of cells expressing a non-targeting negative control sgRNA at the bottom. sgRNA labels in the montages correspond to the numbered sgRNA sequences in the gene info table above. The DNA (blue) and tubulin (green) channels are displayed by default, with gH2AX (grayscale) and actin (yellow) available using the check boxes. Channel brightness, contrast, and opacity are adjustable by clicking the arrow next to the channel name. When only one channel is selected, the display defaults to grayscale. Click the “Zoom” checkbox above the channel controls to enable image zooming (via scrolling) and panning (via click-and-drag).

The cell boxes displayed for this gene are square, 30.36 μm per side for the interphase montage and 30.36 μm per side for the mitotic montage.
Features

Interphase Score Rank FDR q-value
Nucleus DNA Integrated 0.032 1616 of 5322 0.668
Nucleus DNA Mean 0.531 113 of 5322 1.505e-04
Nucleus gH2AX Mean 0.574 70 of 5322 1.367e-04
Nucleus DNA - gH2AX Correlation 0.015 685 of 5322 0.696
Nucleus Shape Area -4.975e-01 5229 of 5322 1.633e-04
Nucleus Shape Eccentricity -2.130e-01 5271 of 5322 4.529e-04
Nucleus Shape Form Factor 0.137 8 of 5322 2.872e-04
Nucleus Shape Solidity -1.869e-02 1265 of 5322 0.608
Cell DNA Mass Displacement -2.433e-03 4486 of 5322 0.943
Cell Tubulin Mean 0.627 17 of 5322 2.141e-04
Cell Tubulin Mass Displacement -1.019e-01 5139 of 5322 0.001
Cell Actin Mean 0.943 19 of 5322 1.723e-04
Cell Tubulin - Actin Correlation 0.283 58 of 5322 2.896e-04
Cell DNA - Tubulin Correlation 0.269 197 of 5322 1.948e-04
Cell Shape Area -4.621e-01 5216 of 5322 1.651e-04
Cell Shape Eccentricity -9.385e-02 5277 of 5322 0.019
Mitotic Score Rank FDR q-value
Nucleus DNA Integrated 0.085 2710 of 5322 0.965
Nucleus DNA Mean 0.076 1784 of 5322 1.000
Nucleus DNA Mass Displacement 0.026 3096 of 5322 0.999
Nucleus DNA Mean Frac 3 0.153 959 of 5322 1.000
Nucleus gH2AX Mean -1.079e-01 4313 of 5322 1.000
Nucleus gH2AX Mean Frac 0 -2.333e-01 4964 of 5322 1.000
Nucleus Tubulin Mean Frac 0 0.055 2666 of 5322 0.999
Nucleus Tubulin Mean Edge -3.843e-02 3684 of 5322 0.999
Nucleus Tubulin Std Edge 0.123 1025 of 5322 0.999
Nucleus Shape Area 0.061 3189 of 5322 0.990
Nucleus Shape Eccentricity -1.963e-01 4509 of 5322 1.000
Nucleus Shape Form Factor 0.110 364 of 5322 0.998
Cell Tubulin Mean 0.246 674 of 5322 0.924
Cell Tubulin Mean Frac 3 -1.963e-01 4031 of 5322 0.999
Cell Actin Mean 0.132 1486 of 5322 0.997
Cell Shape Area -1.638e-02 4095 of 5322 0.998
( Reset Zoom )
Brightness
Contrast
Opacity
Brightness
Contrast
Opacity
Brightness
Contrast
Opacity
Brightness
Contrast
Opacity
Brightness
Contrast
Opacity

( Reset Zoom )
Brightness
Contrast
Opacity
Brightness
Contrast
Opacity
Brightness
Contrast
Opacity
Brightness
Contrast
Opacity
Brightness
Contrast
Opacity

MIT Central Accessability