MYOC

Gene symbol: MYOC
Gene: 4653
Uniprot Function: Secreted glycoprotein regulating the activation of different signaling pathways in adjacent cells to control different processes including cell adhesion, cell-matrix adhesion, cytoskeleton organization and cell migration. Promotes substrate adhesion, spreading and formation of focal contacts. Negatively regulates cell-matrix adhesion and stress fiber assembly through Rho protein signal transduction. Modulates the organization of actin cytoskeleton by stimulating the formation of stress fibers through interactions with components of Wnt signaling pathways. Promotes cell migration through activation of PTK2 and the downstream phosphatidylinositol 3-kinase signaling. Plays a role in bone formation and promotes osteoblast differentiation in a dose-dependent manner through mitogen-activated protein kinase signaling. Mediates myelination in the peripheral nervous system through ERBB2/ERBB3 signaling. Plays a role as a regulator of muscle hypertrophy through the components of dystrophin-associated protein complex. Involved in positive regulation of mitochondrial depolarization. Plays a role in neurite outgrowth. May participate in the obstruction of fluid outflow in the trabecular meshwork.
Mitotic Index 0.0222
Interphase Cluster: #42 (31 genes)
Mitotic Cluster: #18 (40 genes)
sgRNA 1: CCATCTGGCTATCTCAGGAG (interphase cells: 1677, mitotic cells: 40)
sgRNA 2: GTTGACGGTAGCATCTGCTG (interphase cells: 2603, mitotic cells: 52)
sgRNA 3: TAAGTTATGGATGACTGACA (interphase cells: 2365, mitotic cells: 50)
sgRNA 4: TGGCCTCCAGGTCTAAGCGT (interphase cells: 1562, mitotic cells: 44)

Interphase Cluster

Mitotic Cluster

Overview

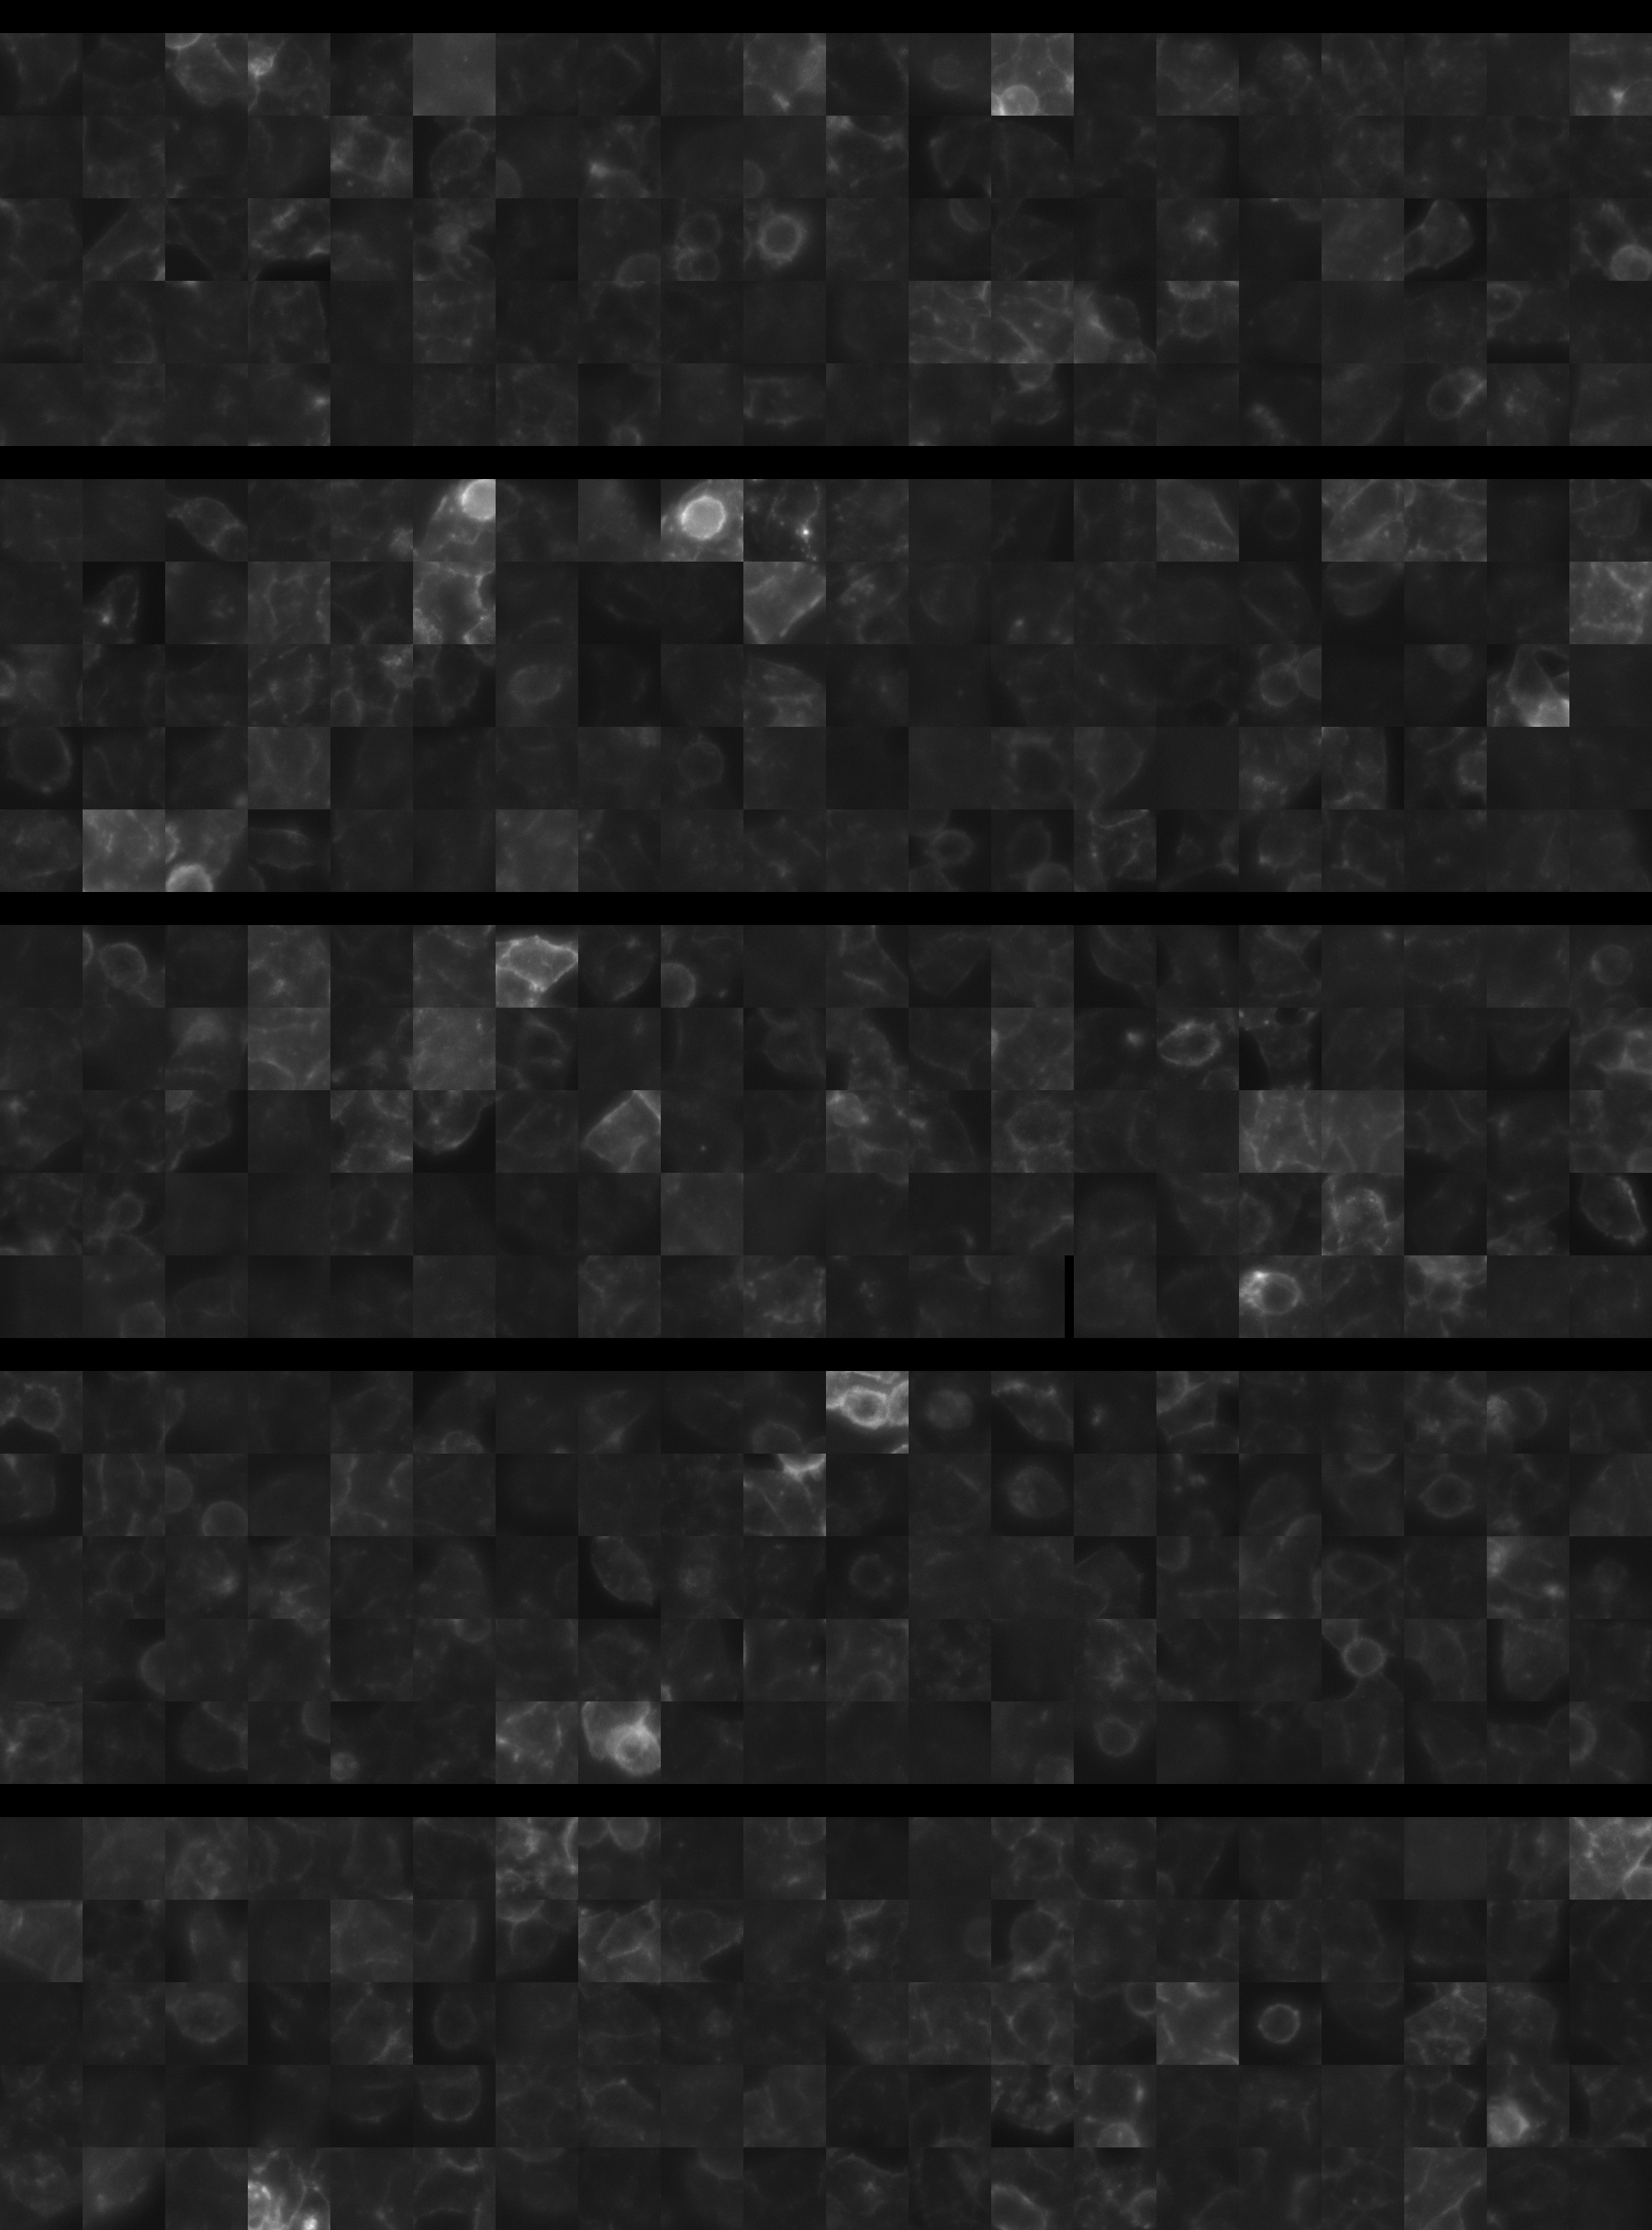
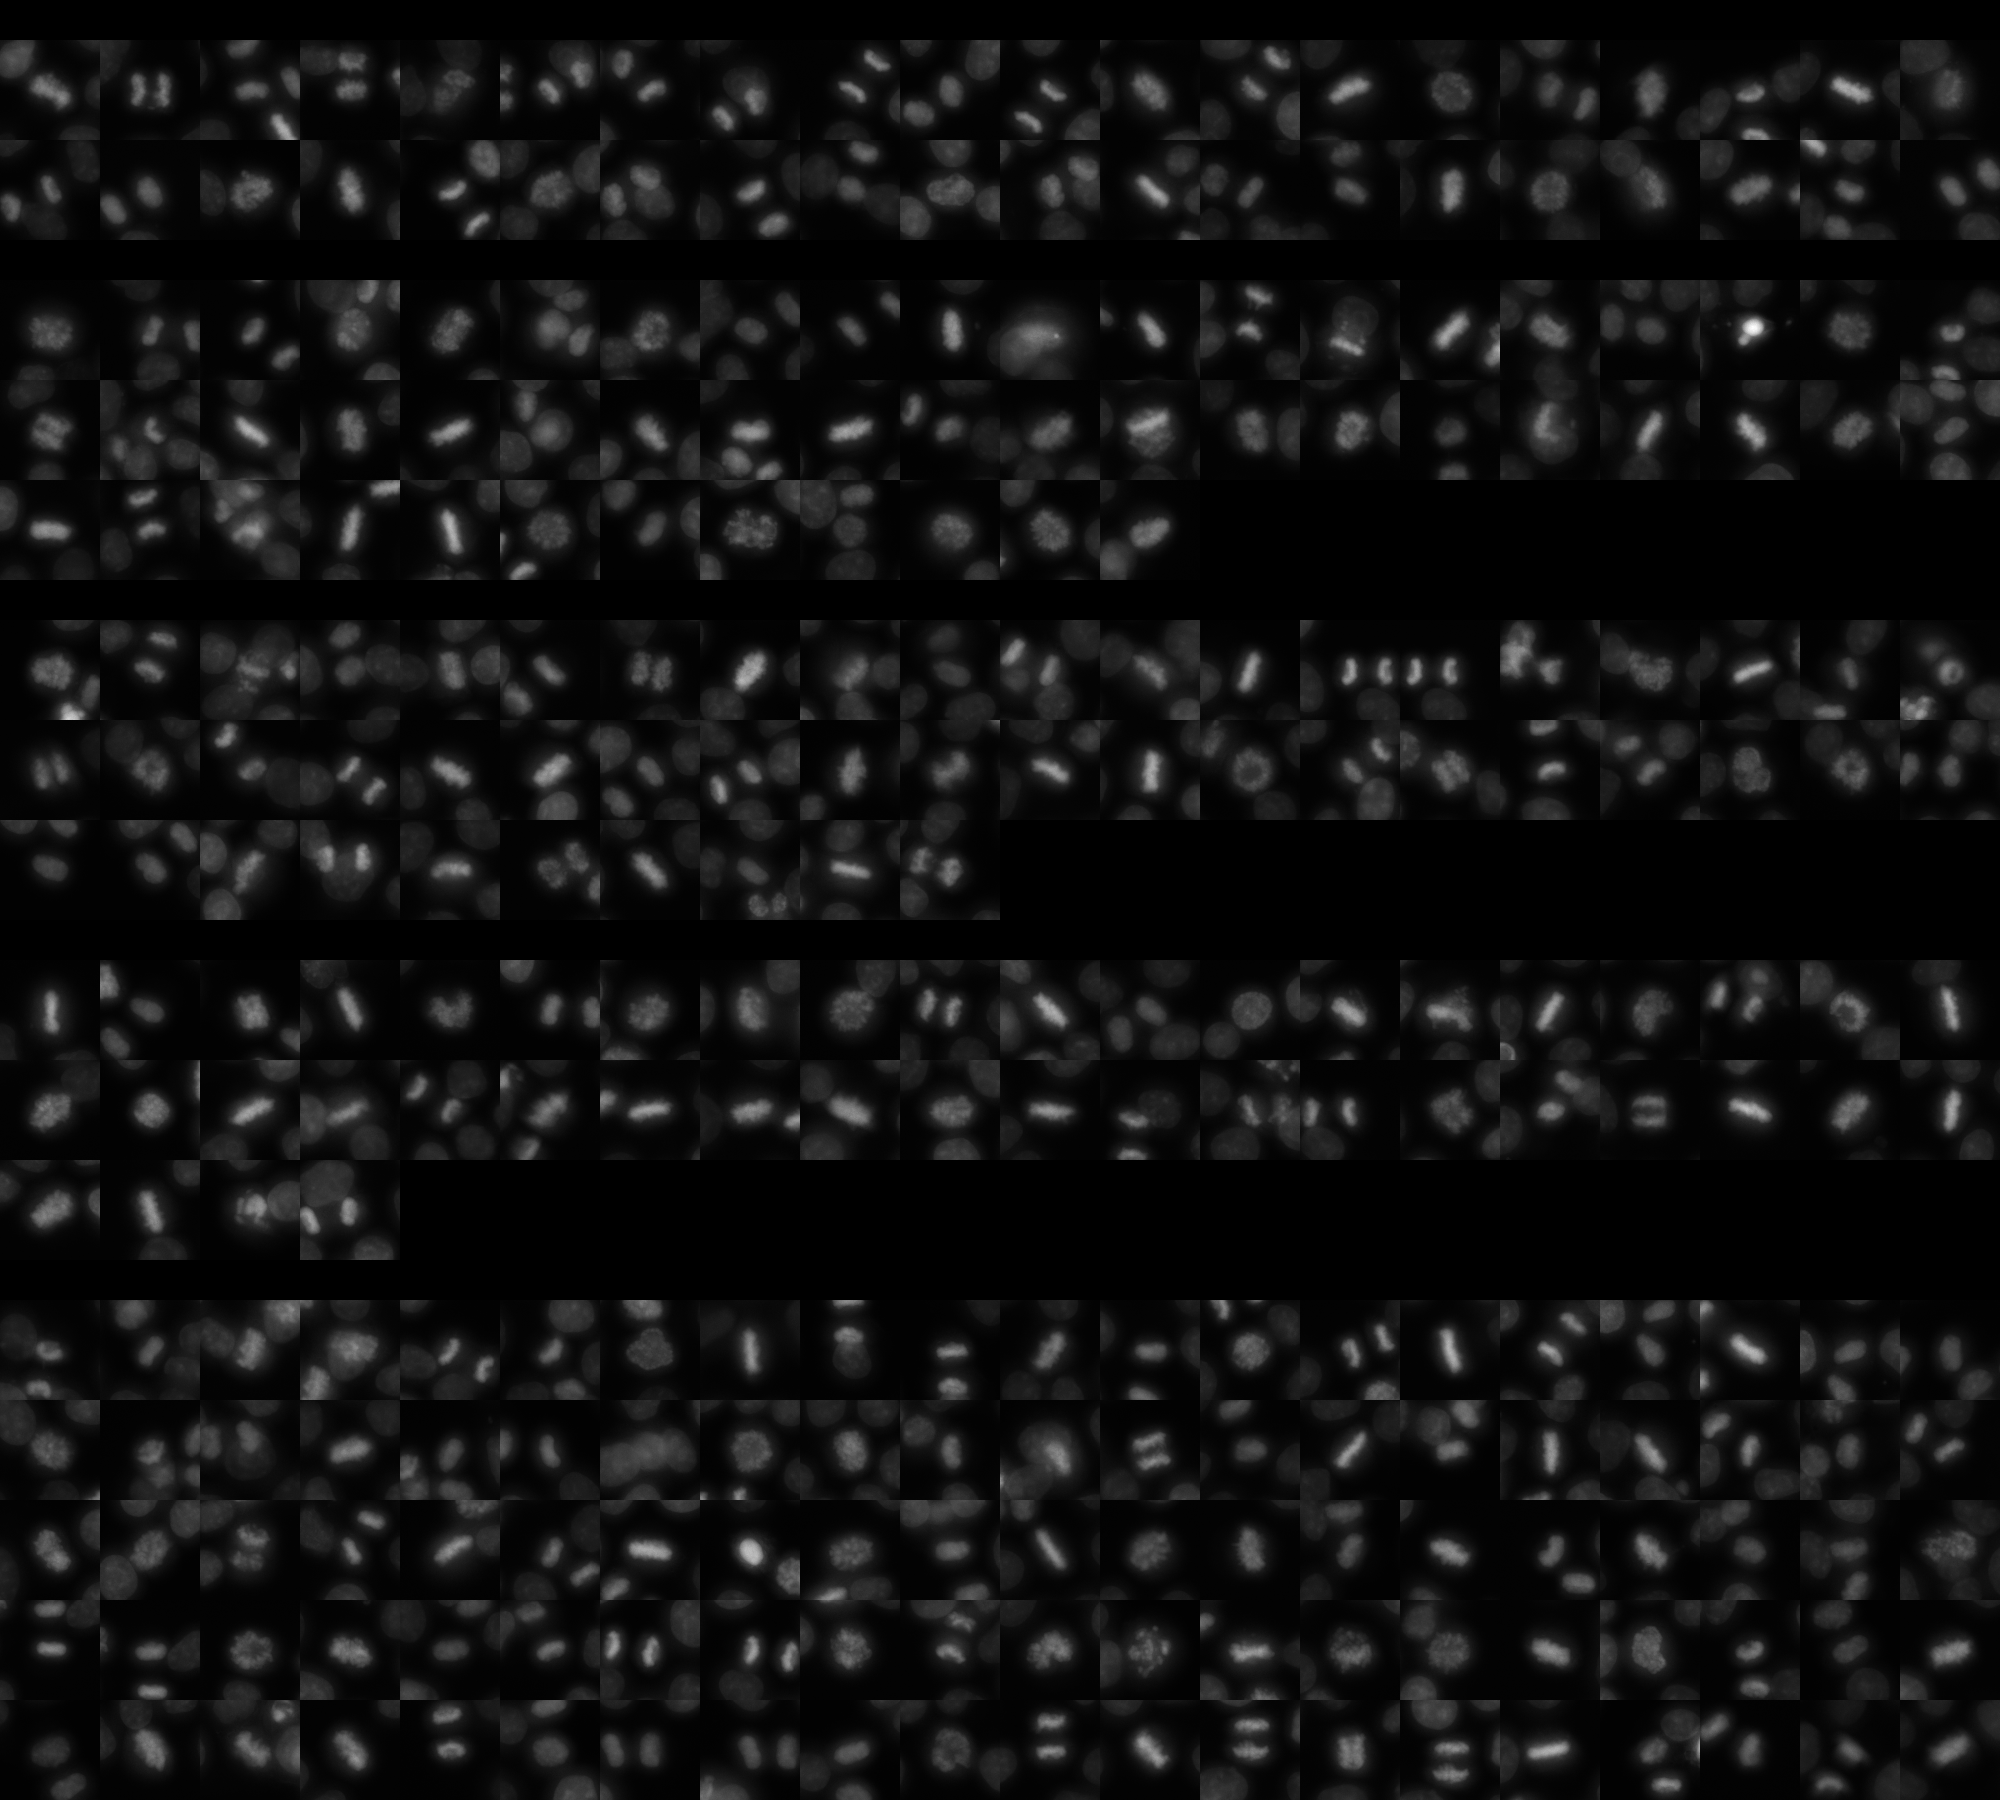
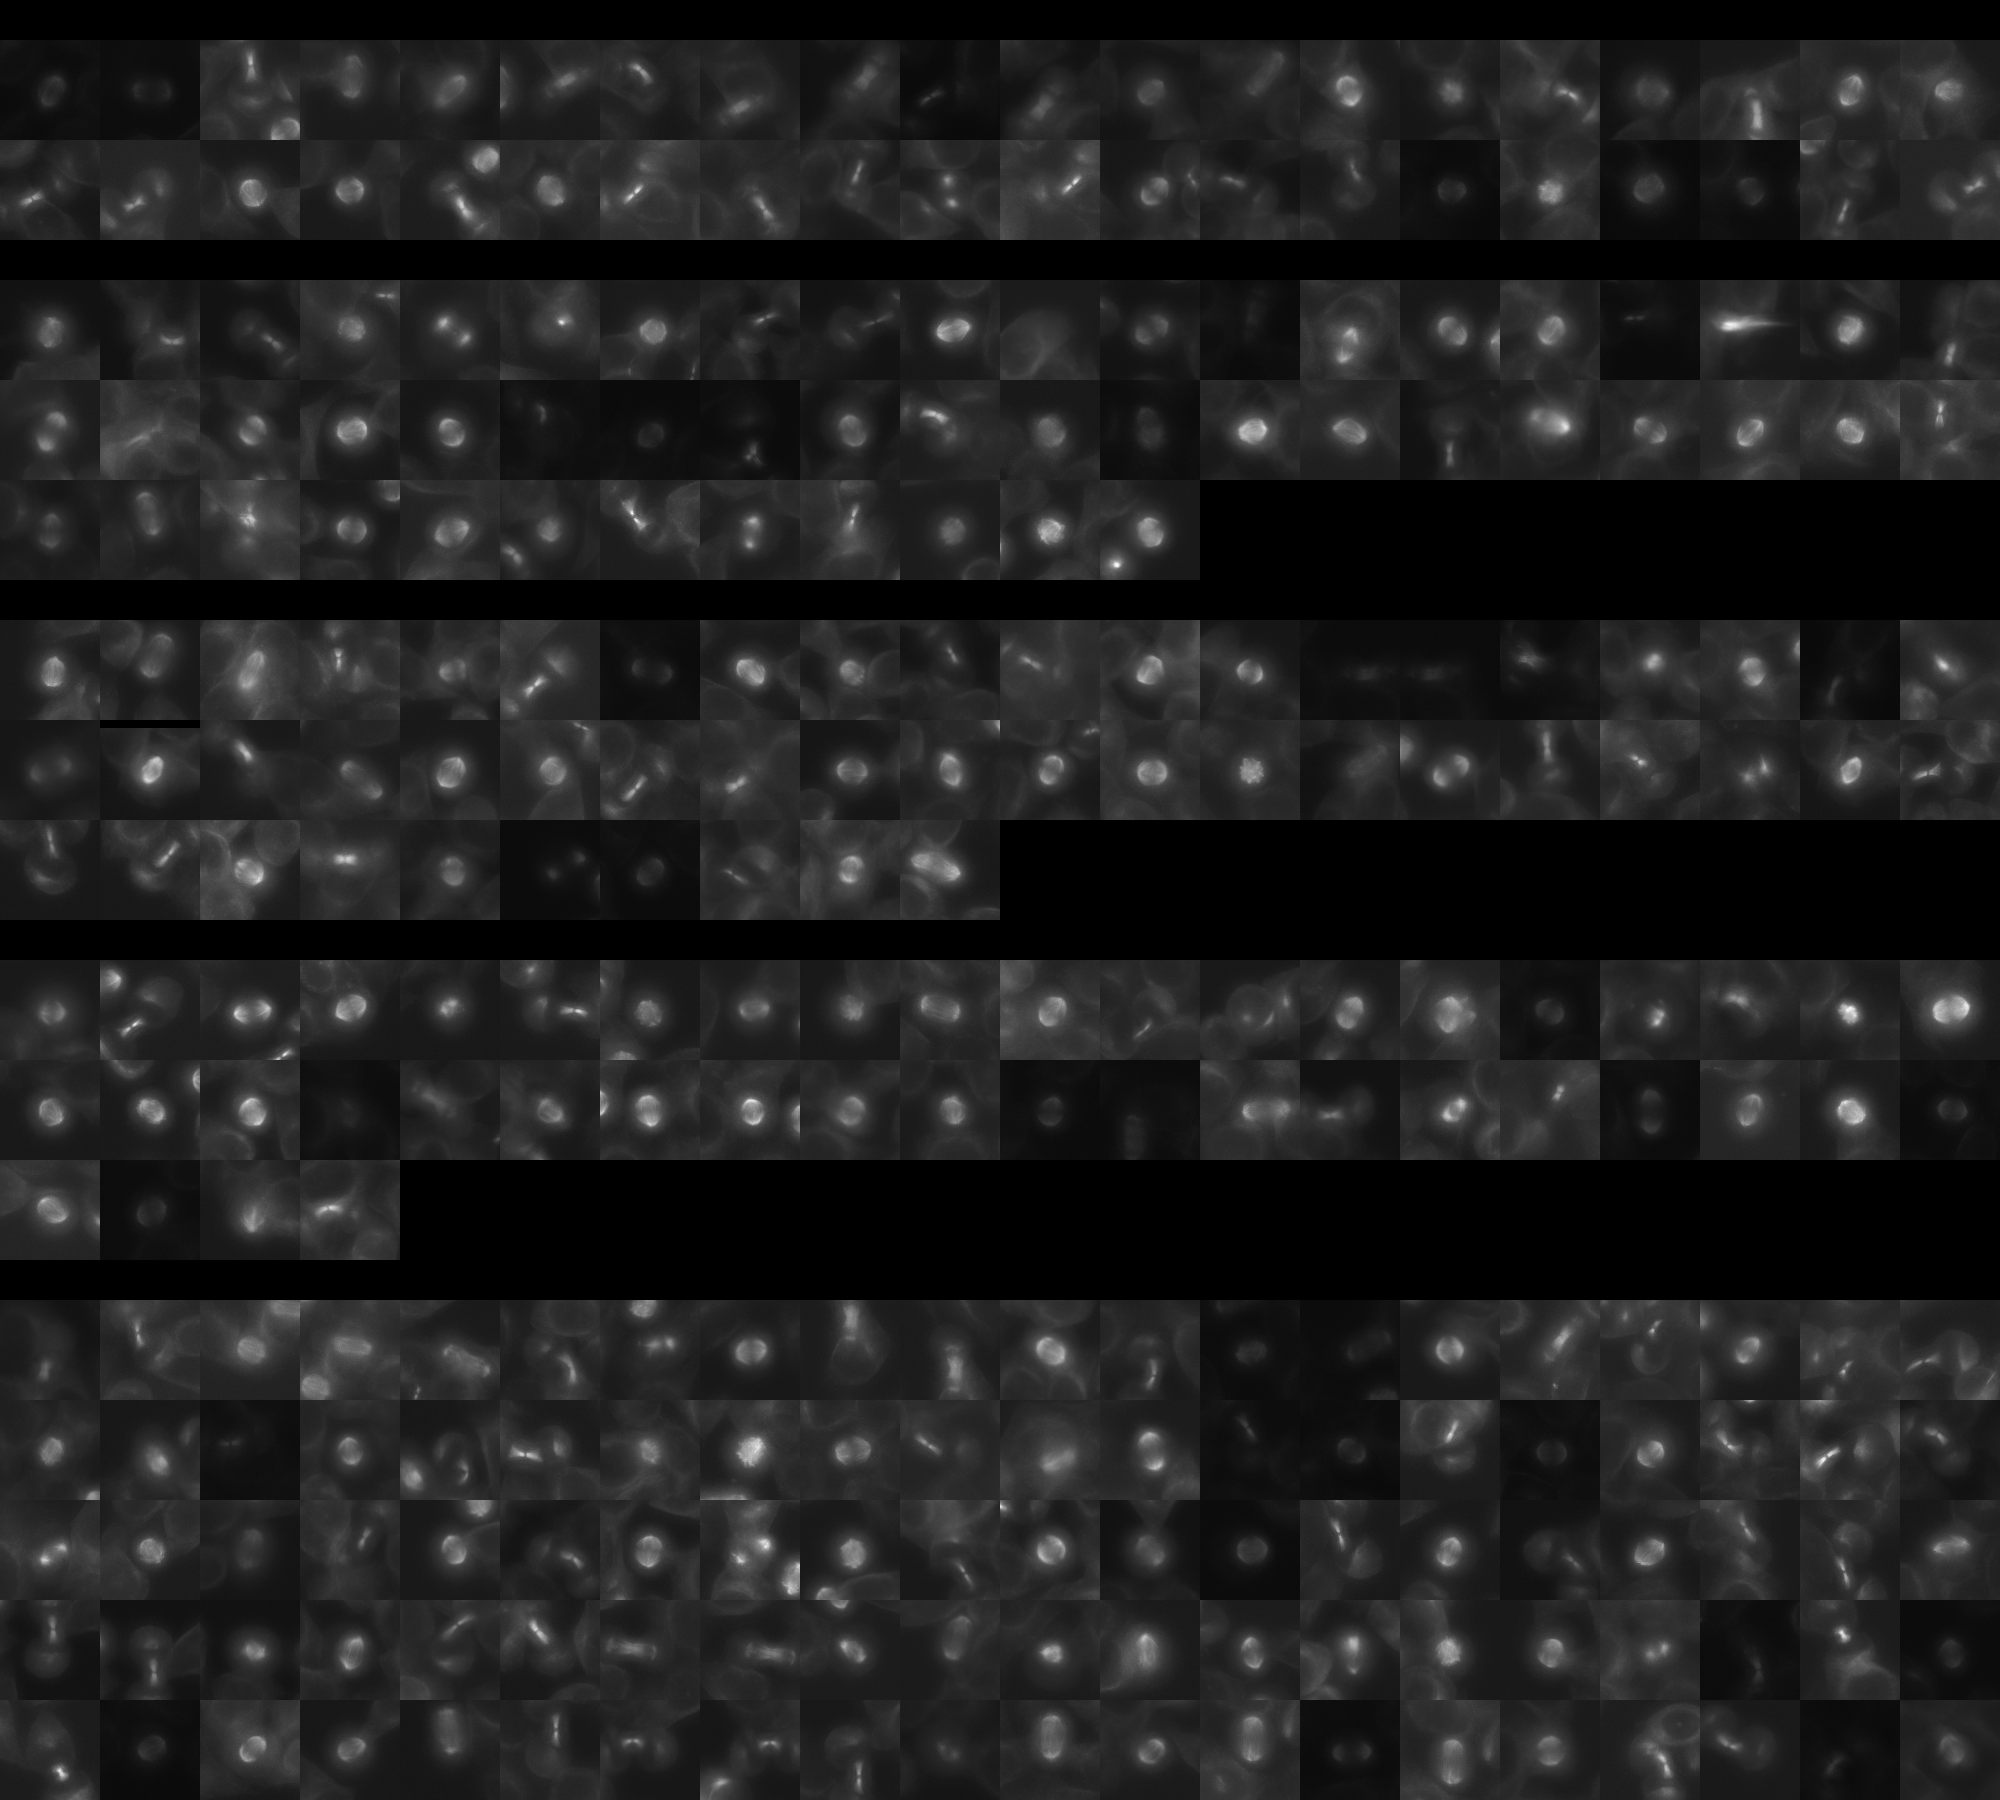
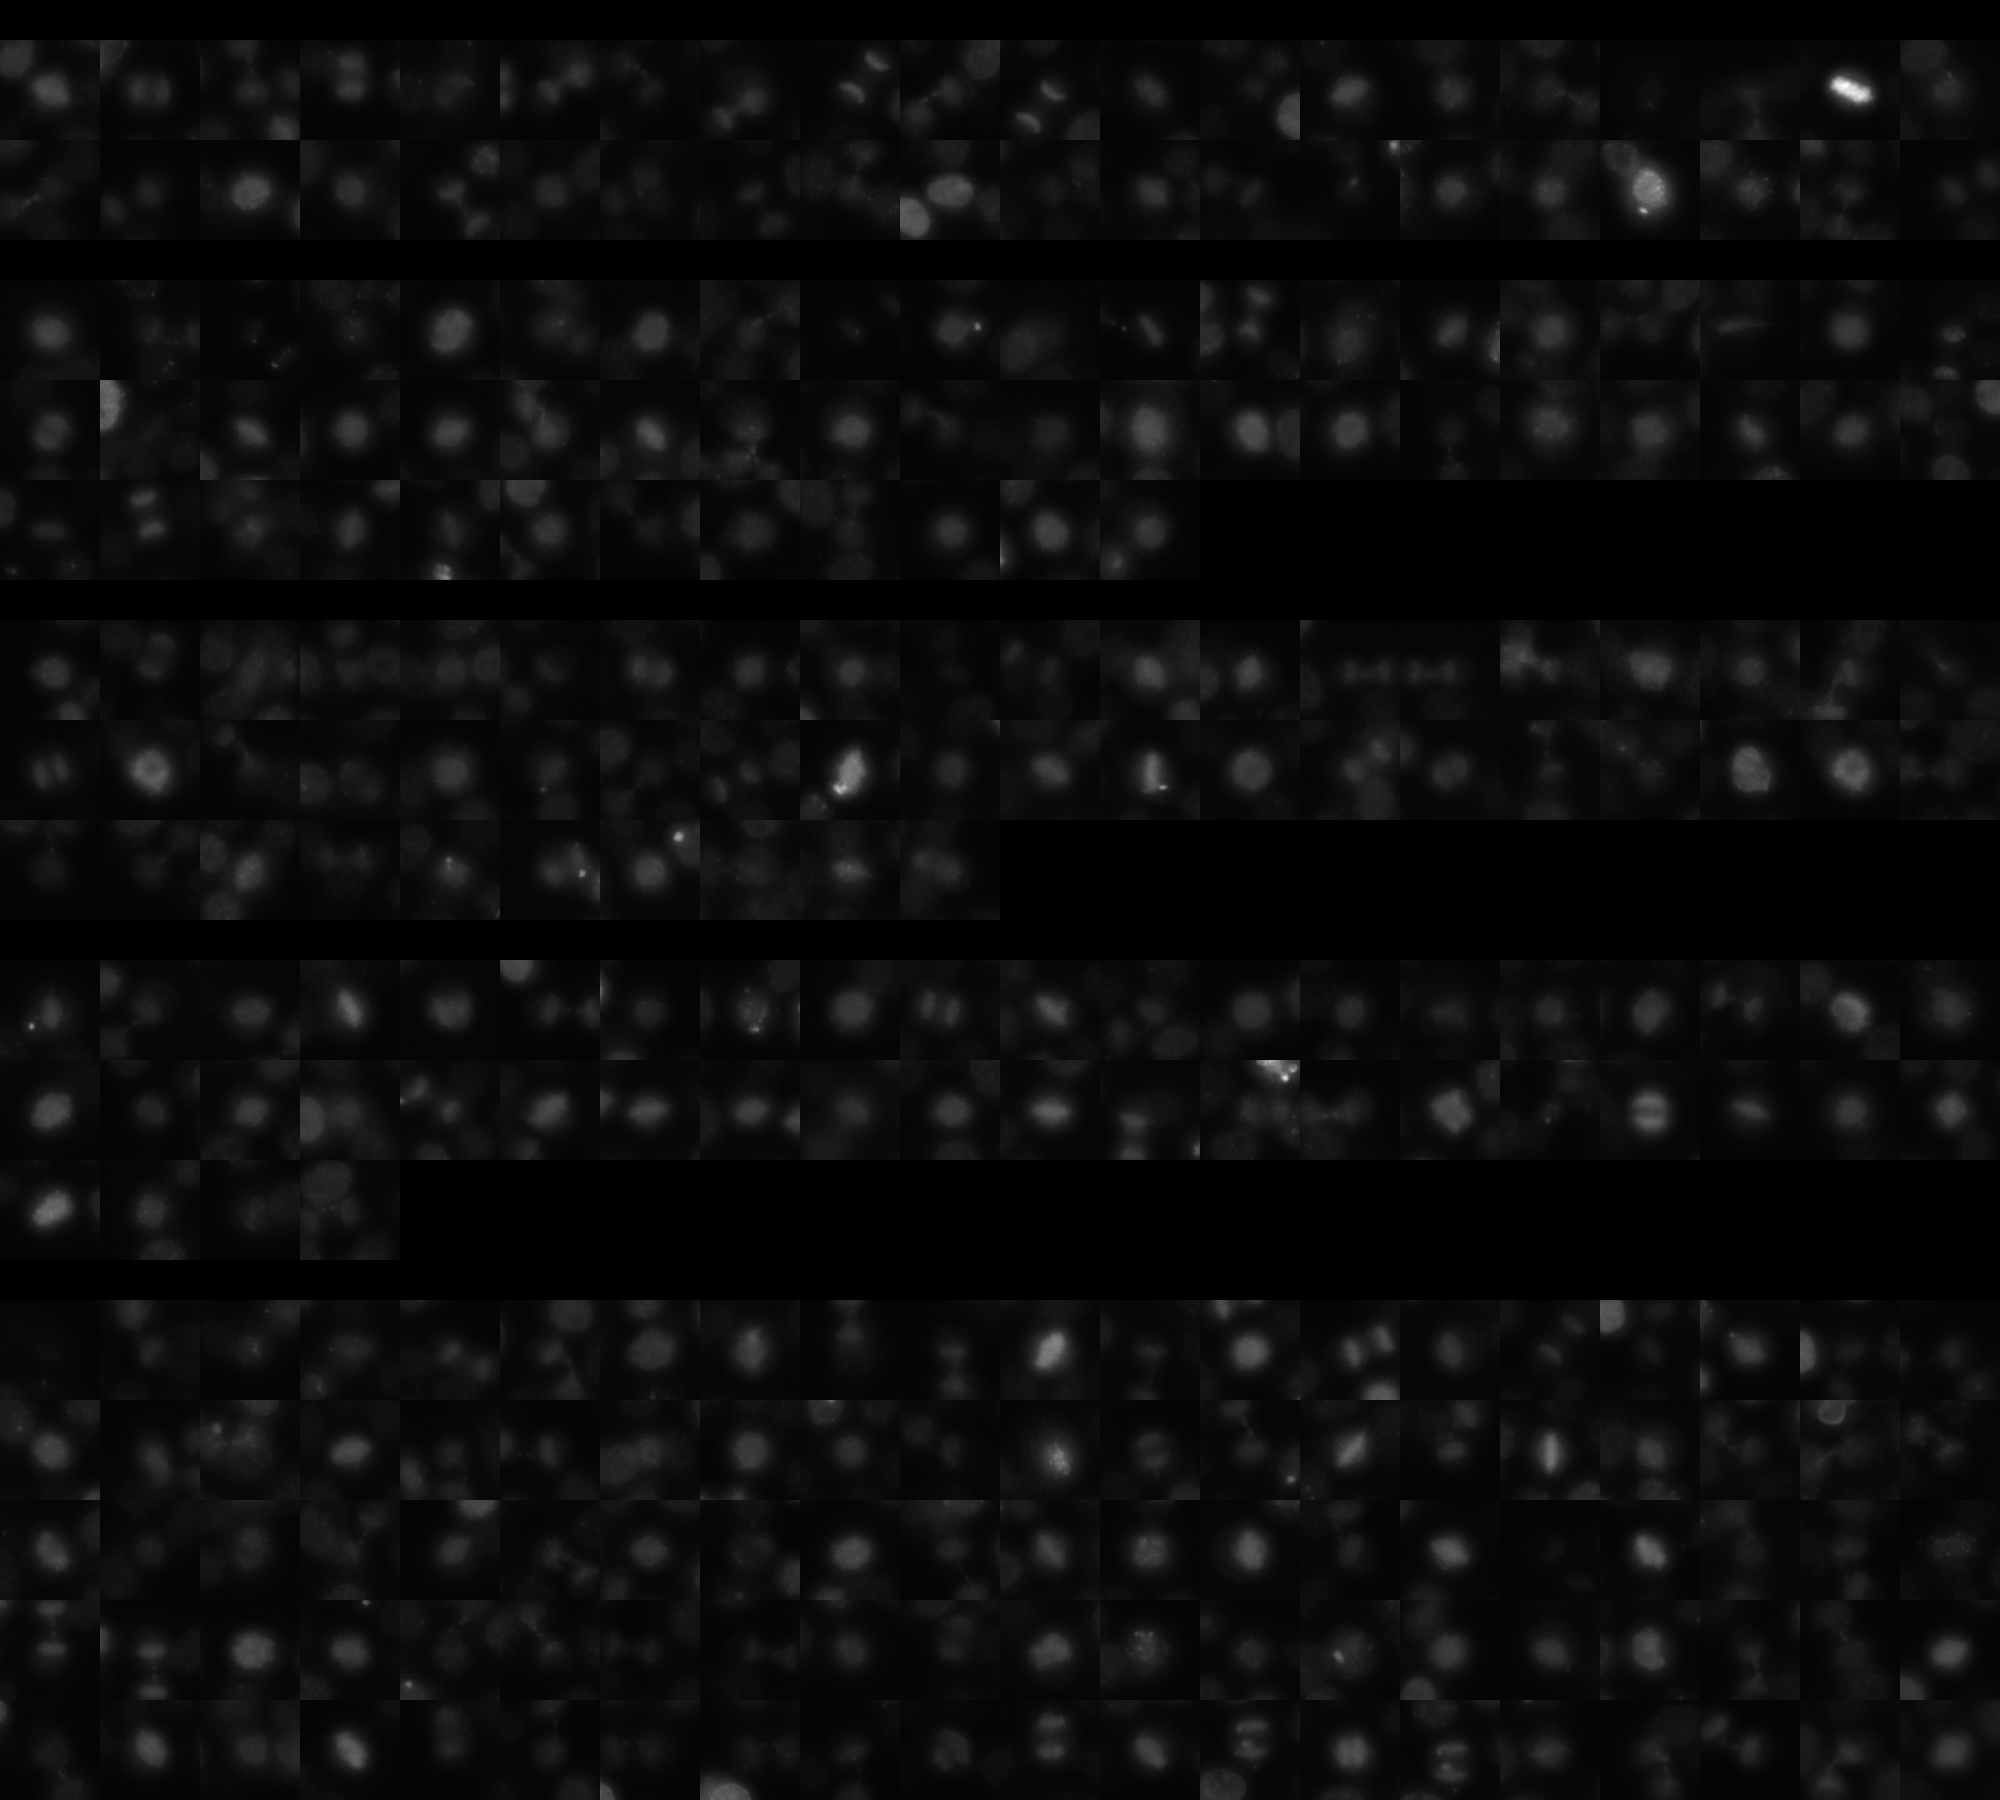
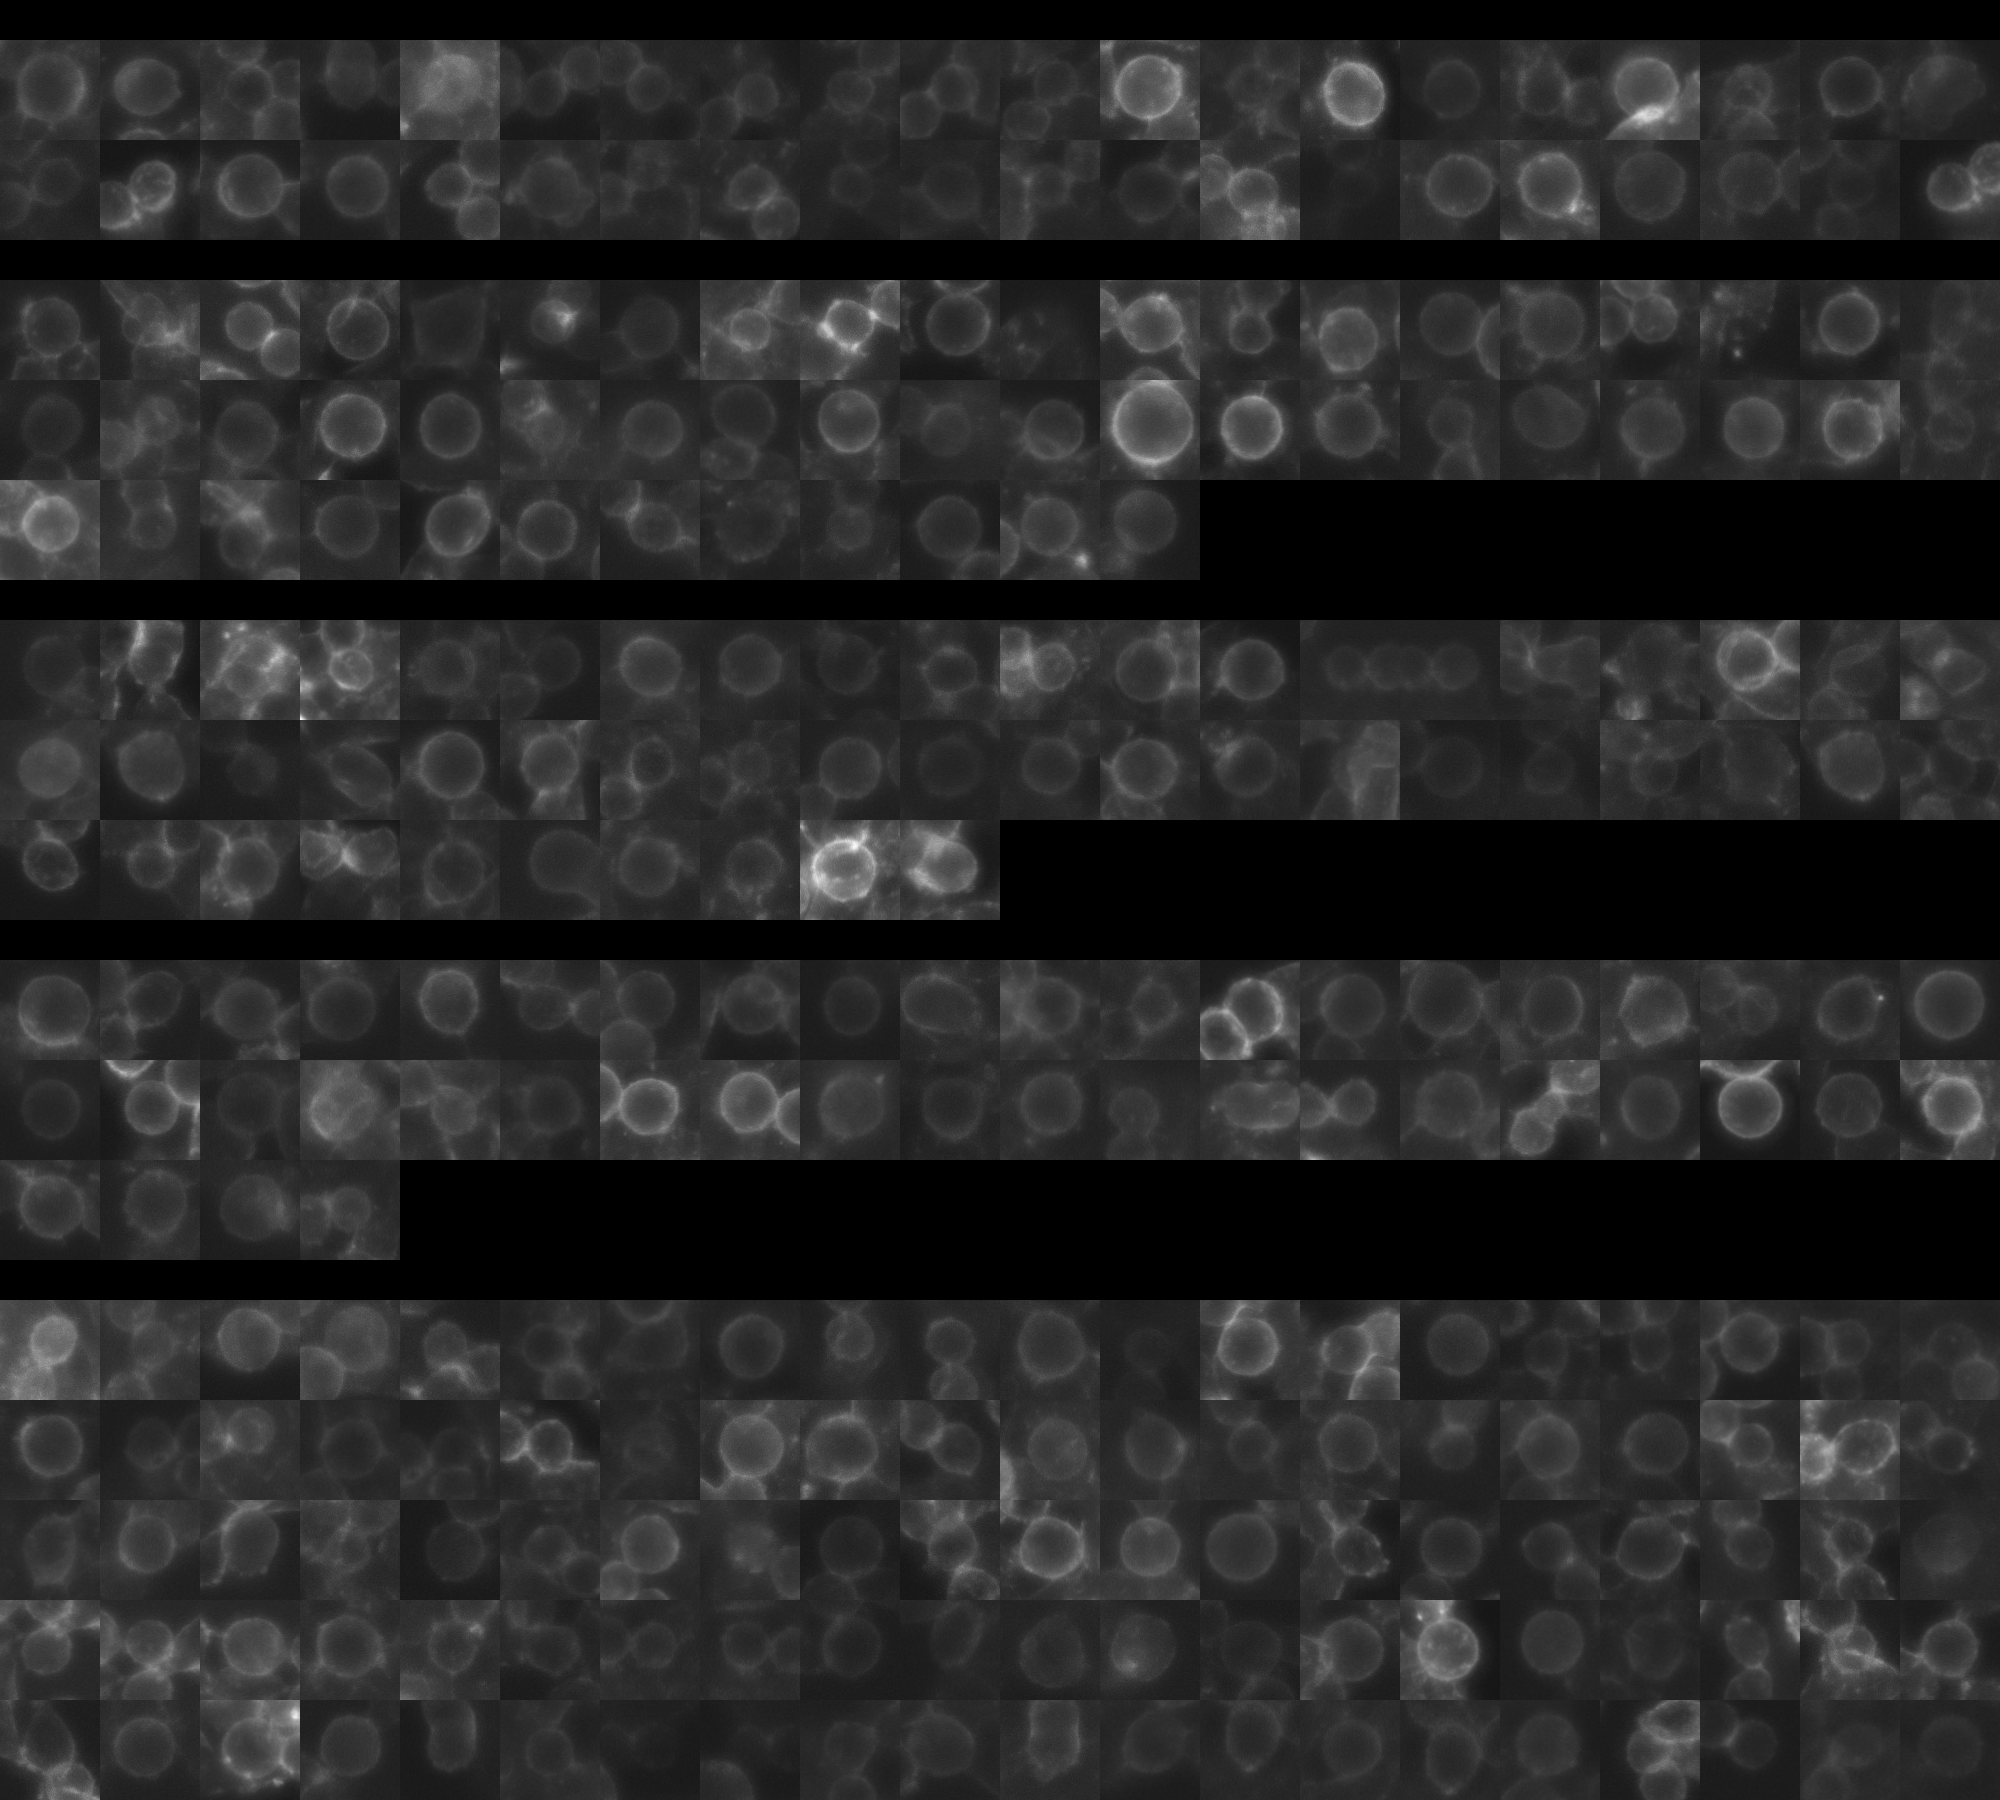
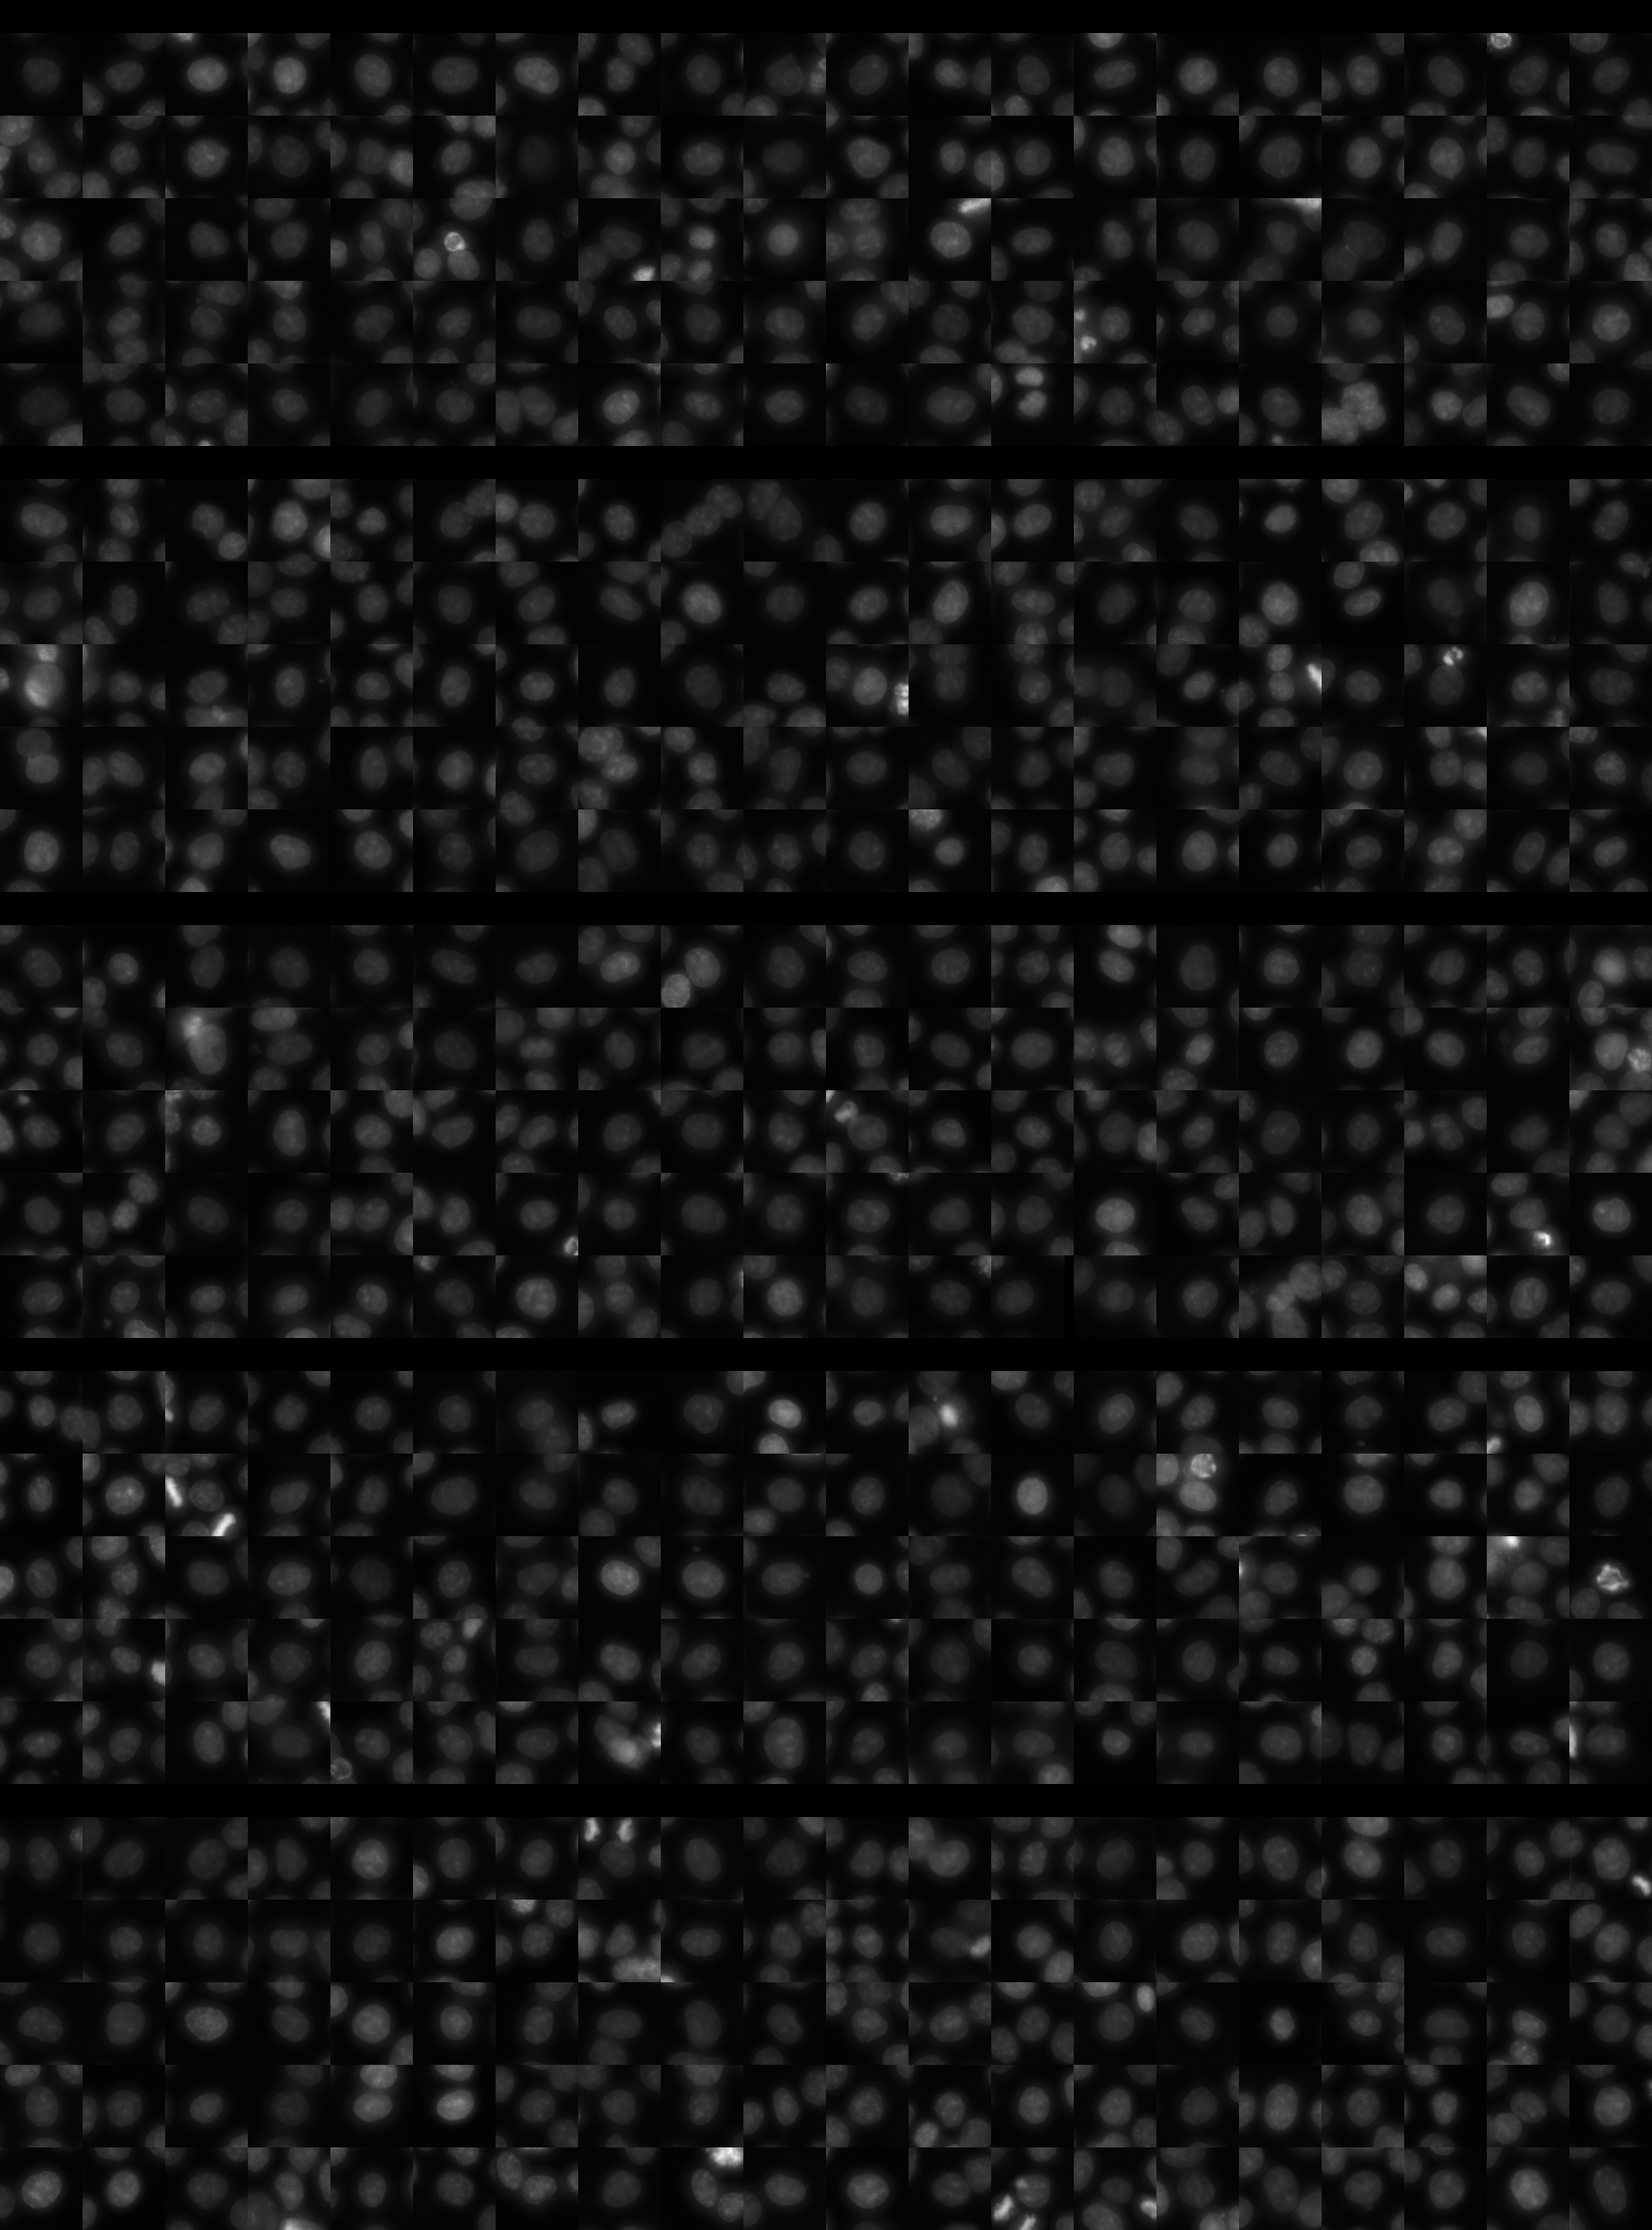
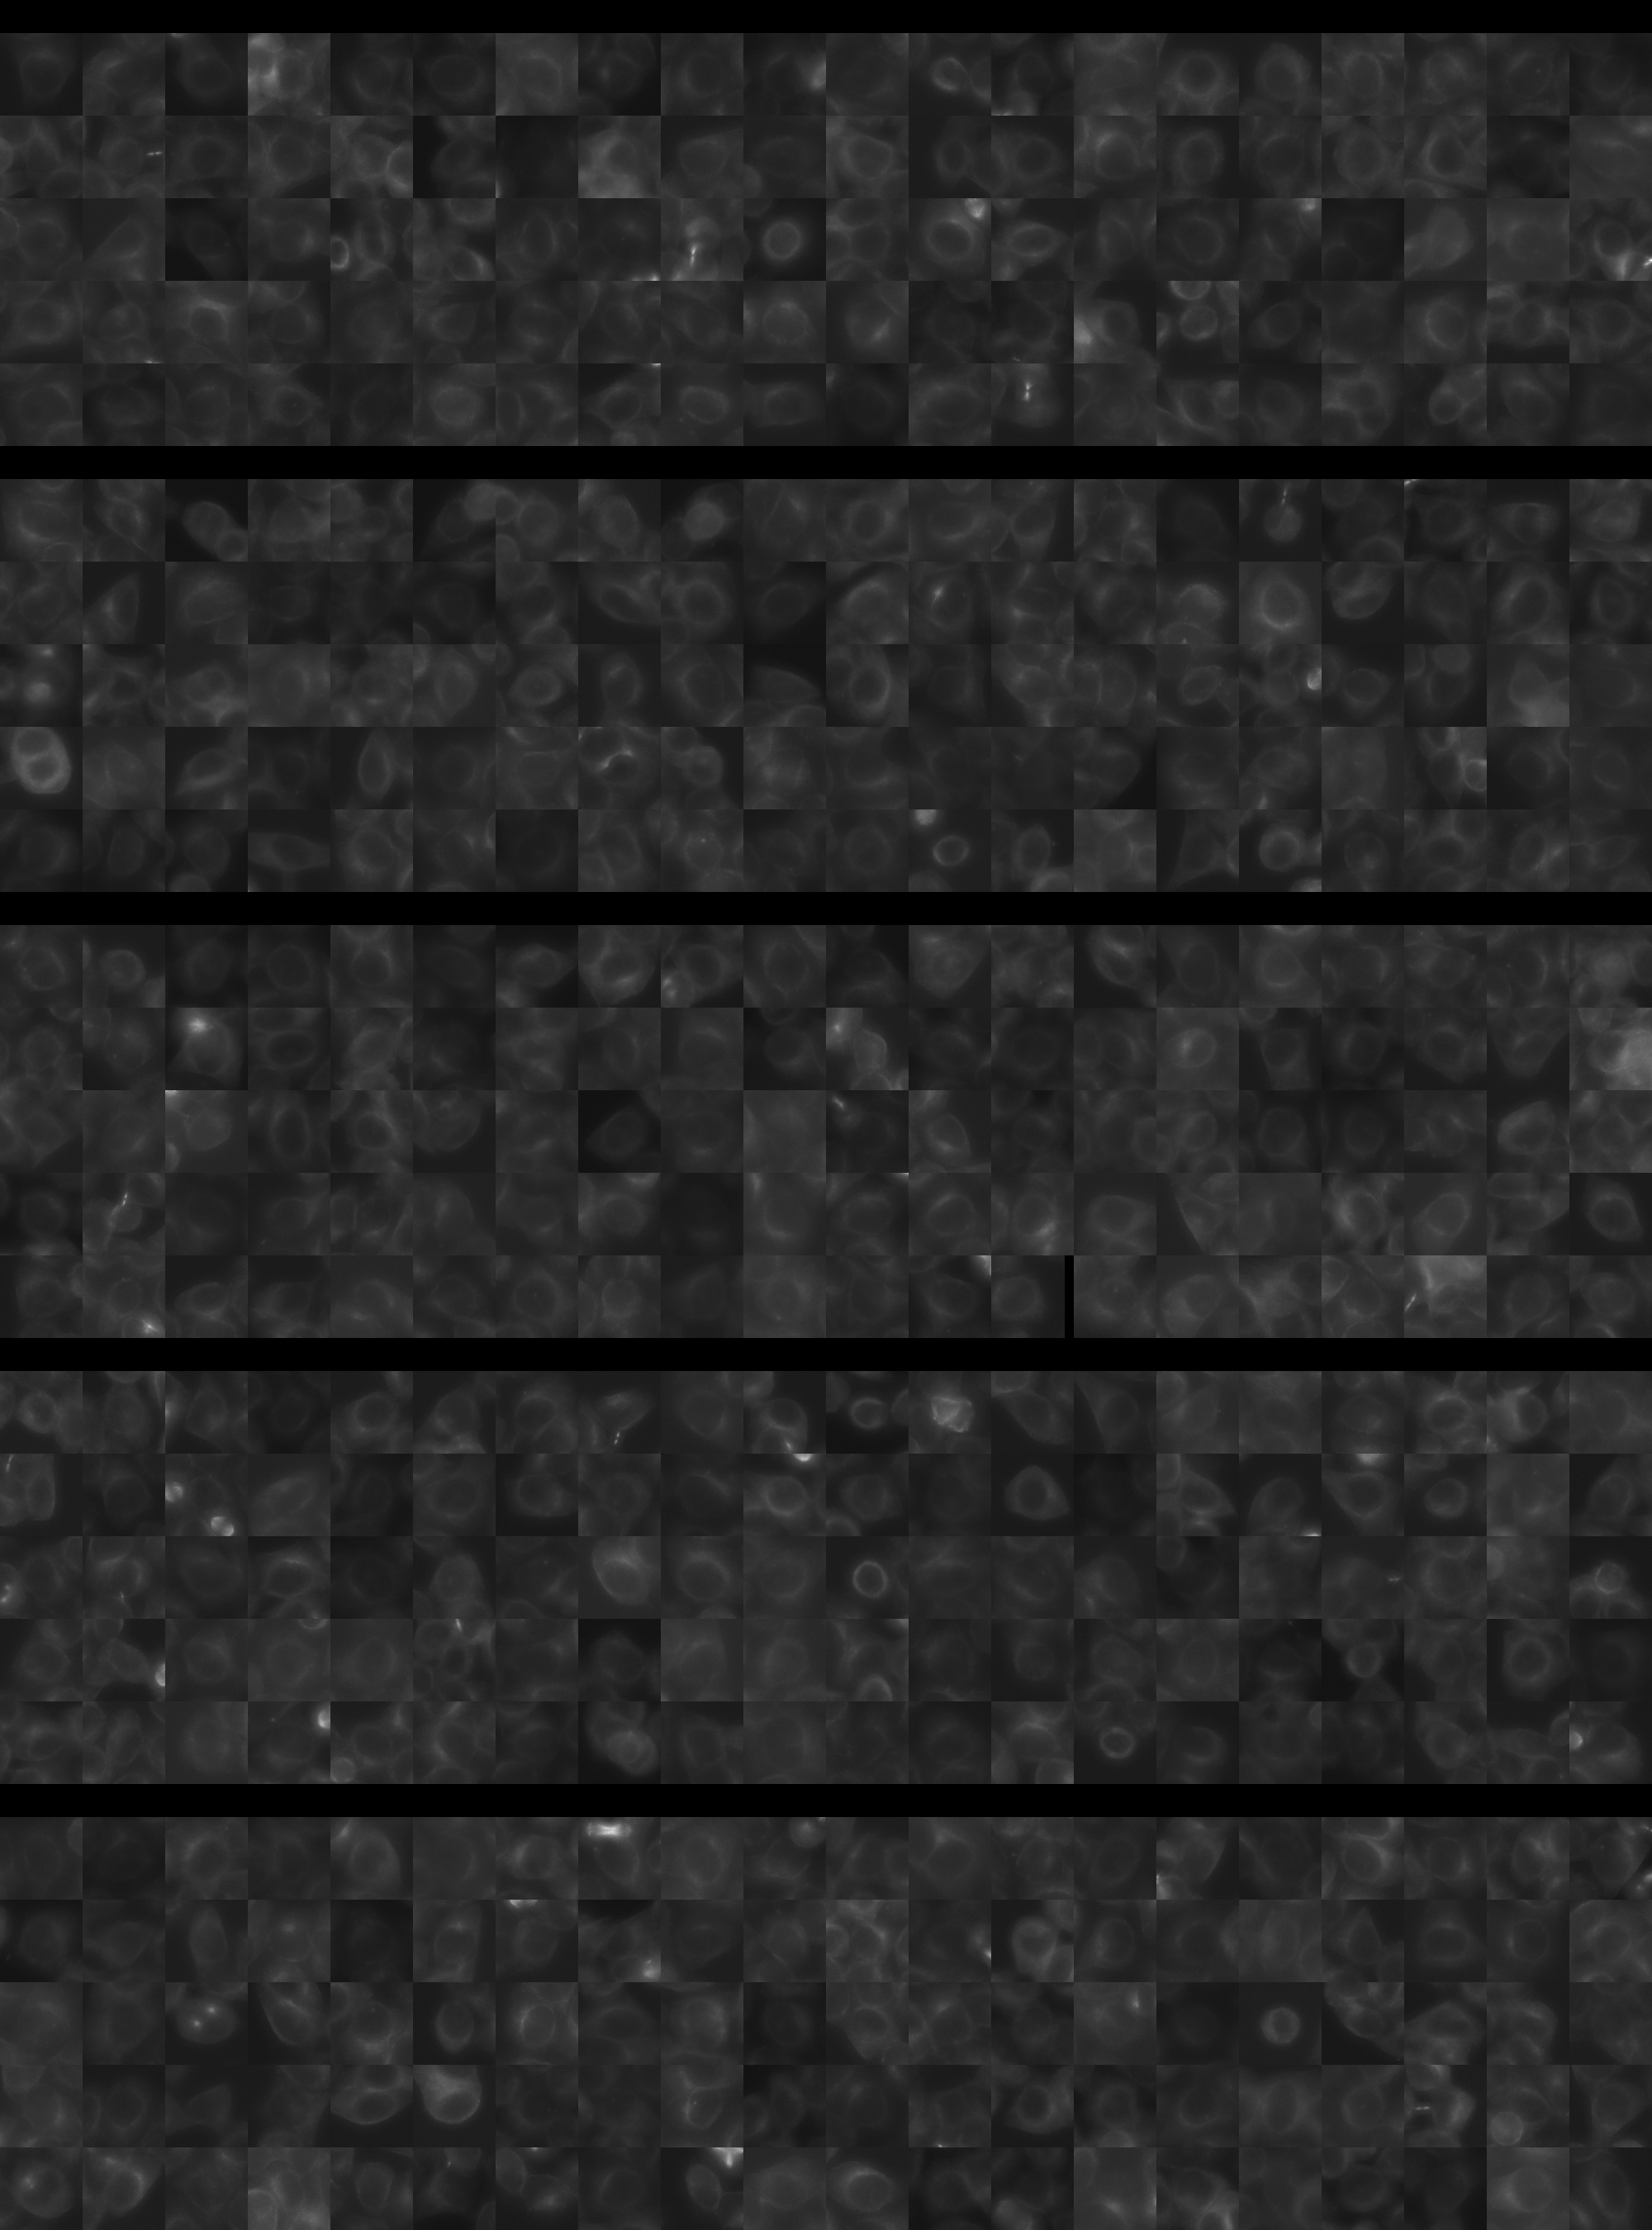
Each montage below shows randomly selected individual cell images for the same target gene separated by sgRNA, along with an example montage of cells expressing a non-targeting negative control sgRNA at the bottom. sgRNA labels in the montages correspond to the numbered sgRNA sequences in the gene info table above. The DNA (blue) and tubulin (green) channels are displayed by default, with gH2AX (grayscale) and actin (yellow) available using the check boxes. Channel brightness, contrast, and opacity are adjustable by clicking the arrow next to the channel name. When only one channel is selected, the display defaults to grayscale. Click the “Zoom” checkbox above the channel controls to enable image zooming (via scrolling) and panning (via click-and-drag).

The cell boxes displayed for this gene are square, 30.36 μm per side for the interphase montage and 30.36 μm per side for the mitotic montage.
Features

Interphase Score Rank FDR q-value
Nucleus DNA Integrated 0.001 3059 of 5322 0.991
Nucleus DNA Mean 0.013 1590 of 5322 0.743
Nucleus gH2AX Mean 0.121 1488 of 5322 0.002
Nucleus DNA - gH2AX Correlation -5.637e-02 2648 of 5322 0.032
Nucleus Shape Area -4.238e-03 3444 of 5322 0.857
Nucleus Shape Eccentricity 0.007 2920 of 5322 0.853
Nucleus Shape Form Factor -2.192e-02 1361 of 5322 0.614
Nucleus Shape Solidity -3.545e-02 2011 of 5322 0.271
Cell DNA Mass Displacement 0.020 3033 of 5322 0.762
Cell Tubulin Mean 0.032 1600 of 5322 0.430
Cell Tubulin Mass Displacement 0.016 2018 of 5322 0.800
Cell Actin Mean 0.015 2504 of 5322 0.764
Cell Tubulin - Actin Correlation 0.021 2612 of 5322 0.637
Cell DNA - Tubulin Correlation 0.003 3708 of 5322 0.961
Cell Shape Area 9.551e-04 3199 of 5322 0.925
Cell Shape Eccentricity 0.013 2658 of 5322 0.884
Mitotic Score Rank FDR q-value
Nucleus DNA Integrated 0.029 3539 of 5322 0.996
Nucleus DNA Mean 0.085 1659 of 5322 1.000
Nucleus DNA Mass Displacement 0.006 3433 of 5322 0.999
Nucleus DNA Mean Frac 3 0.150 985 of 5322 1.000
Nucleus gH2AX Mean -1.300e-02 3122 of 5322 1.000
Nucleus gH2AX Mean Frac 0 -2.079e-01 4843 of 5322 1.000
Nucleus Tubulin Mean Frac 0 -1.034e-01 4705 of 5322 0.999
Nucleus Tubulin Mean Edge 0.350 184 of 5322 0.595
Nucleus Tubulin Std Edge 0.177 590 of 5322 0.999
Nucleus Shape Area -7.936e-03 4031 of 5322 0.990
Nucleus Shape Eccentricity -1.060e-01 3654 of 5322 1.000
Nucleus Shape Form Factor -2.972e-02 1808 of 5322 0.998
Cell Tubulin Mean 0.252 640 of 5322 0.910
Cell Tubulin Mean Frac 3 0.111 641 of 5322 0.999
Cell Actin Mean -1.573e-01 4844 of 5322 0.997
Cell Shape Area -7.729e-02 4633 of 5322 0.998
( Reset Zoom )
Brightness
Contrast
Opacity
Brightness
Contrast
Opacity
Brightness
Contrast
Opacity
Brightness
Contrast
Opacity
Brightness
Contrast
Opacity

( Reset Zoom )
Brightness
Contrast
Opacity
Brightness
Contrast
Opacity
Brightness
Contrast
Opacity
Brightness
Contrast
Opacity
Brightness
Contrast
Opacity

MIT Central Accessability