MEX3C

Gene symbol: MEX3C
Gene: 51320
Uniprot Function: E3 ubiquitin ligase responsible for the post-transcriptional regulation of common HLA-A allotypes. Binds to the 3' UTR of HLA-A2 mRNA, and regulates its levels by promoting mRNA decay. RNA binding is sufficient to prevent translation, but ubiquitin ligase activity is required for mRNA degradation.
Mitotic Index 0.0257
Interphase Cluster: #4 (49 genes)
Mitotic Cluster: #140 (20 genes)
sgRNA 1: AGTCAGGGTCCCTTATCGTG (interphase cells: 1446, mitotic cells: 35)
sgRNA 2: GCCACCTTCAAAGCTTACAT (interphase cells: 2355, mitotic cells: 63)
sgRNA 3: TAGAACATCCACTTGCTCGG (interphase cells: 1380, mitotic cells: 31)
sgRNA 4: TCCCACGCCTACGGCCCCGG (interphase cells: 1721, mitotic cells: 53)

Interphase Cluster

Mitotic Cluster

Overview

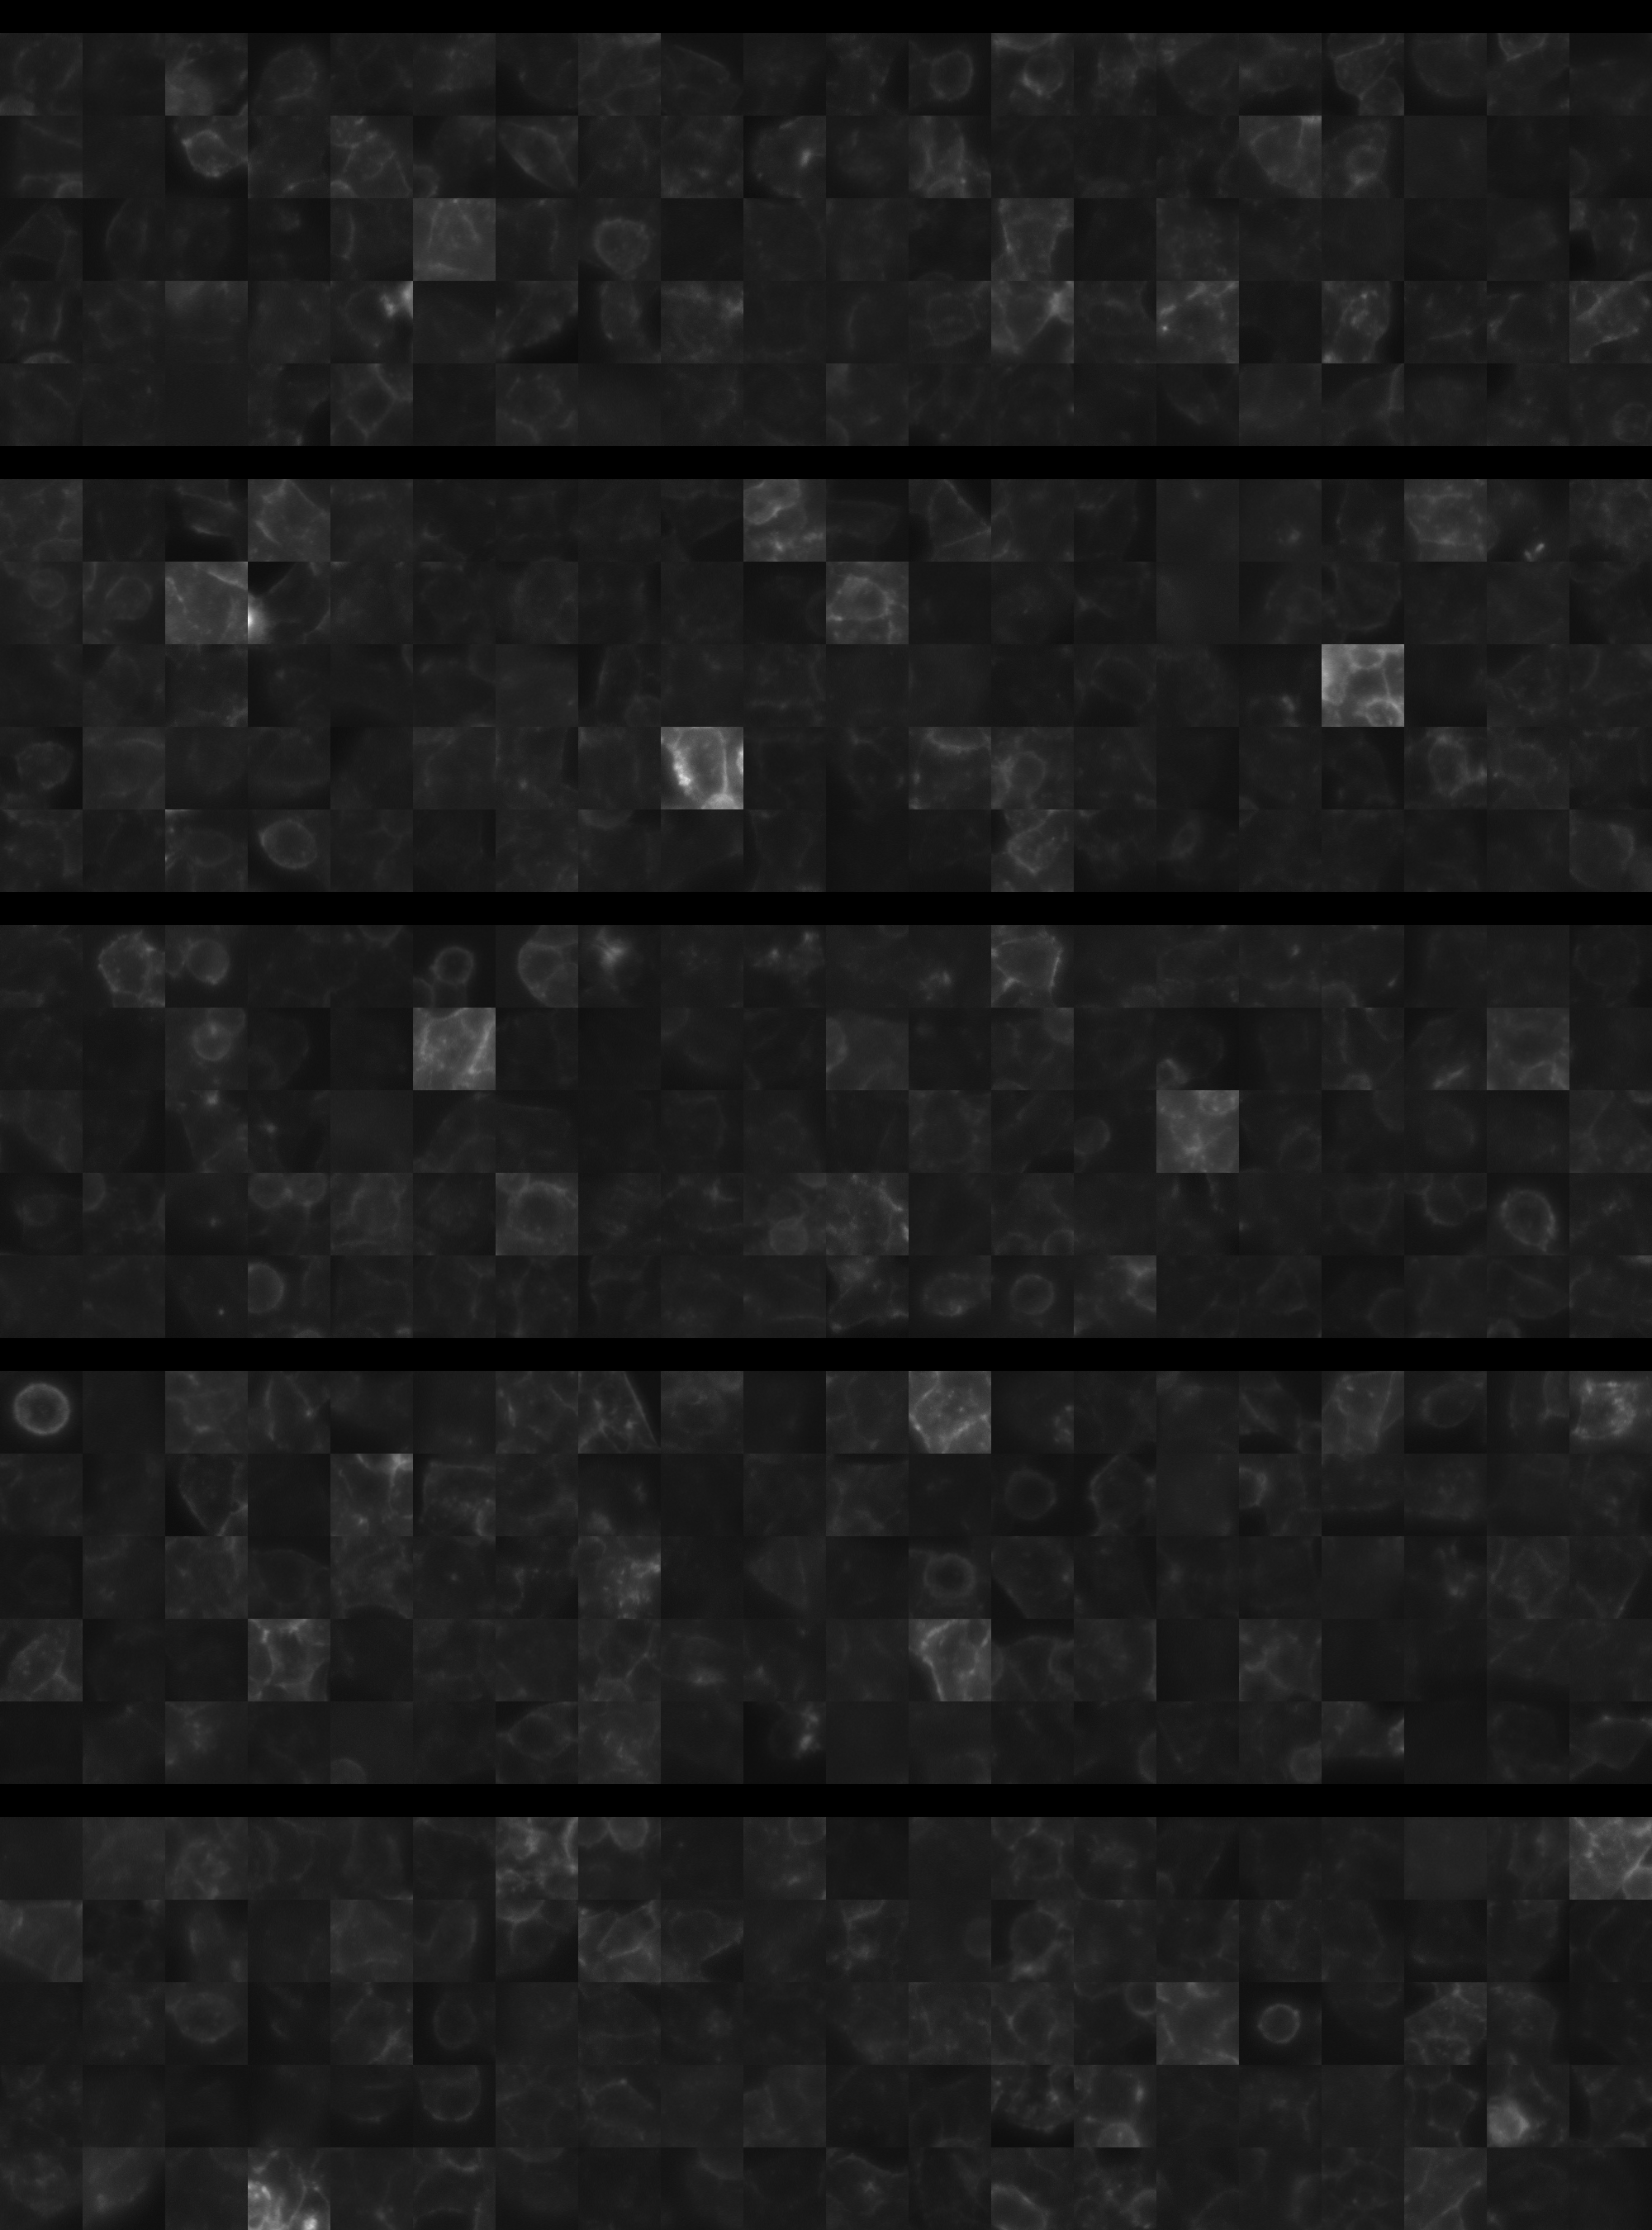
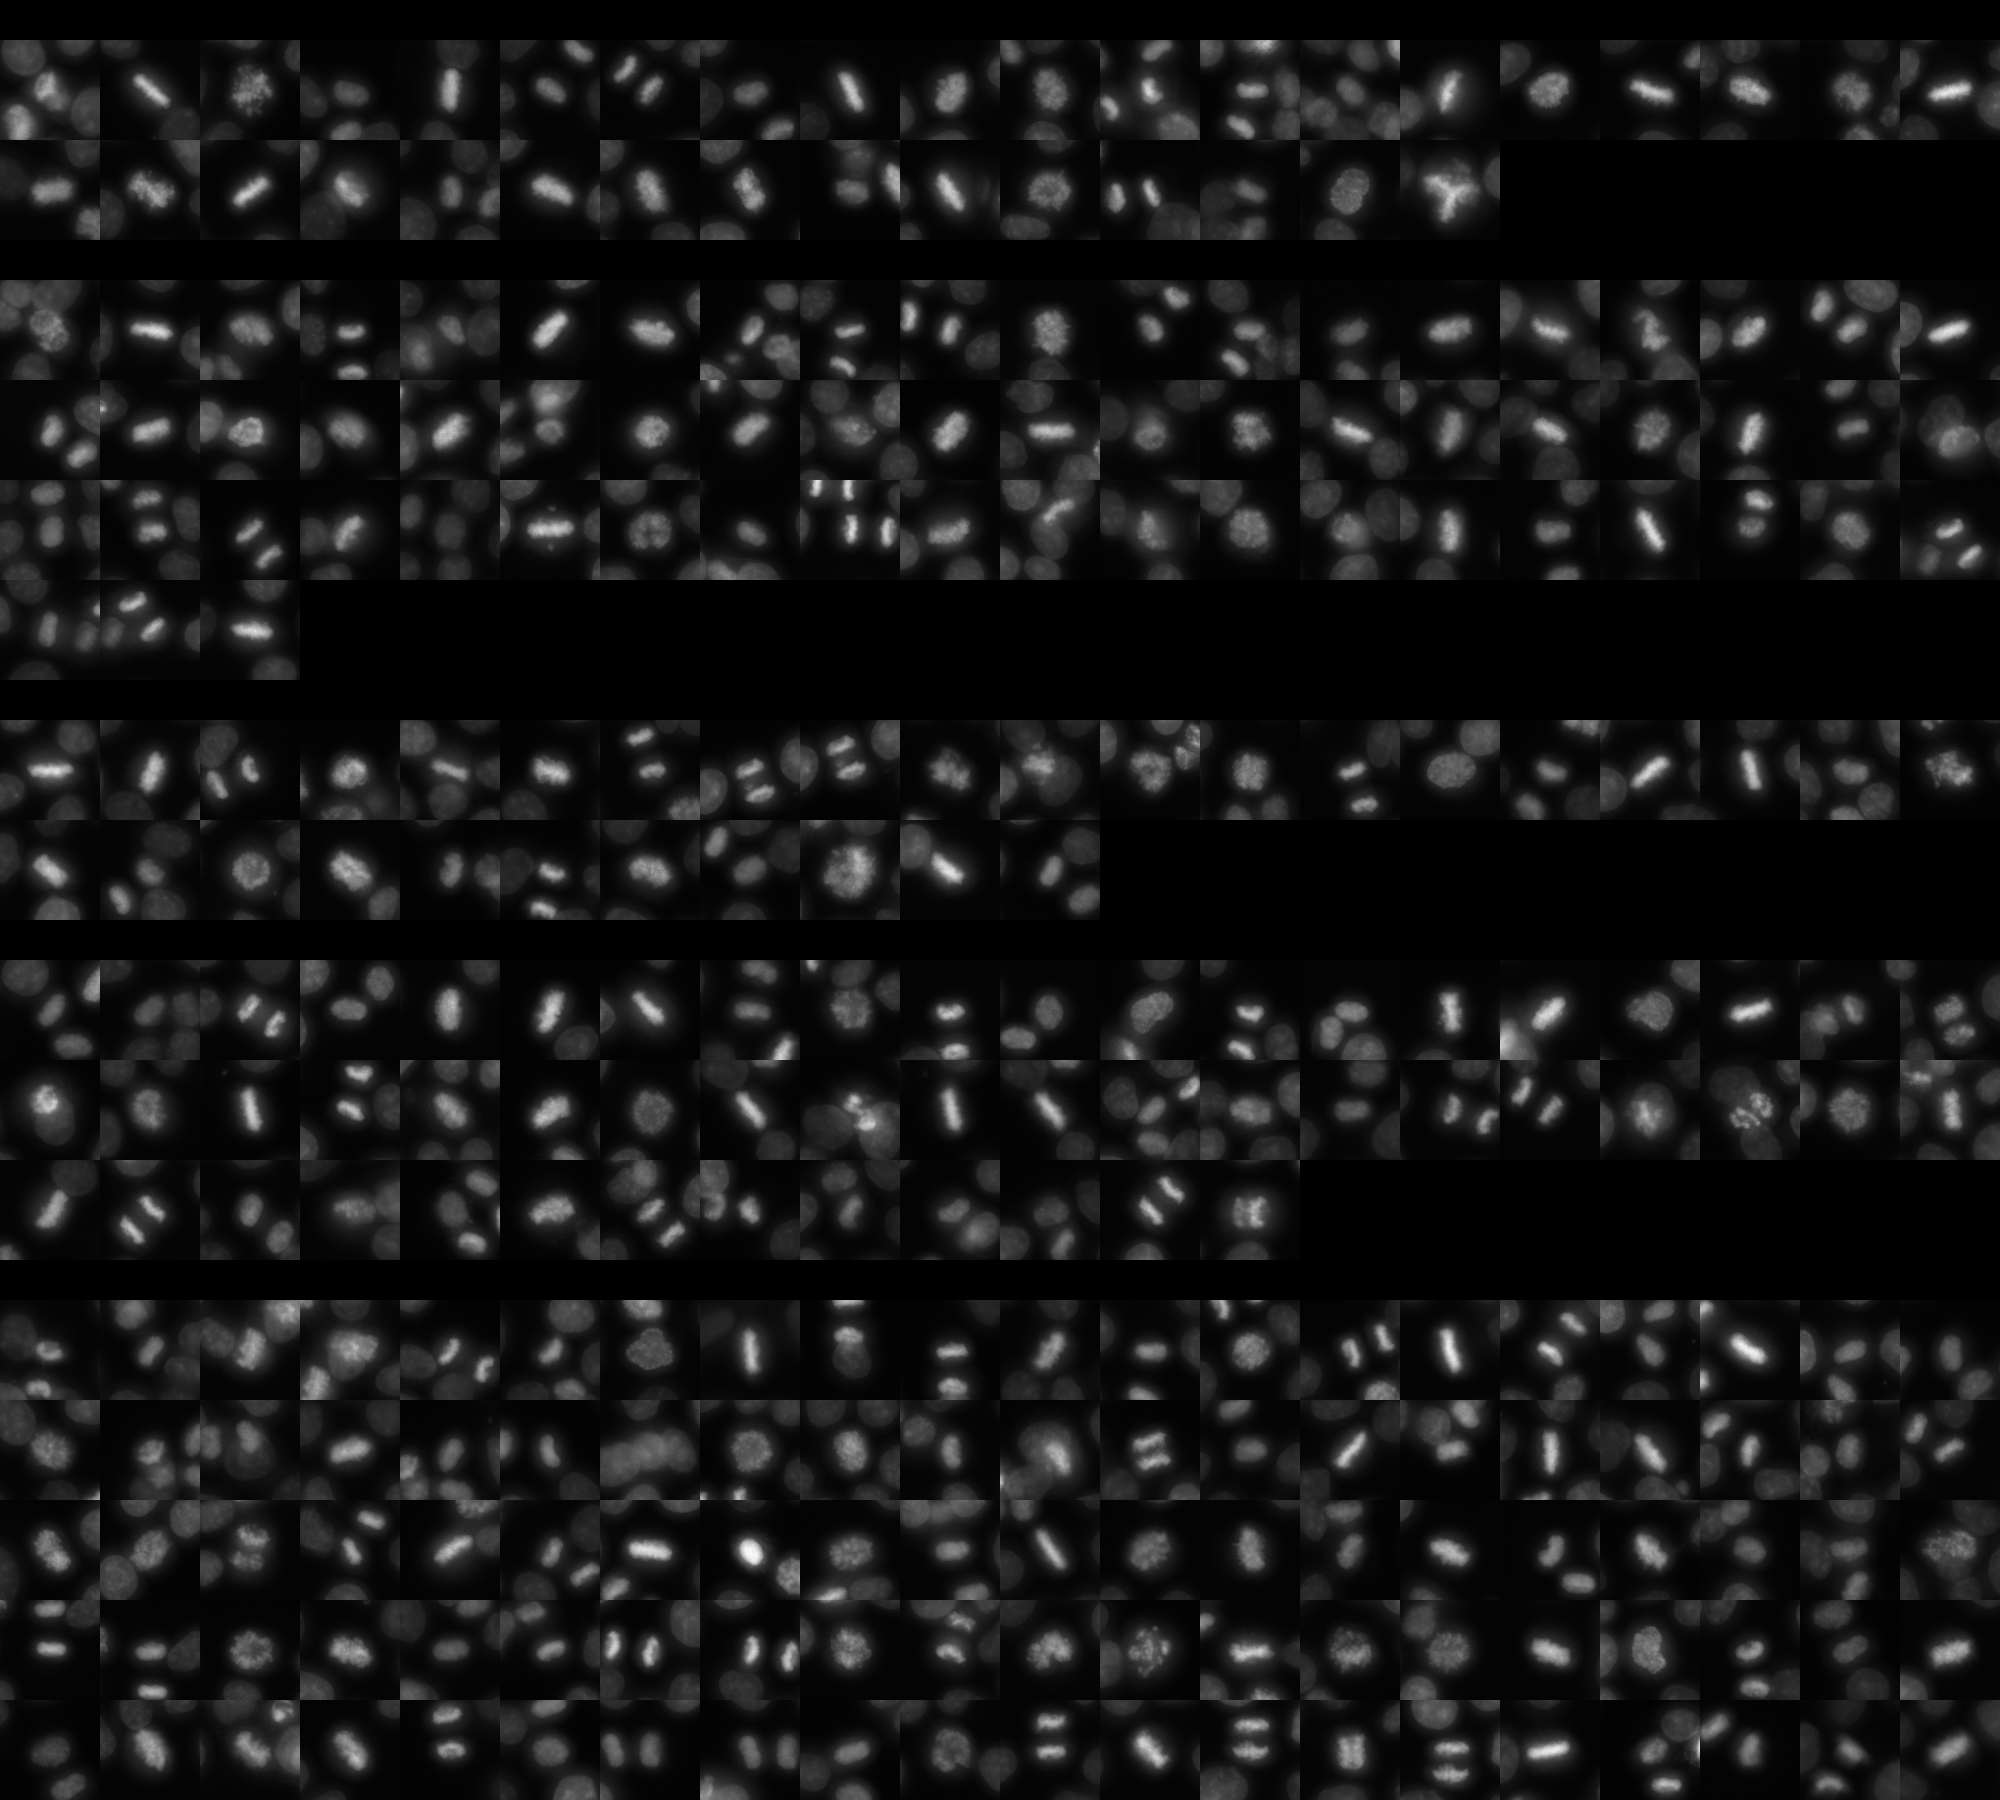
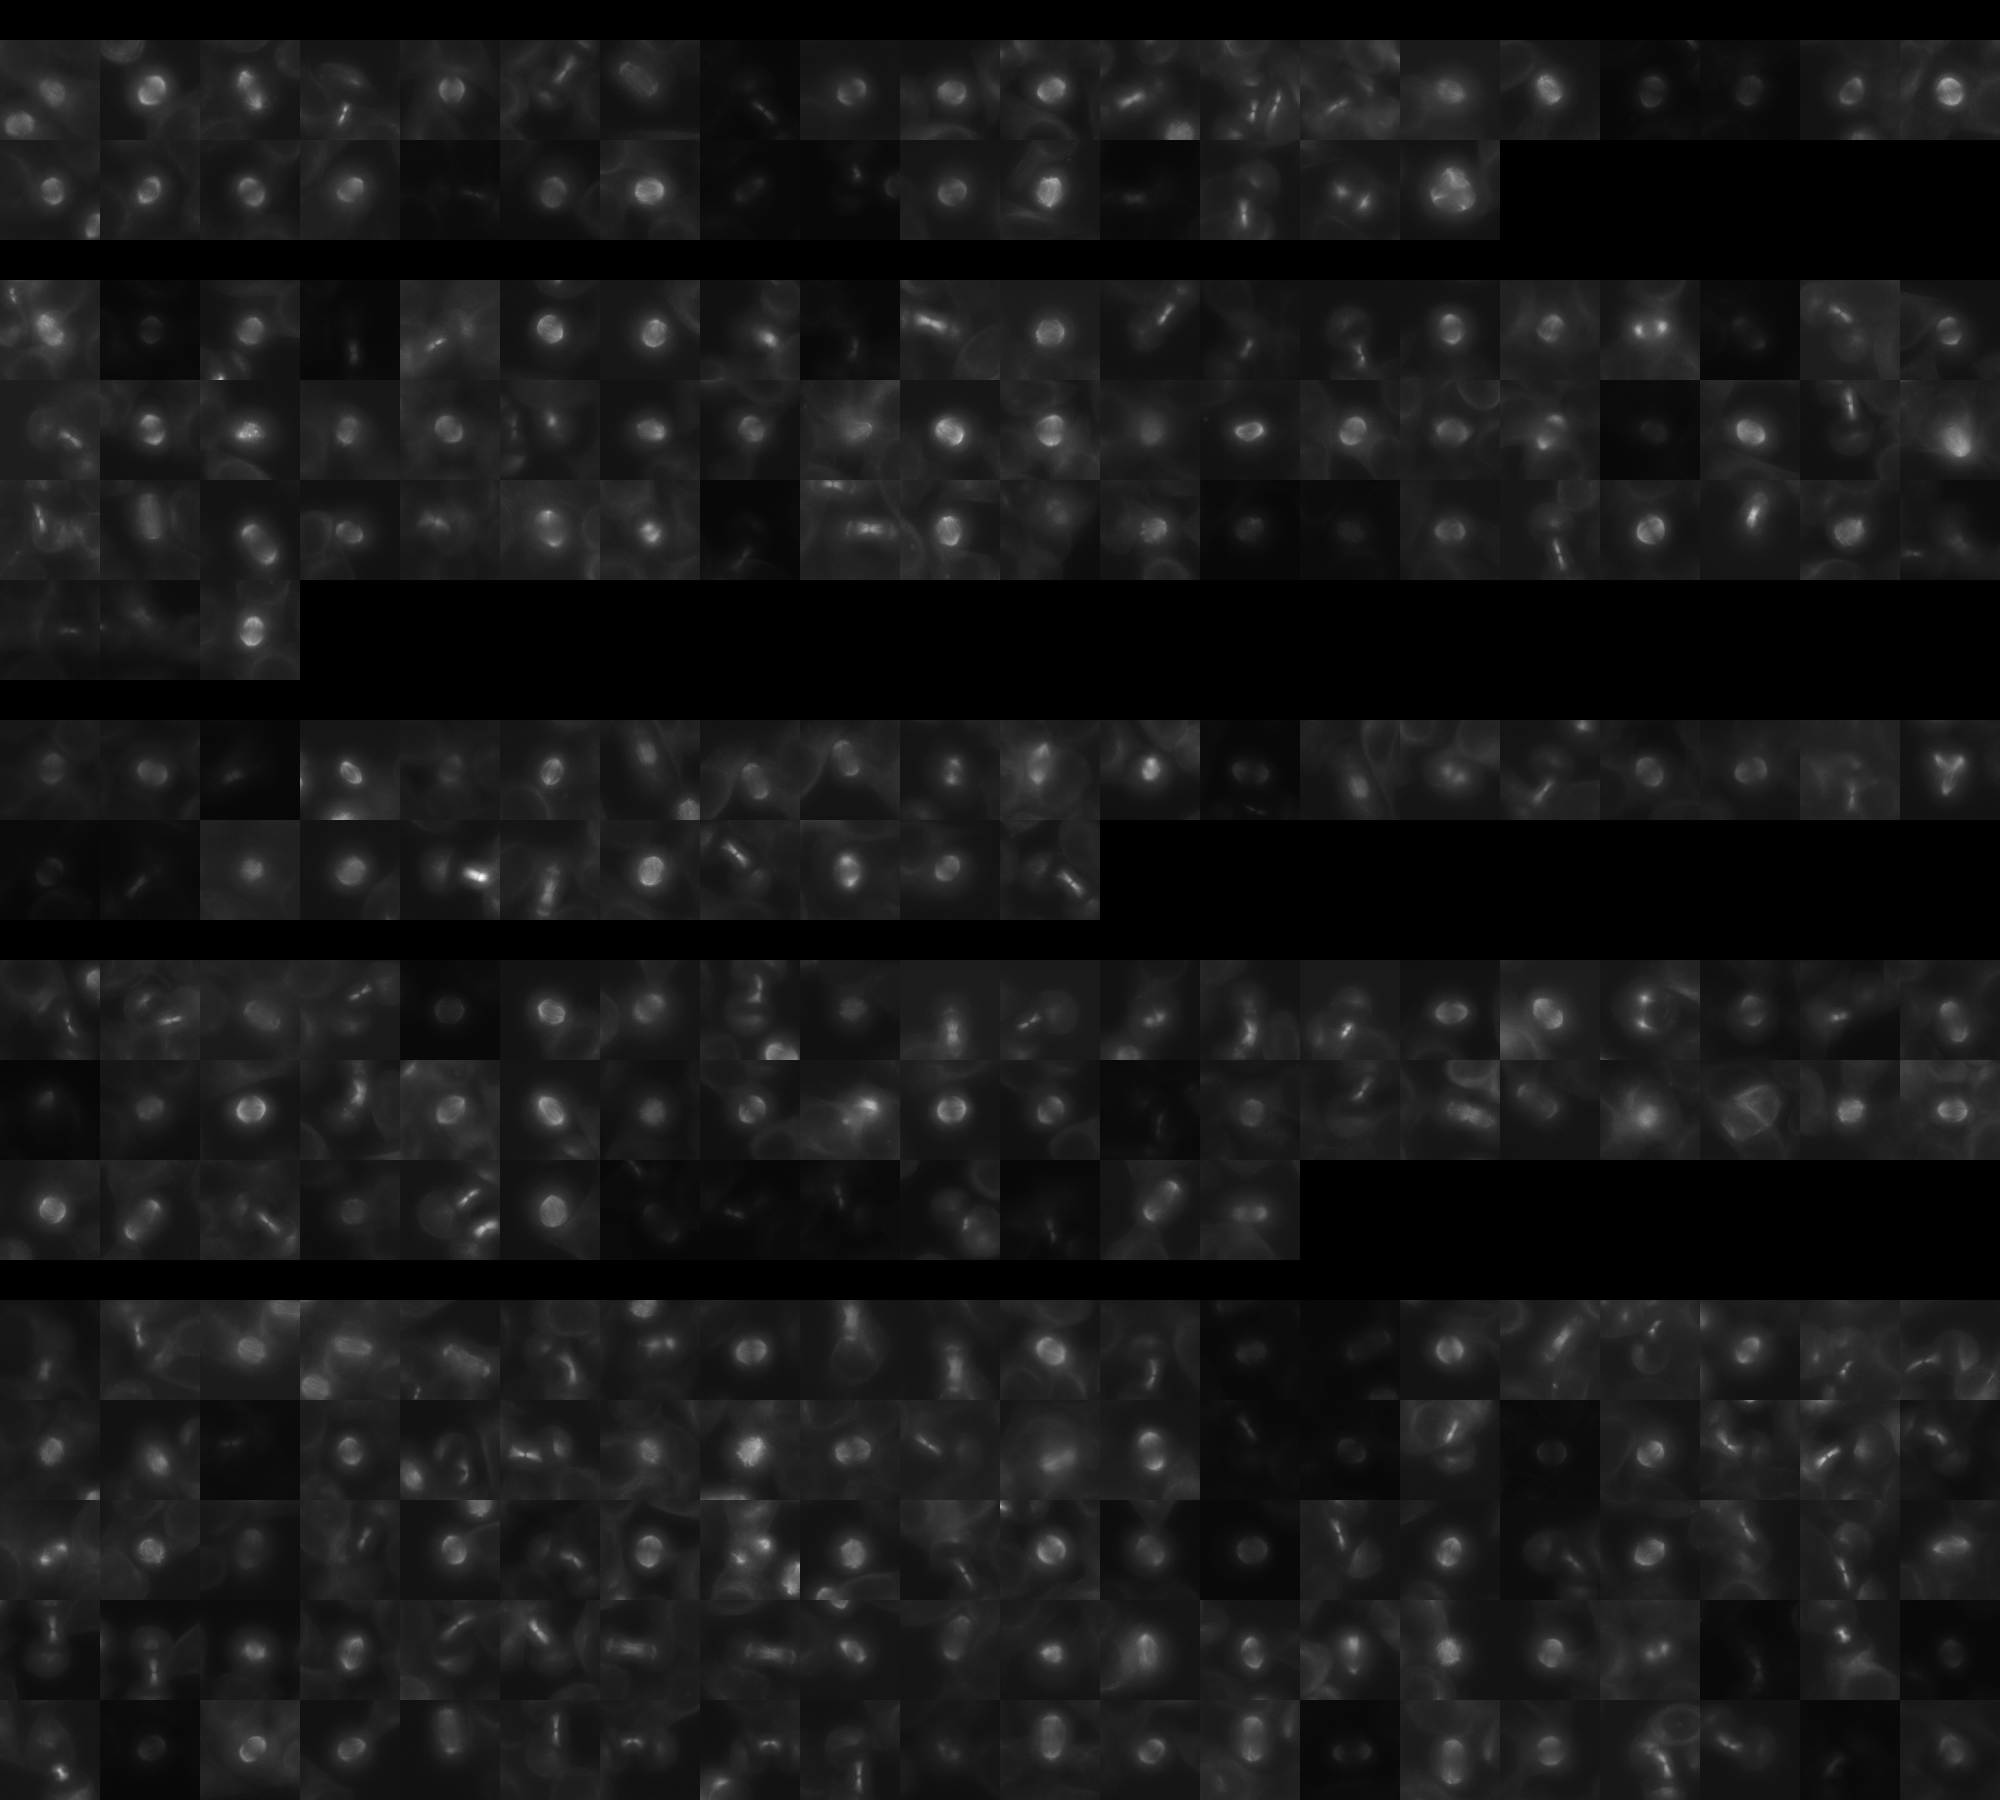
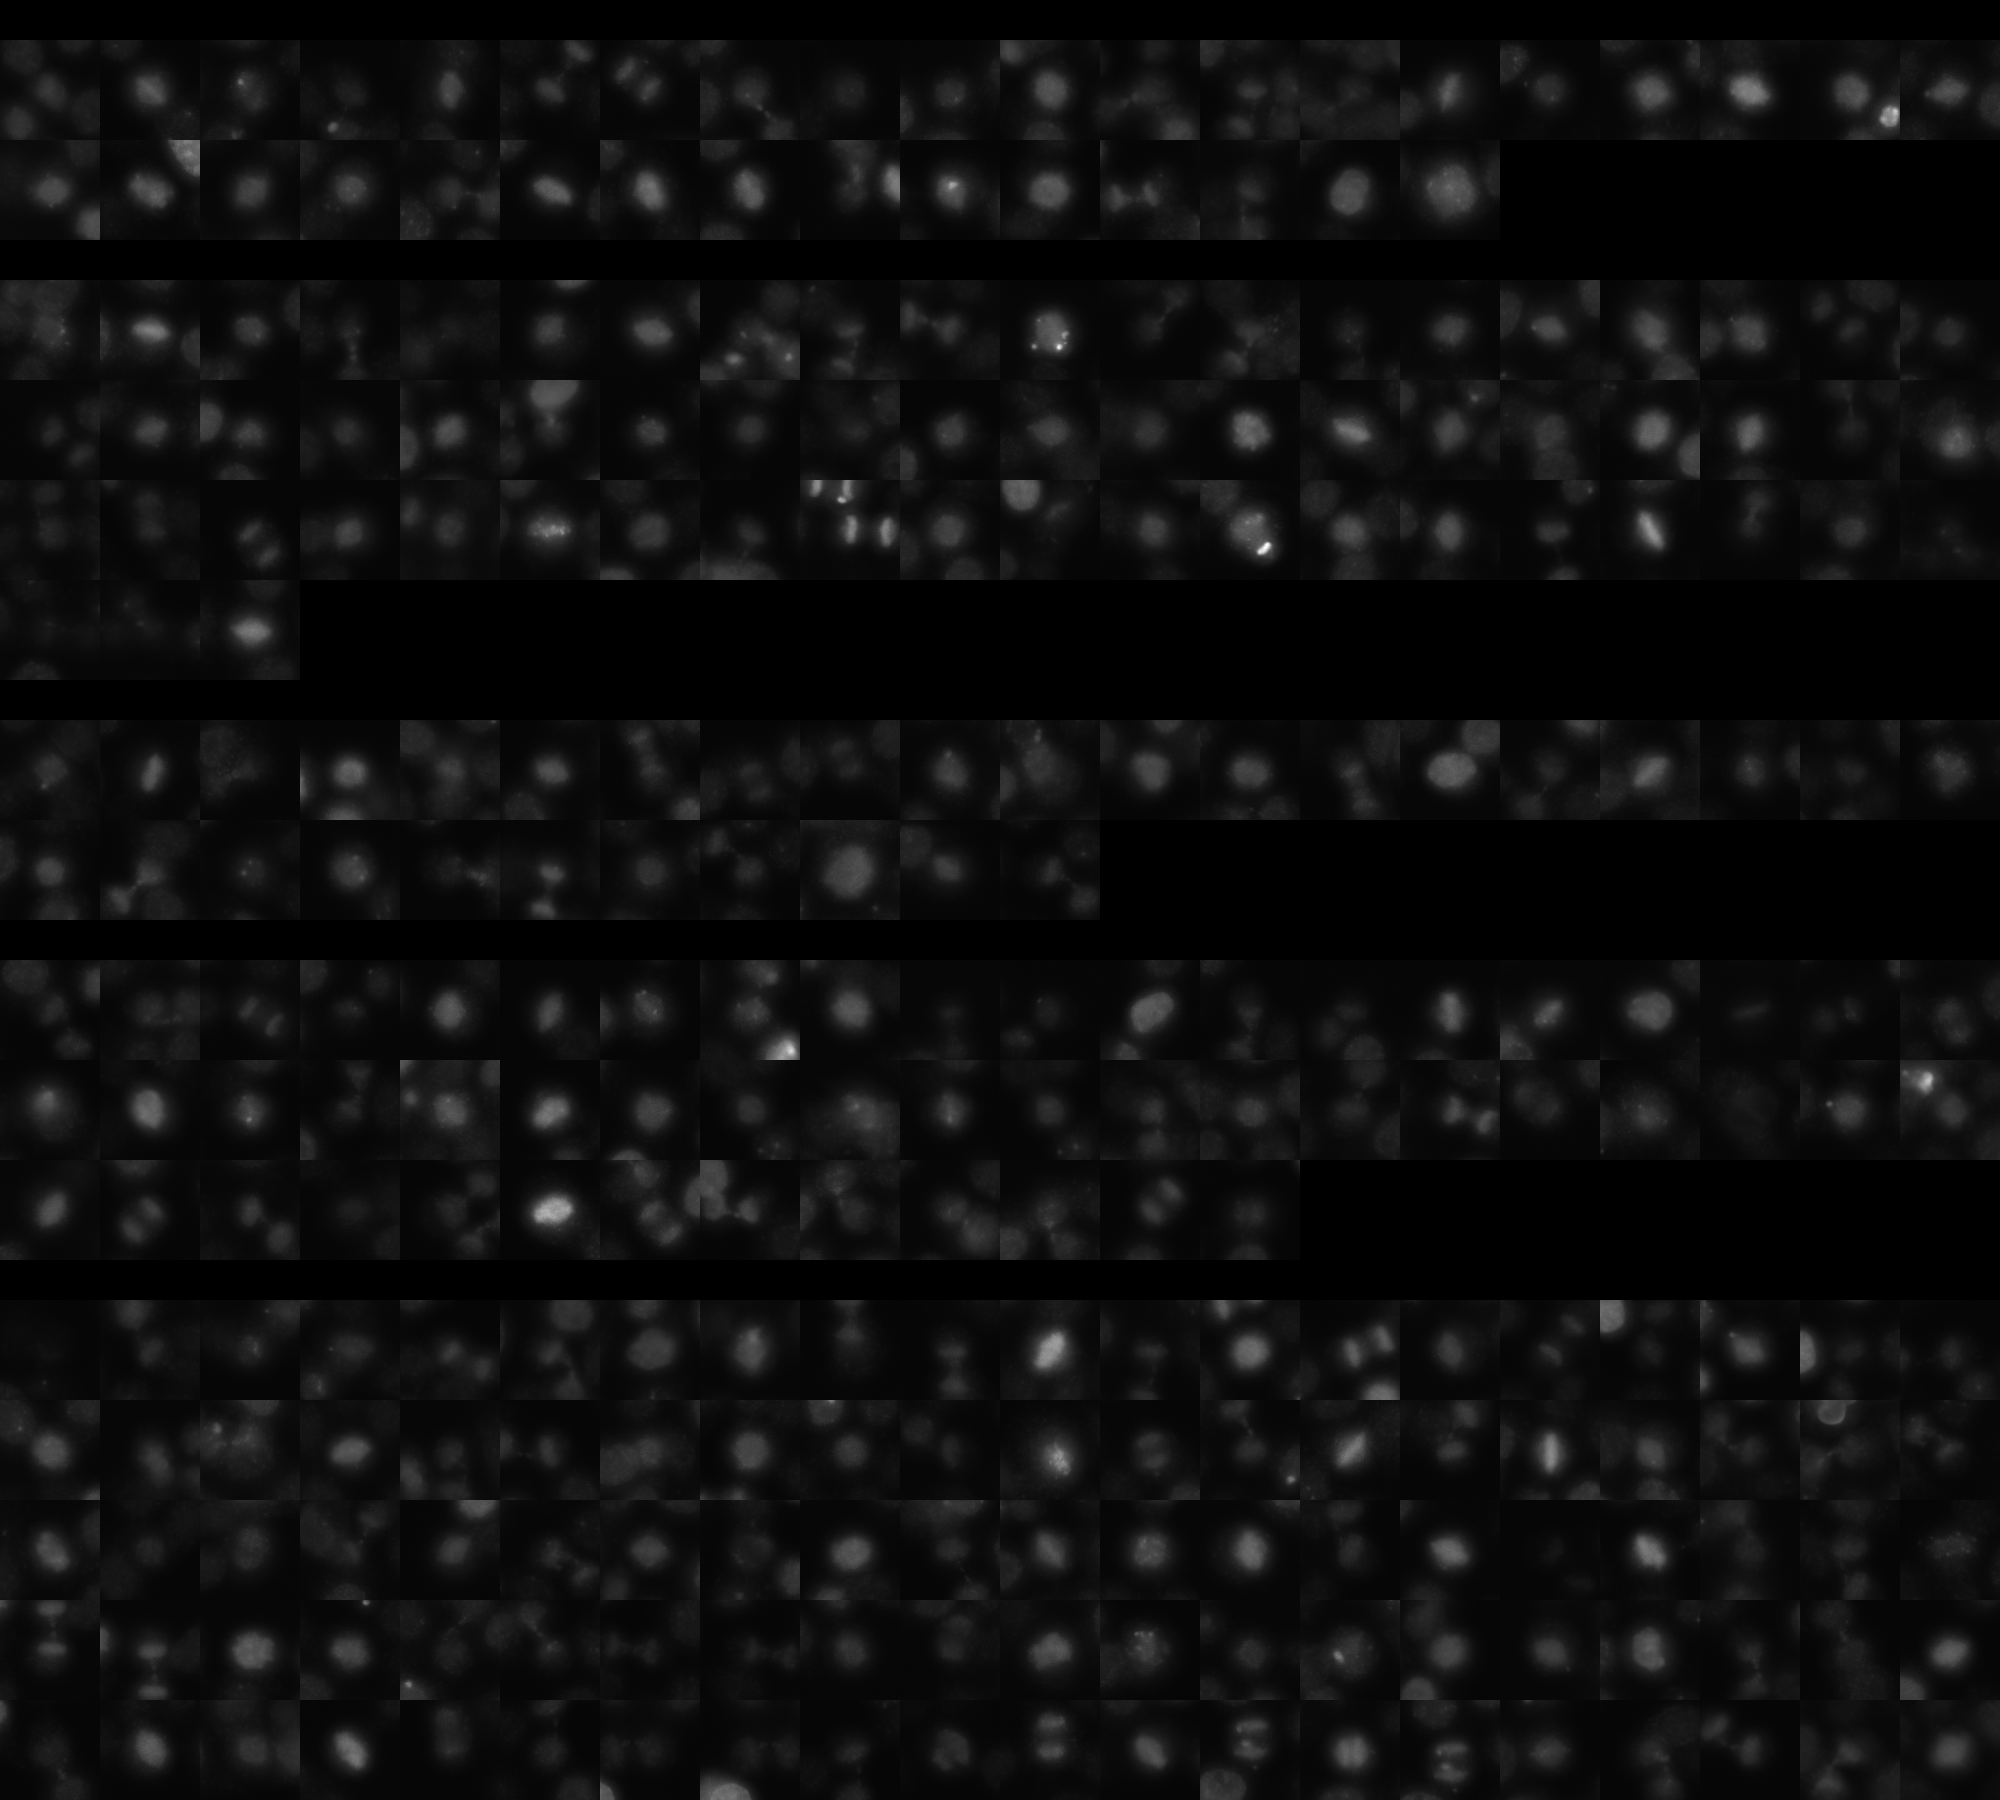
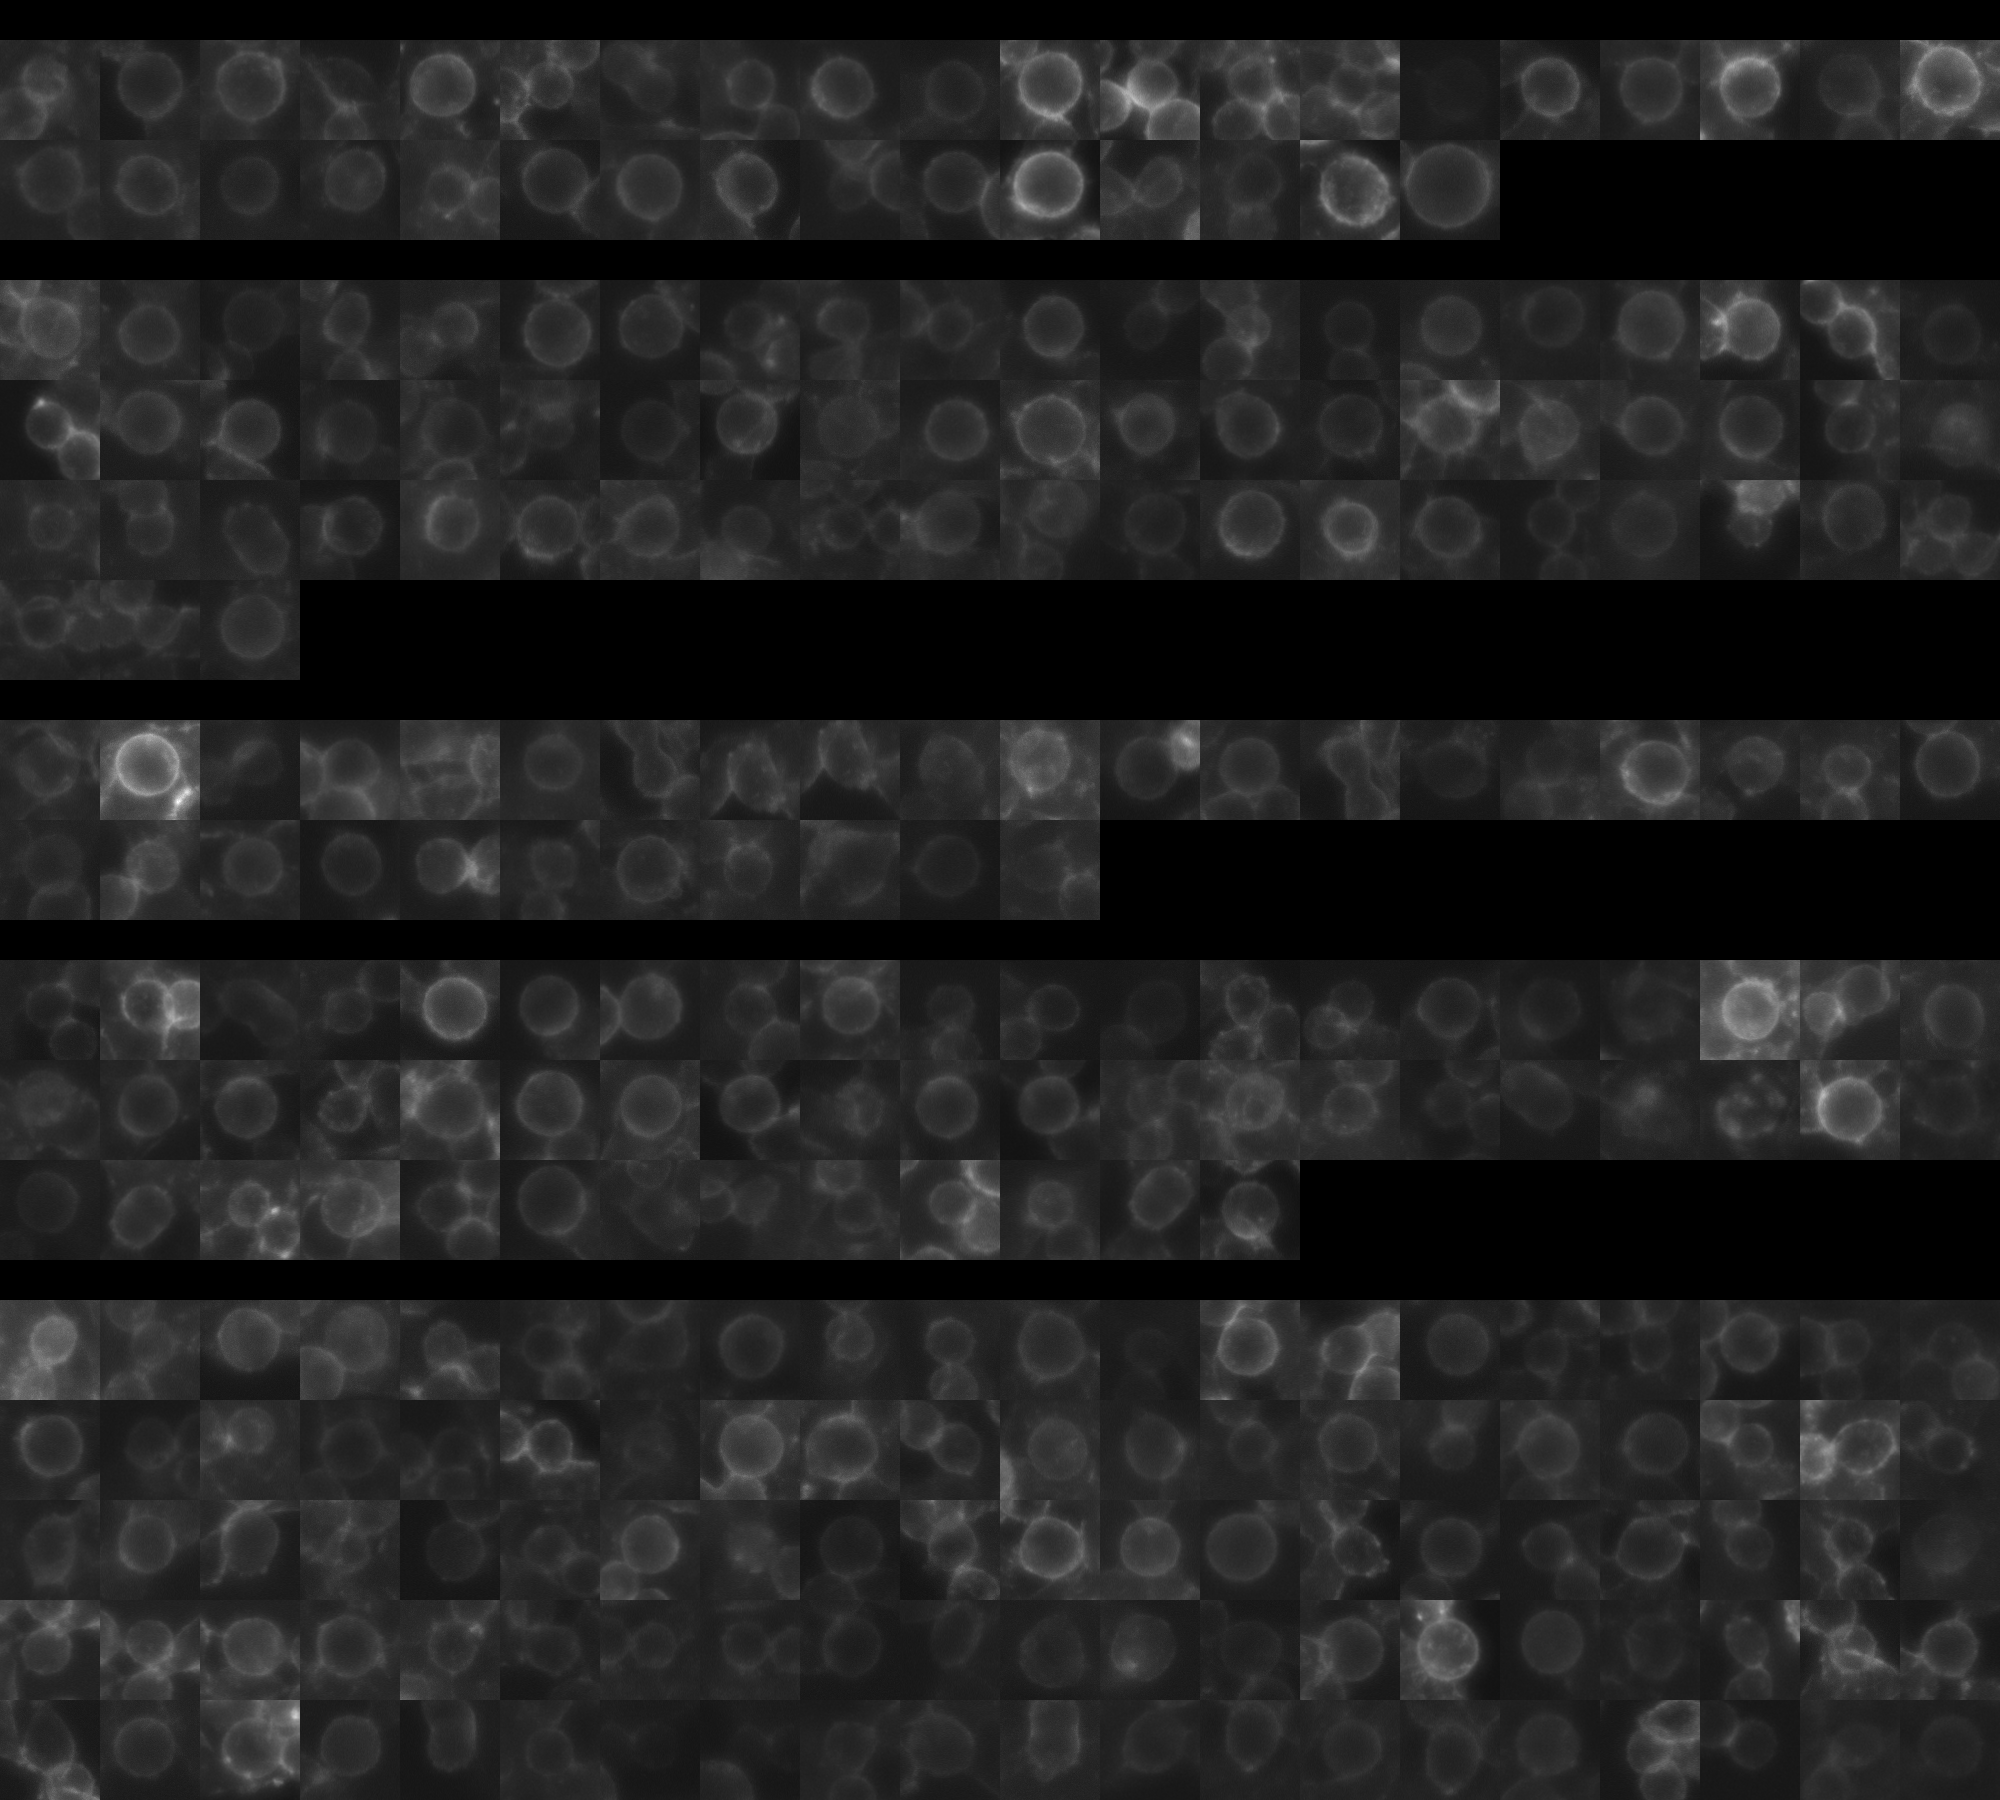
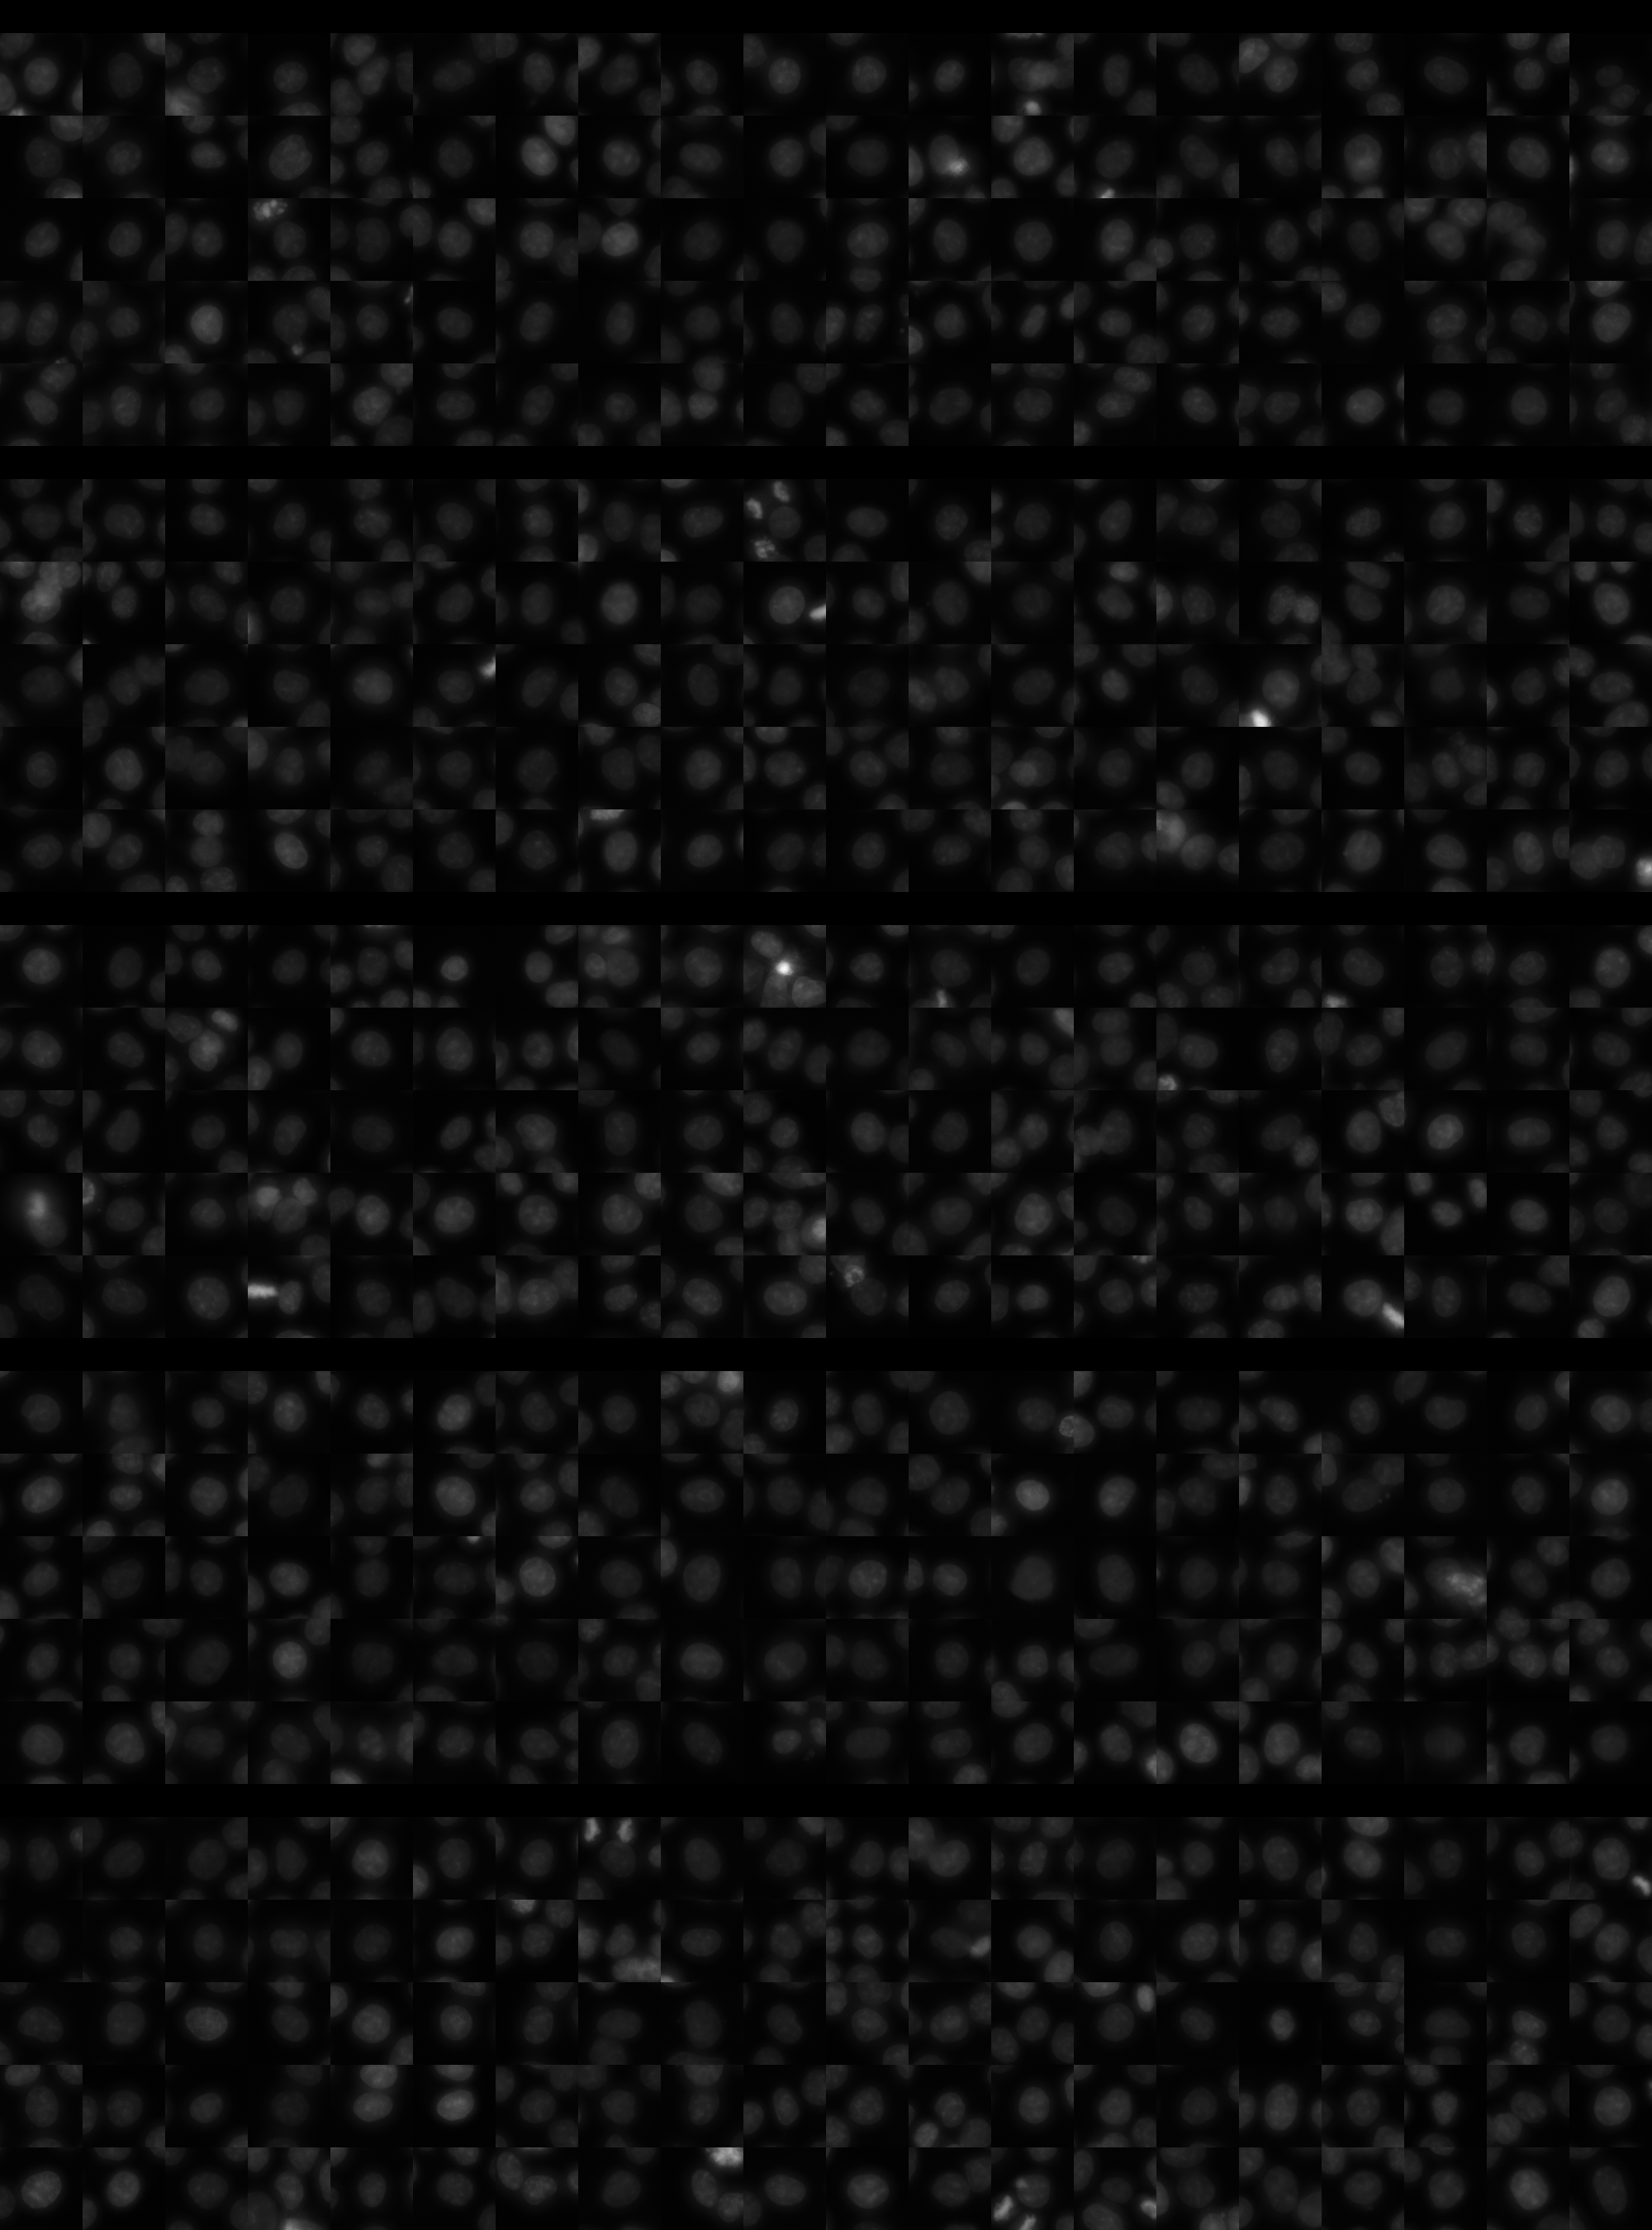
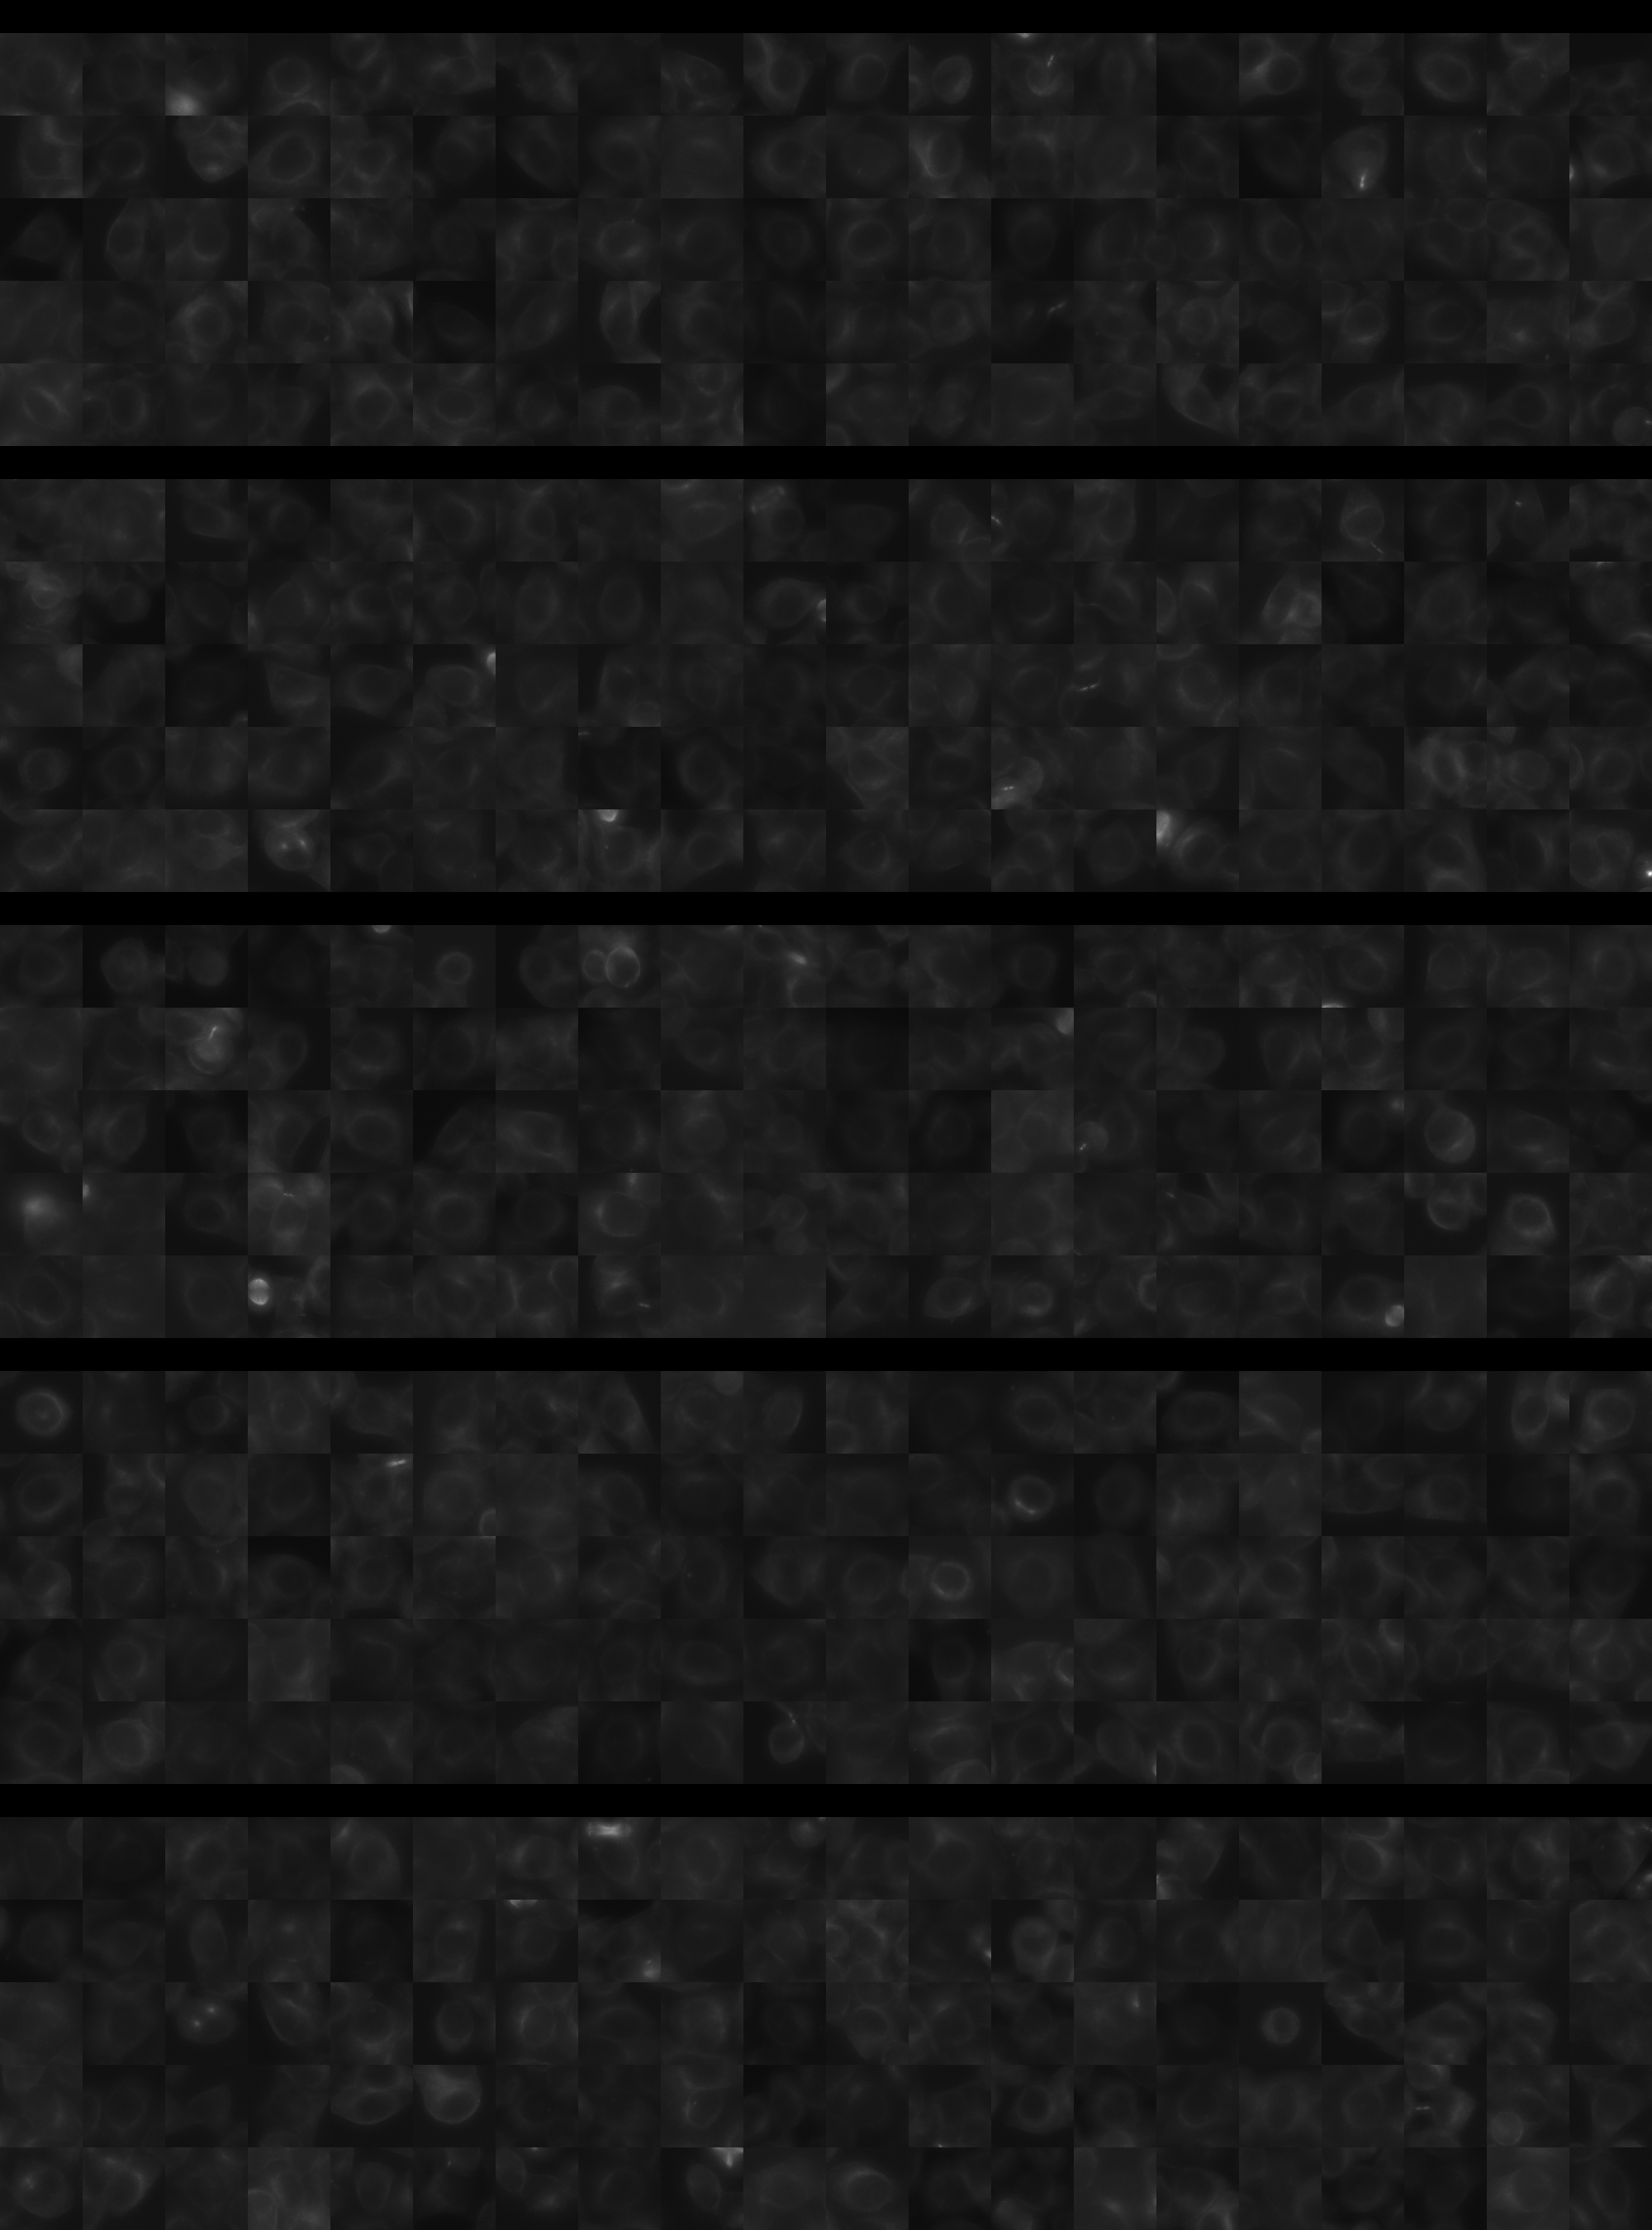
Each montage below shows randomly selected individual cell images for the same target gene separated by sgRNA, along with an example montage of cells expressing a non-targeting negative control sgRNA at the bottom. sgRNA labels in the montages correspond to the numbered sgRNA sequences in the gene info table above. The DNA (blue) and tubulin (green) channels are displayed by default, with gH2AX (grayscale) and actin (yellow) available using the check boxes. Channel brightness, contrast, and opacity are adjustable by clicking the arrow next to the channel name. When only one channel is selected, the display defaults to grayscale. Click the “Zoom” checkbox above the channel controls to enable image zooming (via scrolling) and panning (via click-and-drag).

The cell boxes displayed for this gene are square, 30.36 μm per side for the interphase montage and 30.36 μm per side for the mitotic montage.
Features

Interphase Score Rank FDR q-value
Nucleus DNA Integrated 0.037 1412 of 5322 0.598
Nucleus DNA Mean 0.007 1765 of 5322 0.856
Nucleus gH2AX Mean 0.016 4330 of 5322 0.676
Nucleus DNA - gH2AX Correlation 0.042 403 of 5322 0.200
Nucleus Shape Area 0.038 2036 of 5322 0.570
Nucleus Shape Eccentricity -2.281e-02 4296 of 5322 0.651
Nucleus Shape Form Factor 0.013 387 of 5322 0.617
Nucleus Shape Solidity 0.021 251 of 5322 0.500
Cell DNA Mass Displacement -1.905e-03 4463 of 5322 0.947
Cell Tubulin Mean 0.002 2713 of 5322 0.944
Cell Tubulin Mass Displacement 0.026 1464 of 5322 0.622
Cell Actin Mean -4.112e-03 3129 of 5322 0.972
Cell Tubulin - Actin Correlation 0.029 2255 of 5322 0.504
Cell DNA - Tubulin Correlation -1.651e-02 4362 of 5322 0.694
Cell Shape Area 0.010 2863 of 5322 0.986
Cell Shape Eccentricity -1.588e-02 4610 of 5322 0.884
Mitotic Score Rank FDR q-value
Nucleus DNA Integrated 0.162 1665 of 5322 0.907
Nucleus DNA Mean 0.112 1319 of 5322 1.000
Nucleus DNA Mass Displacement 0.124 1565 of 5322 0.999
Nucleus DNA Mean Frac 3 -1.022e-01 4456 of 5322 1.000
Nucleus gH2AX Mean -4.330e-02 3557 of 5322 1.000
Nucleus gH2AX Mean Frac 0 0.056 1474 of 5322 1.000
Nucleus Tubulin Mean Frac 0 -7.744e-02 4482 of 5322 0.999
Nucleus Tubulin Mean Edge 0.080 2121 of 5322 0.999
Nucleus Tubulin Std Edge -9.134e-04 2573 of 5322 0.999
Nucleus Shape Area 0.030 3613 of 5322 0.990
Nucleus Shape Eccentricity 0.133 573 of 5322 1.000
Nucleus Shape Form Factor -3.806e-02 1928 of 5322 0.998
Cell Tubulin Mean 0.002 3481 of 5322 1.000
Cell Tubulin Mean Frac 3 0.026 1395 of 5322 0.999
Cell Actin Mean 0.081 2121 of 5322 0.997
Cell Shape Area -1.255e-01 4918 of 5322 0.994
( Reset Zoom )
Brightness
Contrast
Opacity
Brightness
Contrast
Opacity
Brightness
Contrast
Opacity
Brightness
Contrast
Opacity
Brightness
Contrast
Opacity

( Reset Zoom )
Brightness
Contrast
Opacity
Brightness
Contrast
Opacity
Brightness
Contrast
Opacity
Brightness
Contrast
Opacity
Brightness
Contrast
Opacity

MIT Central Accessability