MAPRE1

Gene symbol: MAPRE1
Gene: 22919
Uniprot Function: Plus-end tracking protein (+TIP) that binds to the plus-end of microtubules and regulates the dynamics of the microtubule cytoskeleton (PubMed:12388762, PubMed:16109370, PubMed:19632184, PubMed:21646404, PubMed:28726242, PubMed:28814570). Promotes cytoplasmic microtubule nucleation and elongation (PubMed:12388762, PubMed:16109370, PubMed:19632184, PubMed:21646404, PubMed:28726242, PubMed:28814570). May be involved in spindle function by stabilizing microtubules and anchoring them at centrosomes (PubMed:12388762). Also acts as a regulator of minus-end microtubule organization: interacts with the complex formed by AKAP9 and PDE4DIP, leading to recruit CAMSAP2 to the Golgi apparatus, thereby tethering non-centrosomal minus-end microtubules to the Golgi, an important step for polarized cell movement (PubMed:28814570). Promotes elongation of CAMSAP2-decorated microtubule stretches on the minus-end of microtubules (PubMed:28814570). Acts as a regulator of autophagosome transport via interaction with CAMSAP2 (PubMed:28726242). May play a role in cell migration (By similarity).
Mitotic Index 0.0279
Interphase Cluster: #178 (14 genes)
Mitotic Cluster: #140 (20 genes)
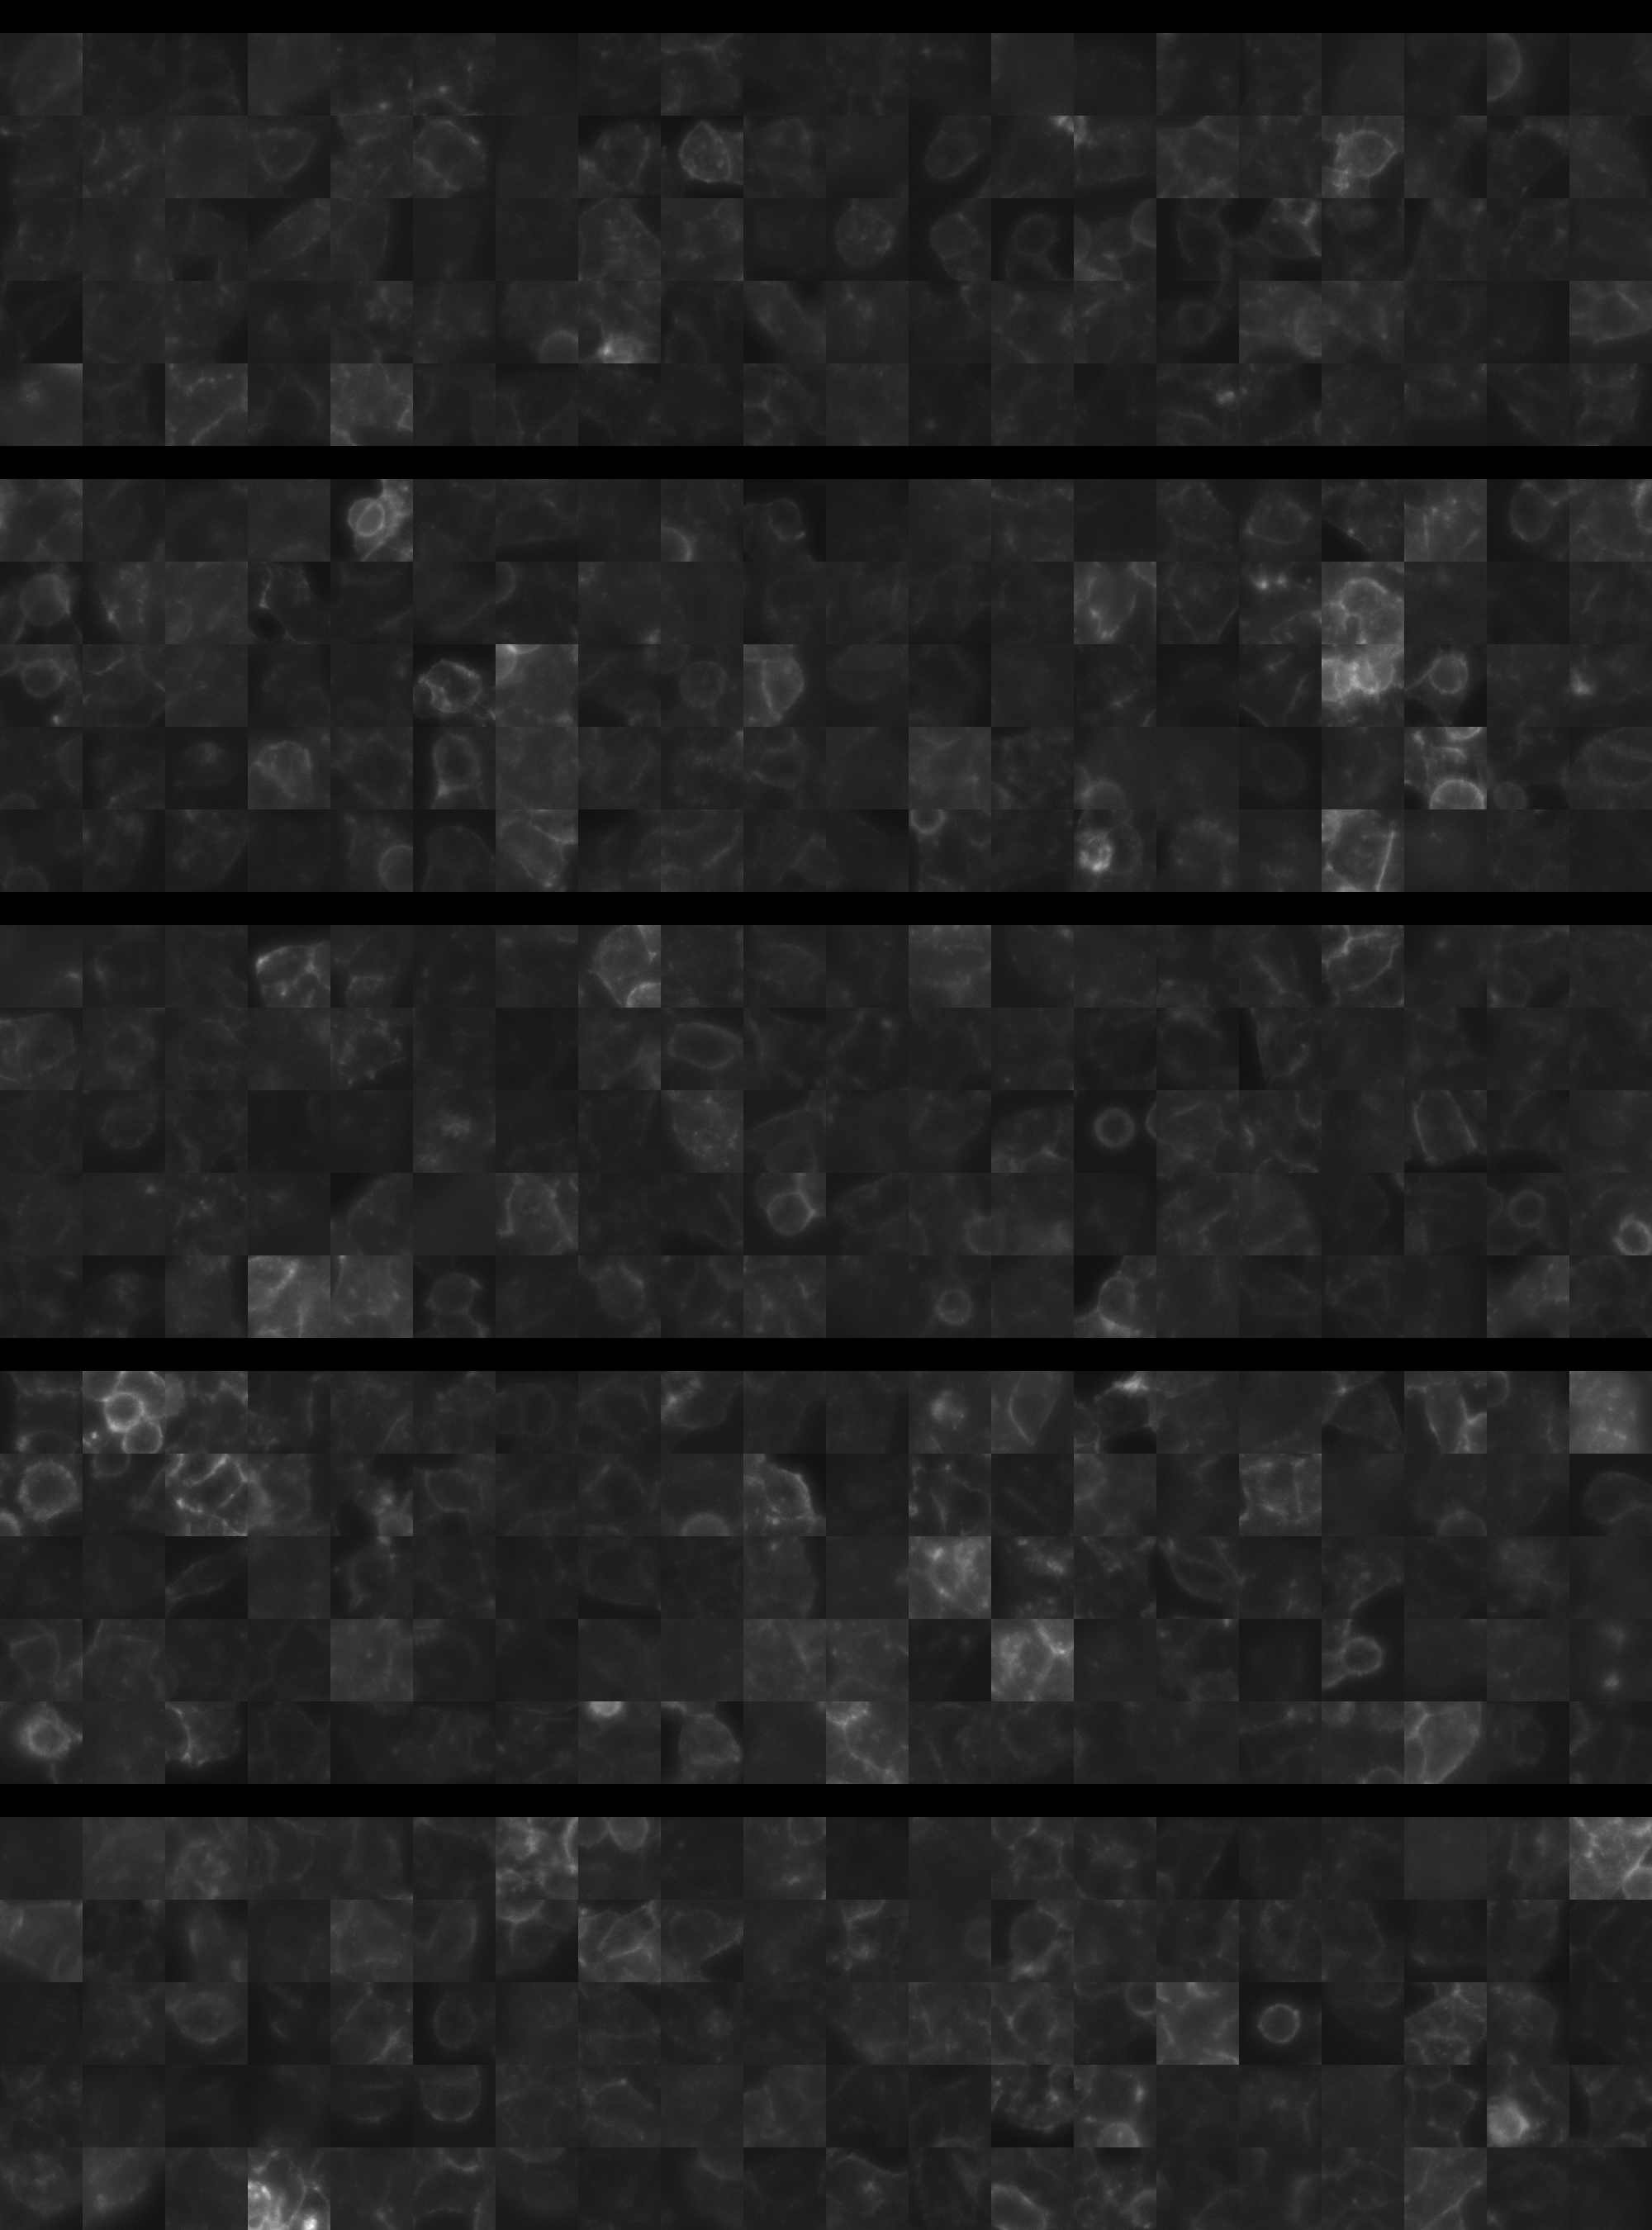
sgRNA 1: AAGATCGAACAGTTGTGCTC (interphase cells: 540, mitotic cells: 17)
sgRNA 2: CTCAACACAGAGAACCGCTG (interphase cells: 2297, mitotic cells: 53)
sgRNA 3: TATTCAGAGCTGGAGCAACA (interphase cells: 1955, mitotic cells: 67)
sgRNA 4: TGGAAAAGACTATGACCCTG (interphase cells: 2761, mitotic cells: 80)

Interphase Cluster

Mitotic Cluster

Overview

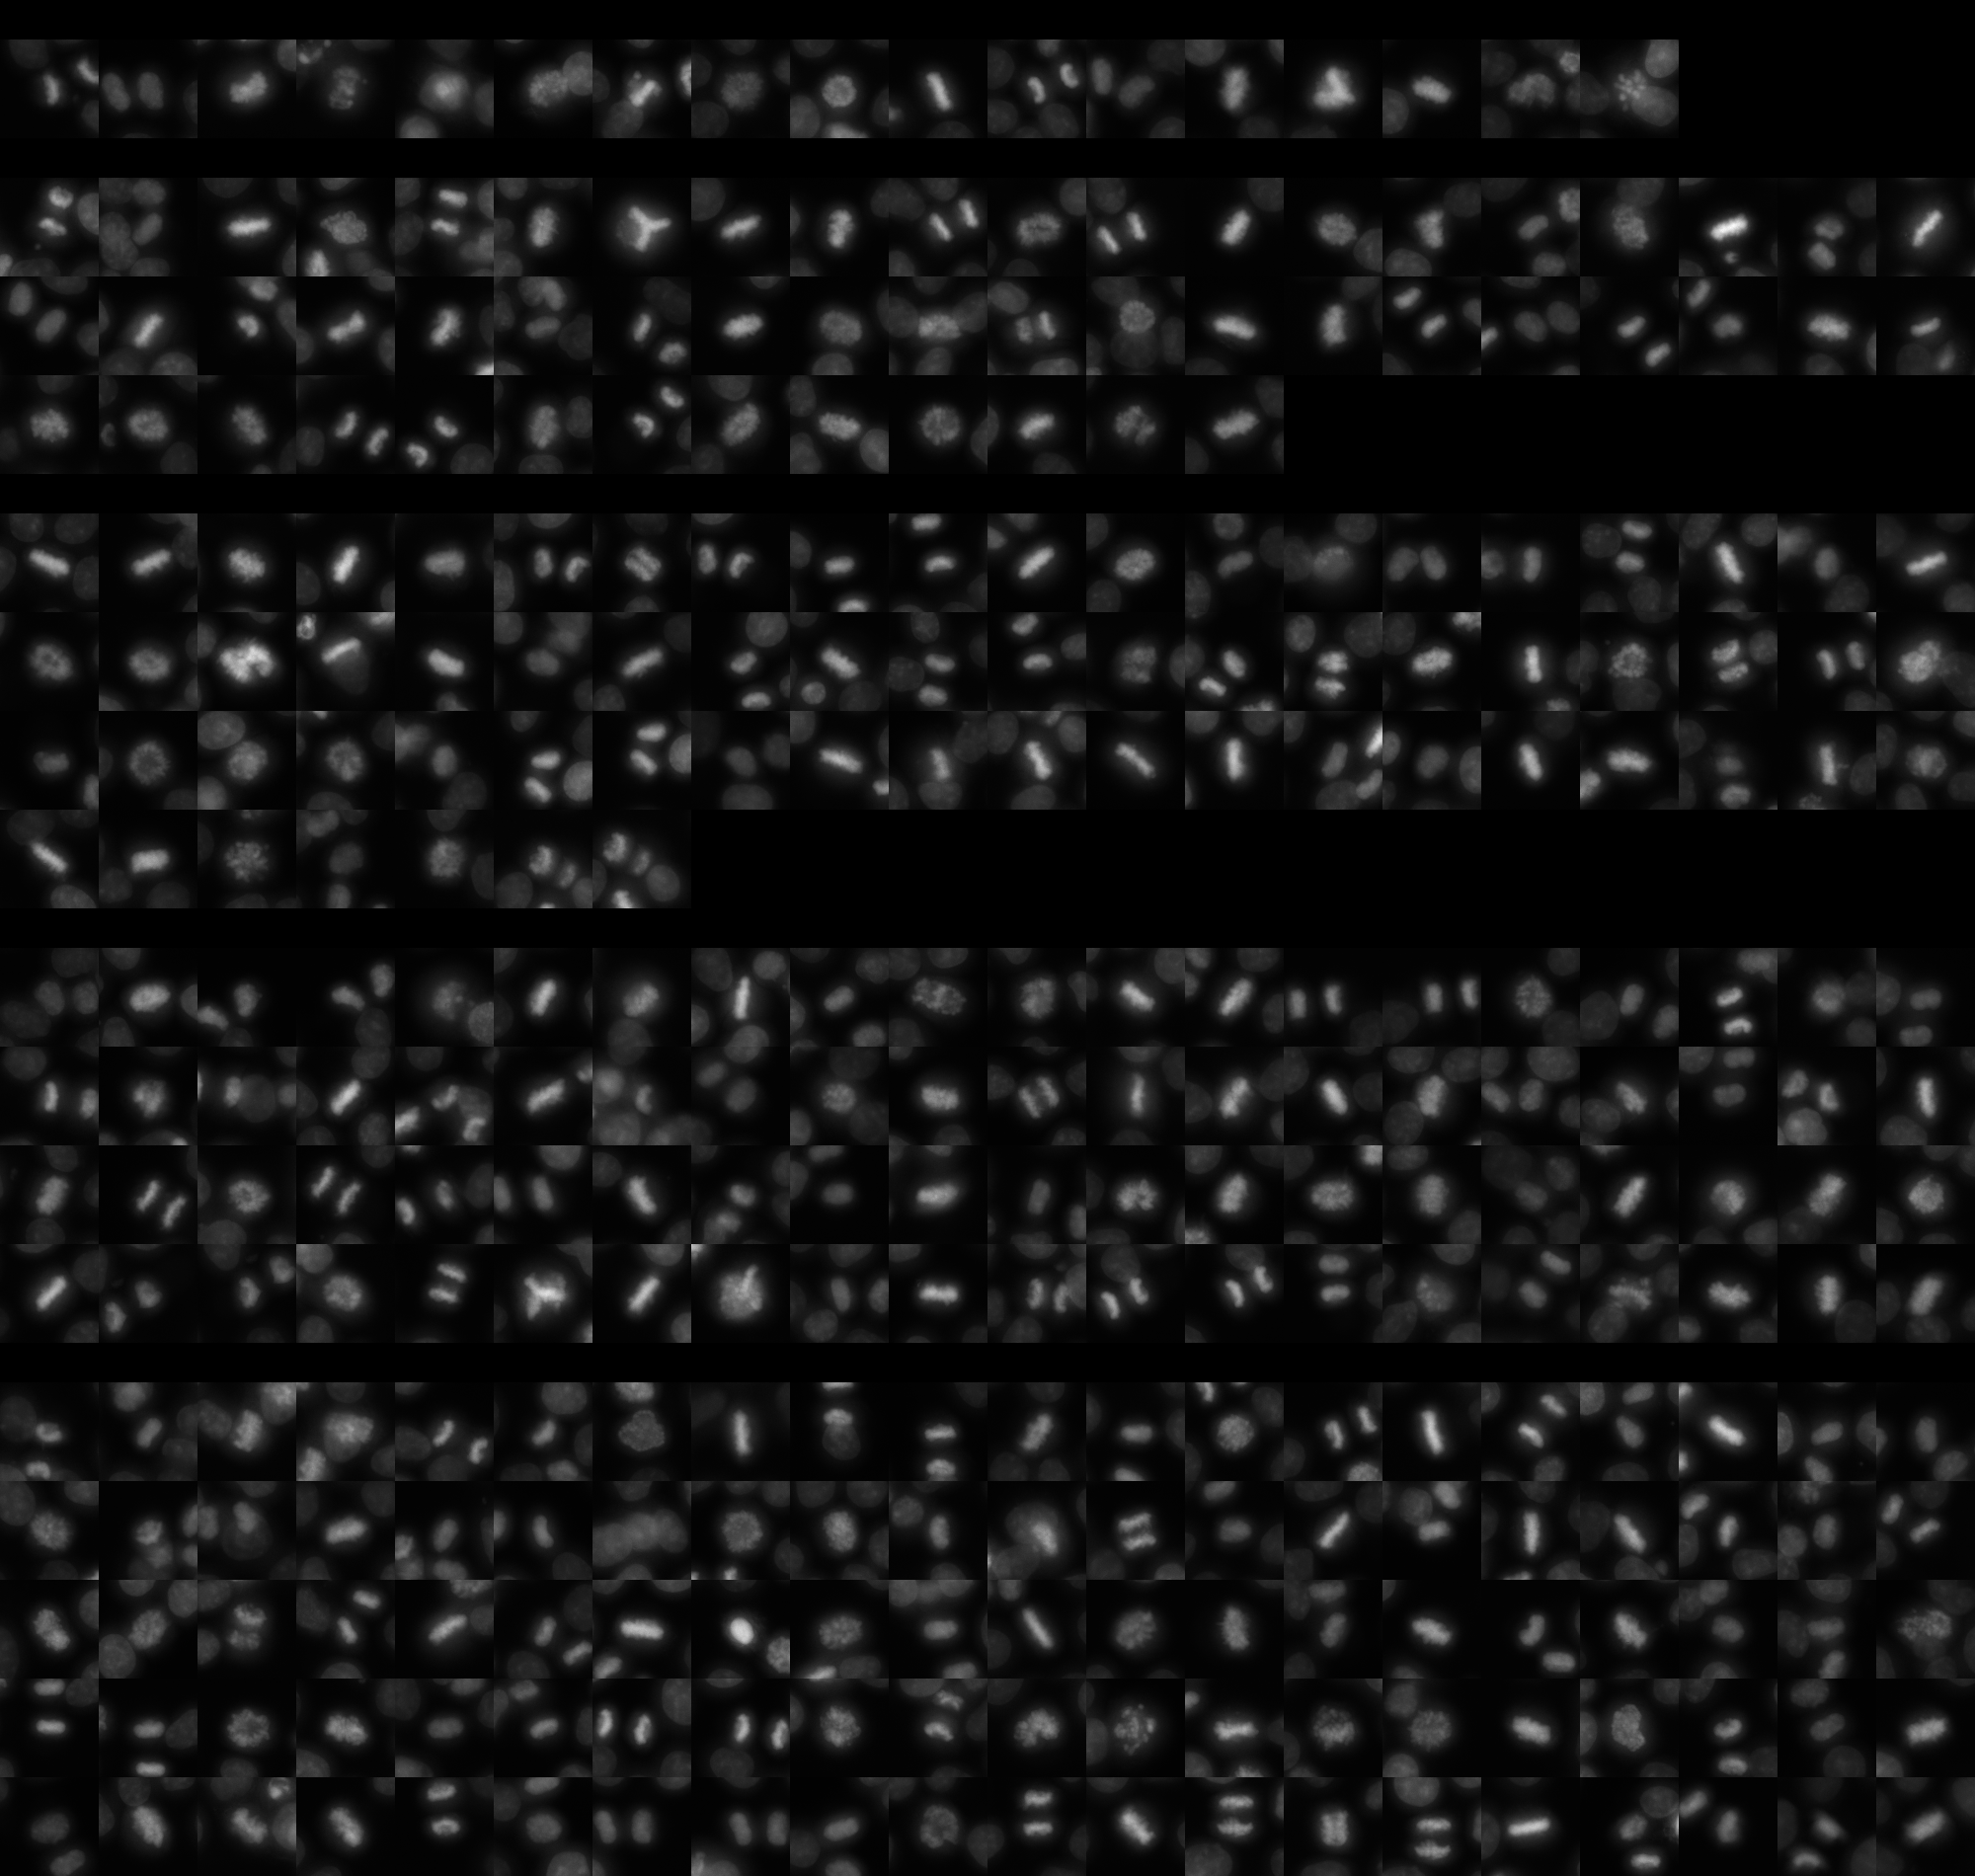
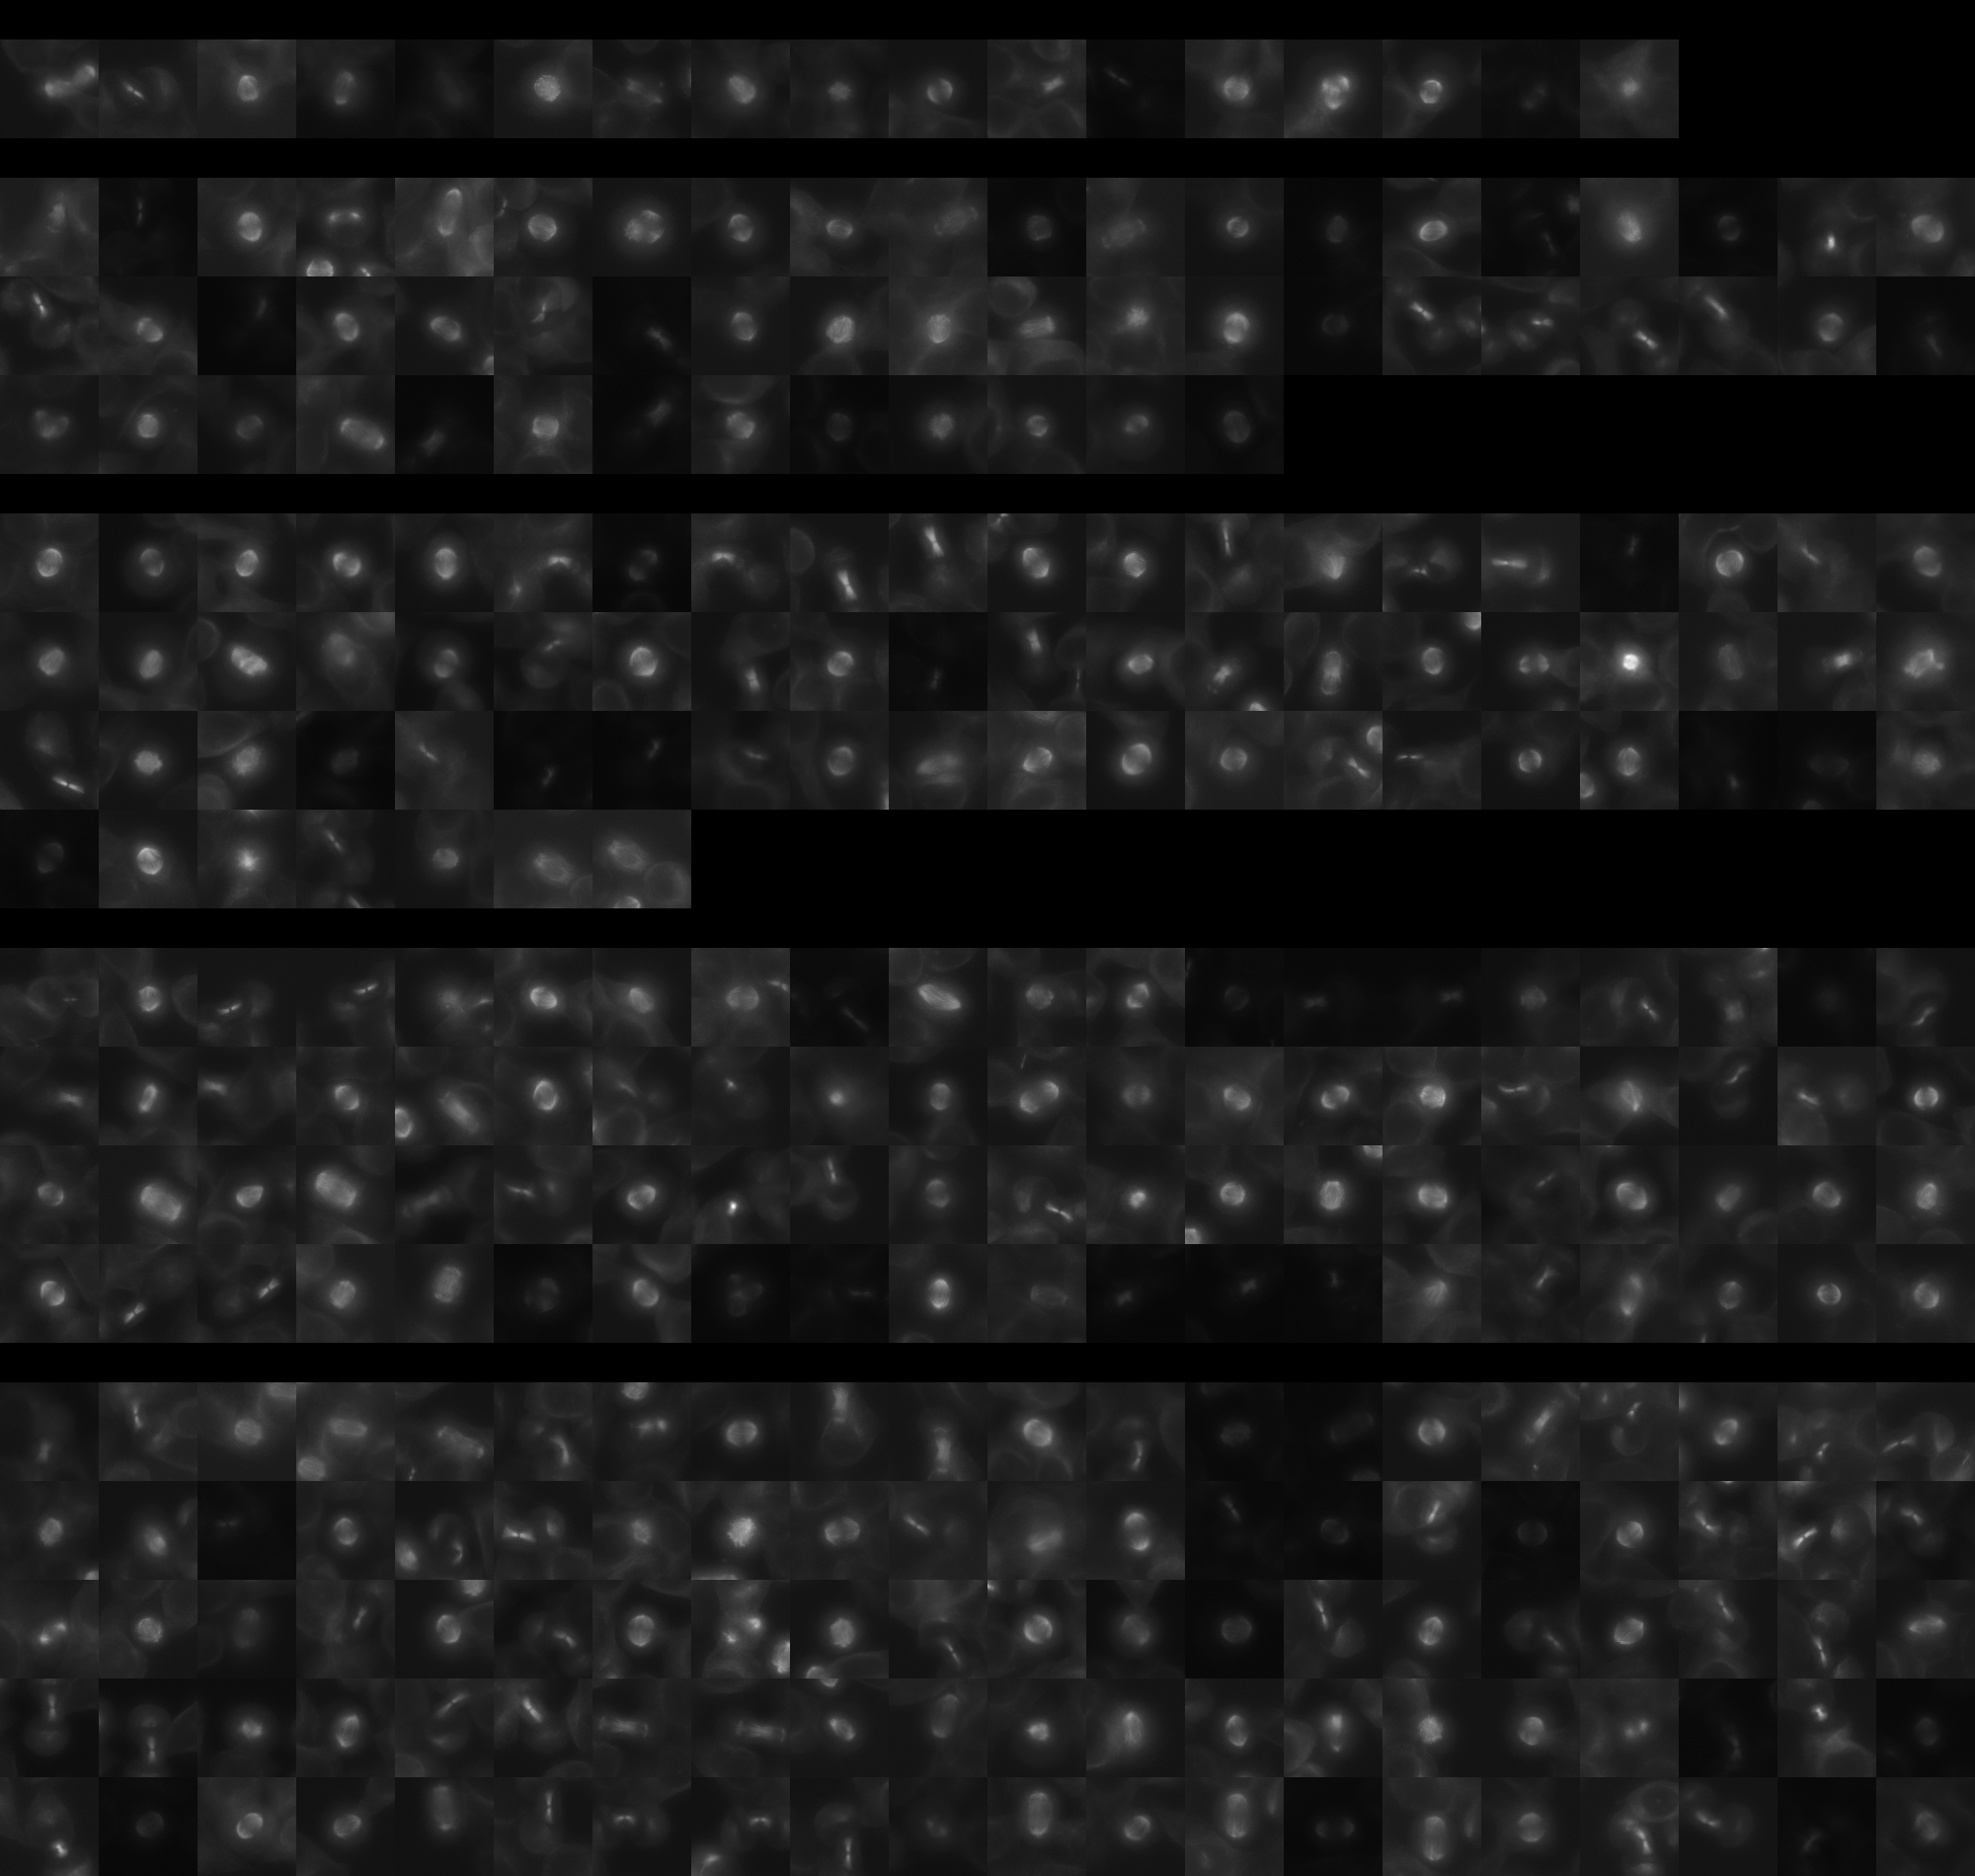
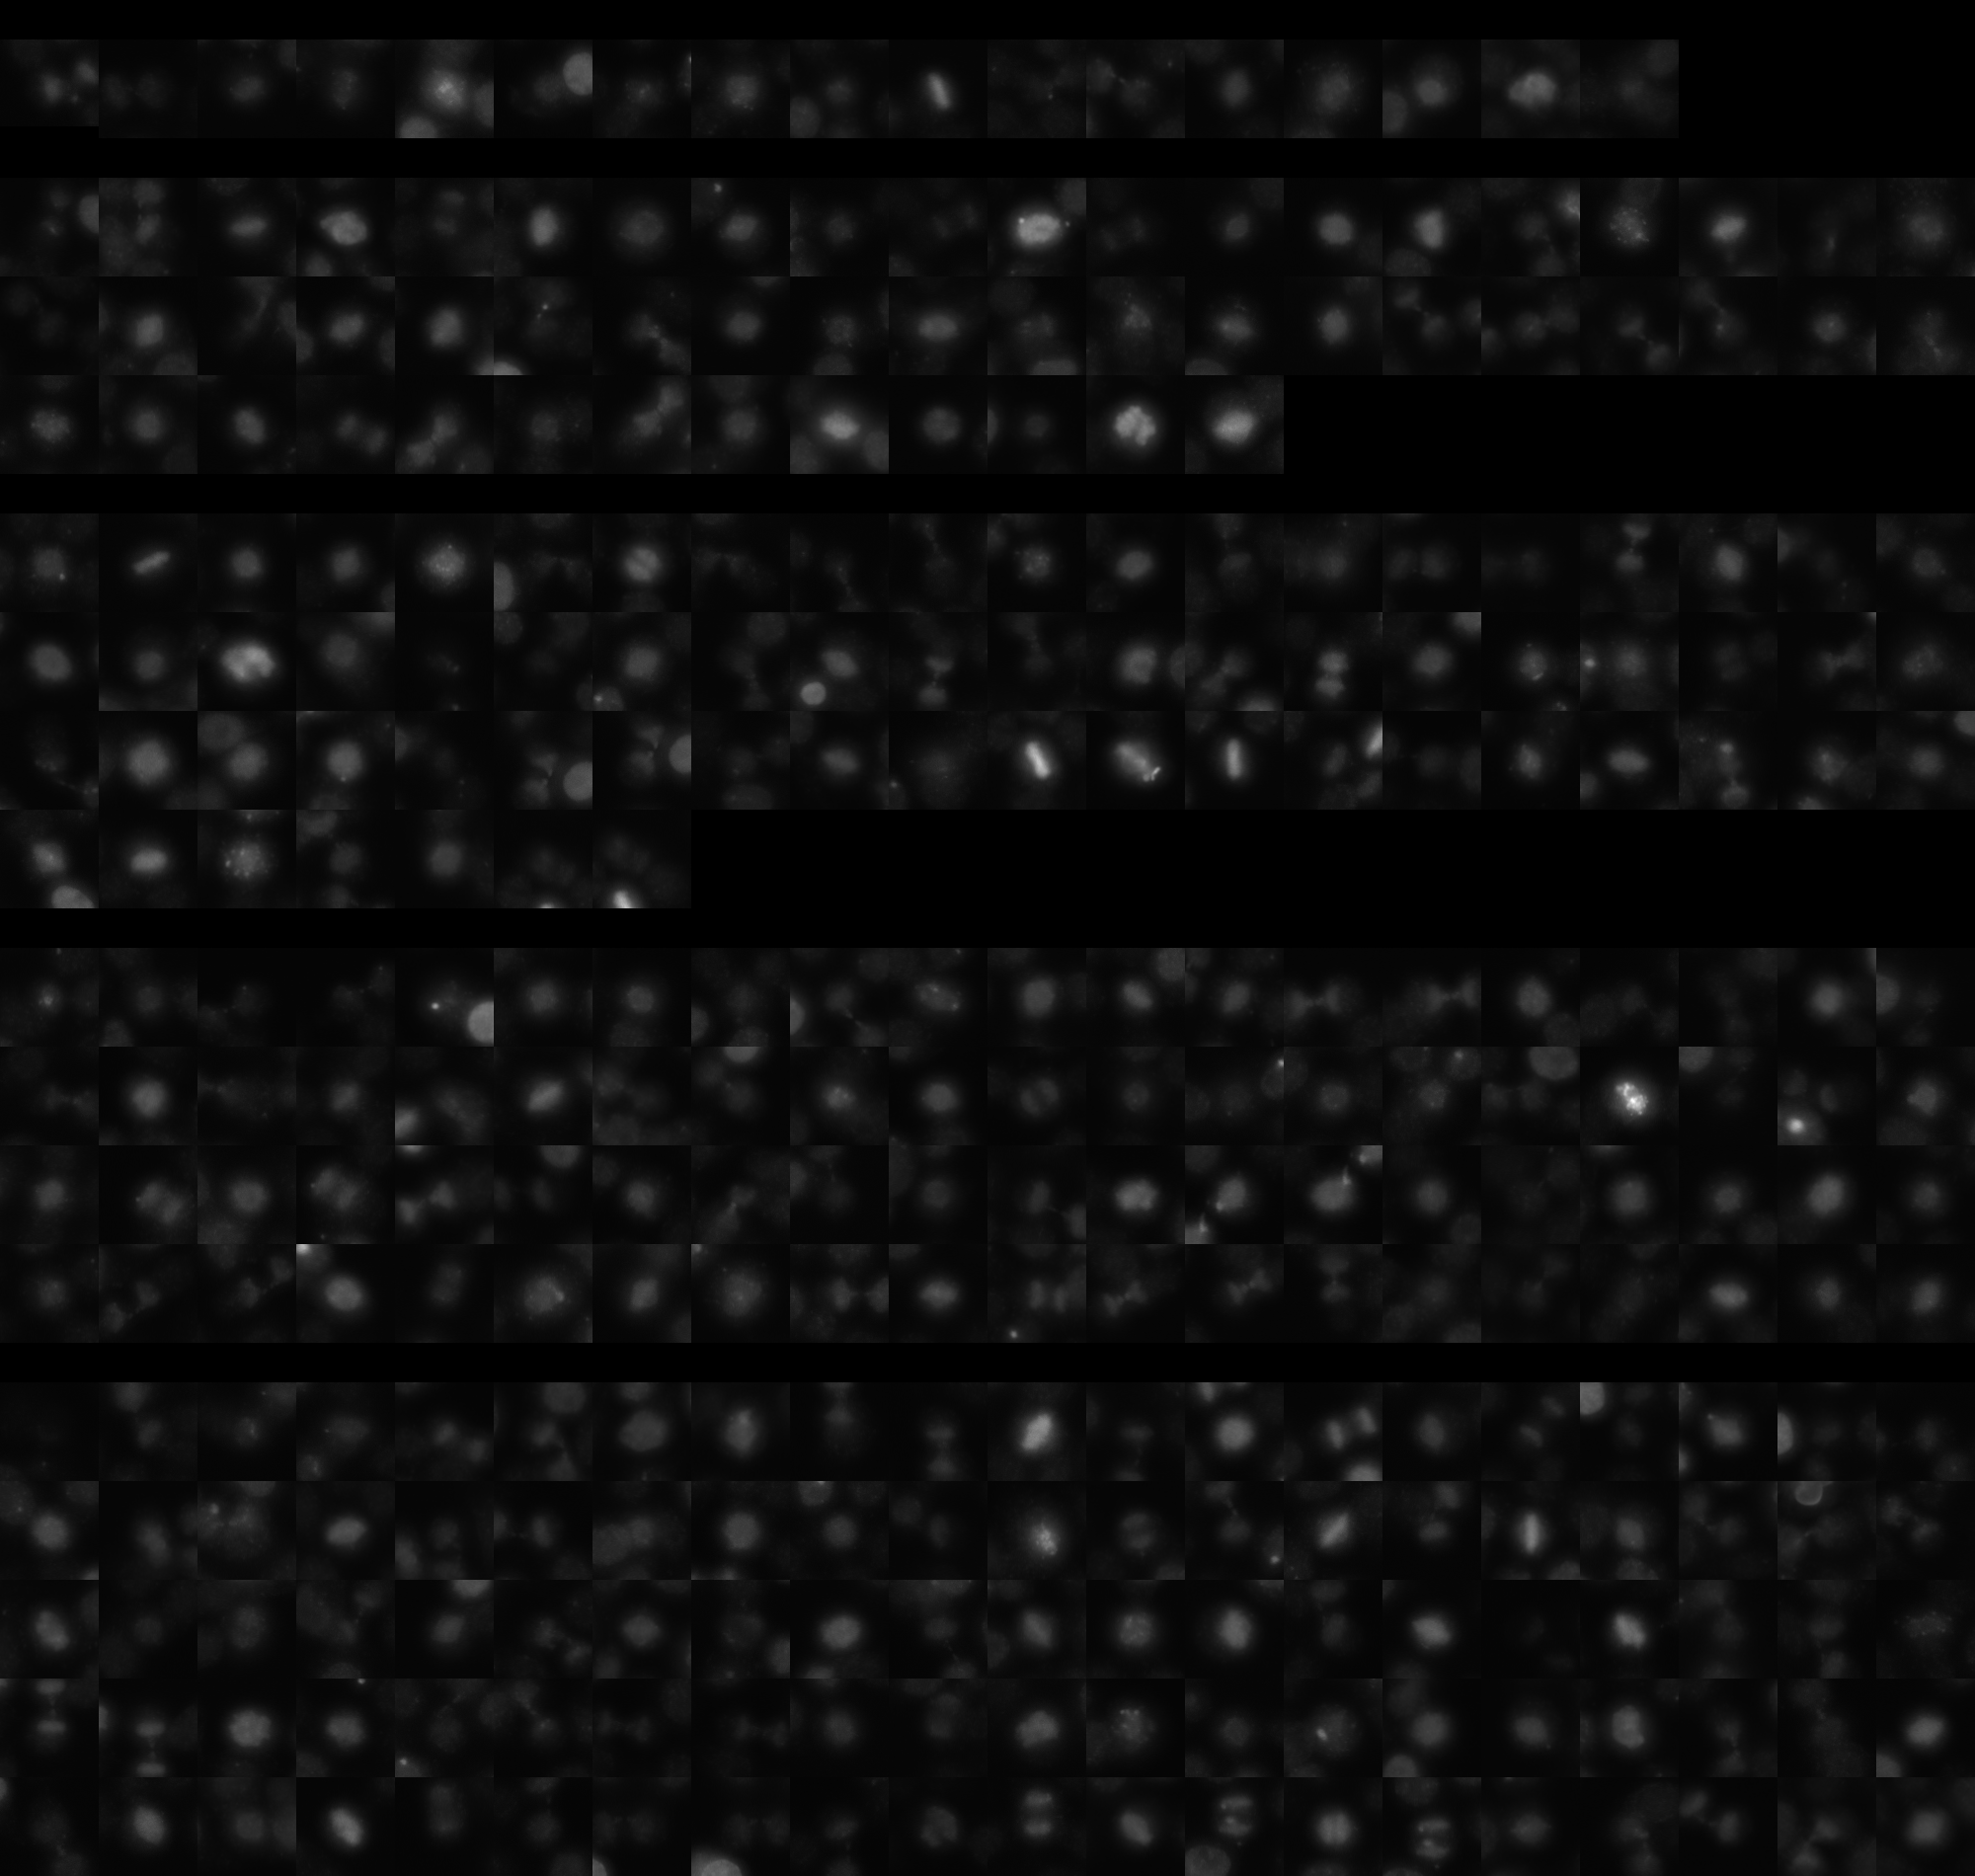
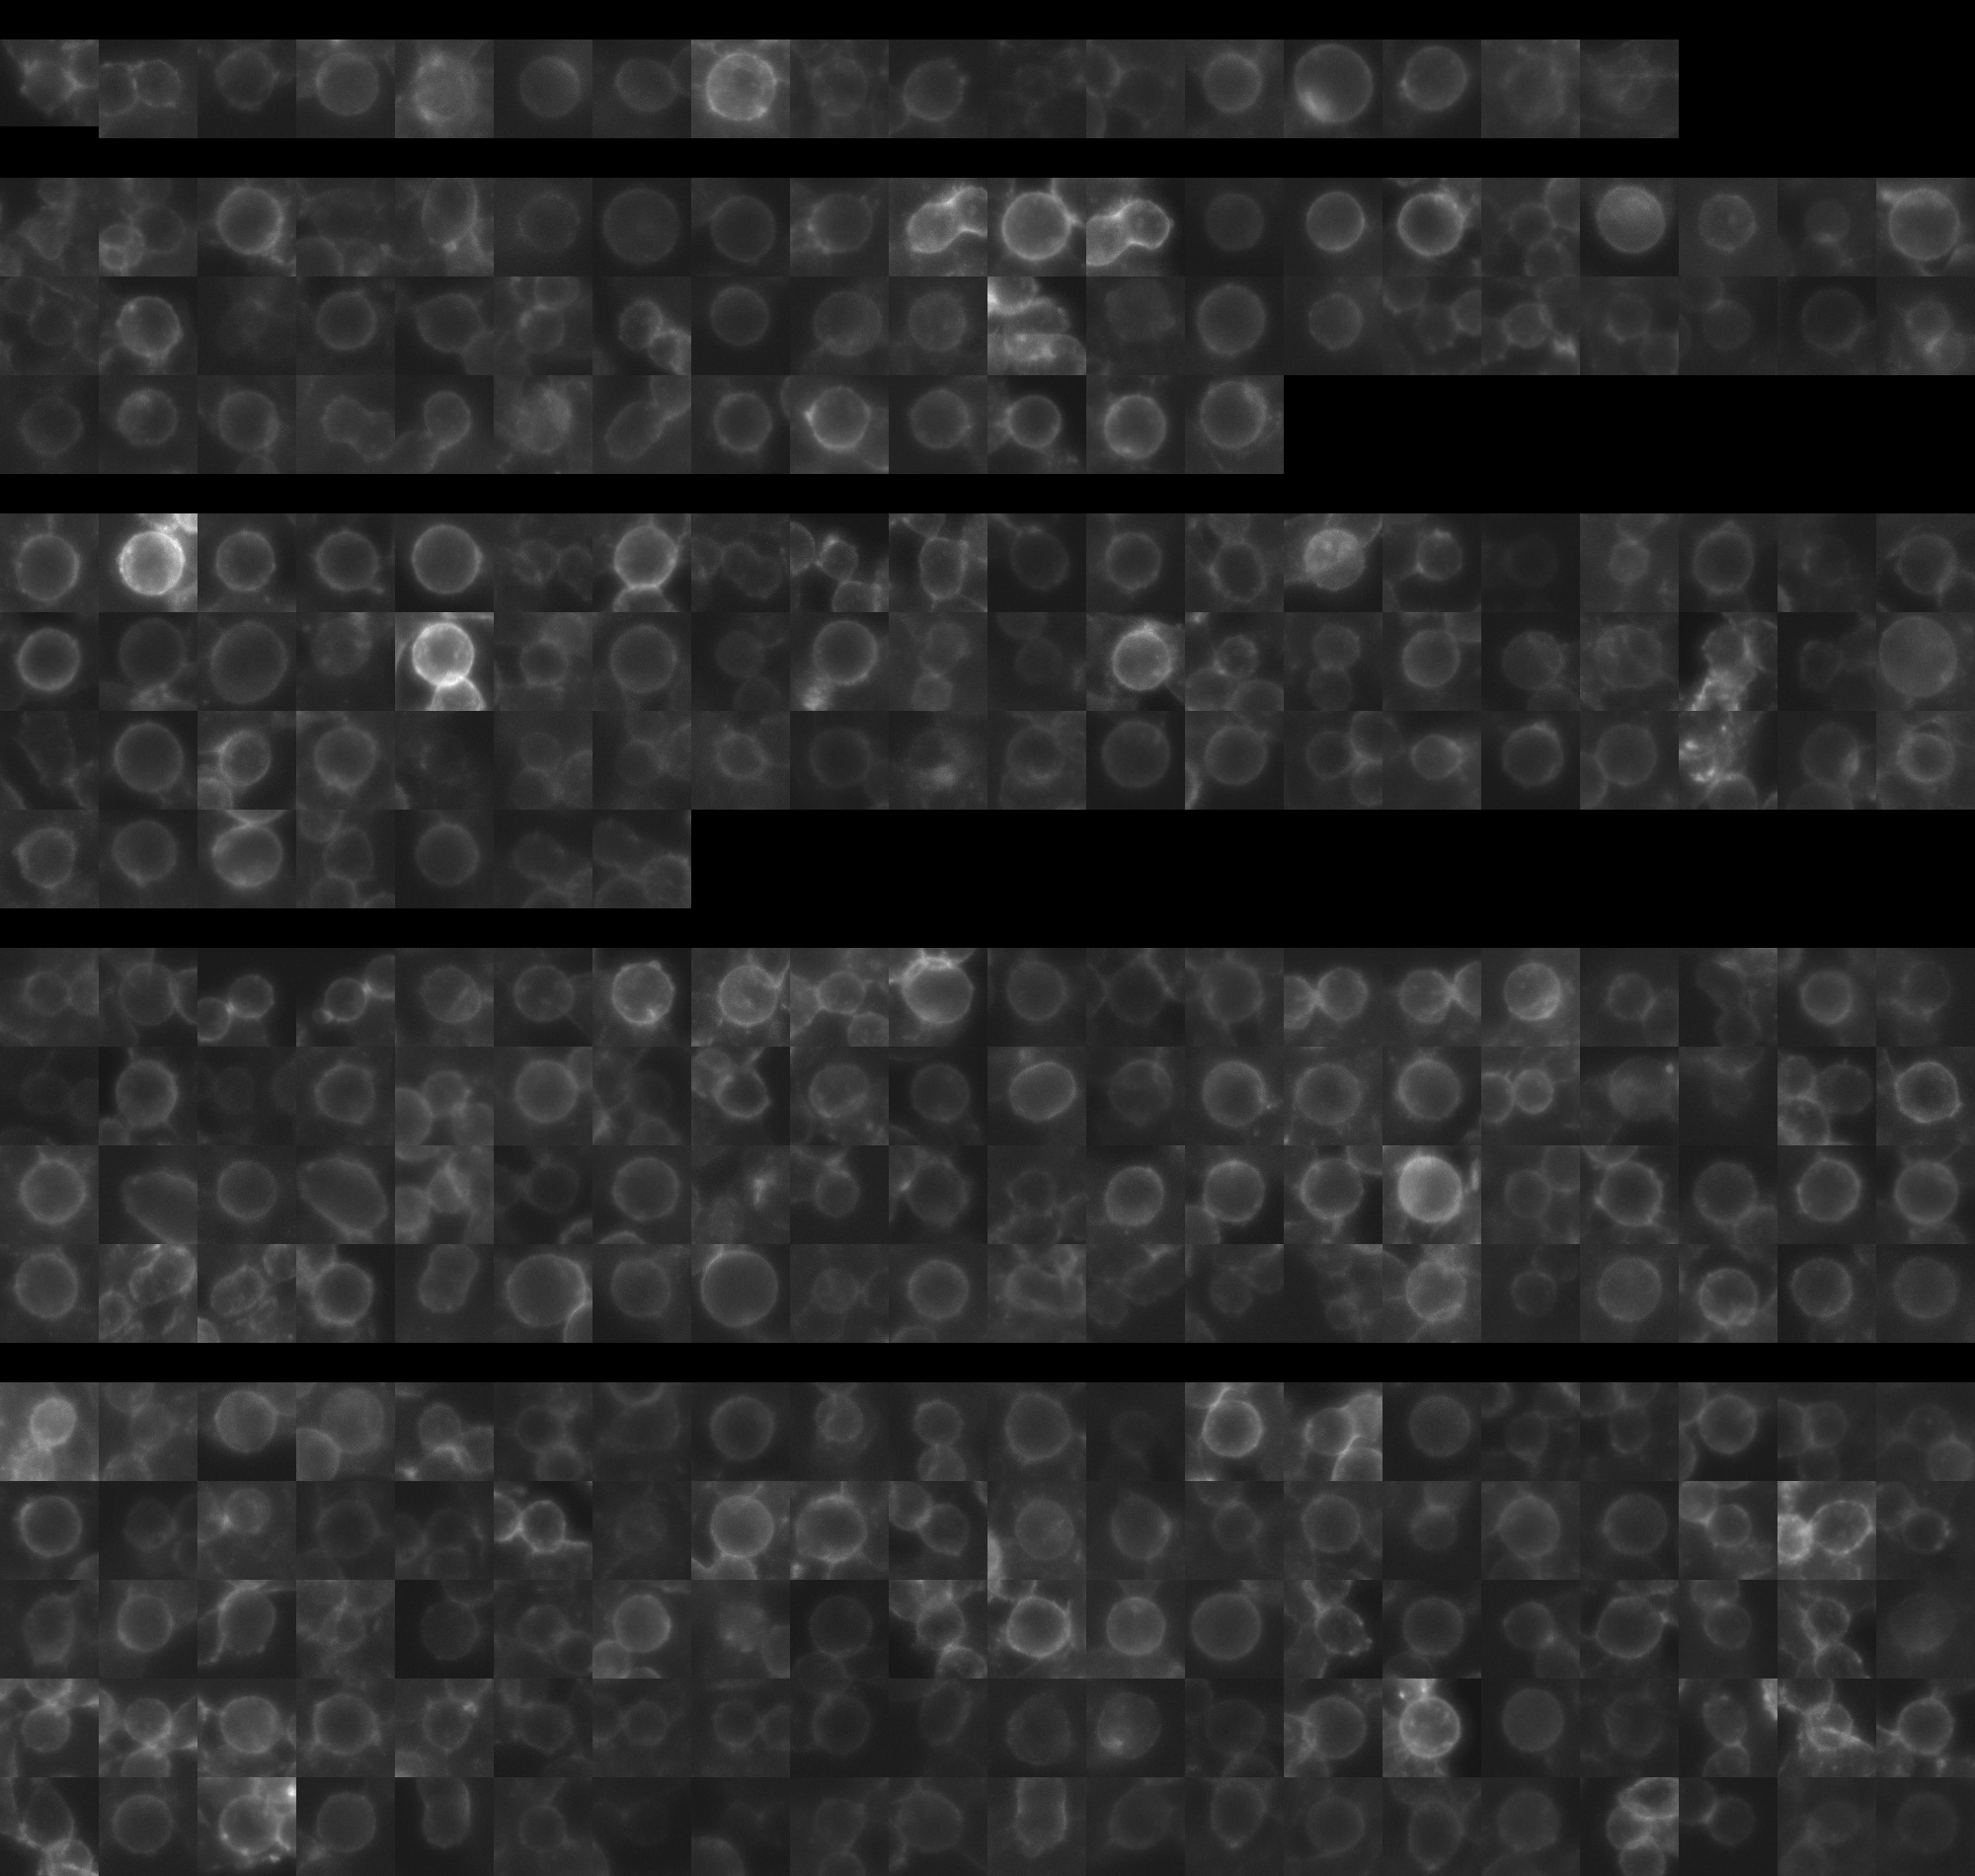
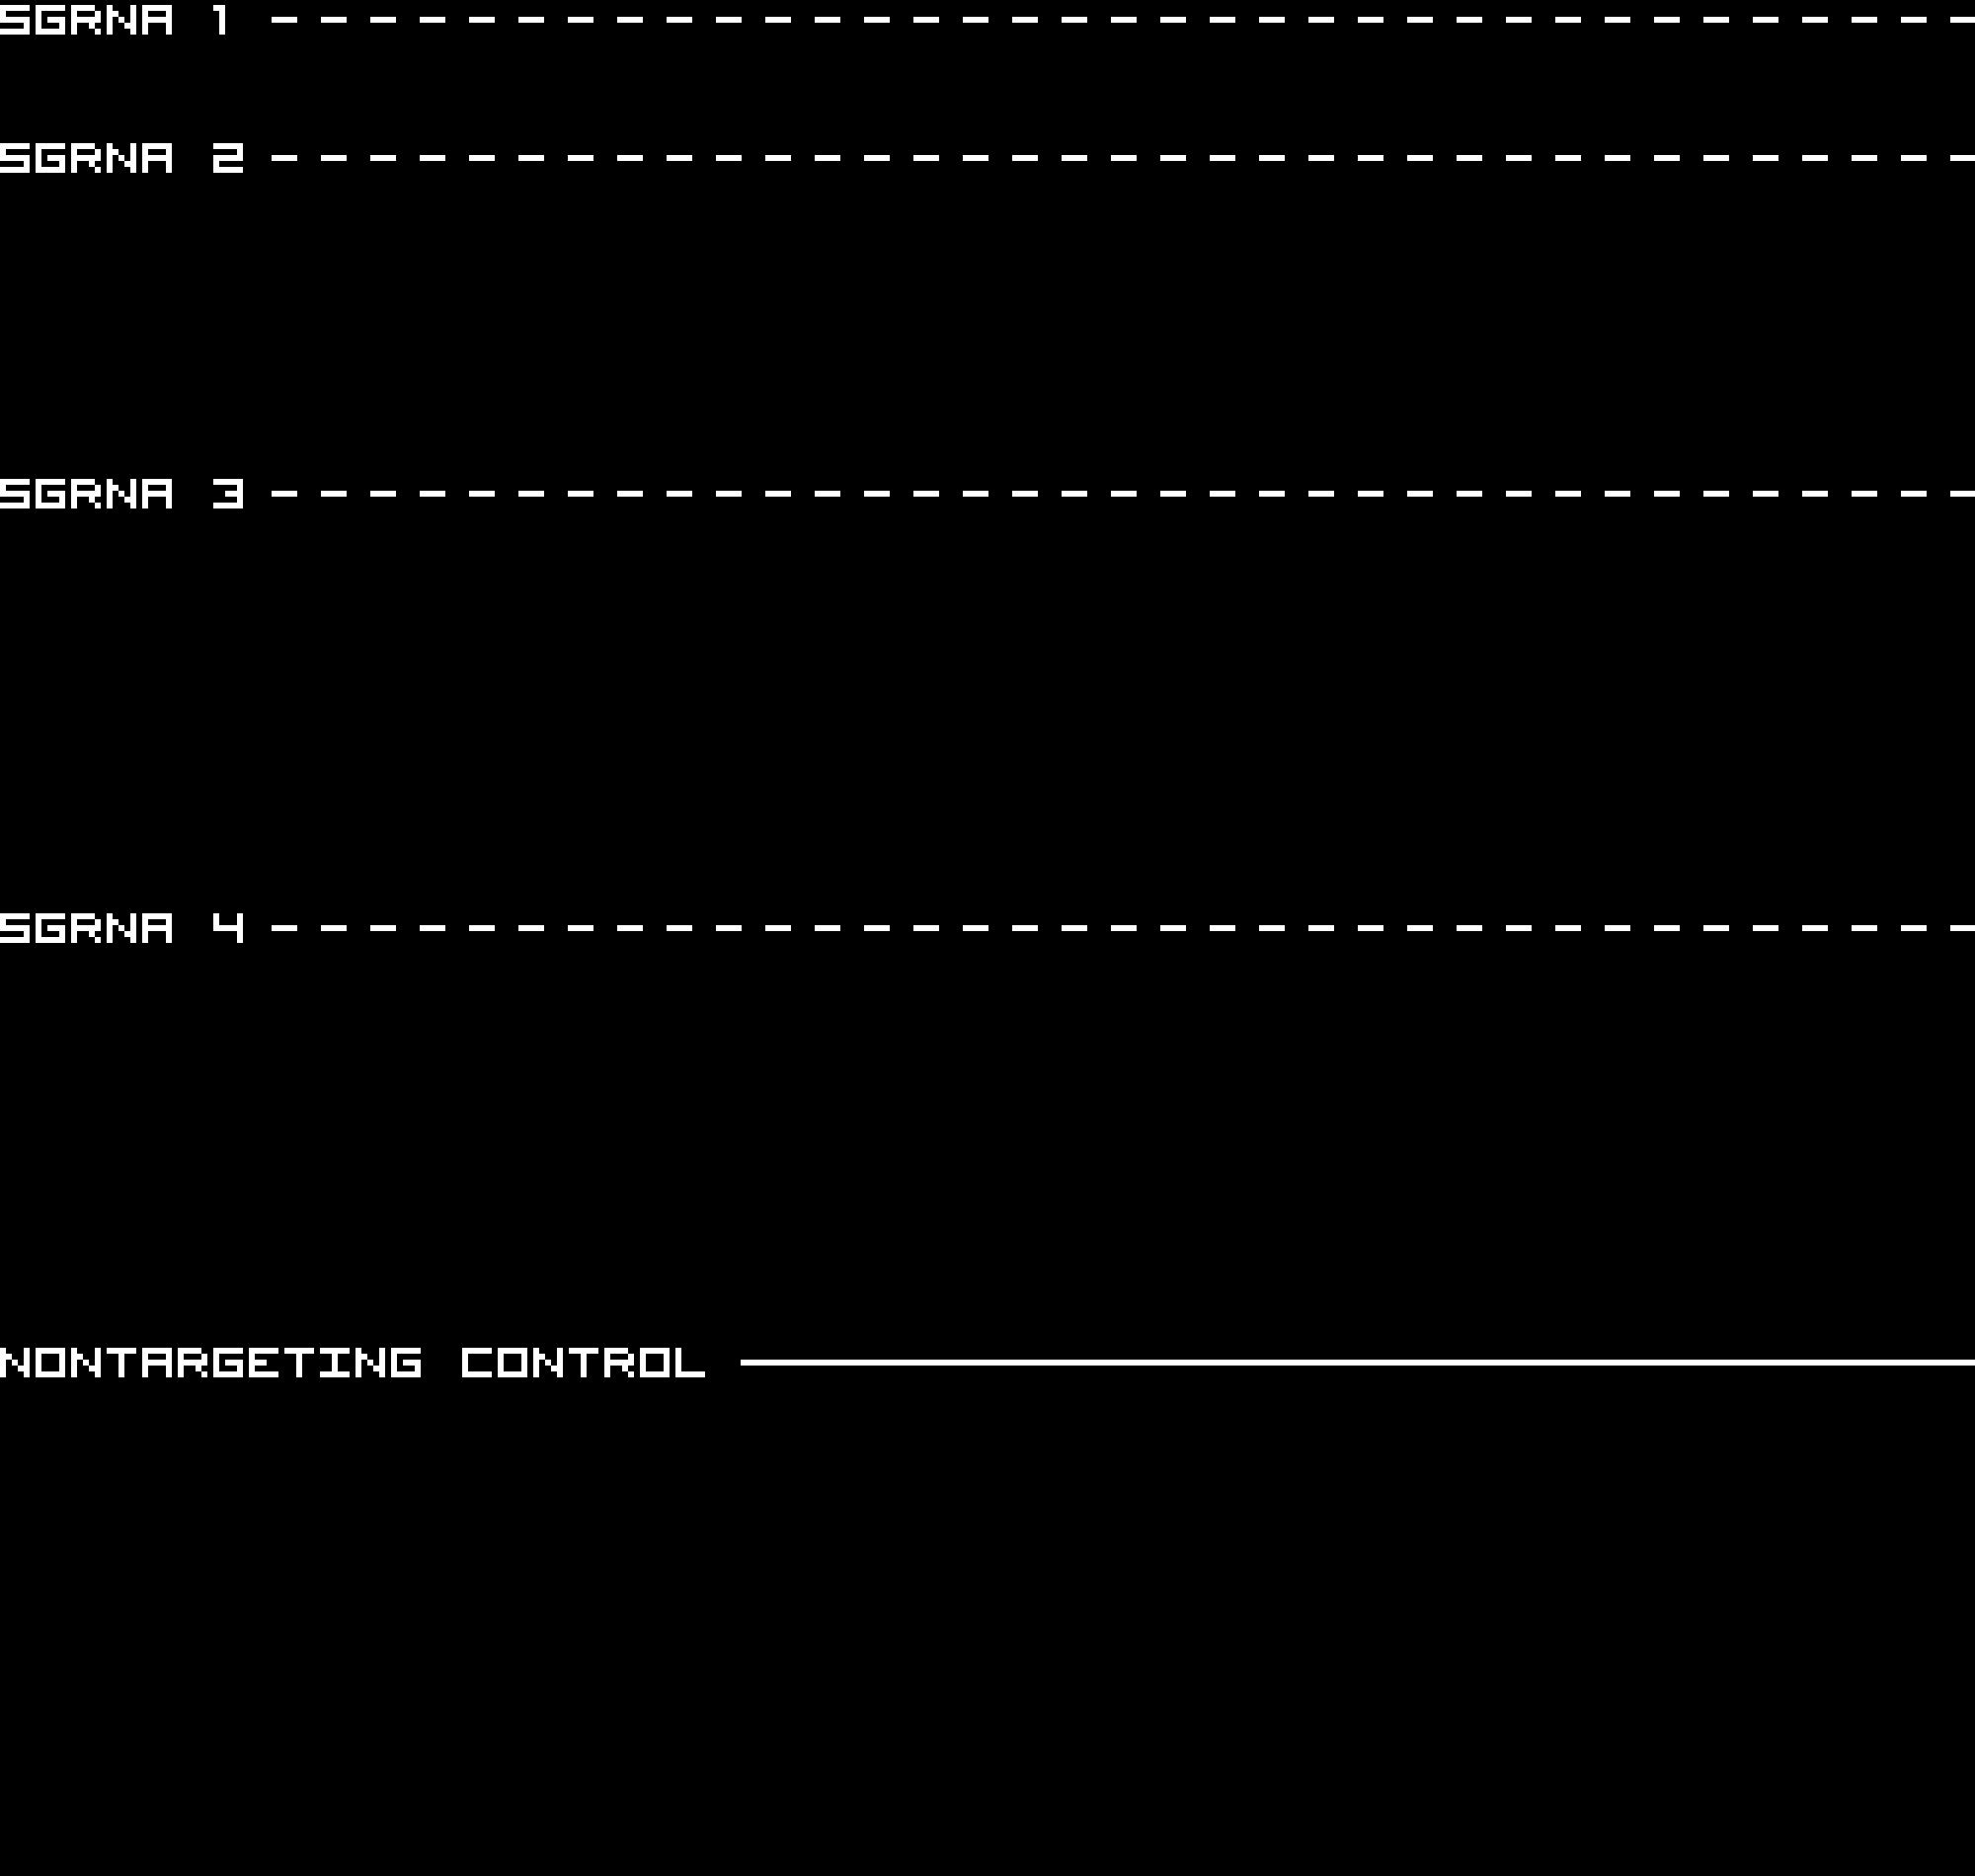
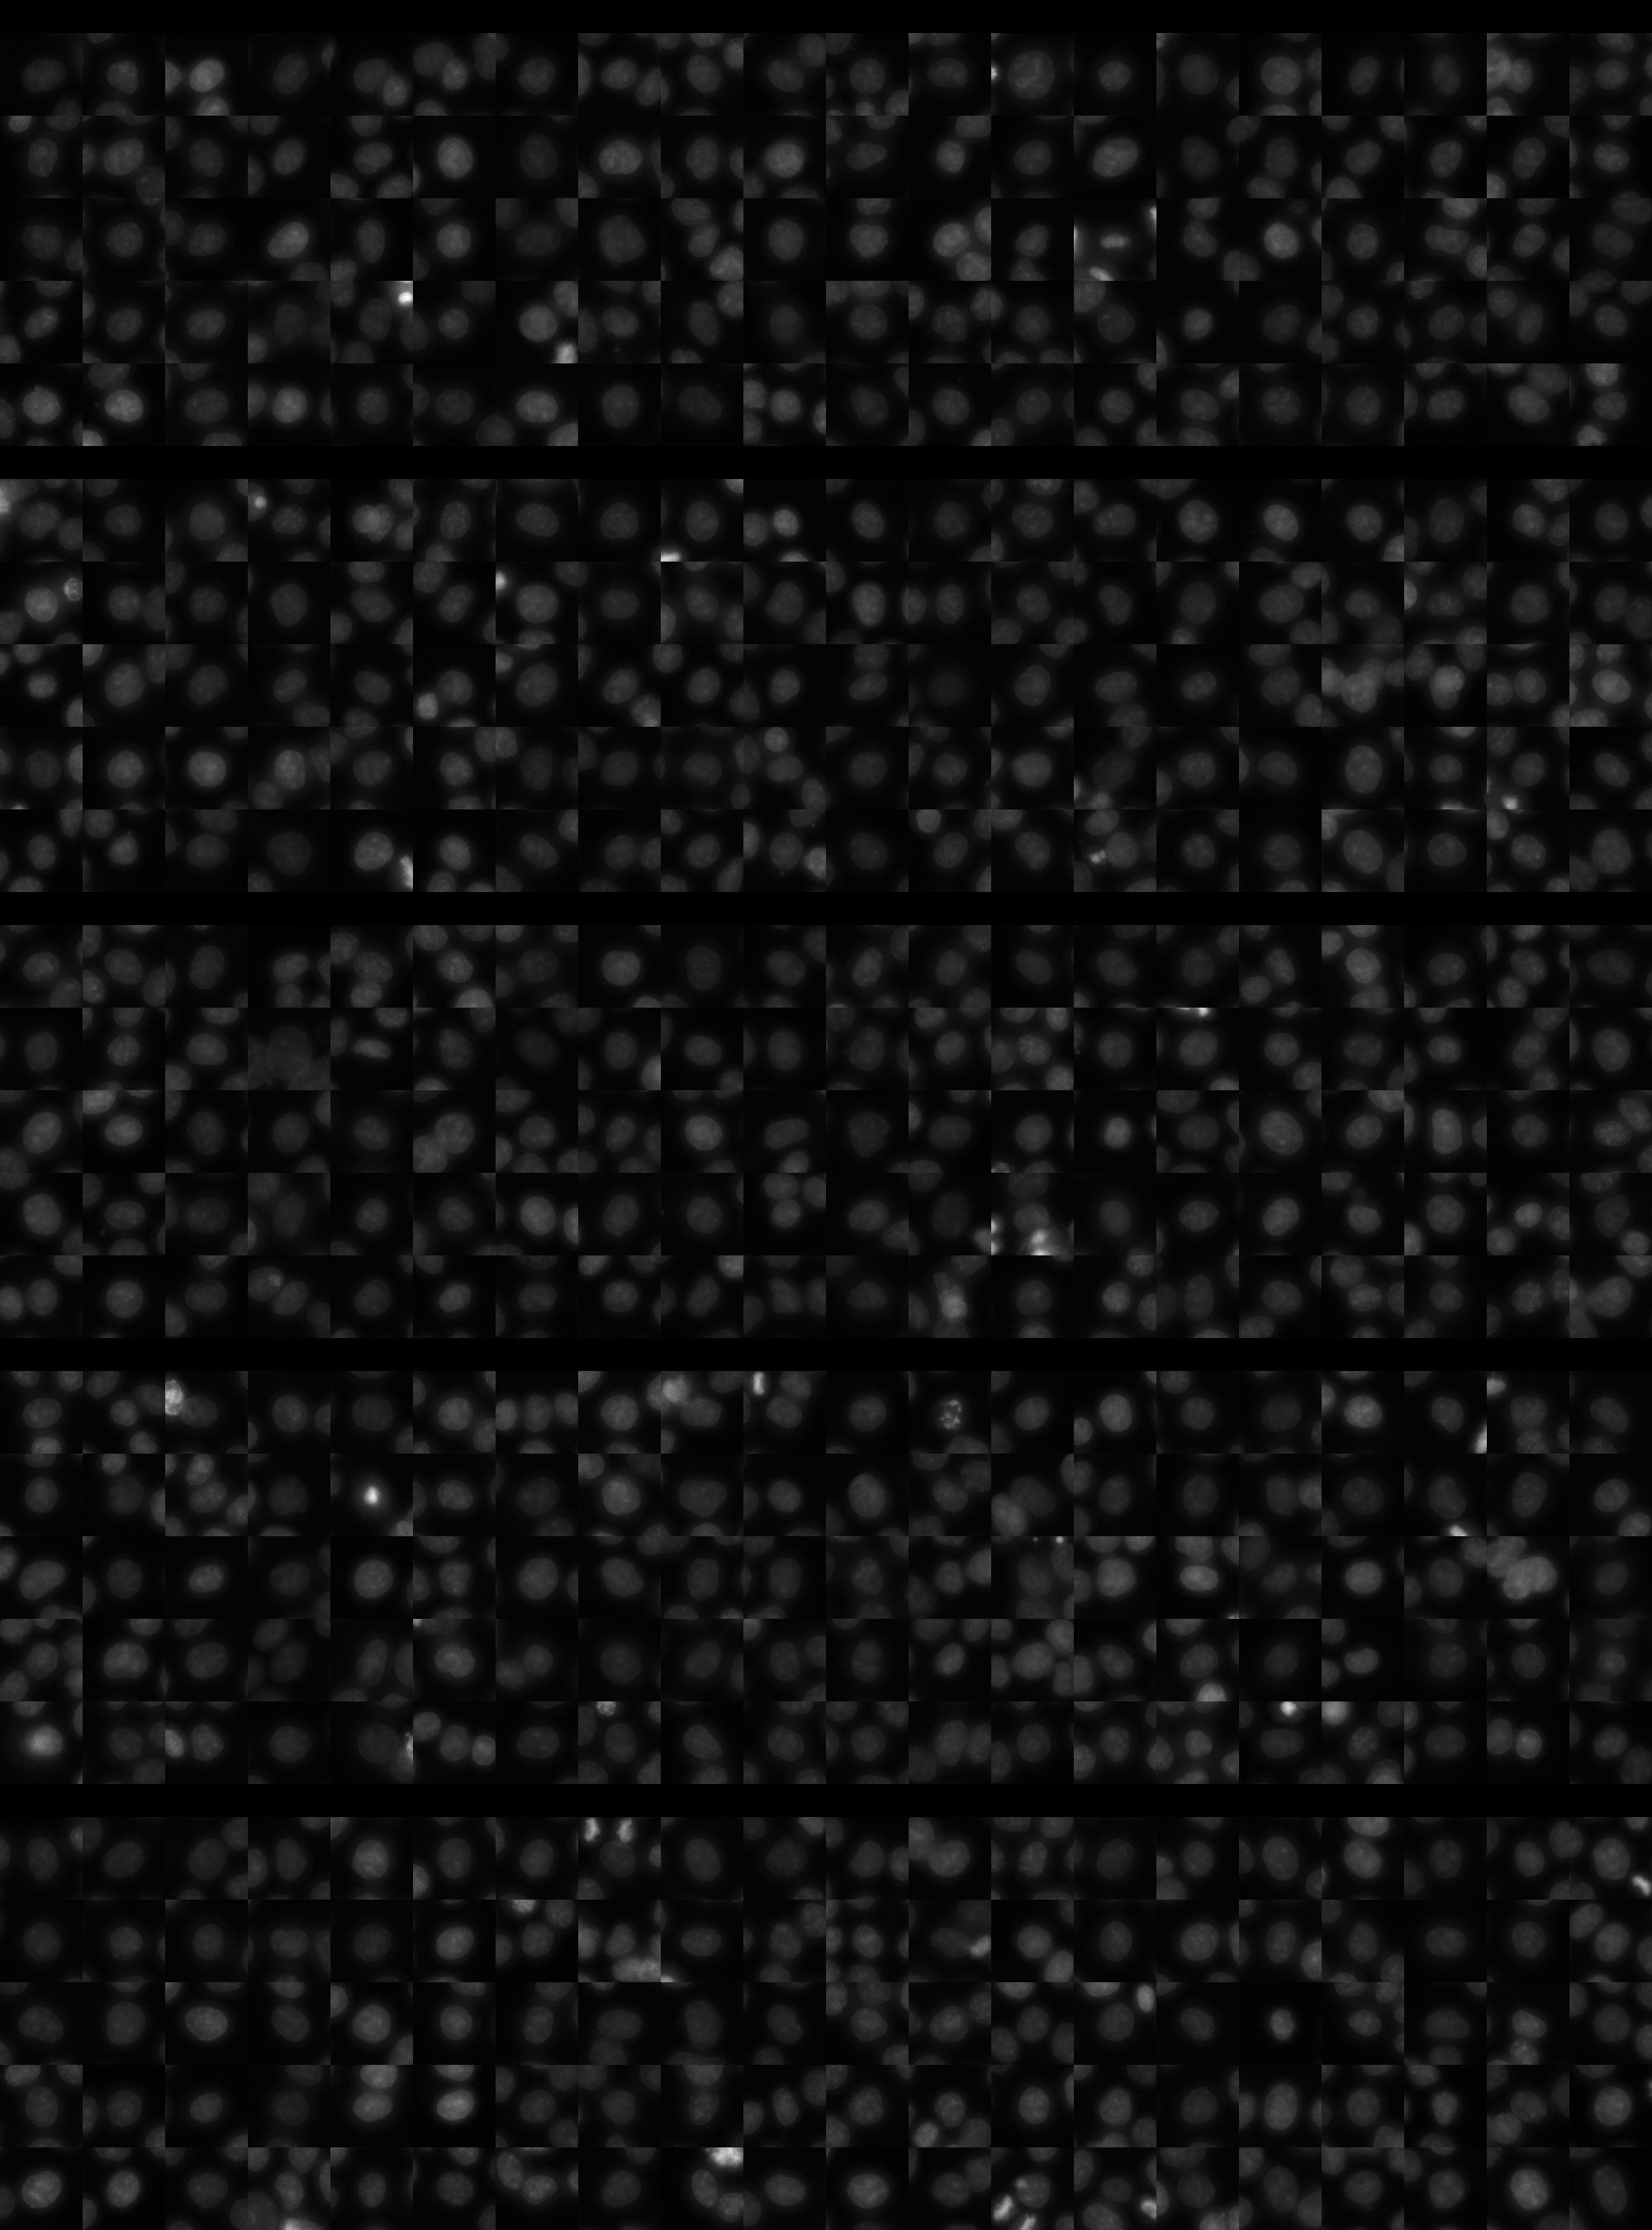
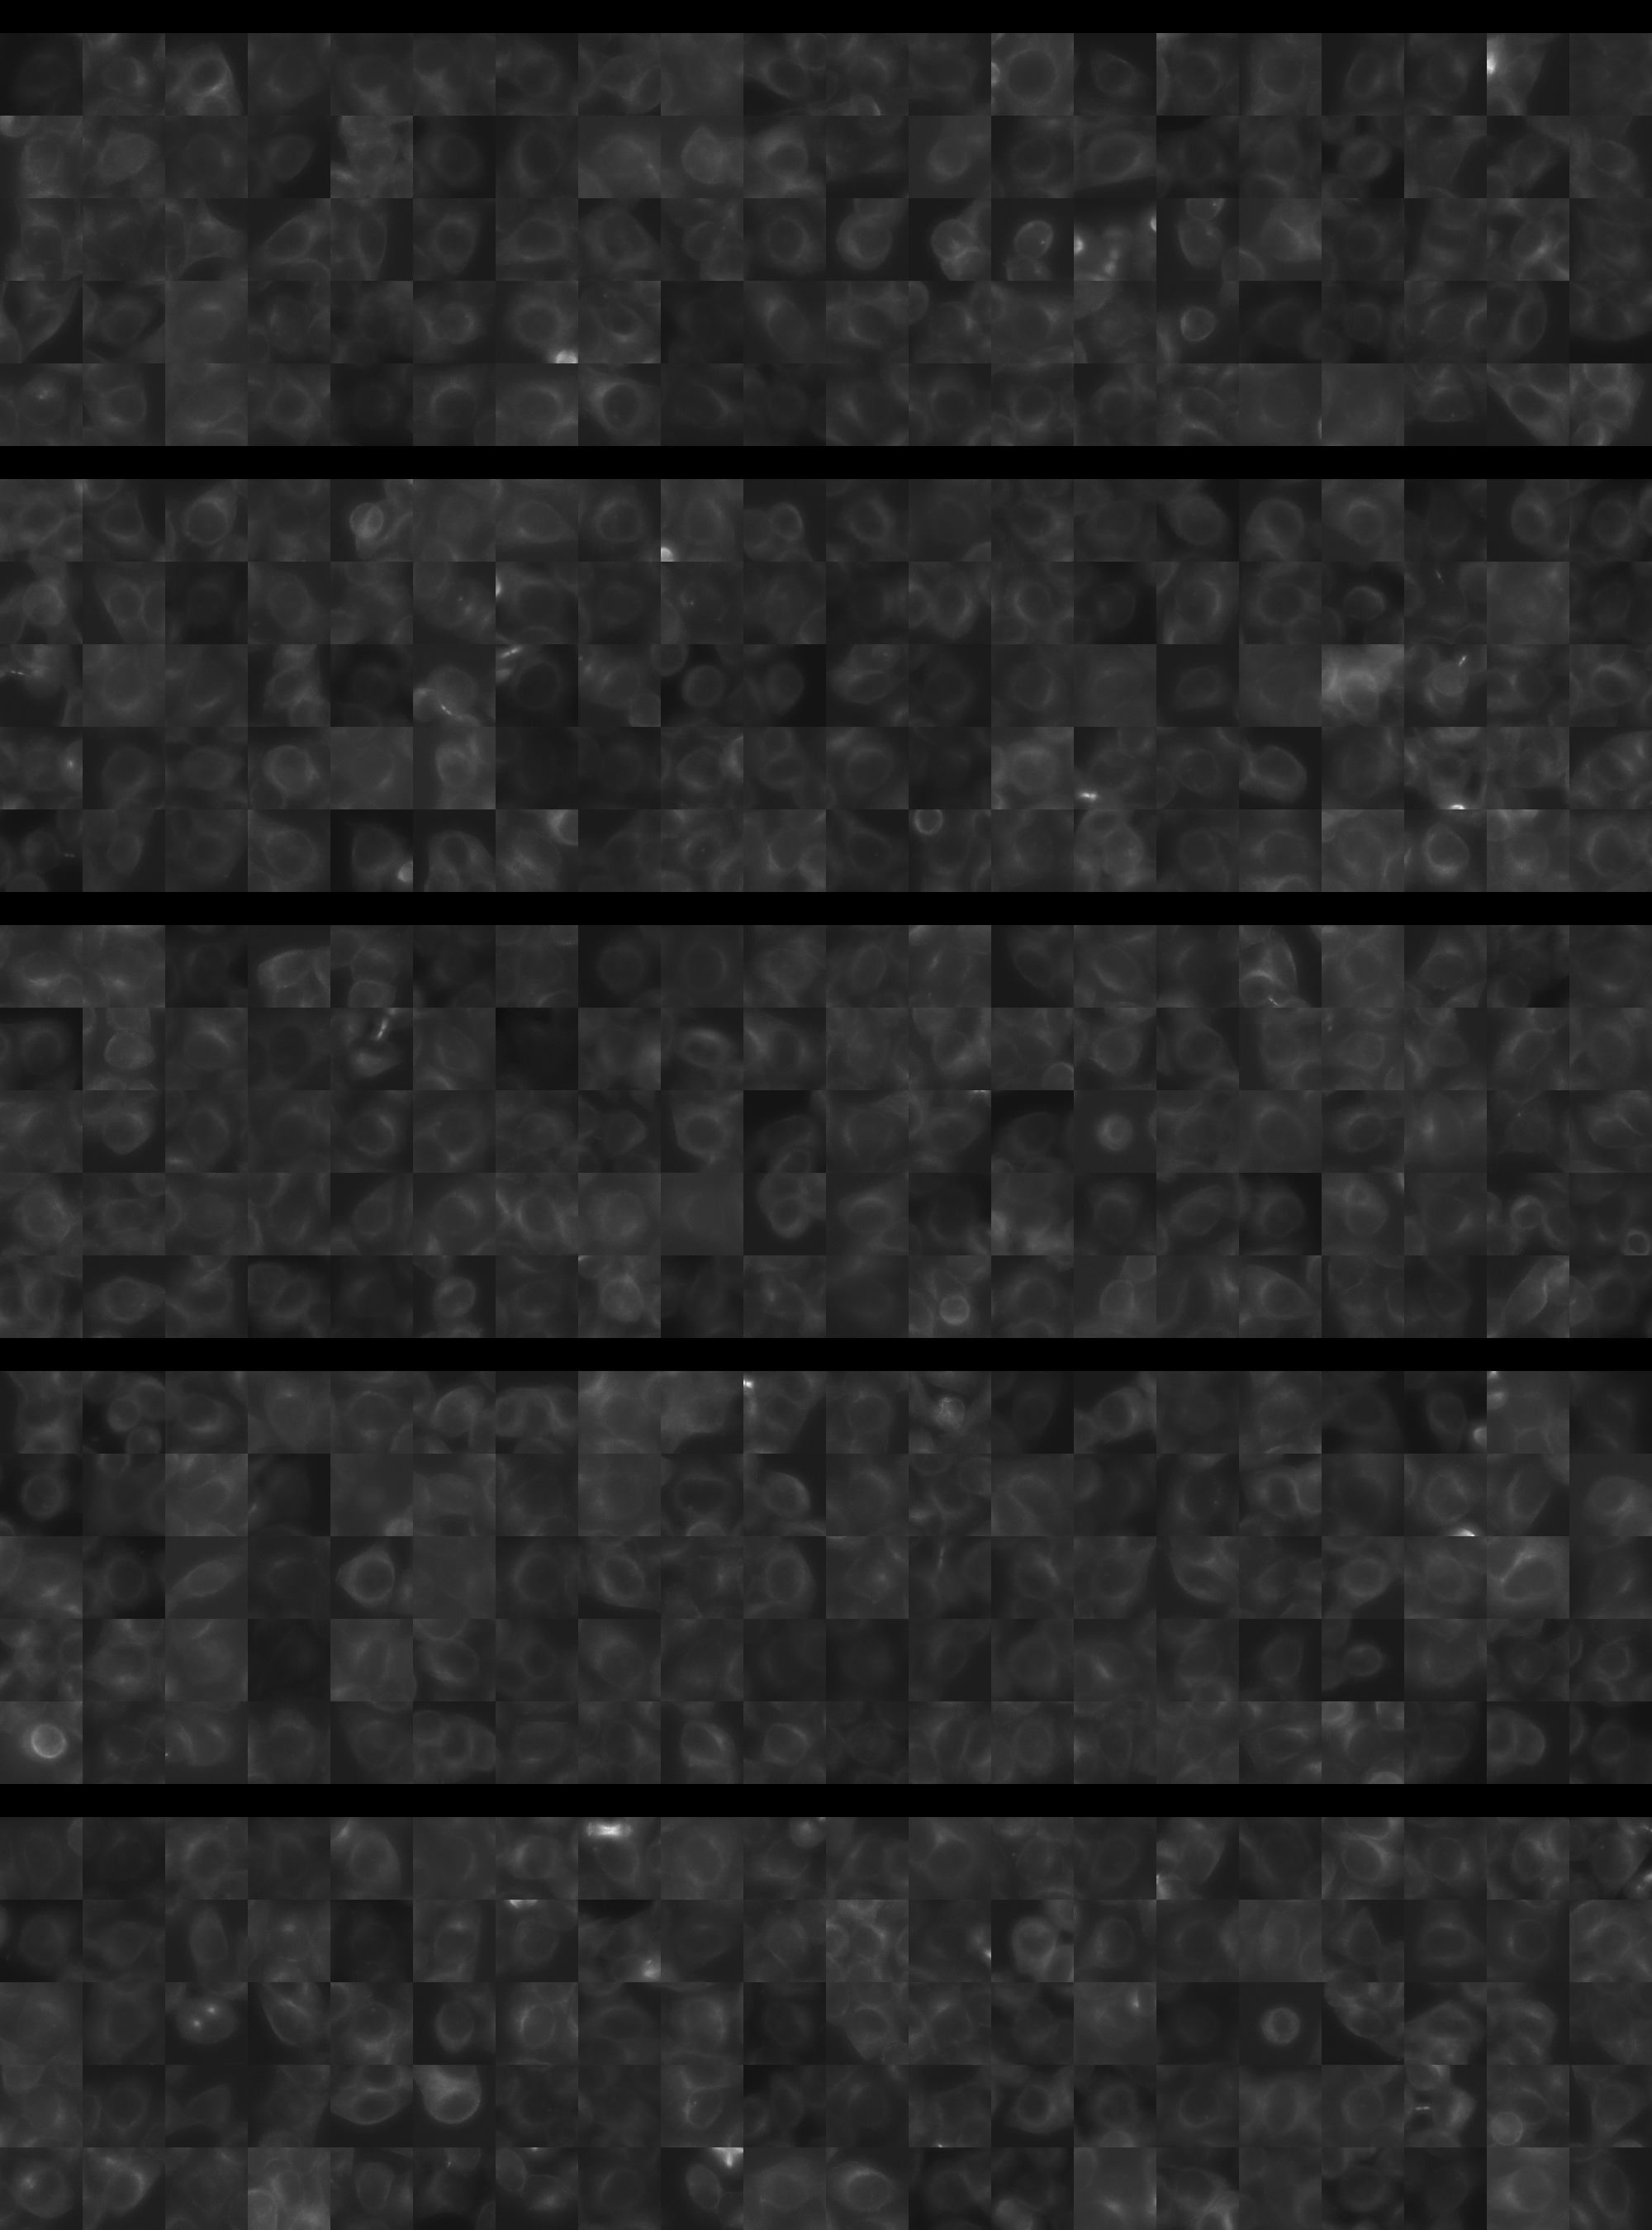
Each montage below shows randomly selected individual cell images for the same target gene separated by sgRNA, along with an example montage of cells expressing a non-targeting negative control sgRNA at the bottom. sgRNA labels in the montages correspond to the numbered sgRNA sequences in the gene info table above. The DNA (blue) and tubulin (green) channels are displayed by default, with gH2AX (grayscale) and actin (yellow) available using the check boxes. Channel brightness, contrast, and opacity are adjustable by clicking the arrow next to the channel name. When only one channel is selected, the display defaults to grayscale. Click the “Zoom” checkbox above the channel controls to enable image zooming (via scrolling) and panning (via click-and-drag).

The cell boxes displayed for this gene are square, 30.36 μm per side for the interphase montage and 30.36 μm per side for the mitotic montage.
Features

Interphase Score Rank FDR q-value
Nucleus DNA Integrated -9.940e-03 3617 of 5322 0.880
Nucleus DNA Mean 0.034 1064 of 5322 0.405
Nucleus gH2AX Mean 0.023 4189 of 5322 0.554
Nucleus DNA - gH2AX Correlation -2.517e-02 1567 of 5322 0.381
Nucleus Shape Area -4.532e-02 4408 of 5322 0.274
Nucleus Shape Eccentricity -3.722e-02 4636 of 5322 0.385
Nucleus Shape Form Factor -7.126e-02 3601 of 5322 0.066
Nucleus Shape Solidity -9.062e-02 4102 of 5322 0.009
Cell DNA Mass Displacement 0.045 1385 of 5322 0.402
Cell Tubulin Mean -7.399e-02 4698 of 5322 0.091
Cell Tubulin Mass Displacement -4.628e-02 4732 of 5322 0.291
Cell Actin Mean -2.774e-02 3855 of 5322 0.649
Cell Tubulin - Actin Correlation -2.329e-02 4588 of 5322 0.636
Cell DNA - Tubulin Correlation -1.230e-01 5240 of 5322 1.948e-04
Cell Shape Area -2.927e-02 4014 of 5322 0.504
Cell Shape Eccentricity -3.425e-02 5045 of 5322 0.642
Mitotic Score Rank FDR q-value
Nucleus DNA Integrated 0.099 2506 of 5322 0.965
Nucleus DNA Mean 0.157 889 of 5322 1.000
Nucleus DNA Mass Displacement 0.114 1709 of 5322 0.999
Nucleus DNA Mean Frac 3 -4.725e-02 3803 of 5322 1.000
Nucleus gH2AX Mean -6.172e-02 3807 of 5322 1.000
Nucleus gH2AX Mean Frac 0 0.028 1847 of 5322 1.000
Nucleus Tubulin Mean Frac 0 0.183 995 of 5322 0.999
Nucleus Tubulin Mean Edge -1.422e-02 3375 of 5322 0.999
Nucleus Tubulin Std Edge -1.474e-01 4337 of 5322 0.999
Nucleus Shape Area 0.058 3233 of 5322 0.990
Nucleus Shape Eccentricity -1.429e-01 4068 of 5322 1.000
Nucleus Shape Form Factor -4.201e-02 1980 of 5322 0.998
Cell Tubulin Mean 0.092 2165 of 5322 0.997
Cell Tubulin Mean Frac 3 0.135 504 of 5322 0.999
Cell Actin Mean 0.102 1865 of 5322 0.997
Cell Shape Area -1.528e-02 4086 of 5322 0.998
( Reset Zoom )
Brightness
Contrast
Opacity
Brightness
Contrast
Opacity
Brightness
Contrast
Opacity
Brightness
Contrast
Opacity
Brightness
Contrast
Opacity

( Reset Zoom )
Brightness
Contrast
Opacity
Brightness
Contrast
Opacity
Brightness
Contrast
Opacity
Brightness
Contrast
Opacity
Brightness
Contrast
Opacity

MIT Central Accessability