LRRC73

Gene symbol: LRRC73
Gene: 221424
Uniprot Function:
Mitotic Index 0.0248
Interphase Cluster: #171 (16 genes)
Mitotic Cluster: #140 (20 genes)
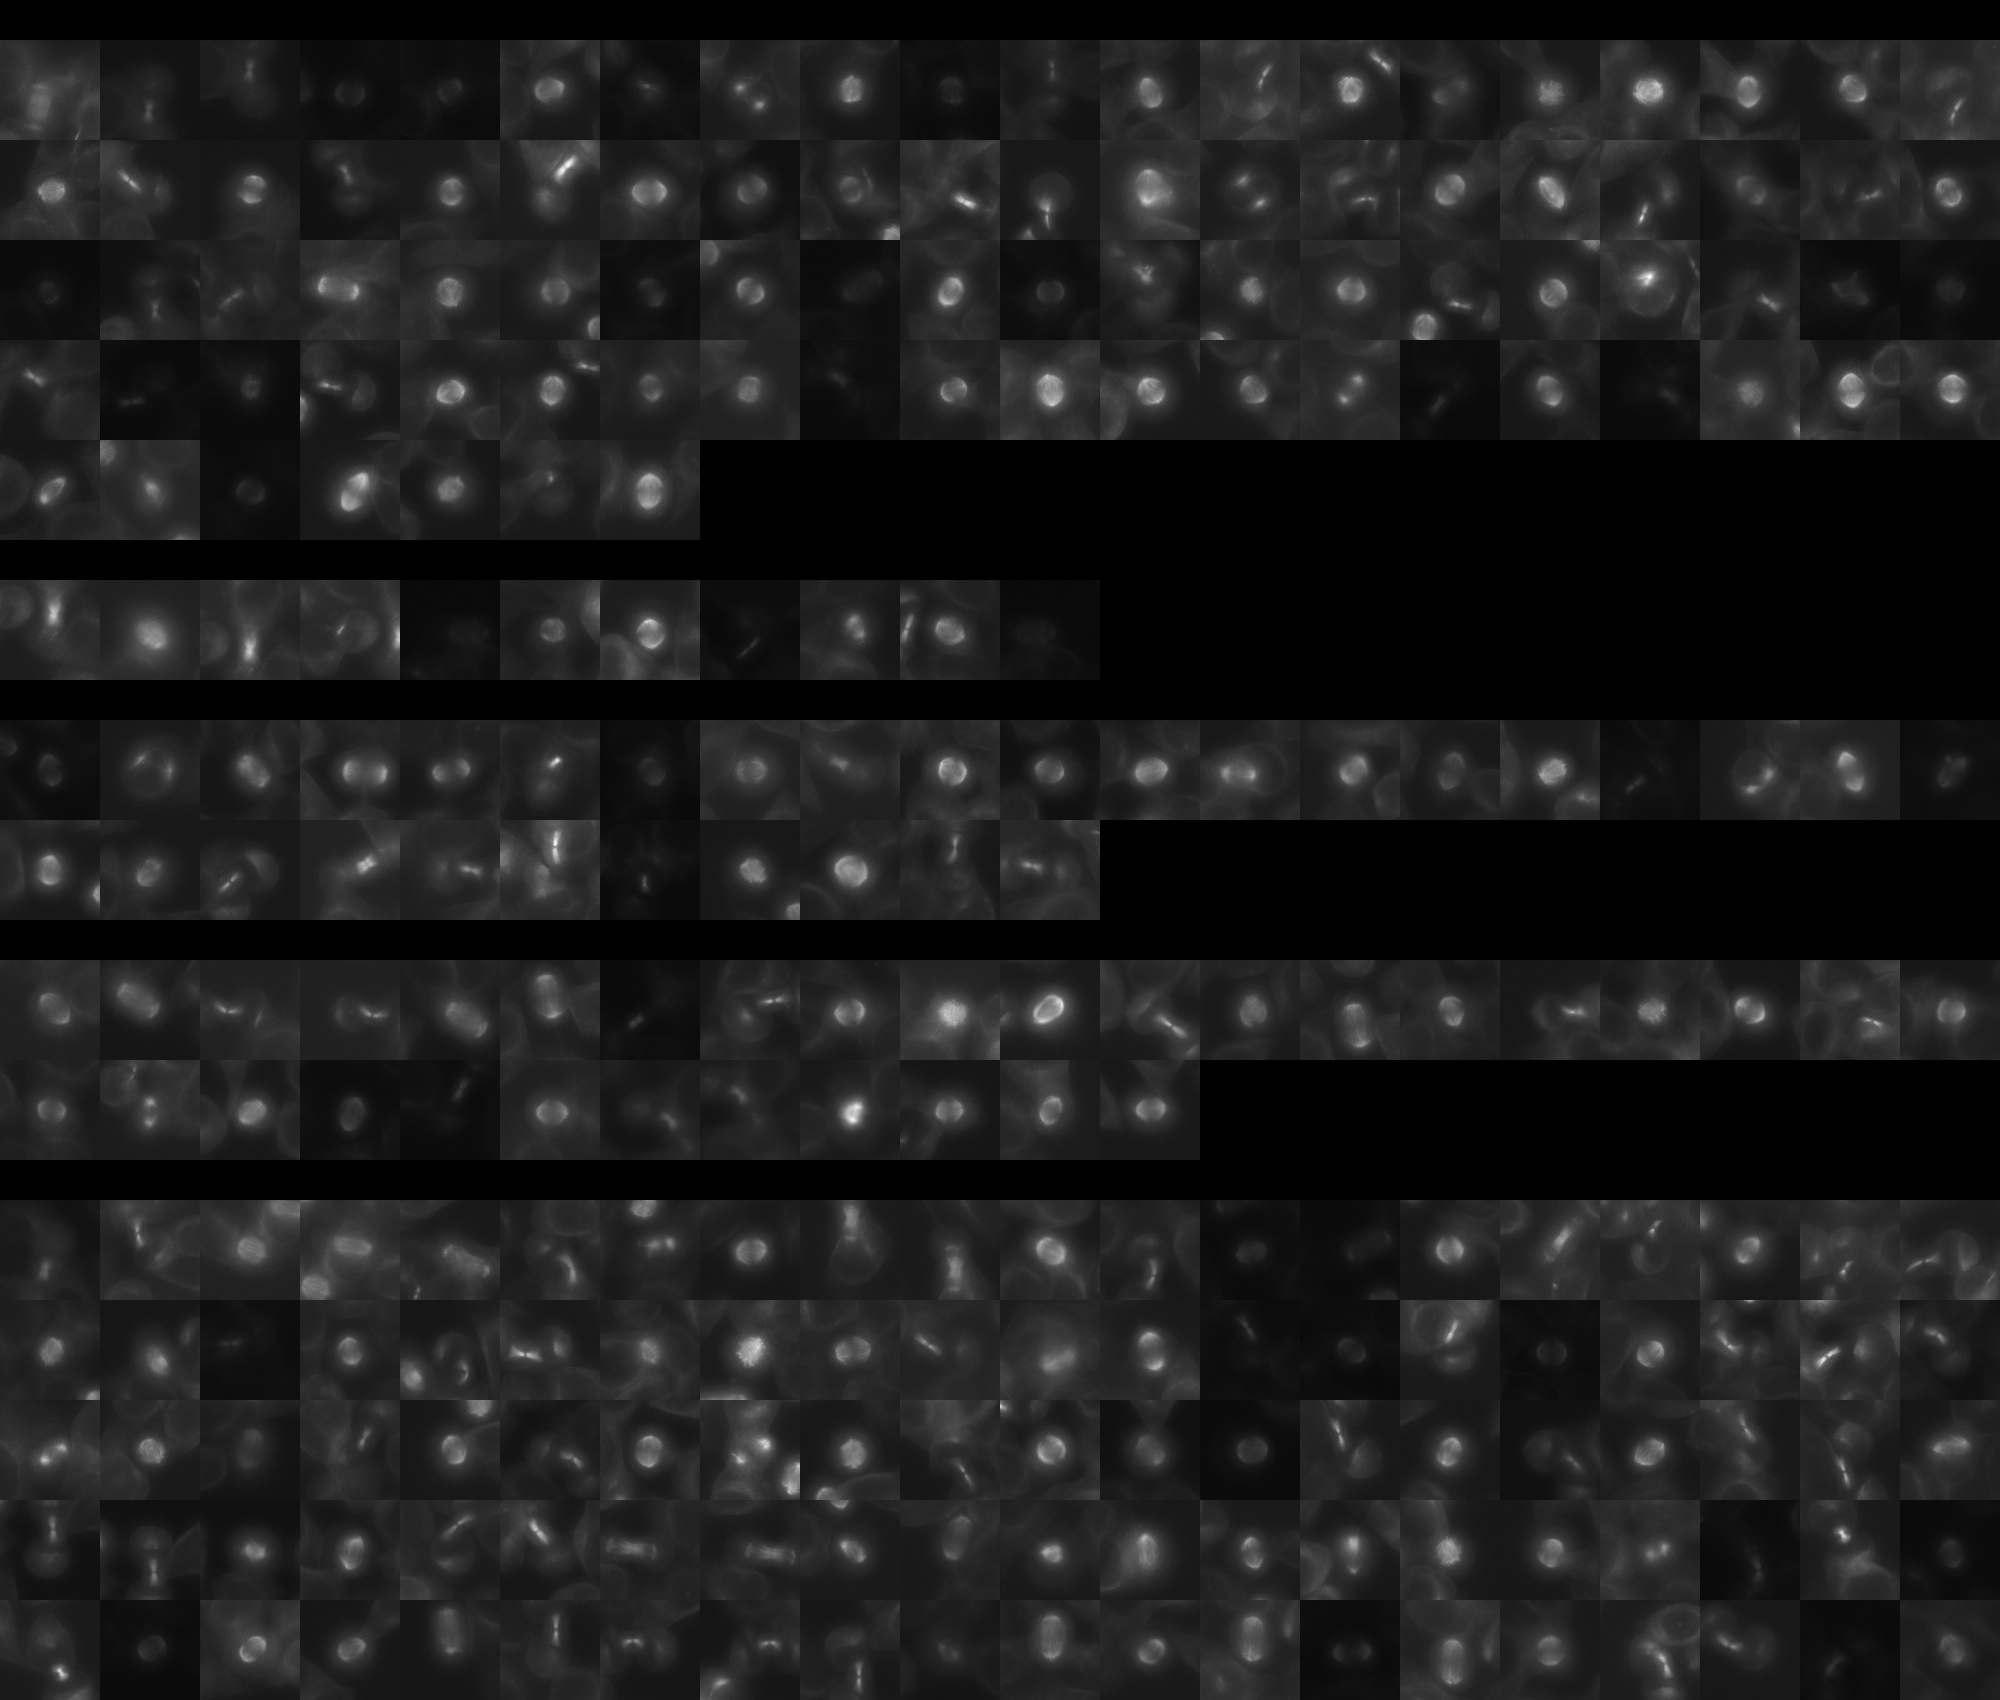
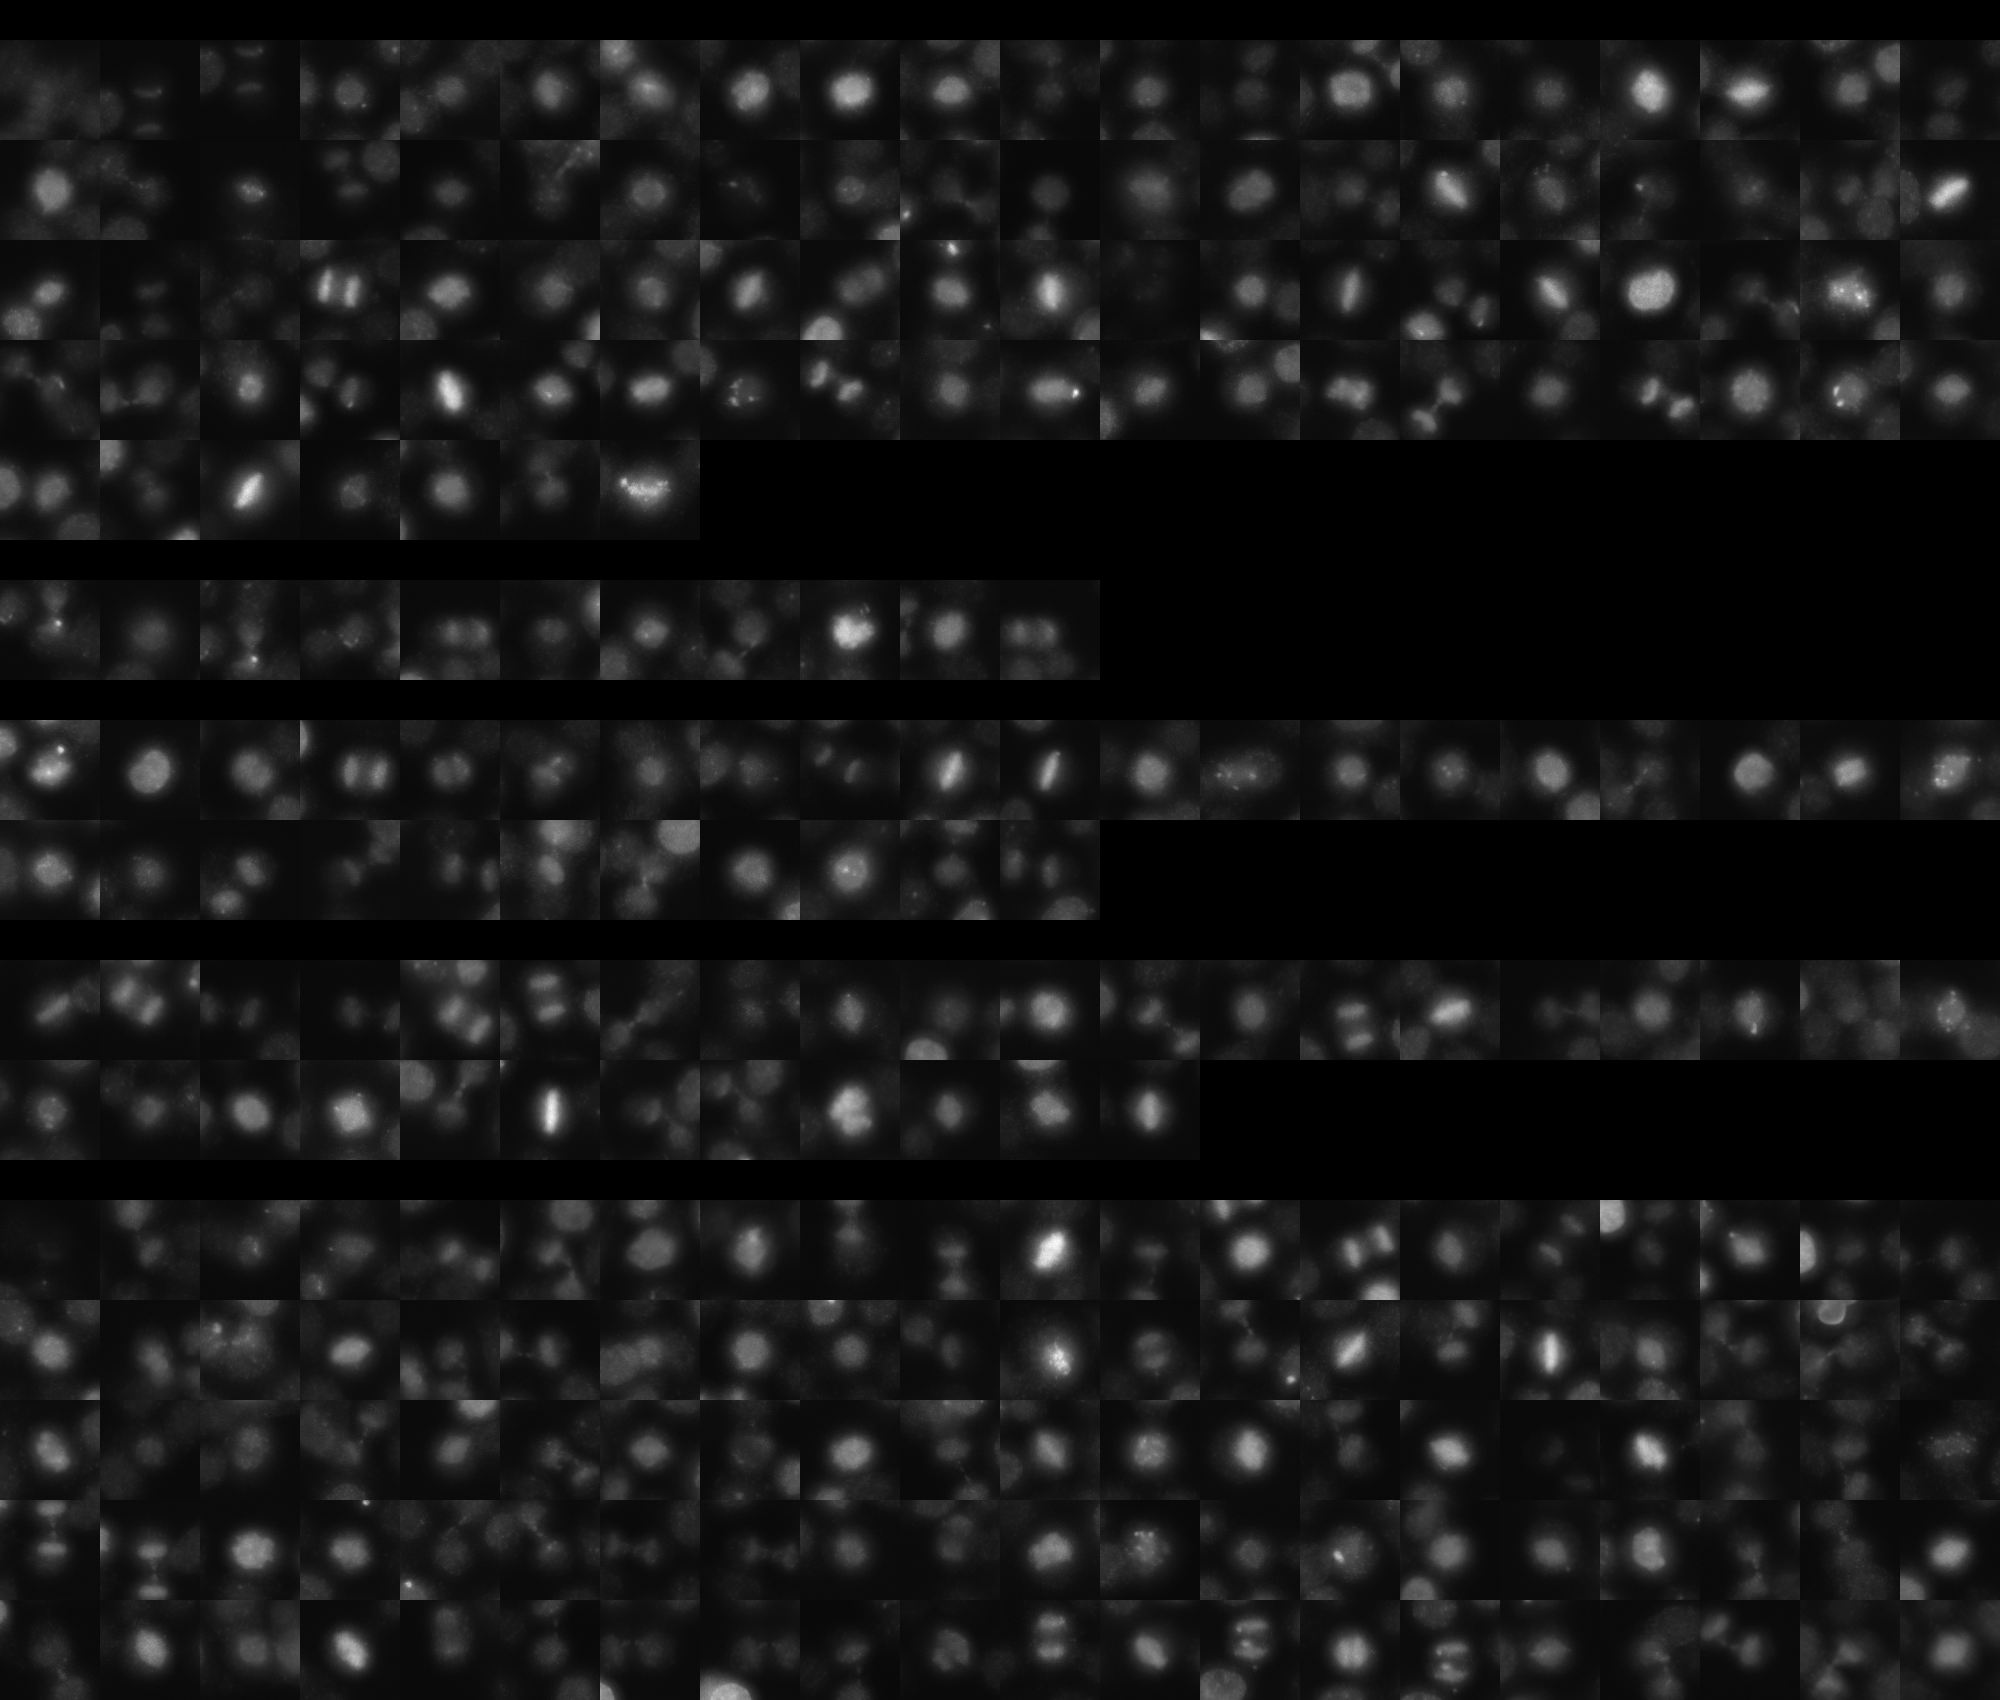
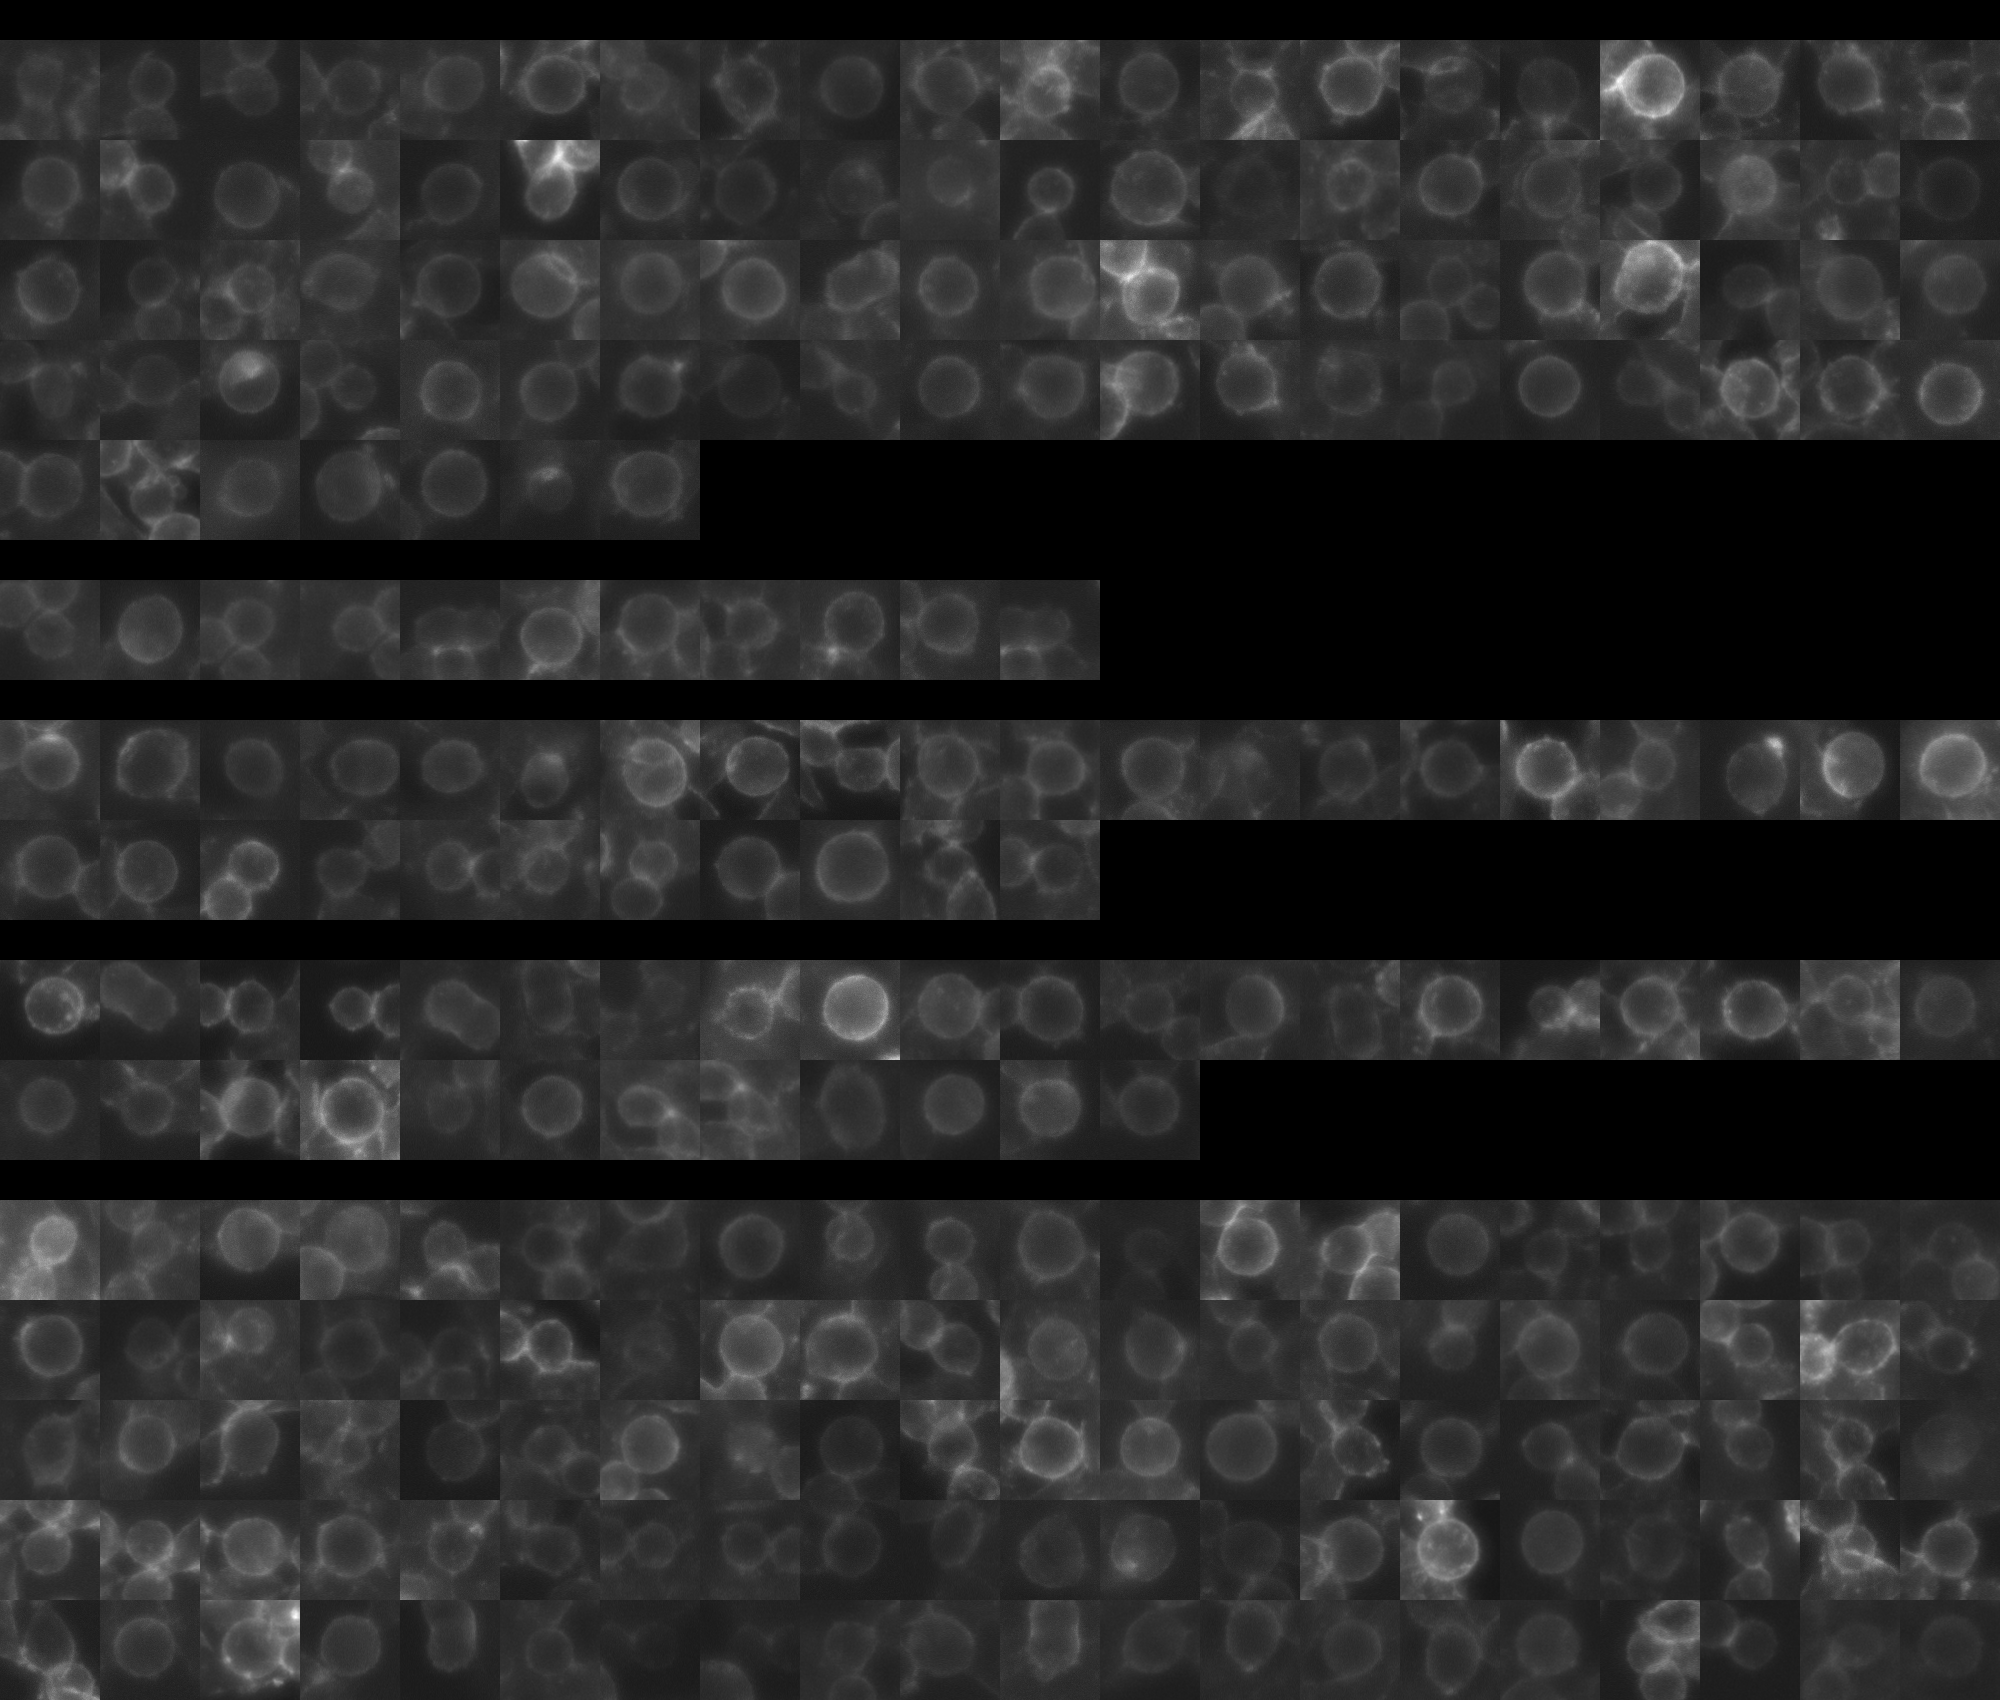
sgRNA 1: GAAGCCATCAACCTCATCTG (interphase cells: 3500, mitotic cells: 87)
sgRNA 2: GAGCCGCCTTGCCATTGCCG (interphase cells: 661, mitotic cells: 11)
sgRNA 3: GAGCCTGCTGCCCACCAGAG (interphase cells: 1136, mitotic cells: 31)
sgRNA 4: GCGCAGCTCAACCTTAACCT (interphase cells: 1036, mitotic cells: 32)

Interphase Cluster

Mitotic Cluster

Overview

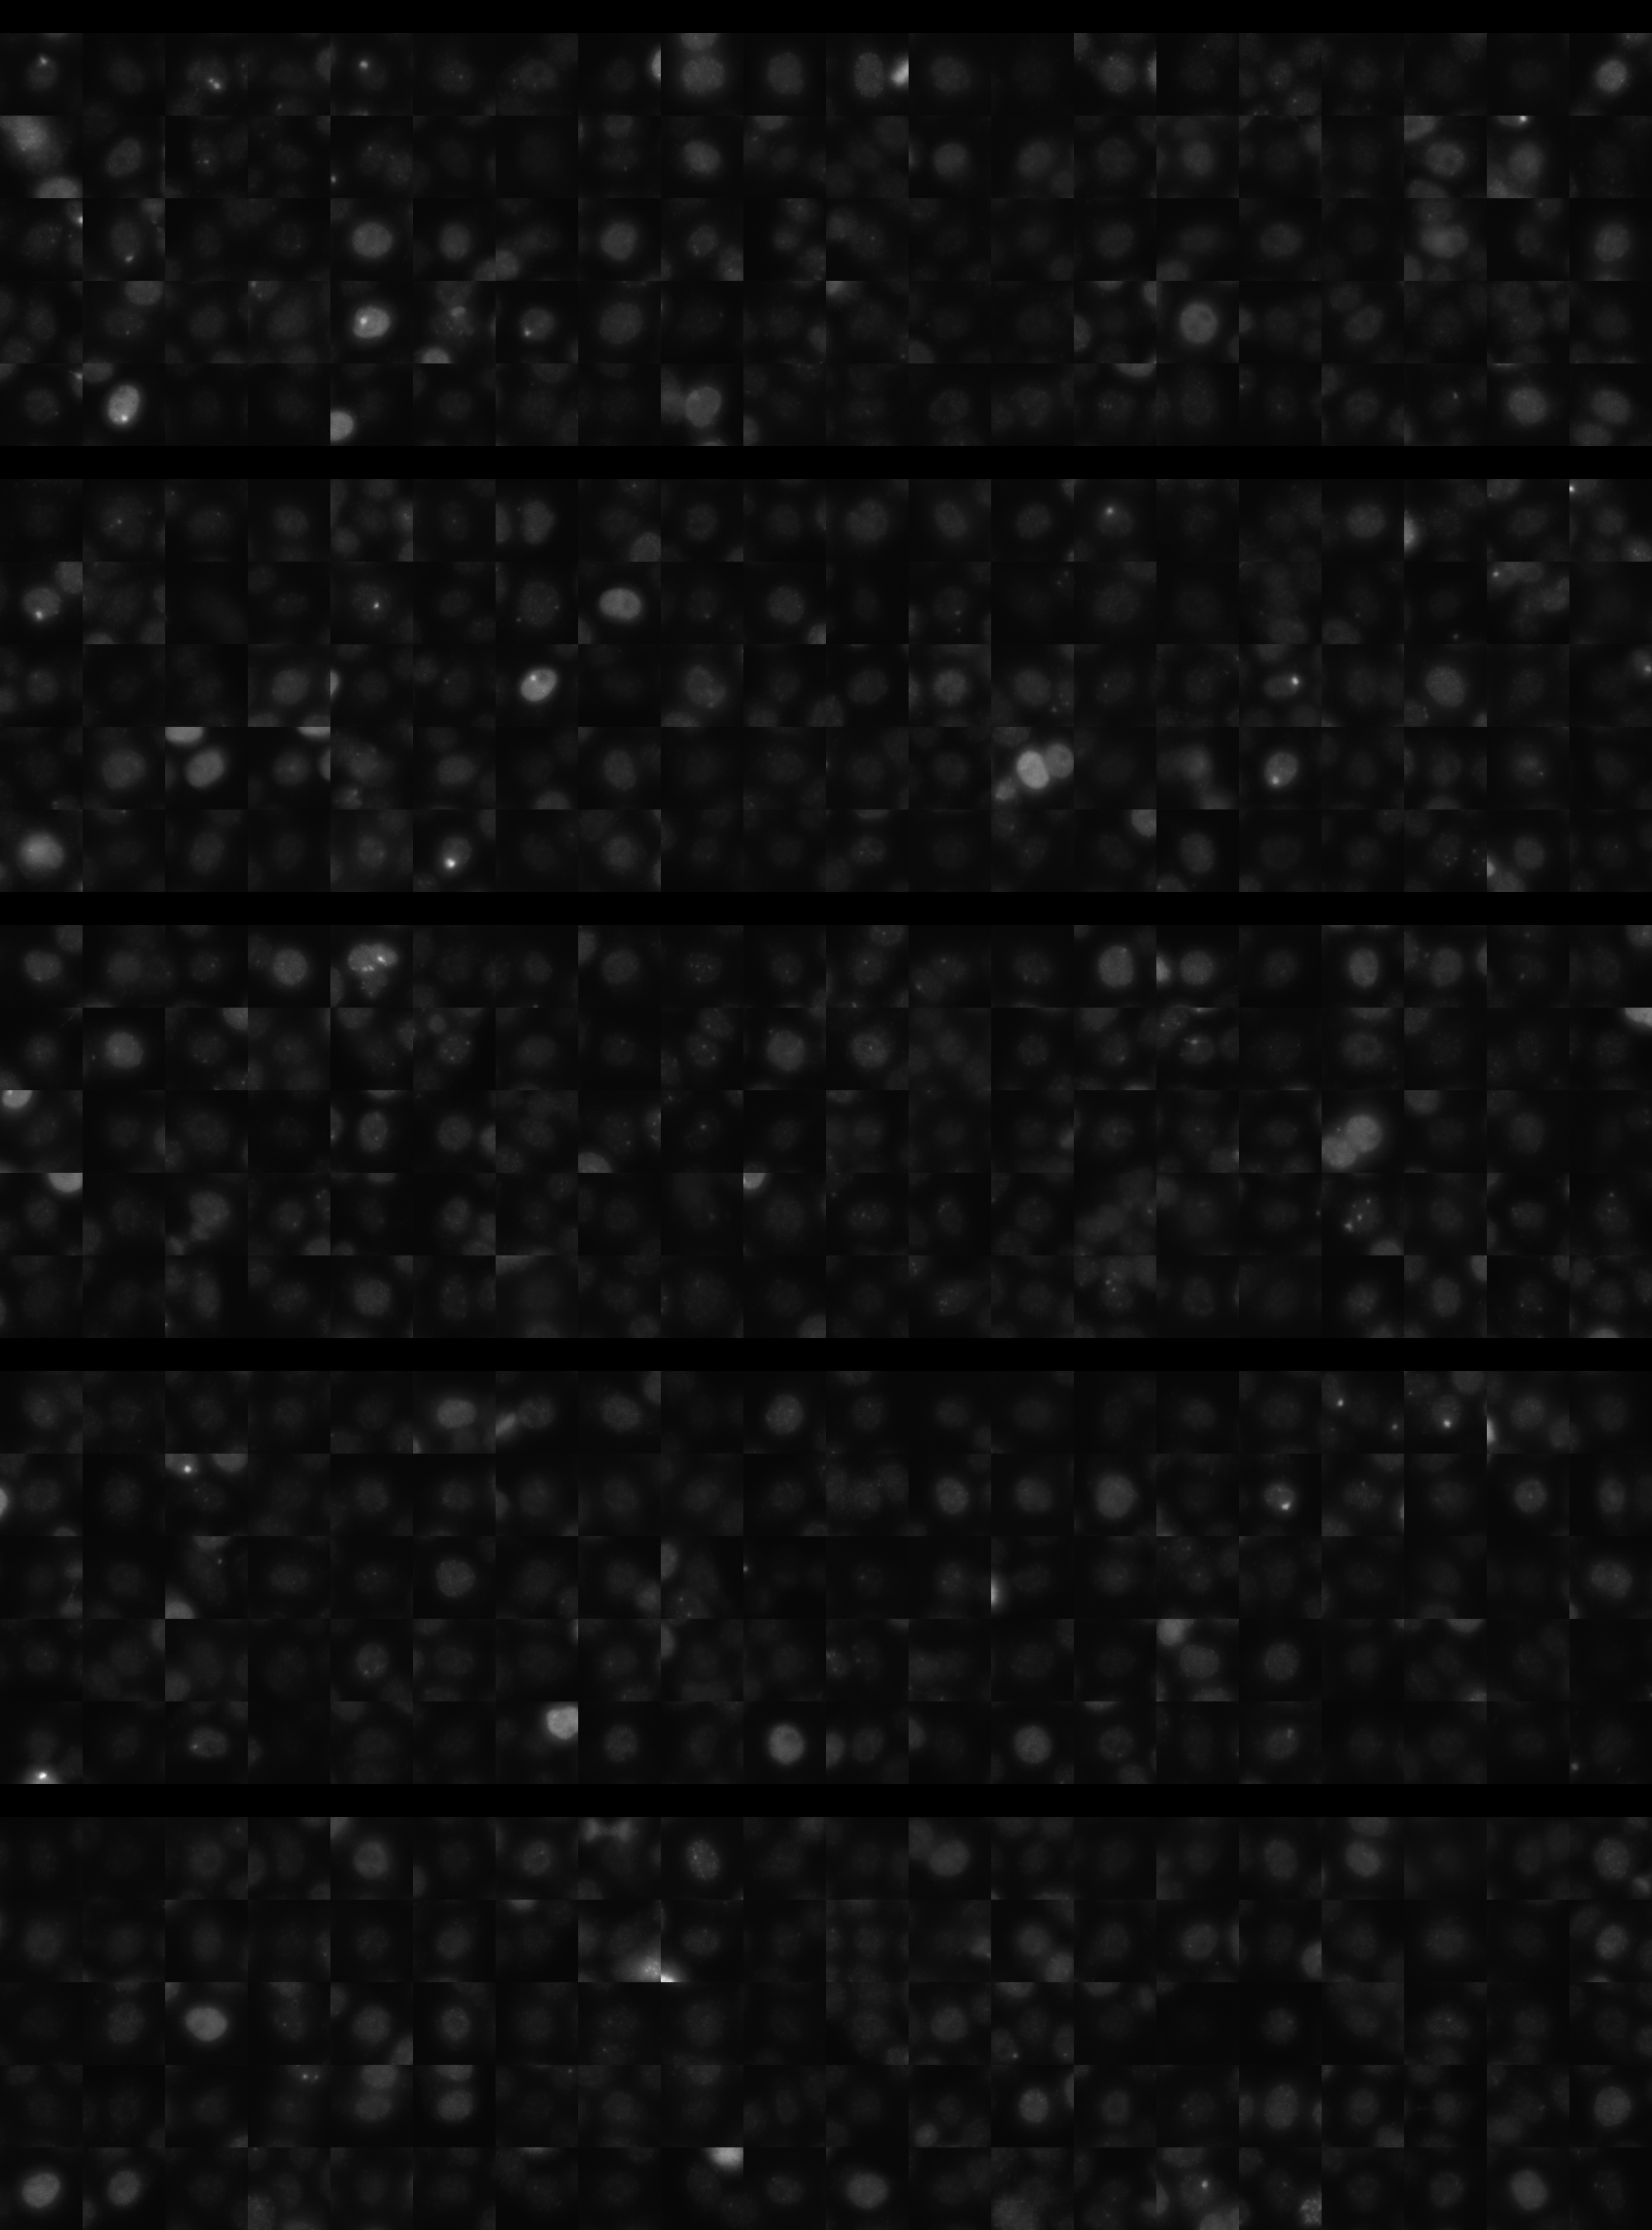
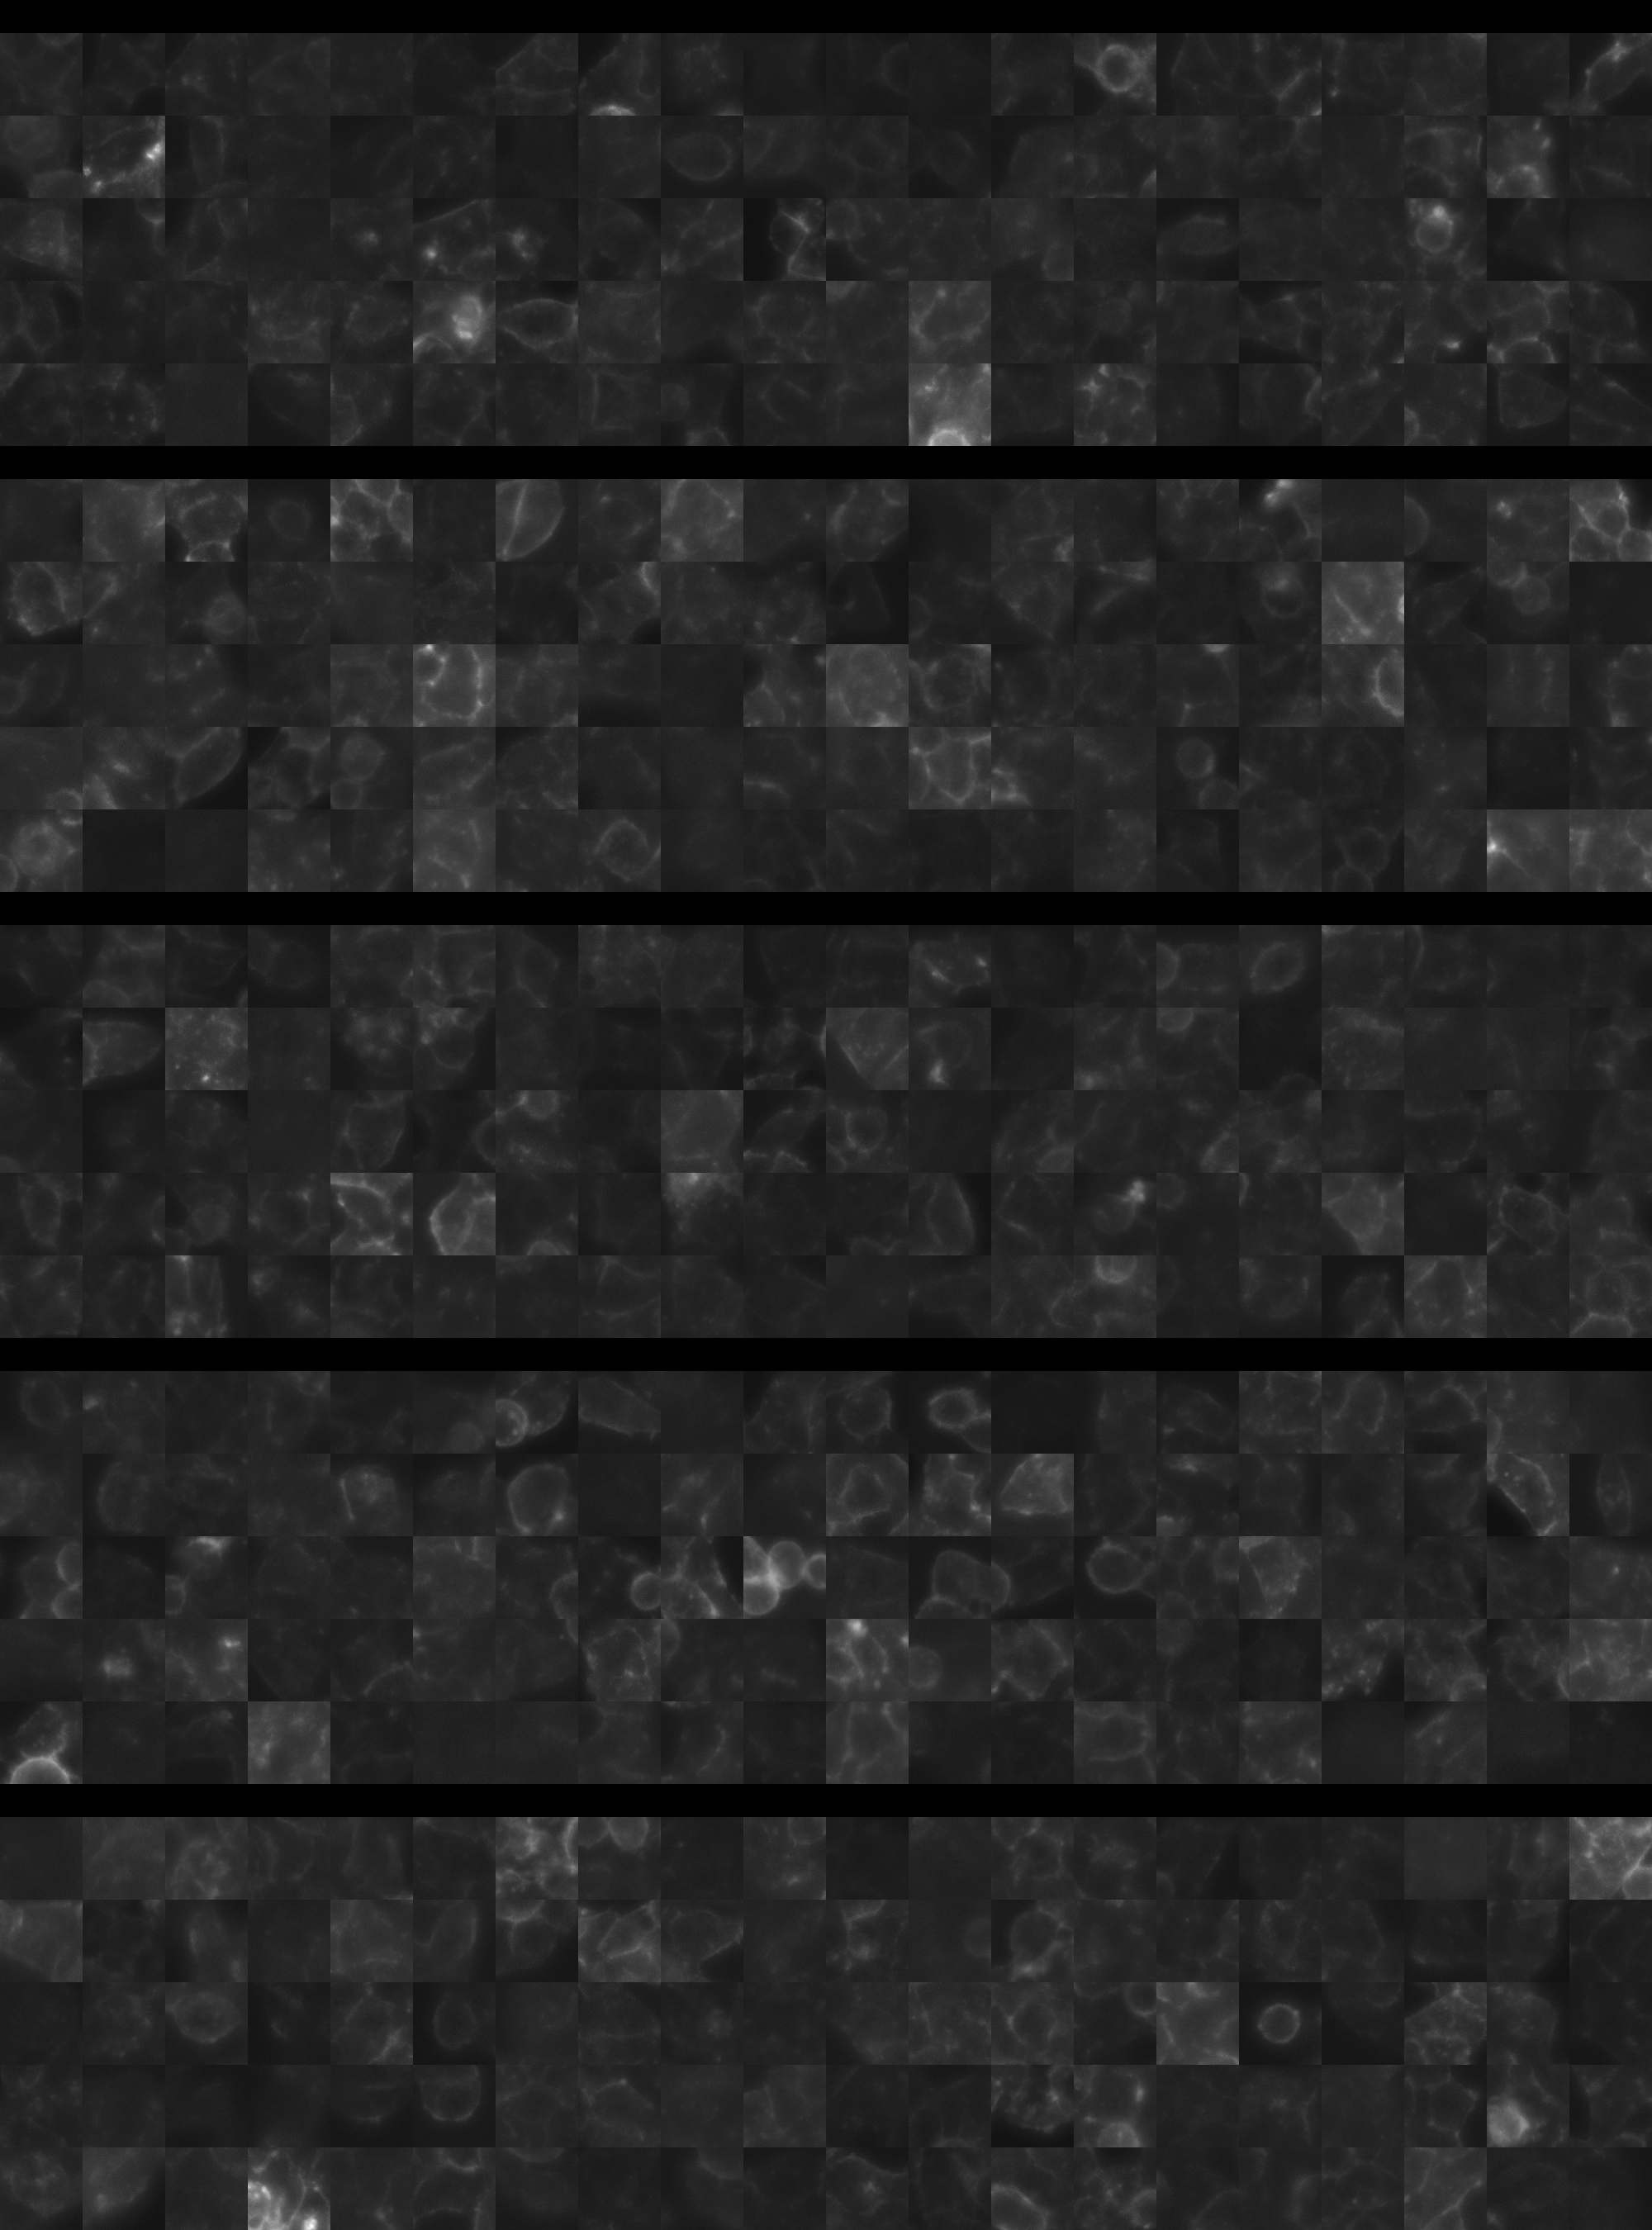
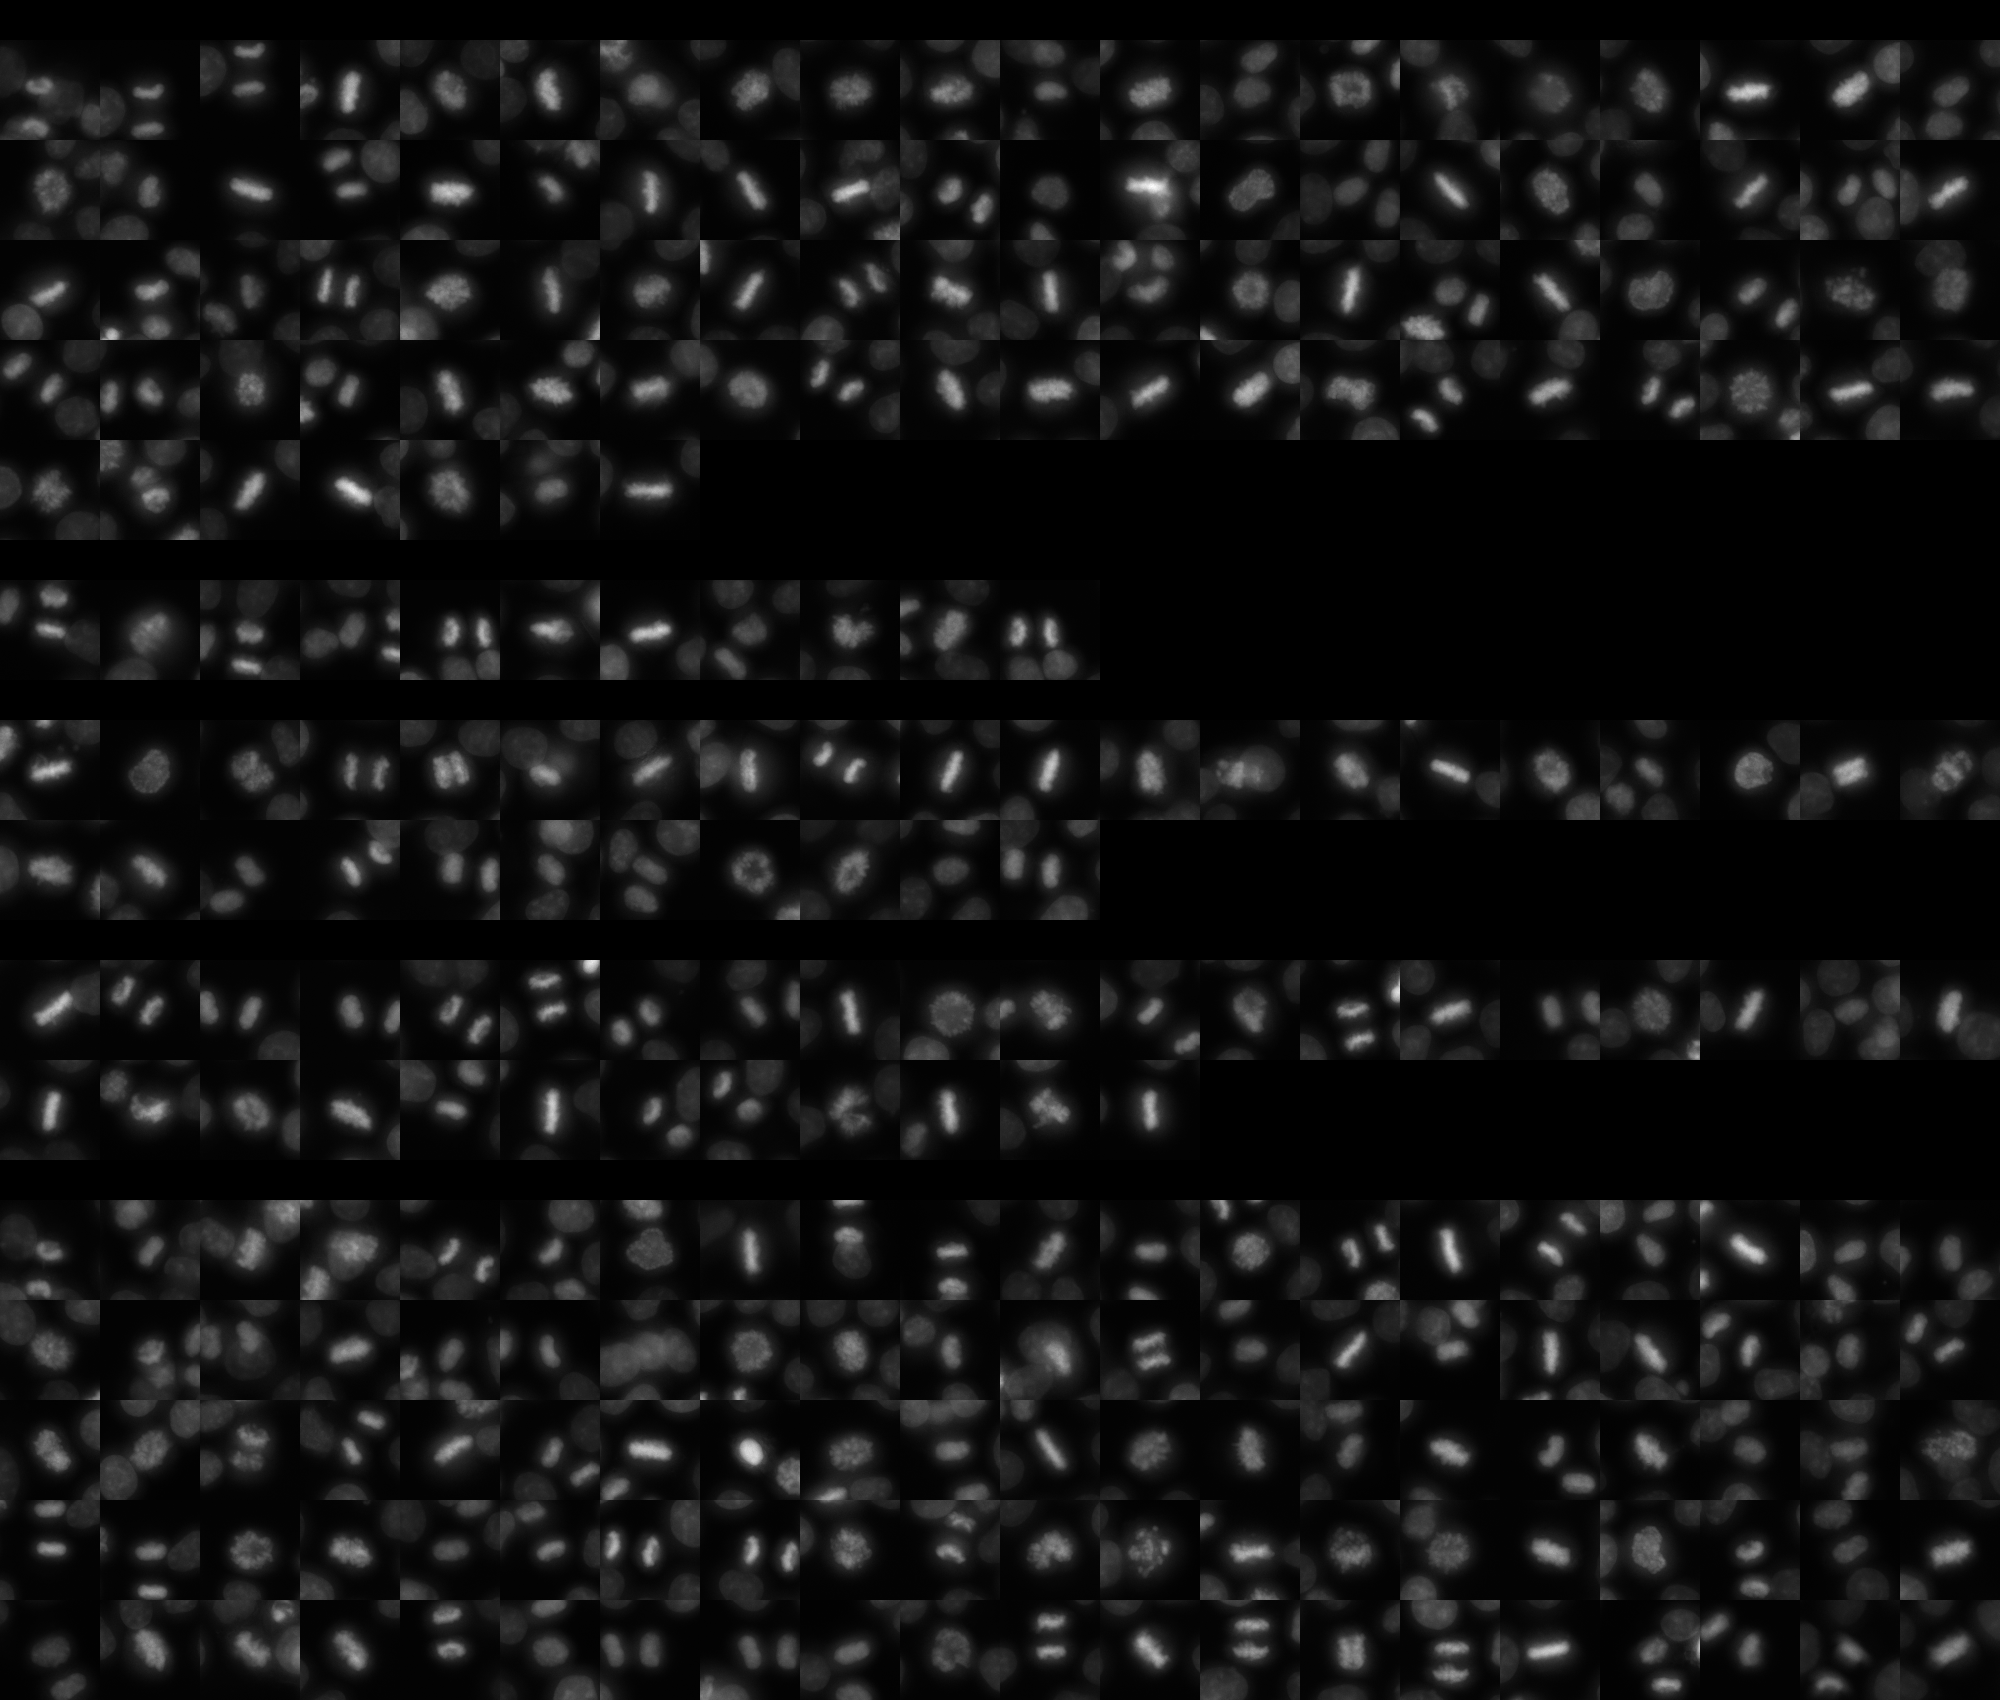
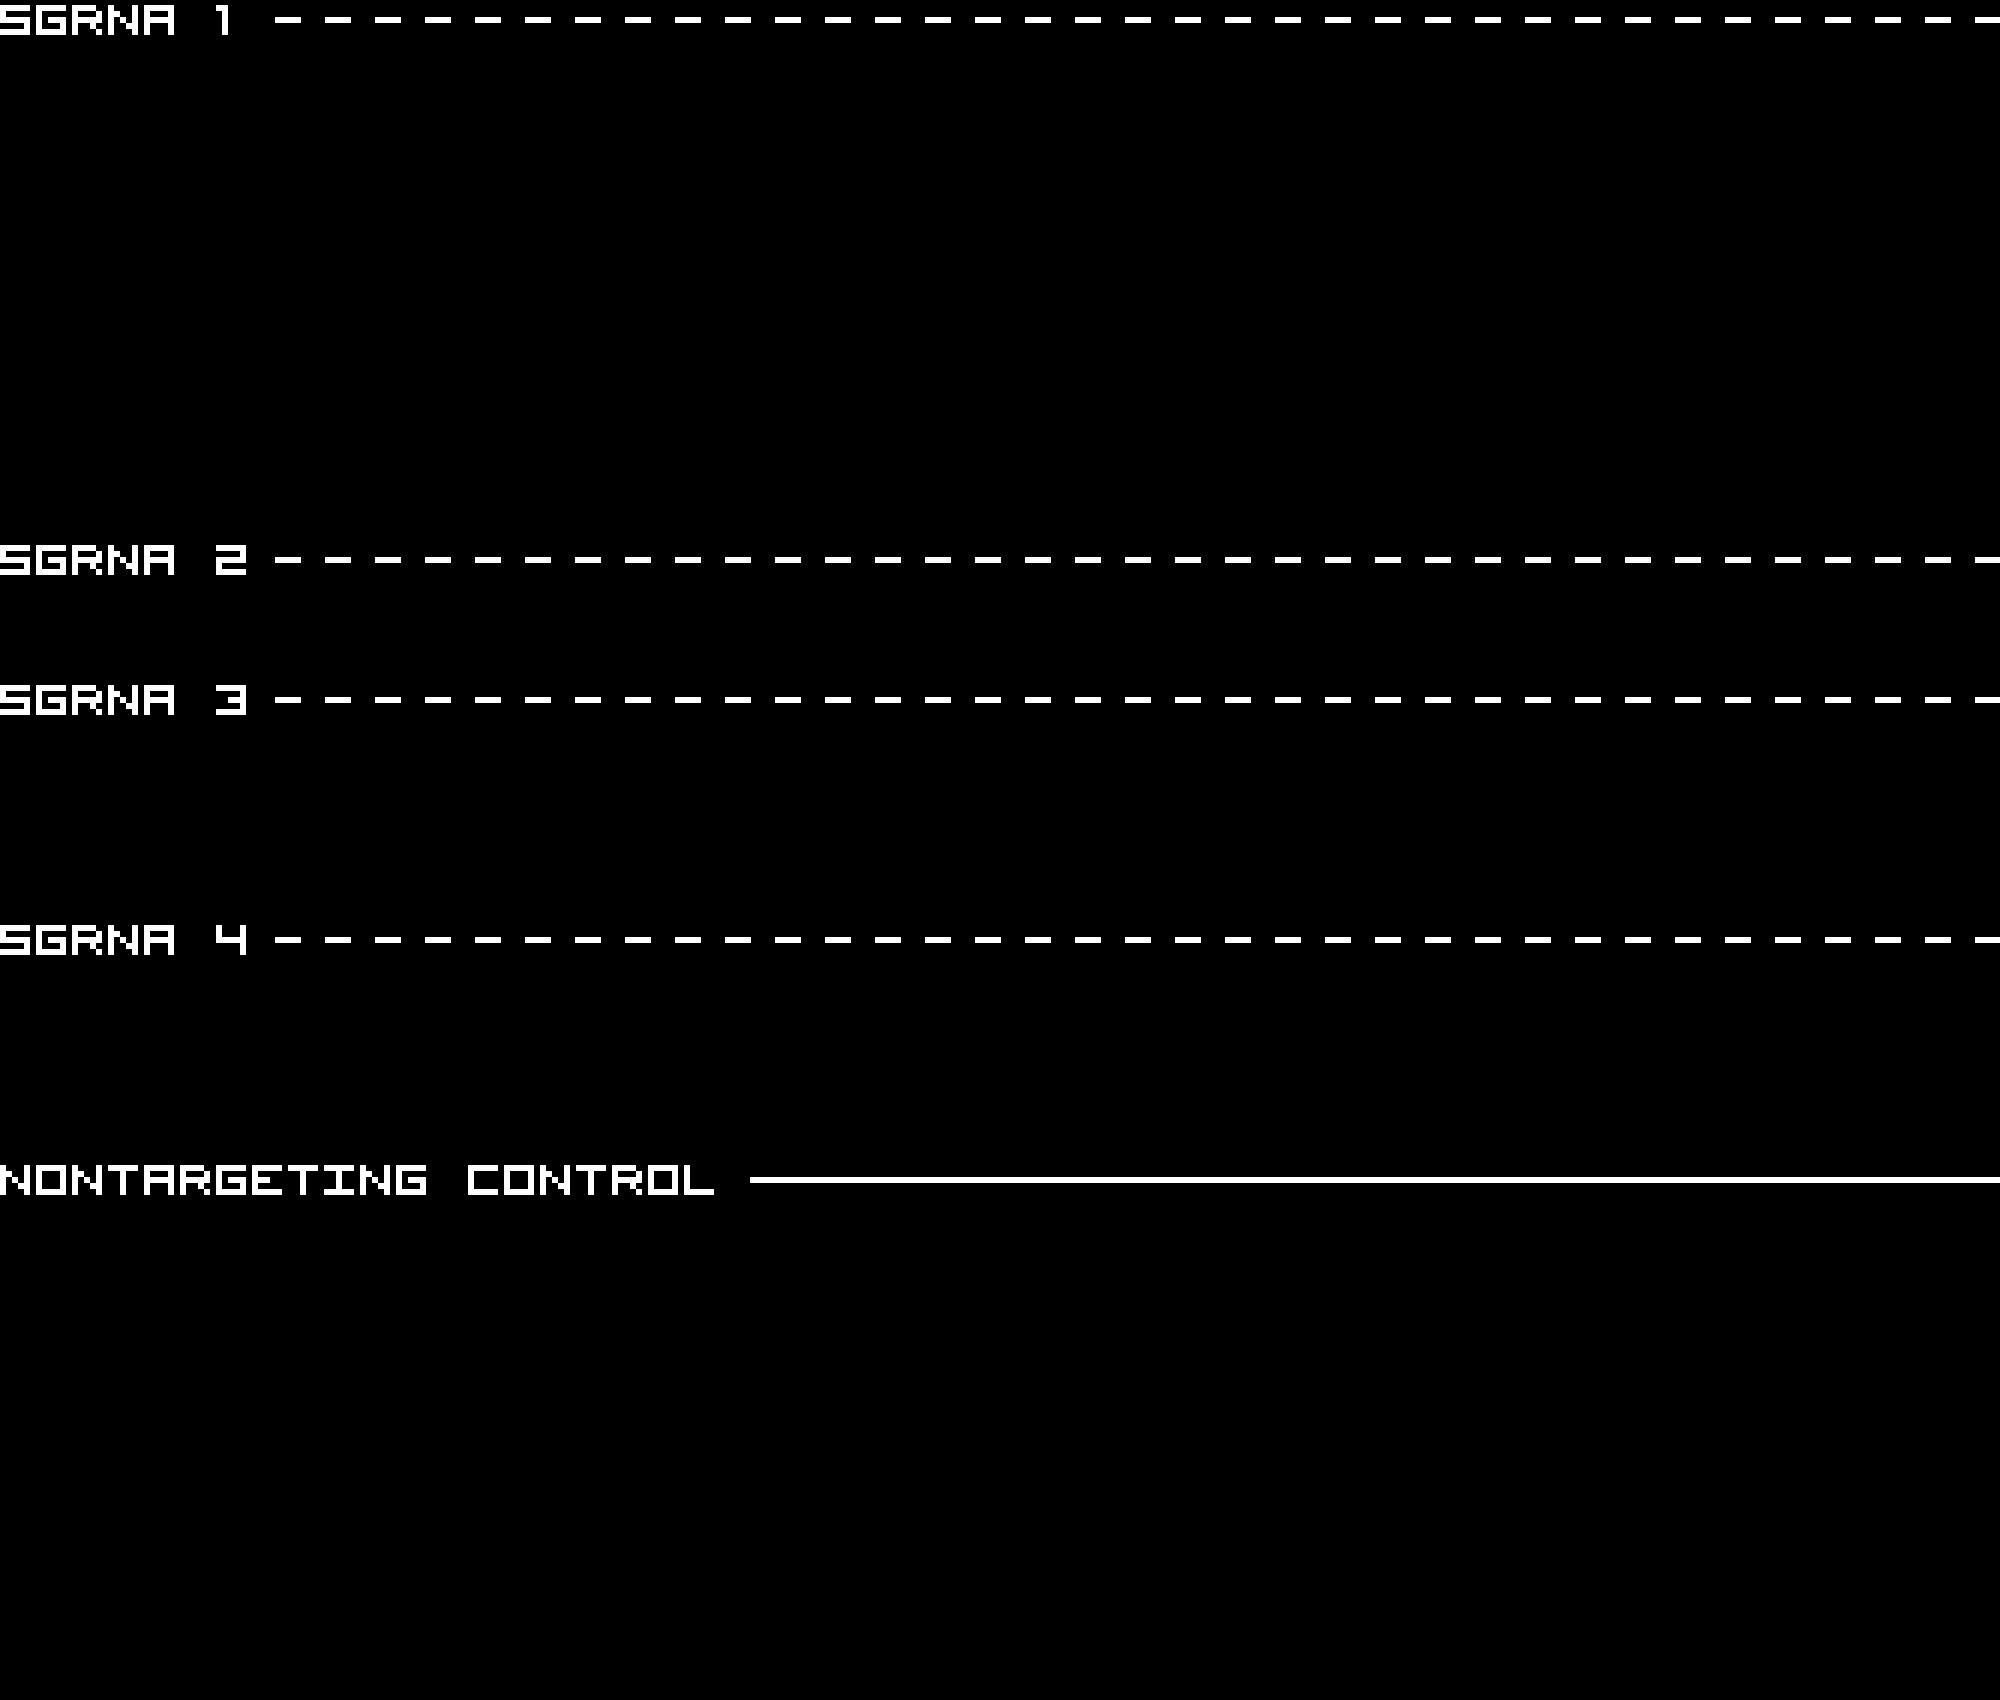
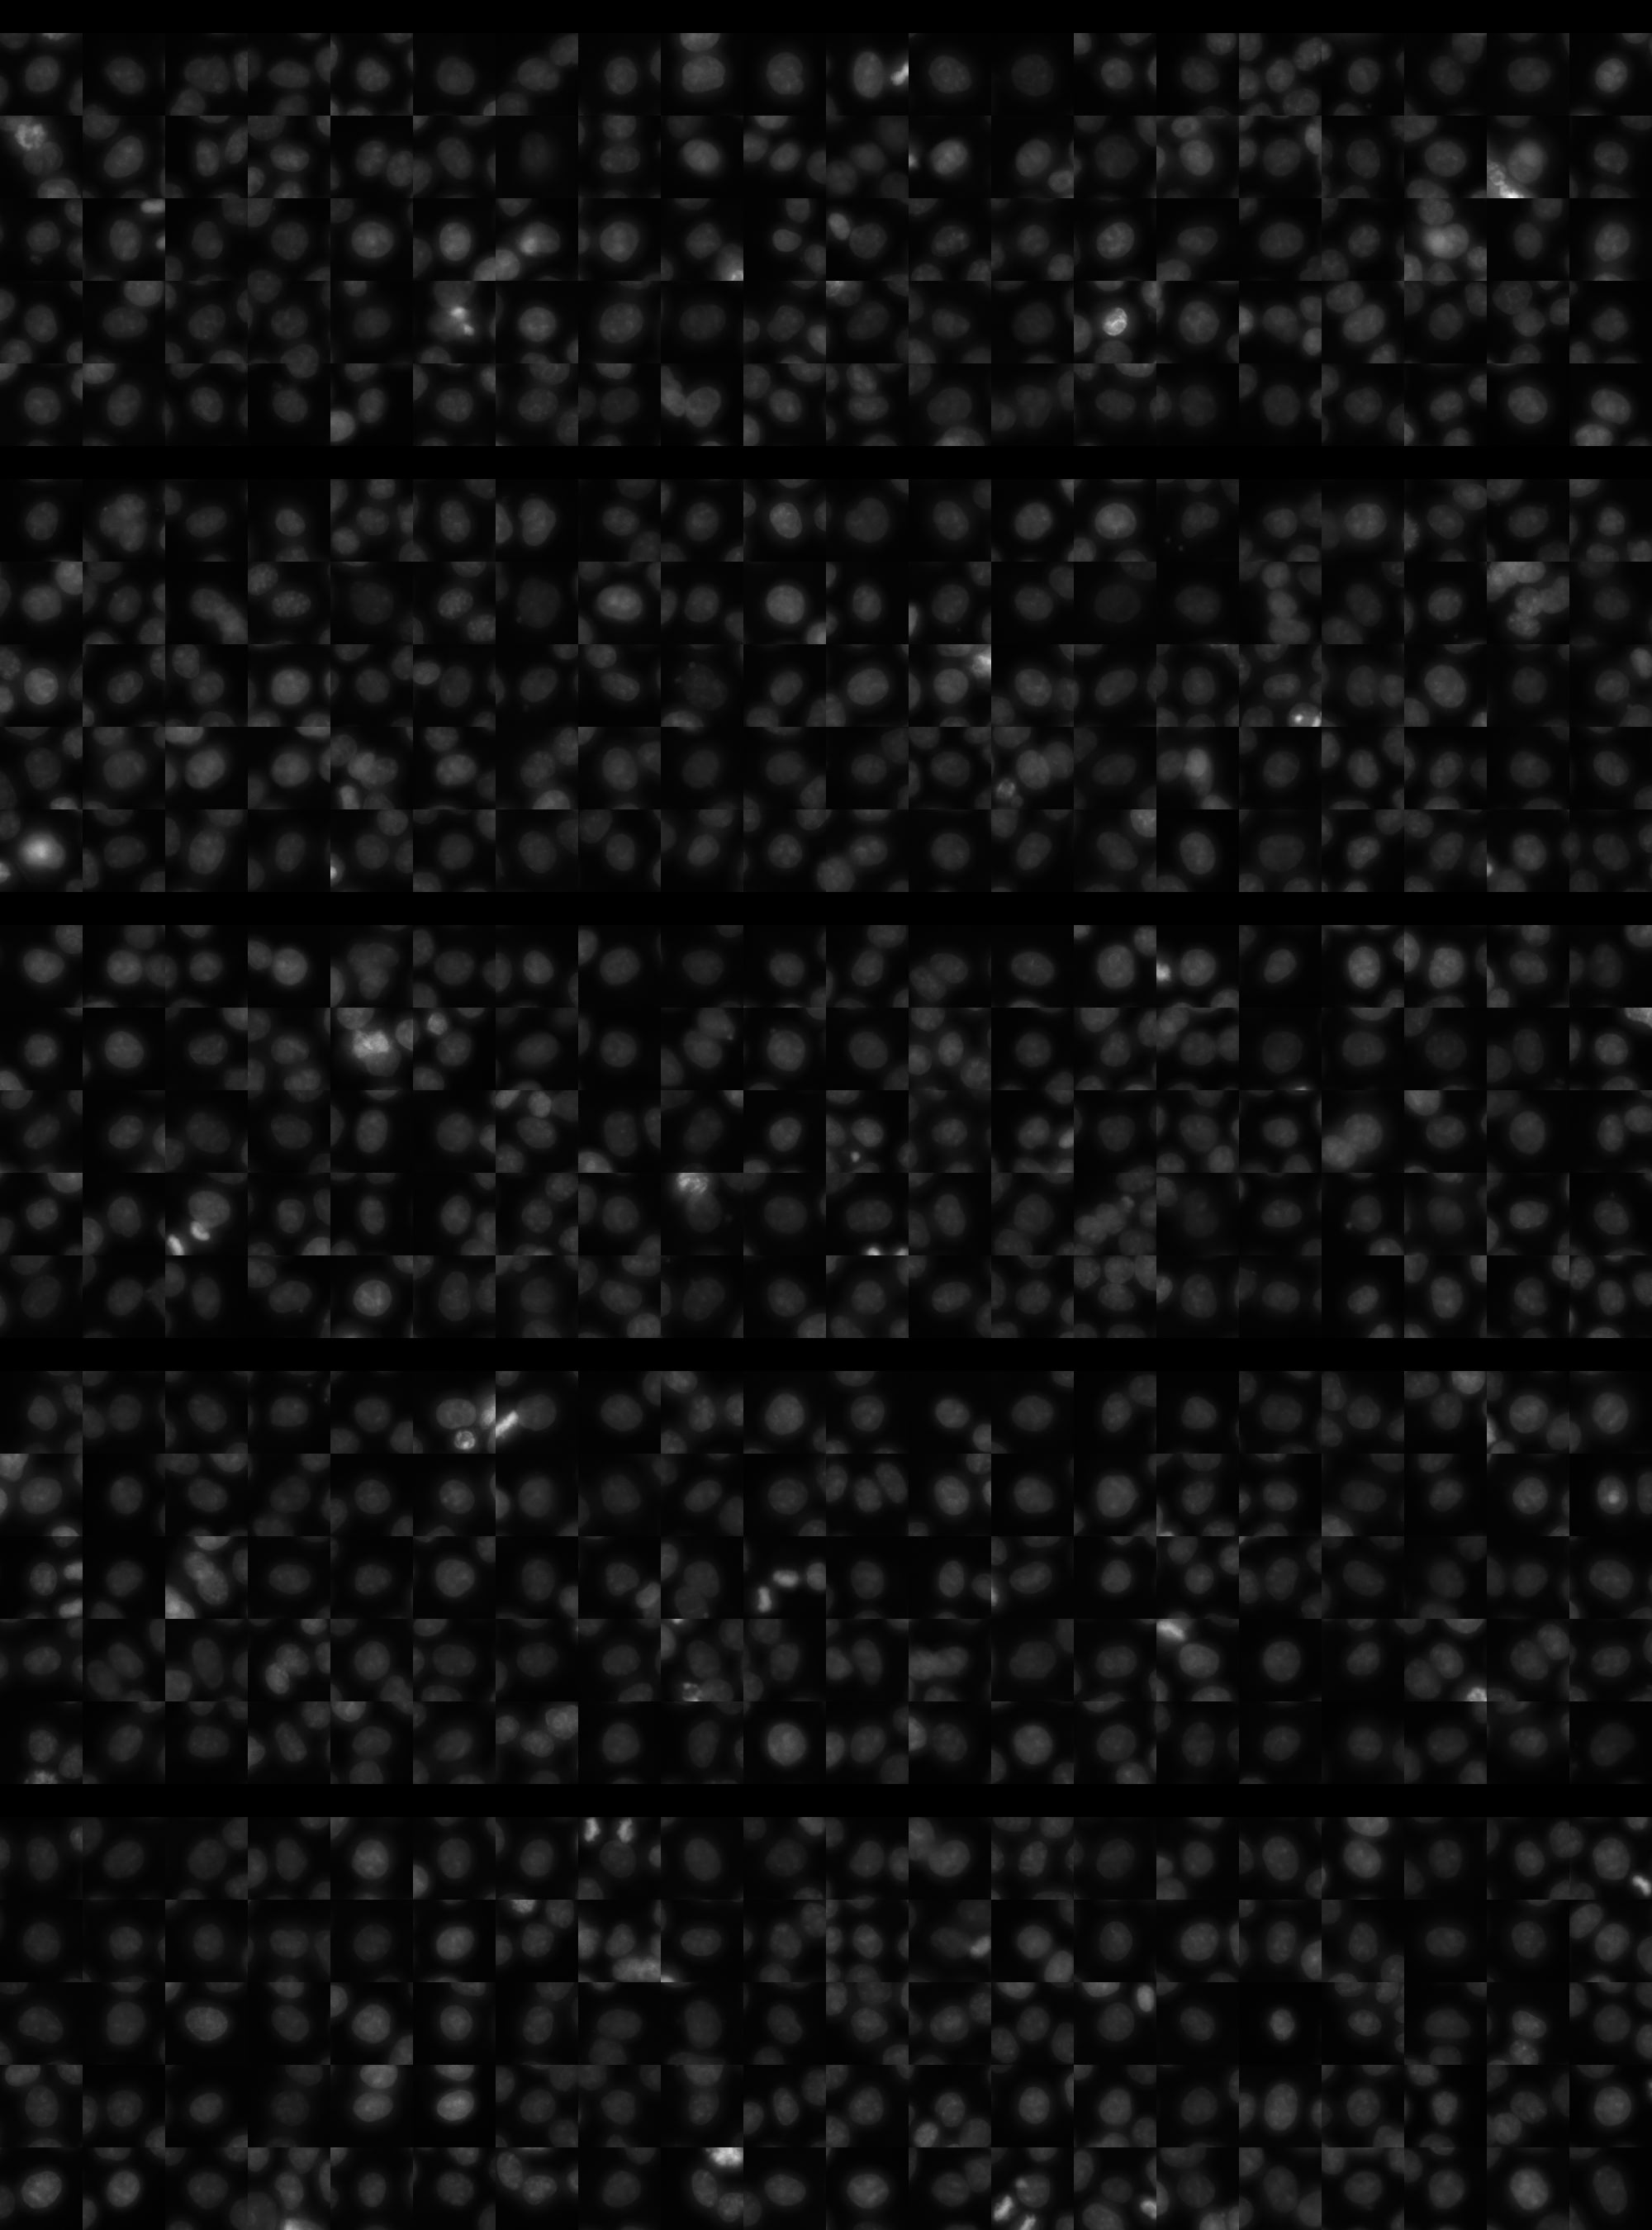
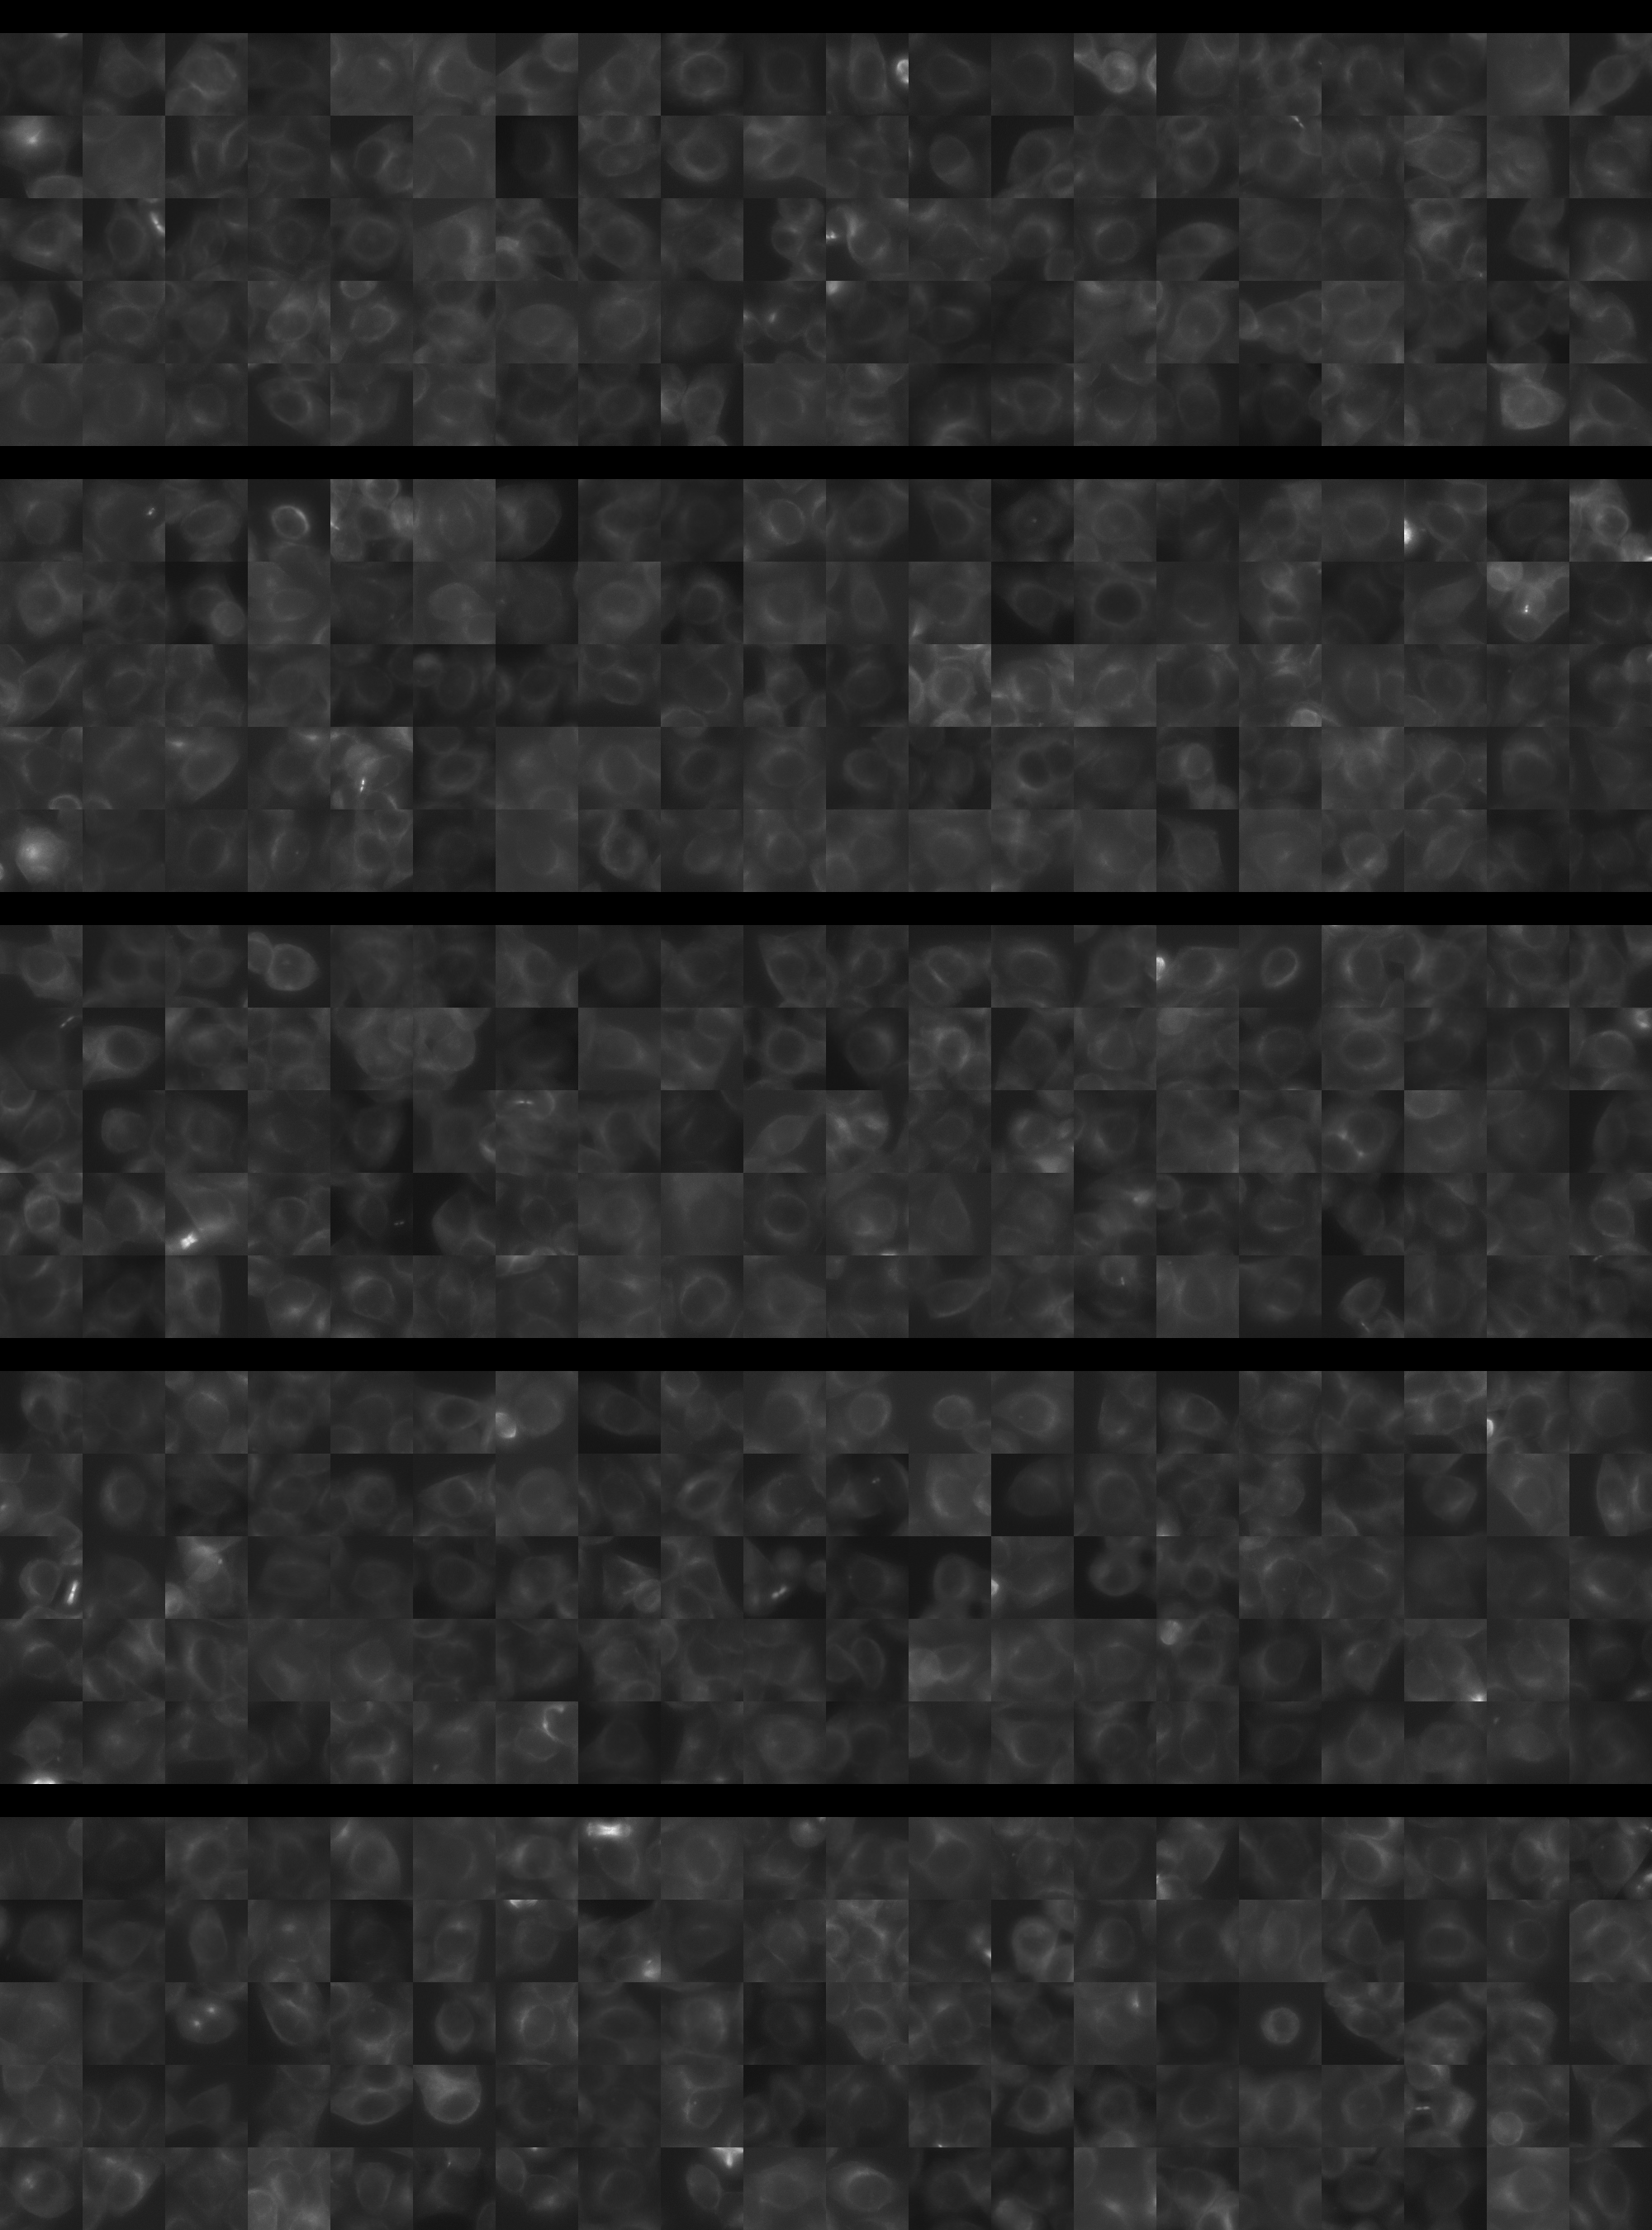
Each montage below shows randomly selected individual cell images for the same target gene separated by sgRNA, along with an example montage of cells expressing a non-targeting negative control sgRNA at the bottom. sgRNA labels in the montages correspond to the numbered sgRNA sequences in the gene info table above. The DNA (blue) and tubulin (green) channels are displayed by default, with gH2AX (grayscale) and actin (yellow) available using the check boxes. Channel brightness, contrast, and opacity are adjustable by clicking the arrow next to the channel name. When only one channel is selected, the display defaults to grayscale. Click the “Zoom” checkbox above the channel controls to enable image zooming (via scrolling) and panning (via click-and-drag).

The cell boxes displayed for this gene are square, 30.36 μm per side for the interphase montage and 30.36 μm per side for the mitotic montage.
Features

Interphase Score Rank FDR q-value
Nucleus DNA Integrated 0.005 2869 of 5322 0.984
Nucleus DNA Mean 0.022 1338 of 5322 0.625
Nucleus gH2AX Mean 0.112 1666 of 5322 0.010
Nucleus DNA - gH2AX Correlation -8.010e-02 3454 of 5322 0.009
Nucleus Shape Area -4.407e-02 4384 of 5322 0.309
Nucleus Shape Eccentricity 0.042 1189 of 5322 0.309
Nucleus Shape Form Factor -2.515e-02 1514 of 5322 0.598
Nucleus Shape Solidity -4.448e-02 2454 of 5322 0.216
Cell DNA Mass Displacement 0.023 2858 of 5322 0.763
Cell Tubulin Mean -5.917e-02 4495 of 5322 0.213
Cell Tubulin Mass Displacement -1.277e-02 3707 of 5322 0.876
Cell Actin Mean -3.635e-02 4066 of 5322 0.530
Cell Tubulin - Actin Correlation 0.012 3087 of 5322 0.814
Cell DNA - Tubulin Correlation 0.008 3514 of 5322 0.886
Cell Shape Area -5.079e-02 4386 of 5322 0.255
Cell Shape Eccentricity 0.028 1610 of 5322 0.730
Mitotic Score Rank FDR q-value
Nucleus DNA Integrated 0.147 1852 of 5322 0.937
Nucleus DNA Mean 0.036 2366 of 5322 1.000
Nucleus DNA Mass Displacement 0.024 3129 of 5322 0.999
Nucleus DNA Mean Frac 3 -9.238e-02 4354 of 5322 1.000
Nucleus gH2AX Mean -3.831e-02 3482 of 5322 1.000
Nucleus gH2AX Mean Frac 0 0.074 1234 of 5322 1.000
Nucleus Tubulin Mean Frac 0 -2.961e-02 3905 of 5322 0.999
Nucleus Tubulin Mean Edge -8.654e-02 4221 of 5322 0.999
Nucleus Tubulin Std Edge -3.081e-03 2605 of 5322 0.999
Nucleus Shape Area 0.046 3389 of 5322 0.990
Nucleus Shape Eccentricity 0.091 936 of 5322 1.000
Nucleus Shape Form Factor 0.003 1340 of 5322 0.998
Cell Tubulin Mean -6.878e-02 4307 of 5322 0.997
Cell Tubulin Mean Frac 3 0.024 1413 of 5322 0.999
Cell Actin Mean 0.149 1308 of 5322 0.997
Cell Shape Area 0.196 1437 of 5322 0.994
( Reset Zoom )
Brightness
Contrast
Opacity
Brightness
Contrast
Opacity
Brightness
Contrast
Opacity
Brightness
Contrast
Opacity
Brightness
Contrast
Opacity

( Reset Zoom )
Brightness
Contrast
Opacity
Brightness
Contrast
Opacity
Brightness
Contrast
Opacity
Brightness
Contrast
Opacity
Brightness
Contrast
Opacity

MIT Central Accessability