LONP1

Gene symbol: LONP1
Gene: 9361
Uniprot Function: ATP-dependent serine protease that mediates the selective degradation of misfolded, unassembled or oxidatively damaged polypeptides as well as certain short-lived regulatory proteins in the mitochondrial matrix. May also have a chaperone function in the assembly of inner membrane protein complexes. Participates in the regulation of mitochondrial gene expression and in the maintenance of the integrity of the mitochondrial genome. Binds to mitochondrial promoters and RNA in a single-stranded, site-specific, and strand-specific manner. May regulate mitochondrial DNA replication and/or gene expression using site-specific, single-stranded DNA binding to target the degradation of regulatory proteins binding to adjacent sites in mitochondrial promoters (PubMed:12198491, PubMed:15870080, PubMed:17420247, PubMed:8248235). Endogenous substrates include mitochondrial steroidogenic acute regulatory (StAR) protein, helicase Twinkle (TWNK) and the large ribosomal subunit protein bL32m. bL32m is protected from degradation by LONP1 when it is bound to a nucleic acid (RNA), but TWNK is not (PubMed:17579211, PubMed:28377575).
Mitotic Index 0.0281
Interphase Cluster: #141 (20 genes)
Mitotic Cluster: #116 (23 genes)
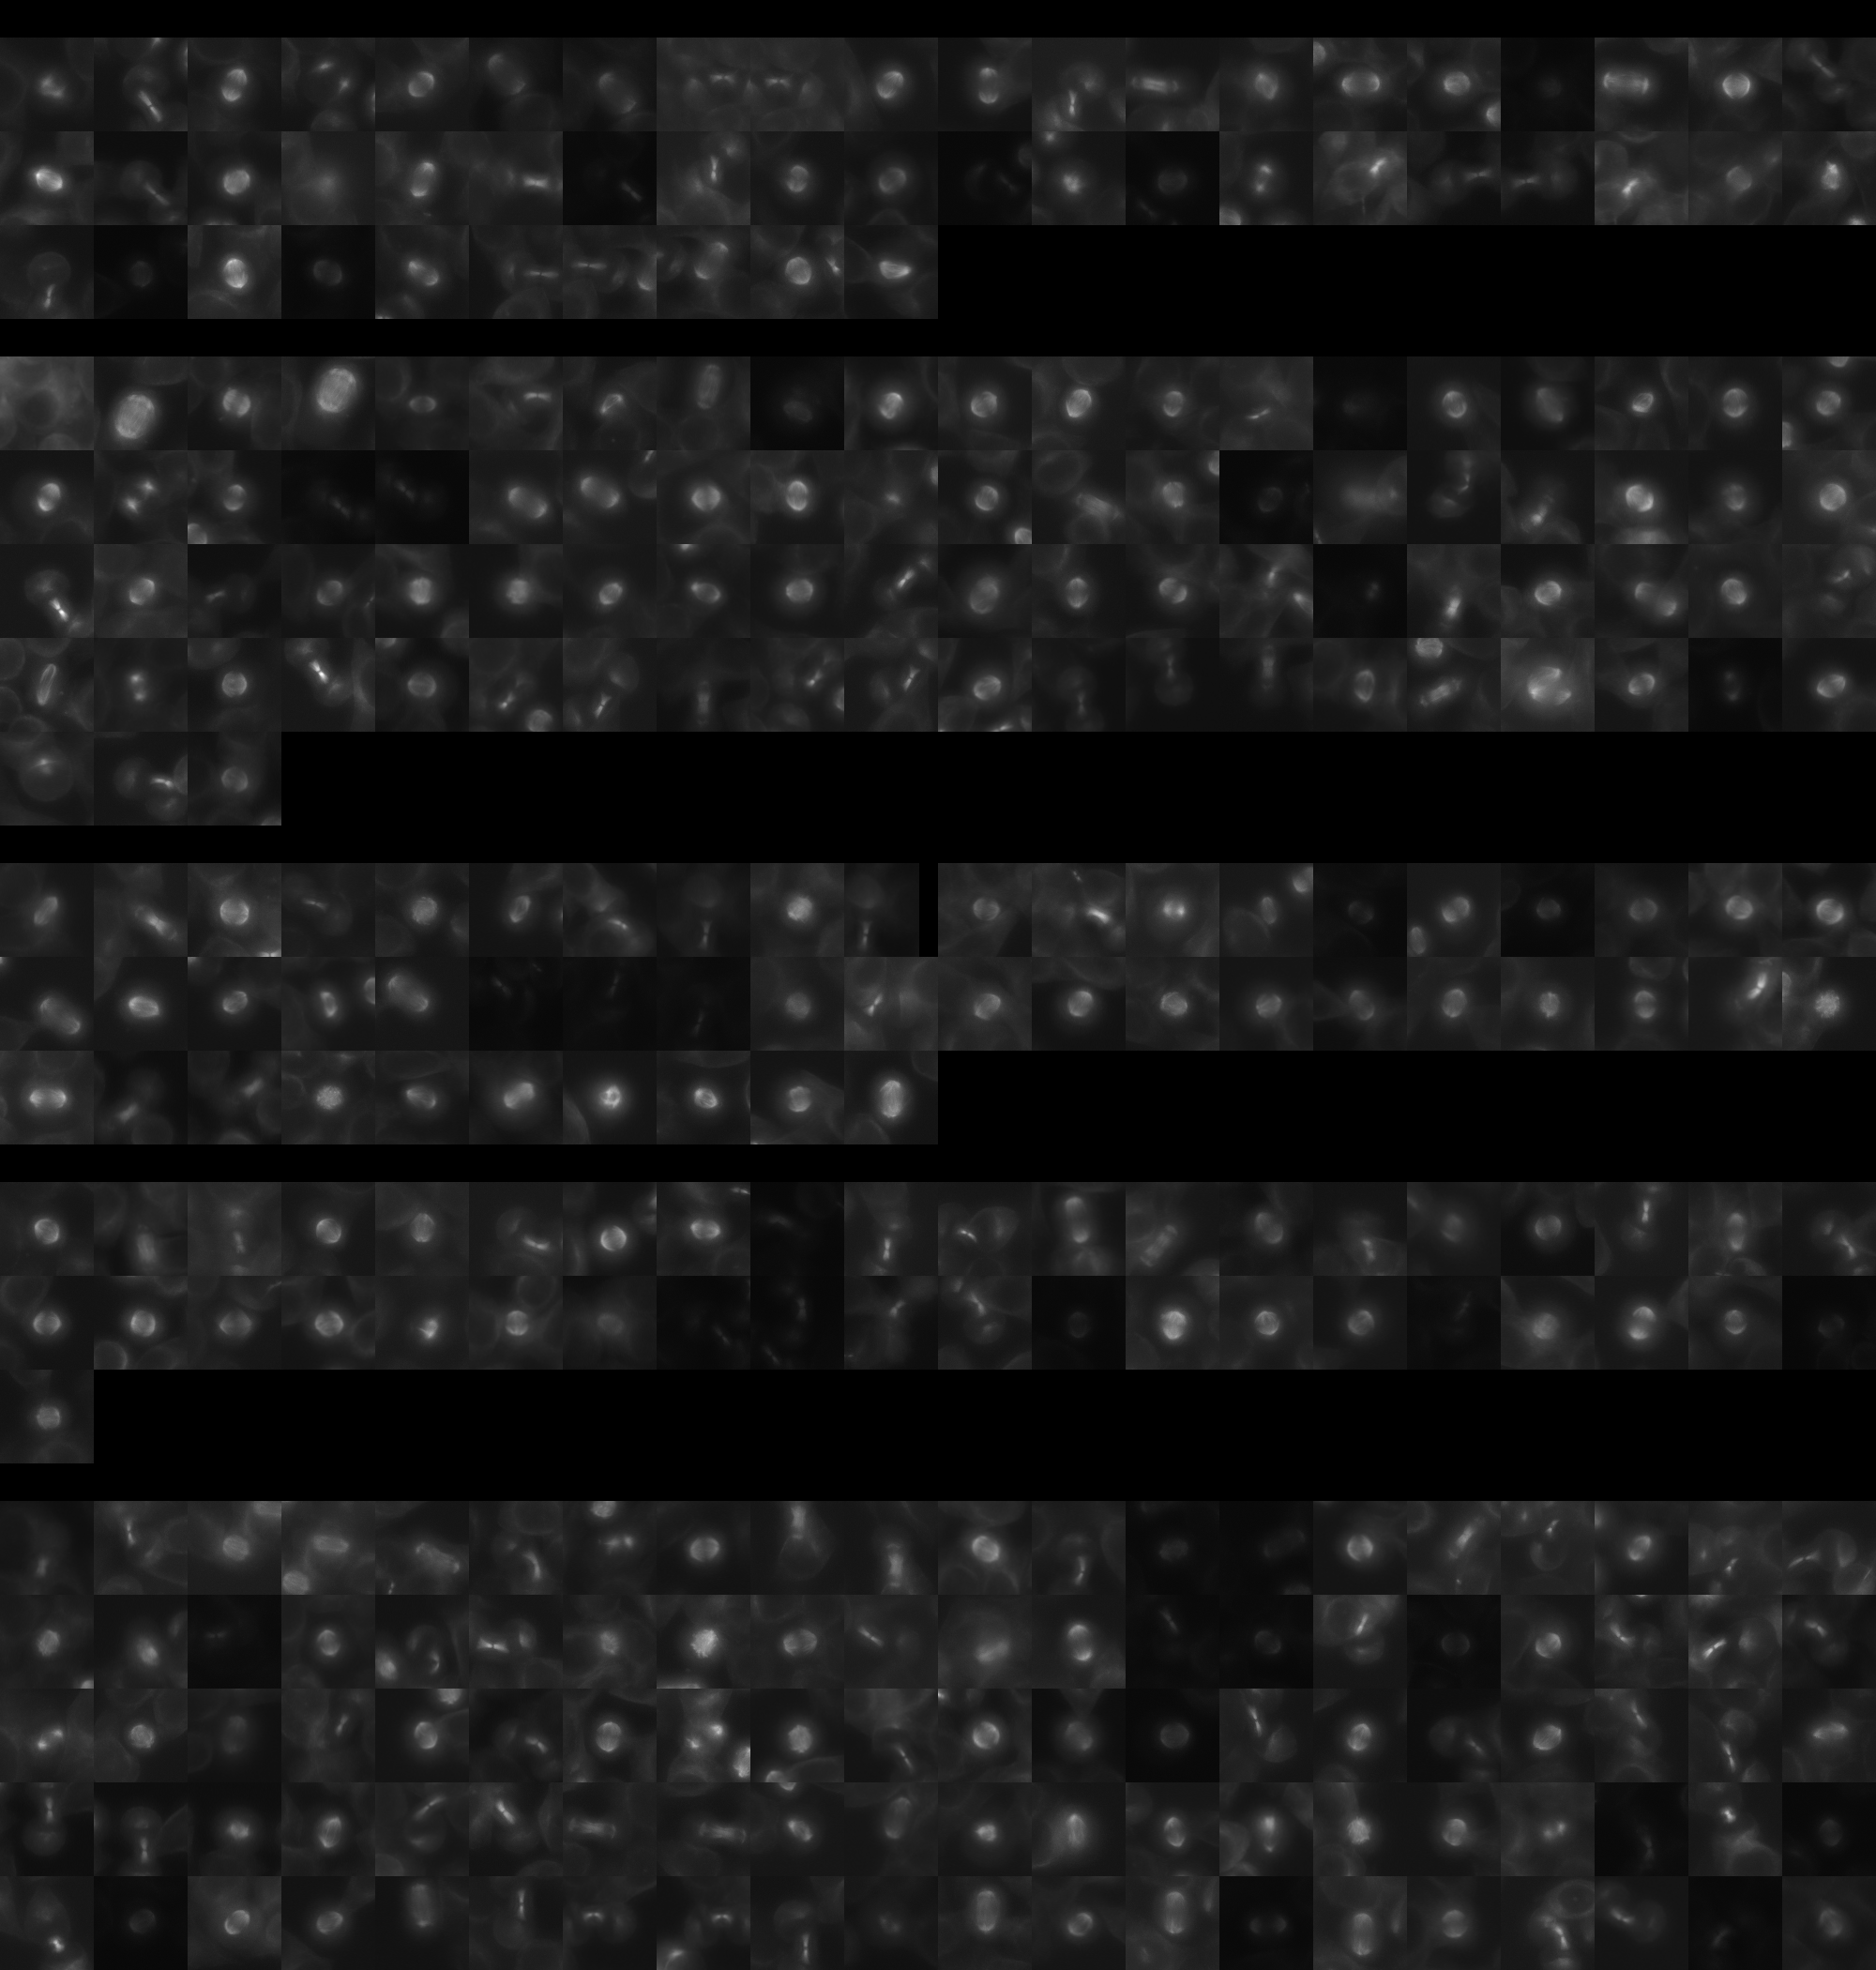
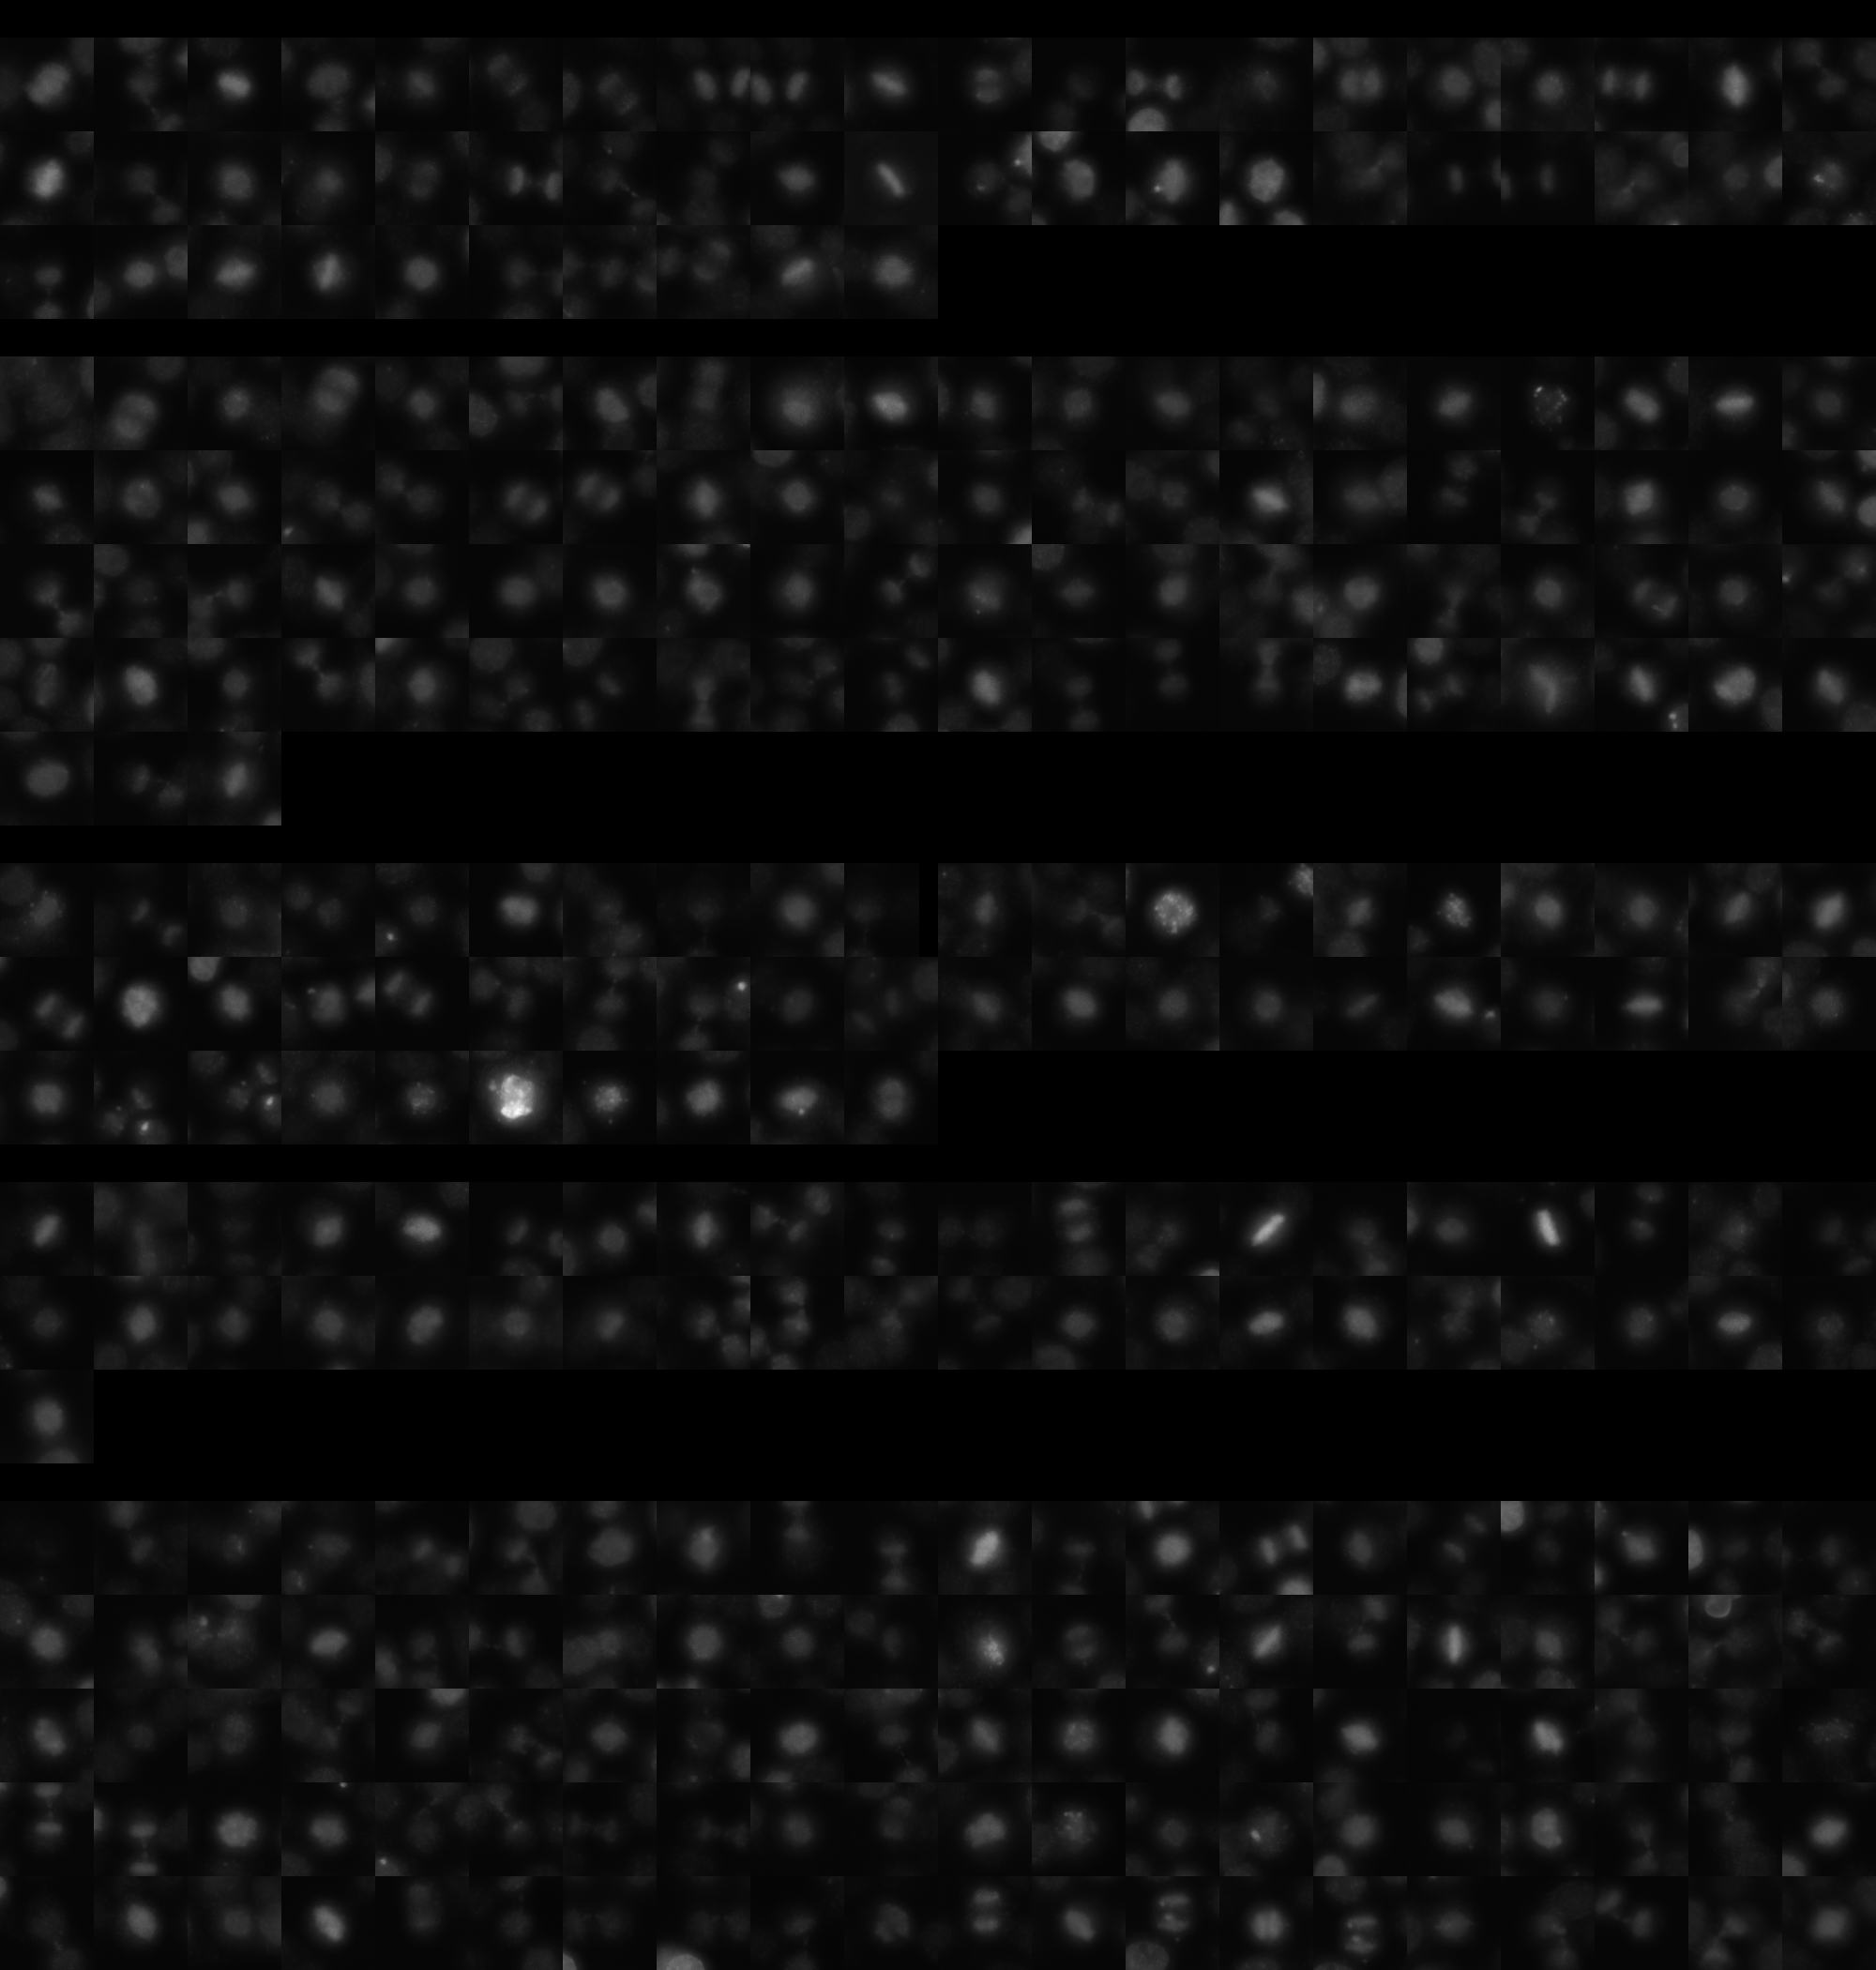
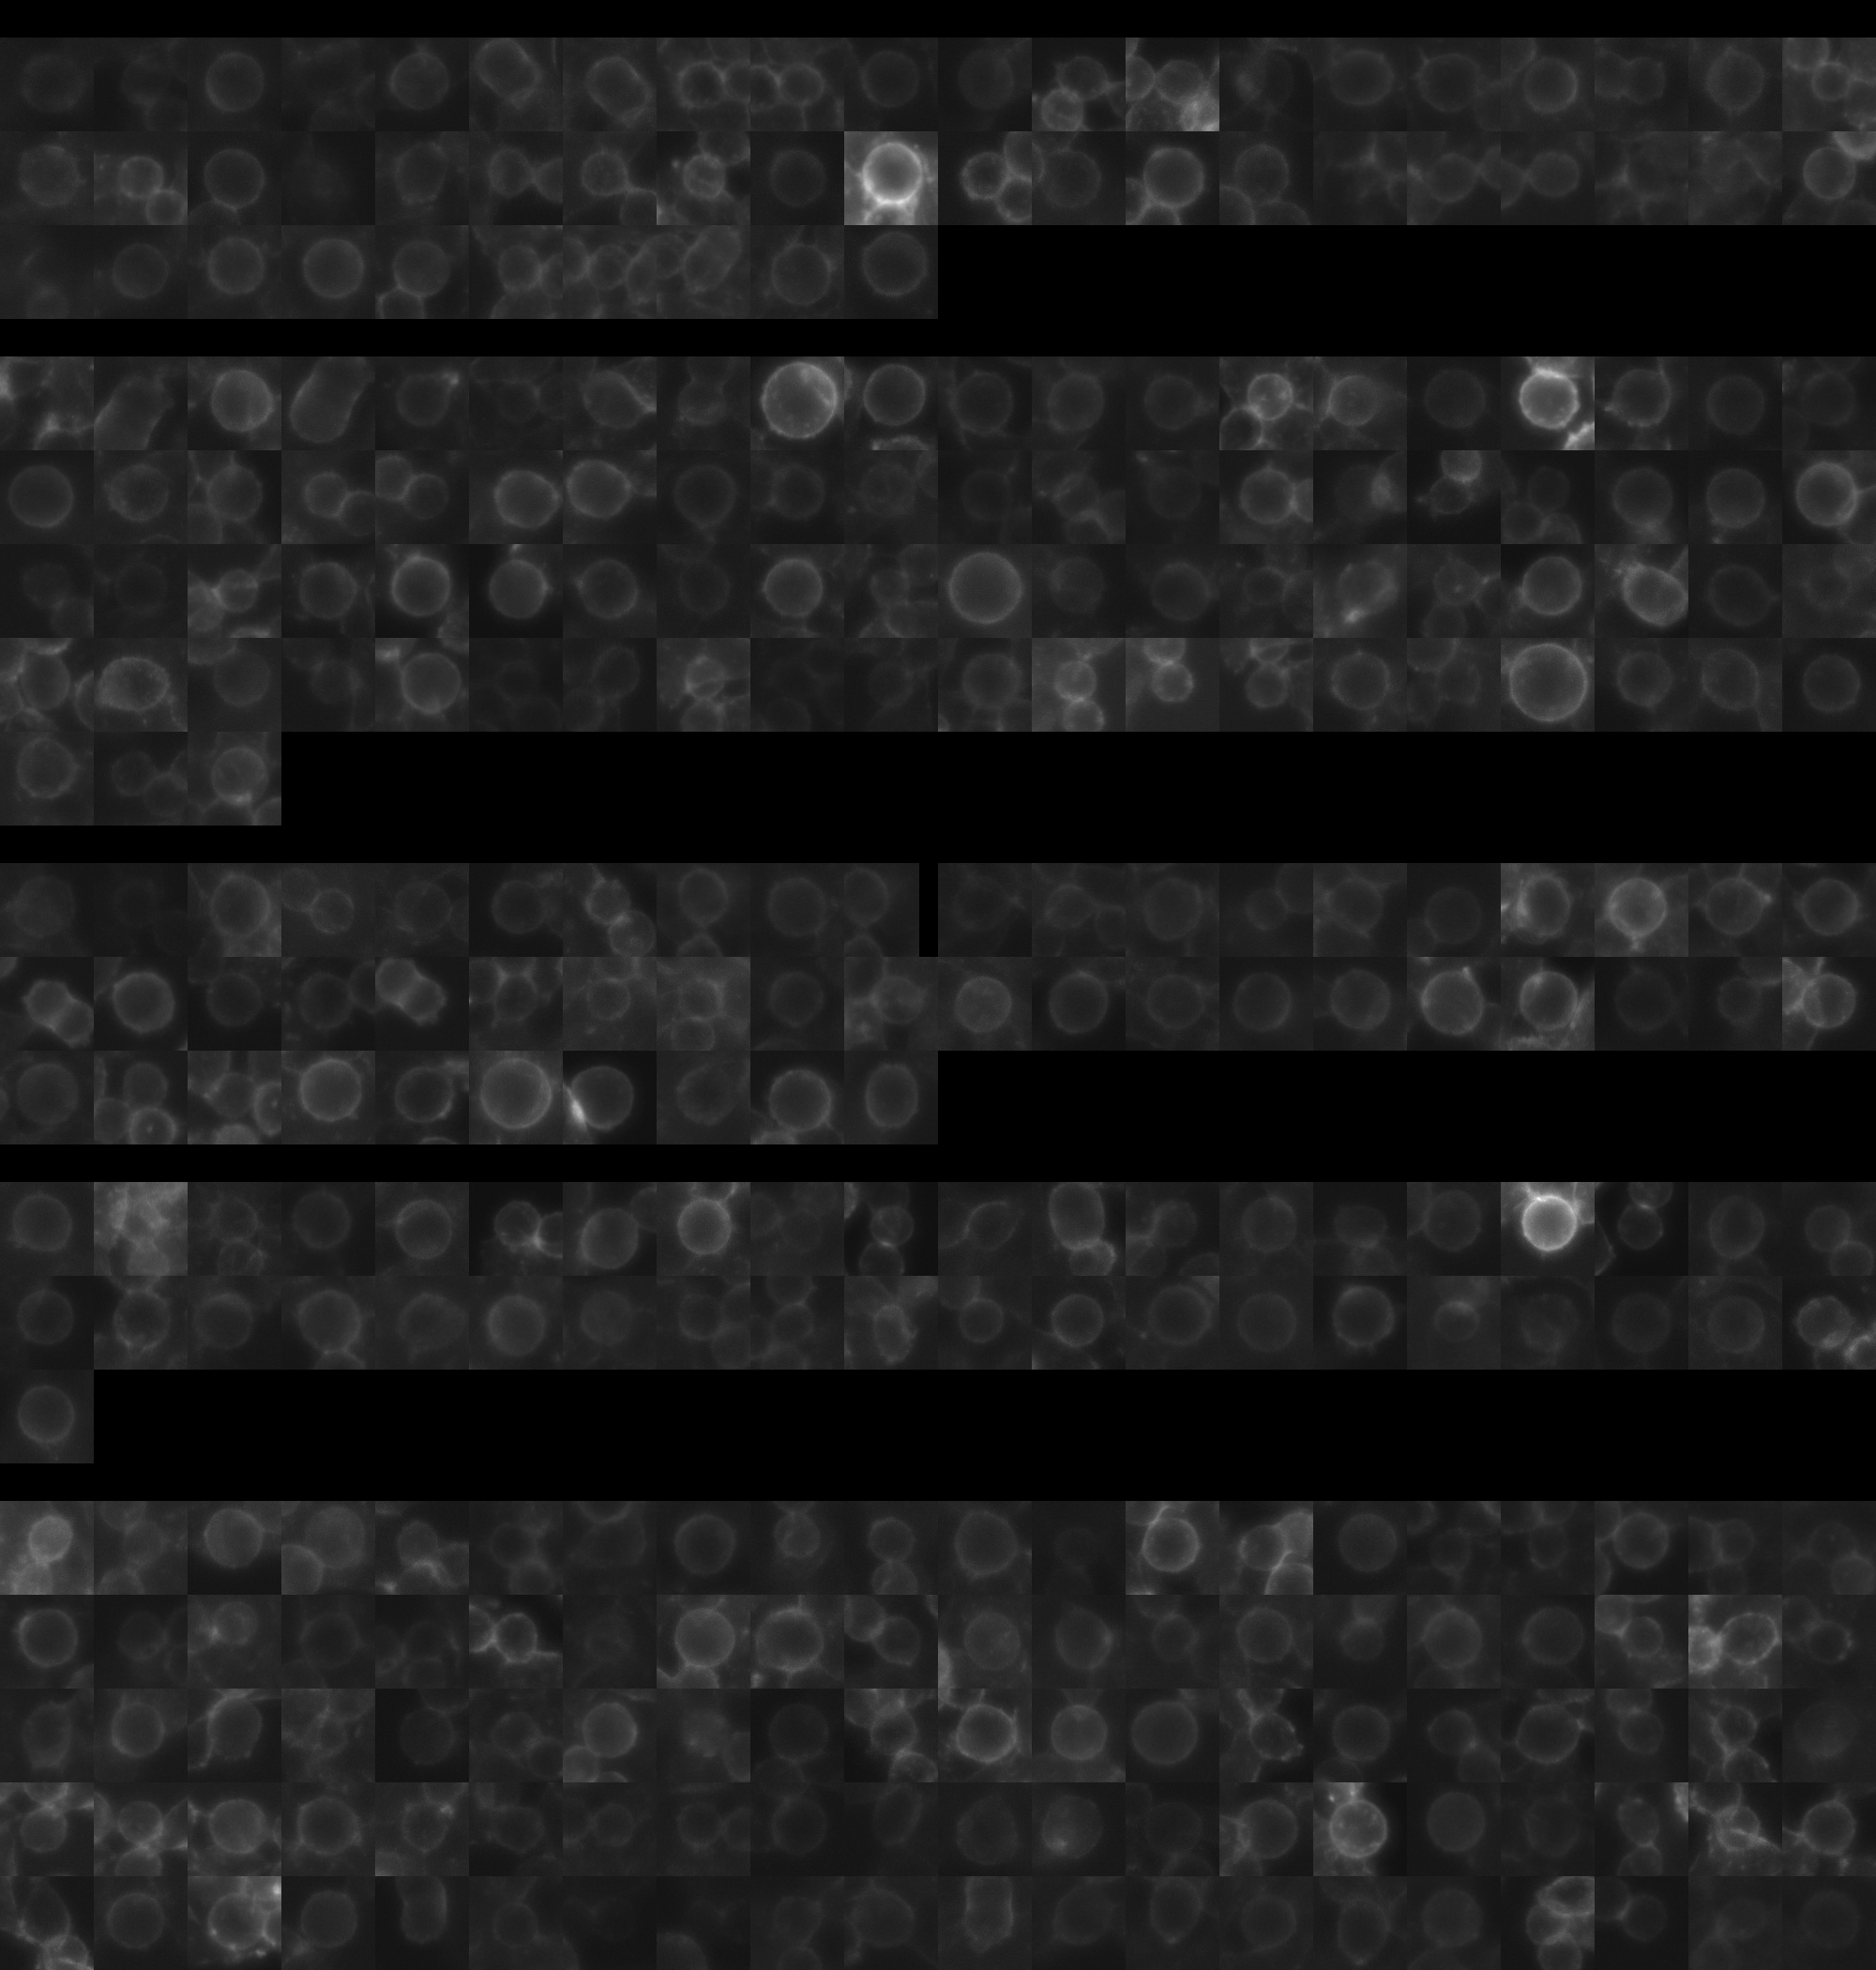
sgRNA 1: TCGATAATCTTGATAAAGCG (interphase cells: 1440, mitotic cells: 50)
sgRNA 2: TCTGGGCAAACGTCCCCGTG (interphase cells: 2591, mitotic cells: 83)
sgRNA 3: TGGCTCACGTCCATCCCTTG (interphase cells: 1987, mitotic cells: 50)
sgRNA 4: TGGGAAGCGAGCAGCCGCGG (interphase cells: 1726, mitotic cells: 41)

Interphase Cluster

Mitotic Cluster

Overview

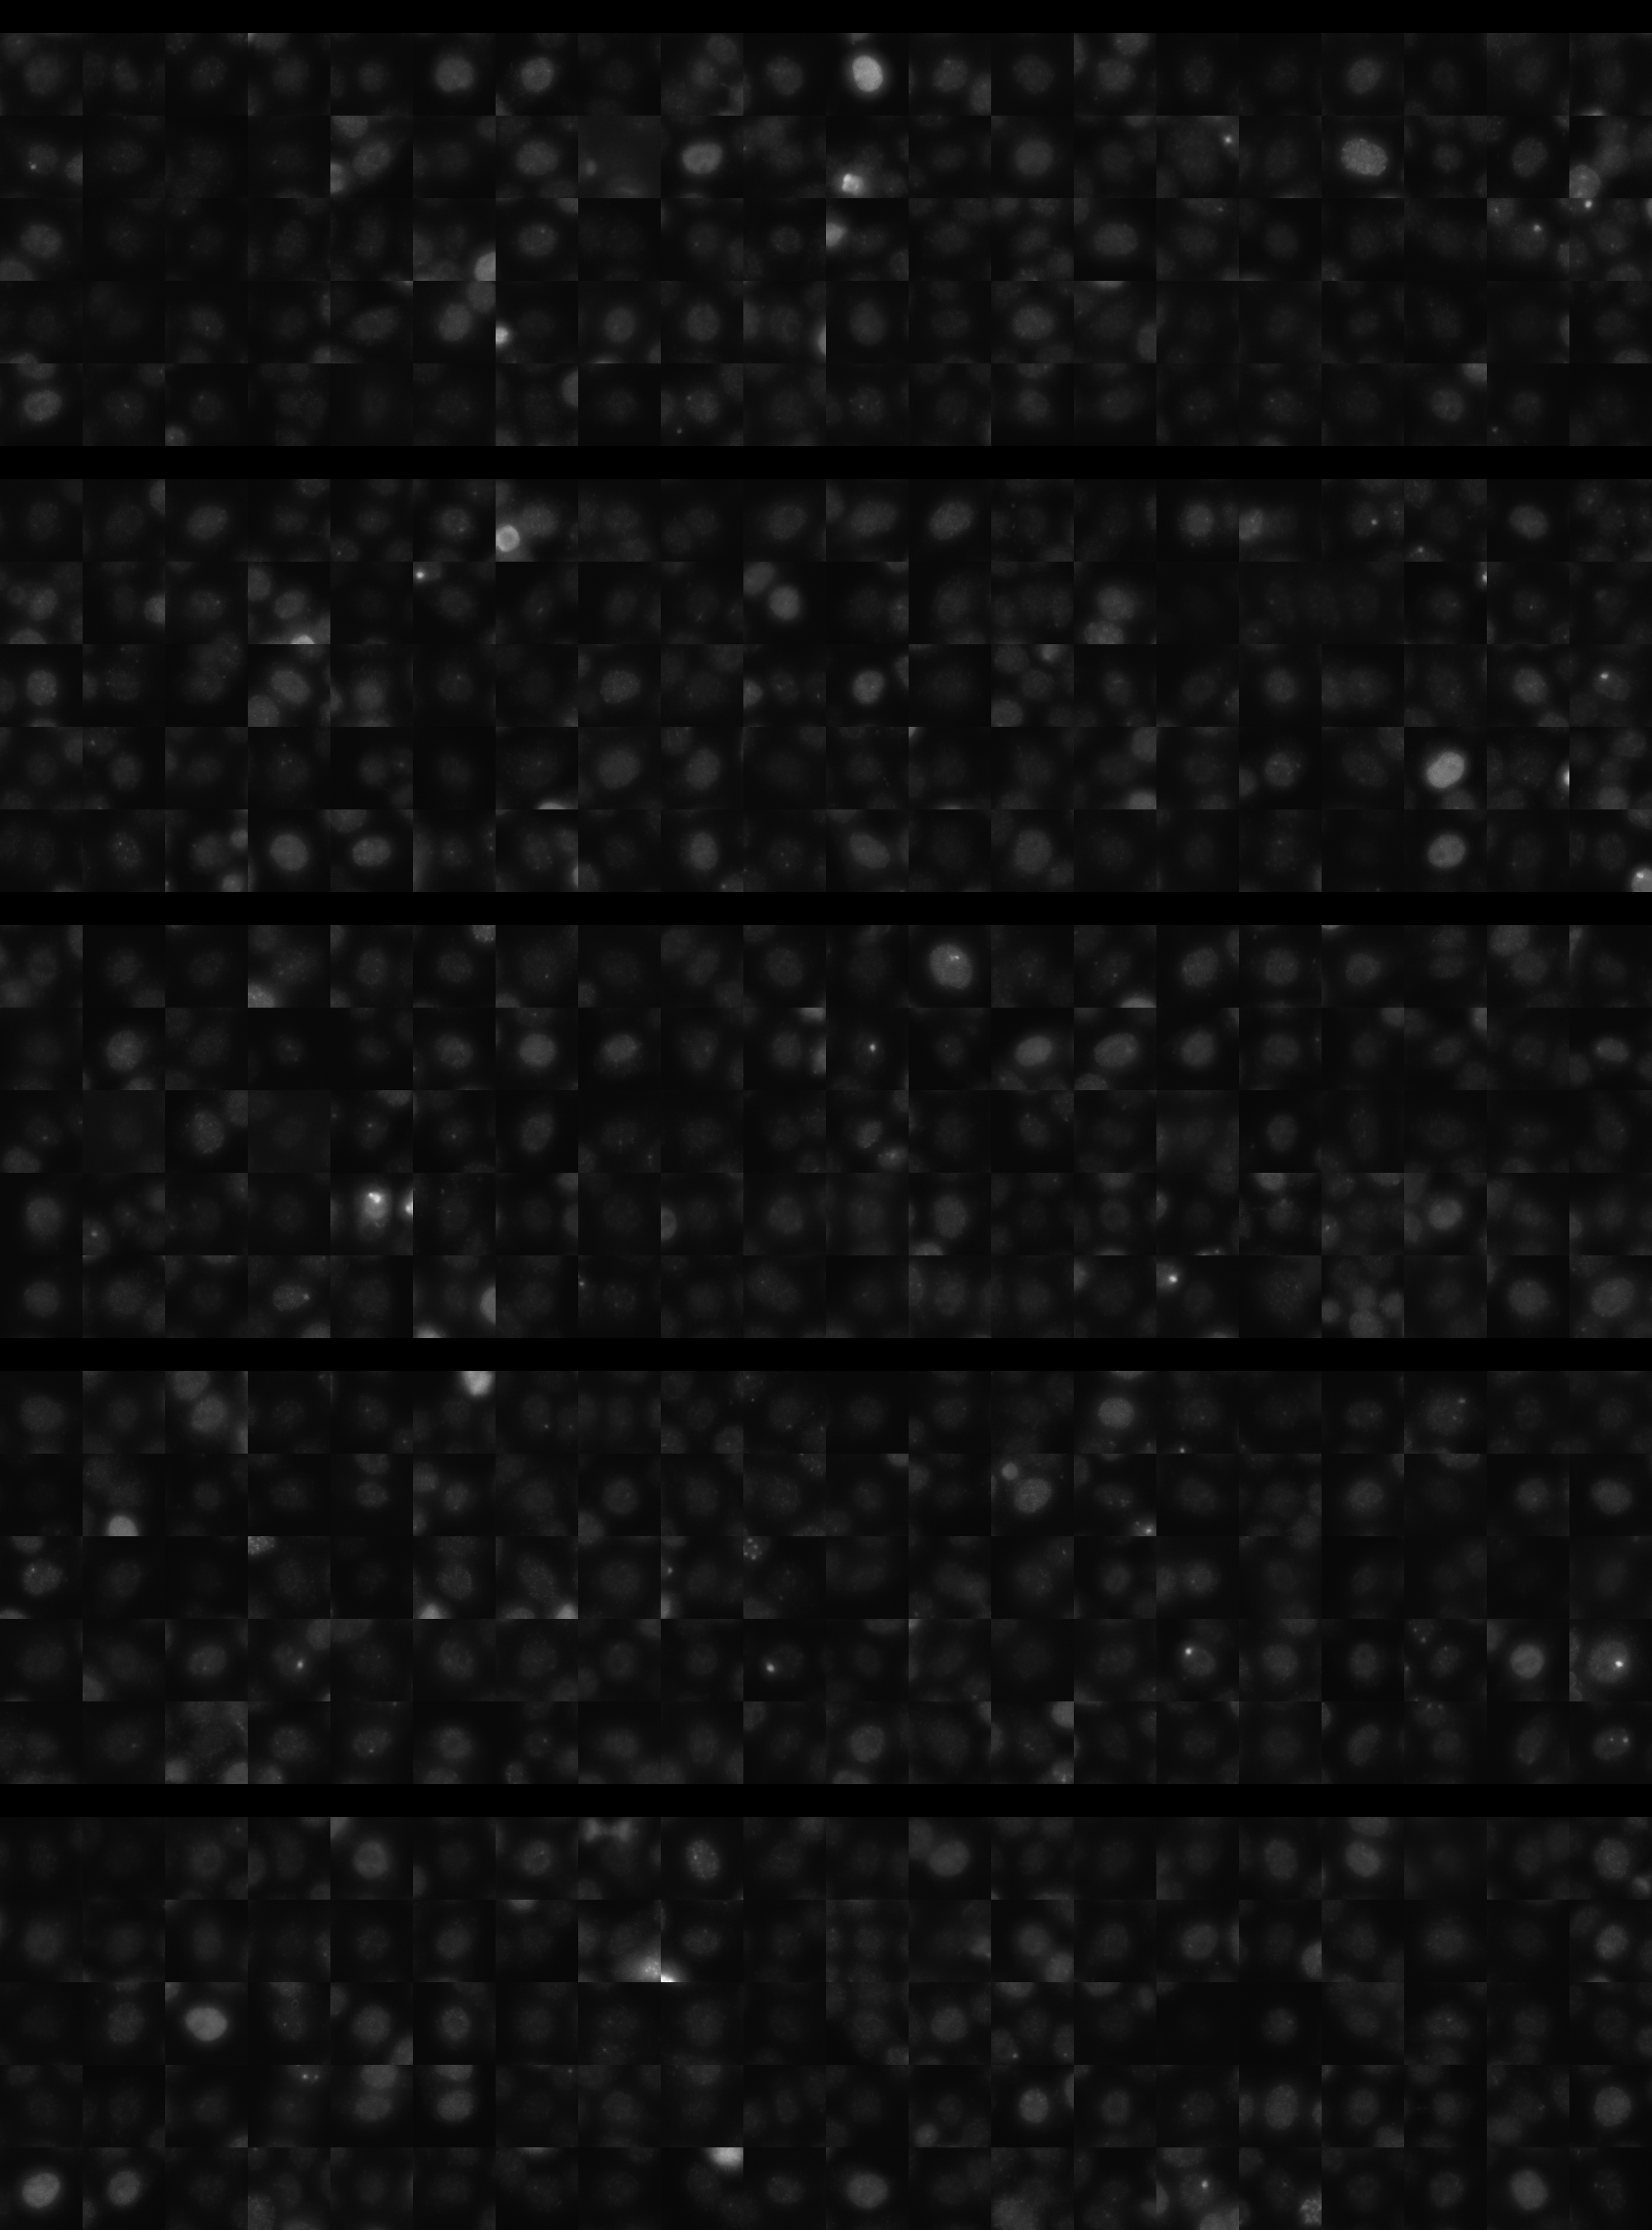
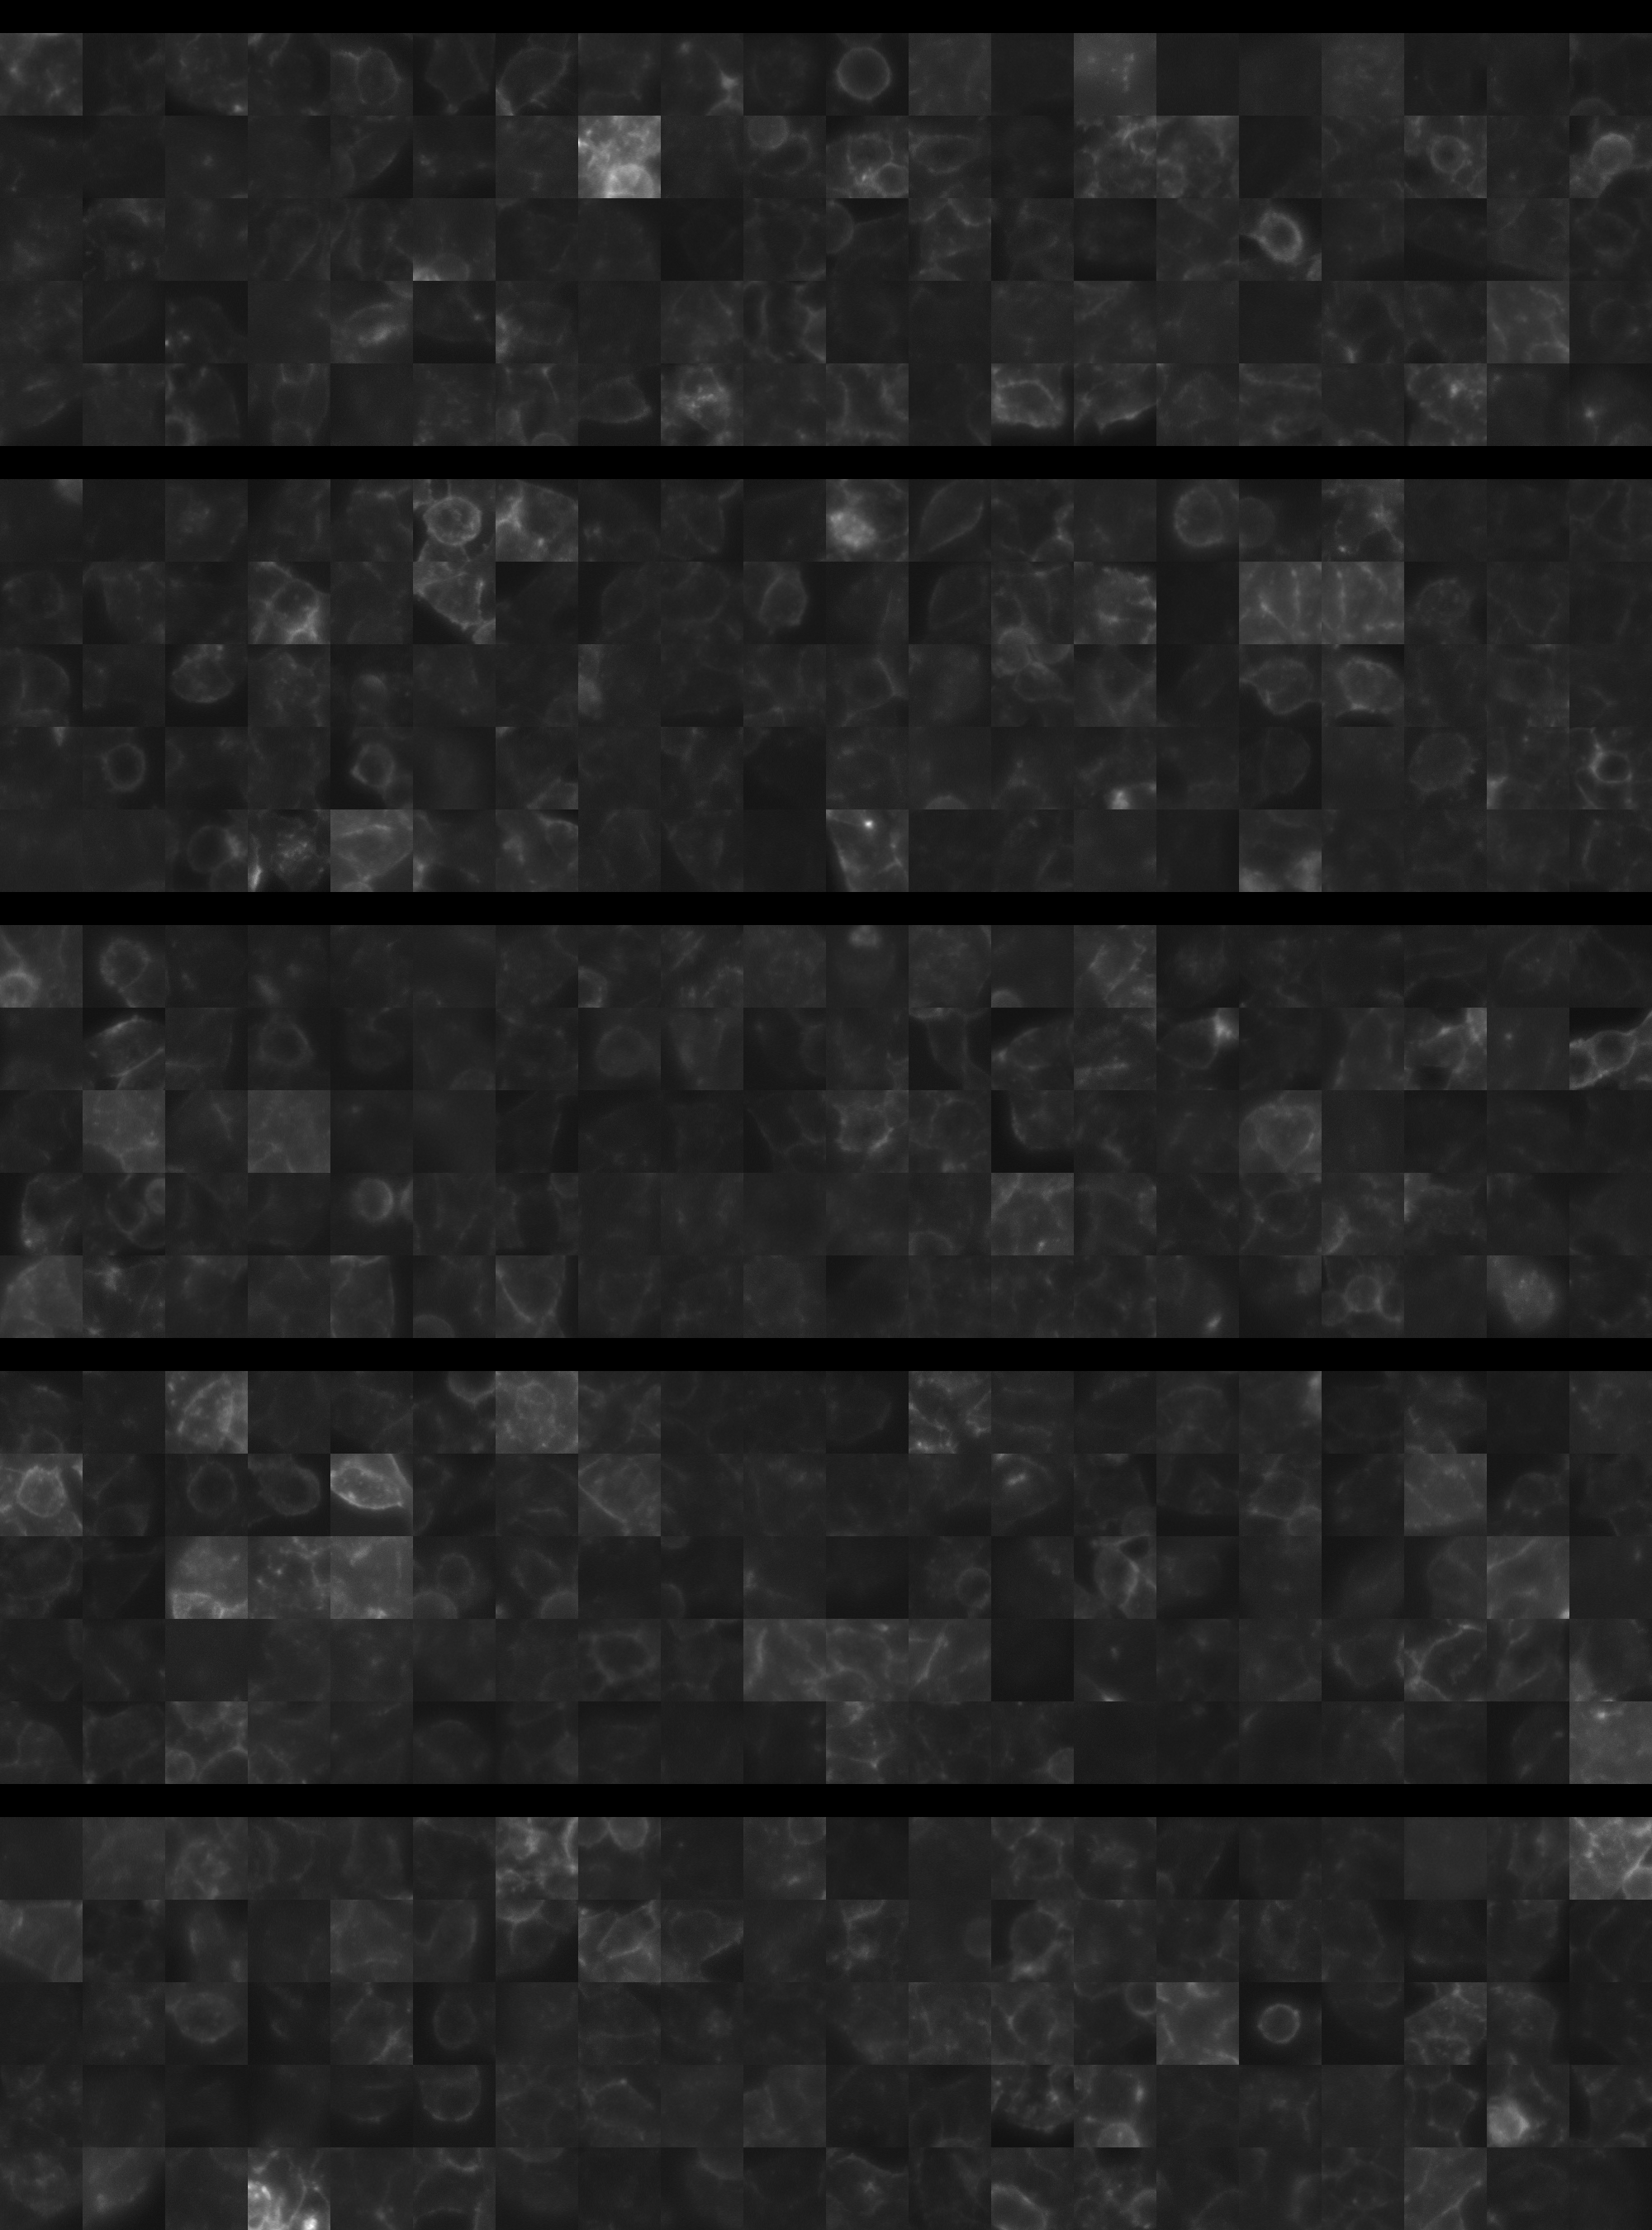
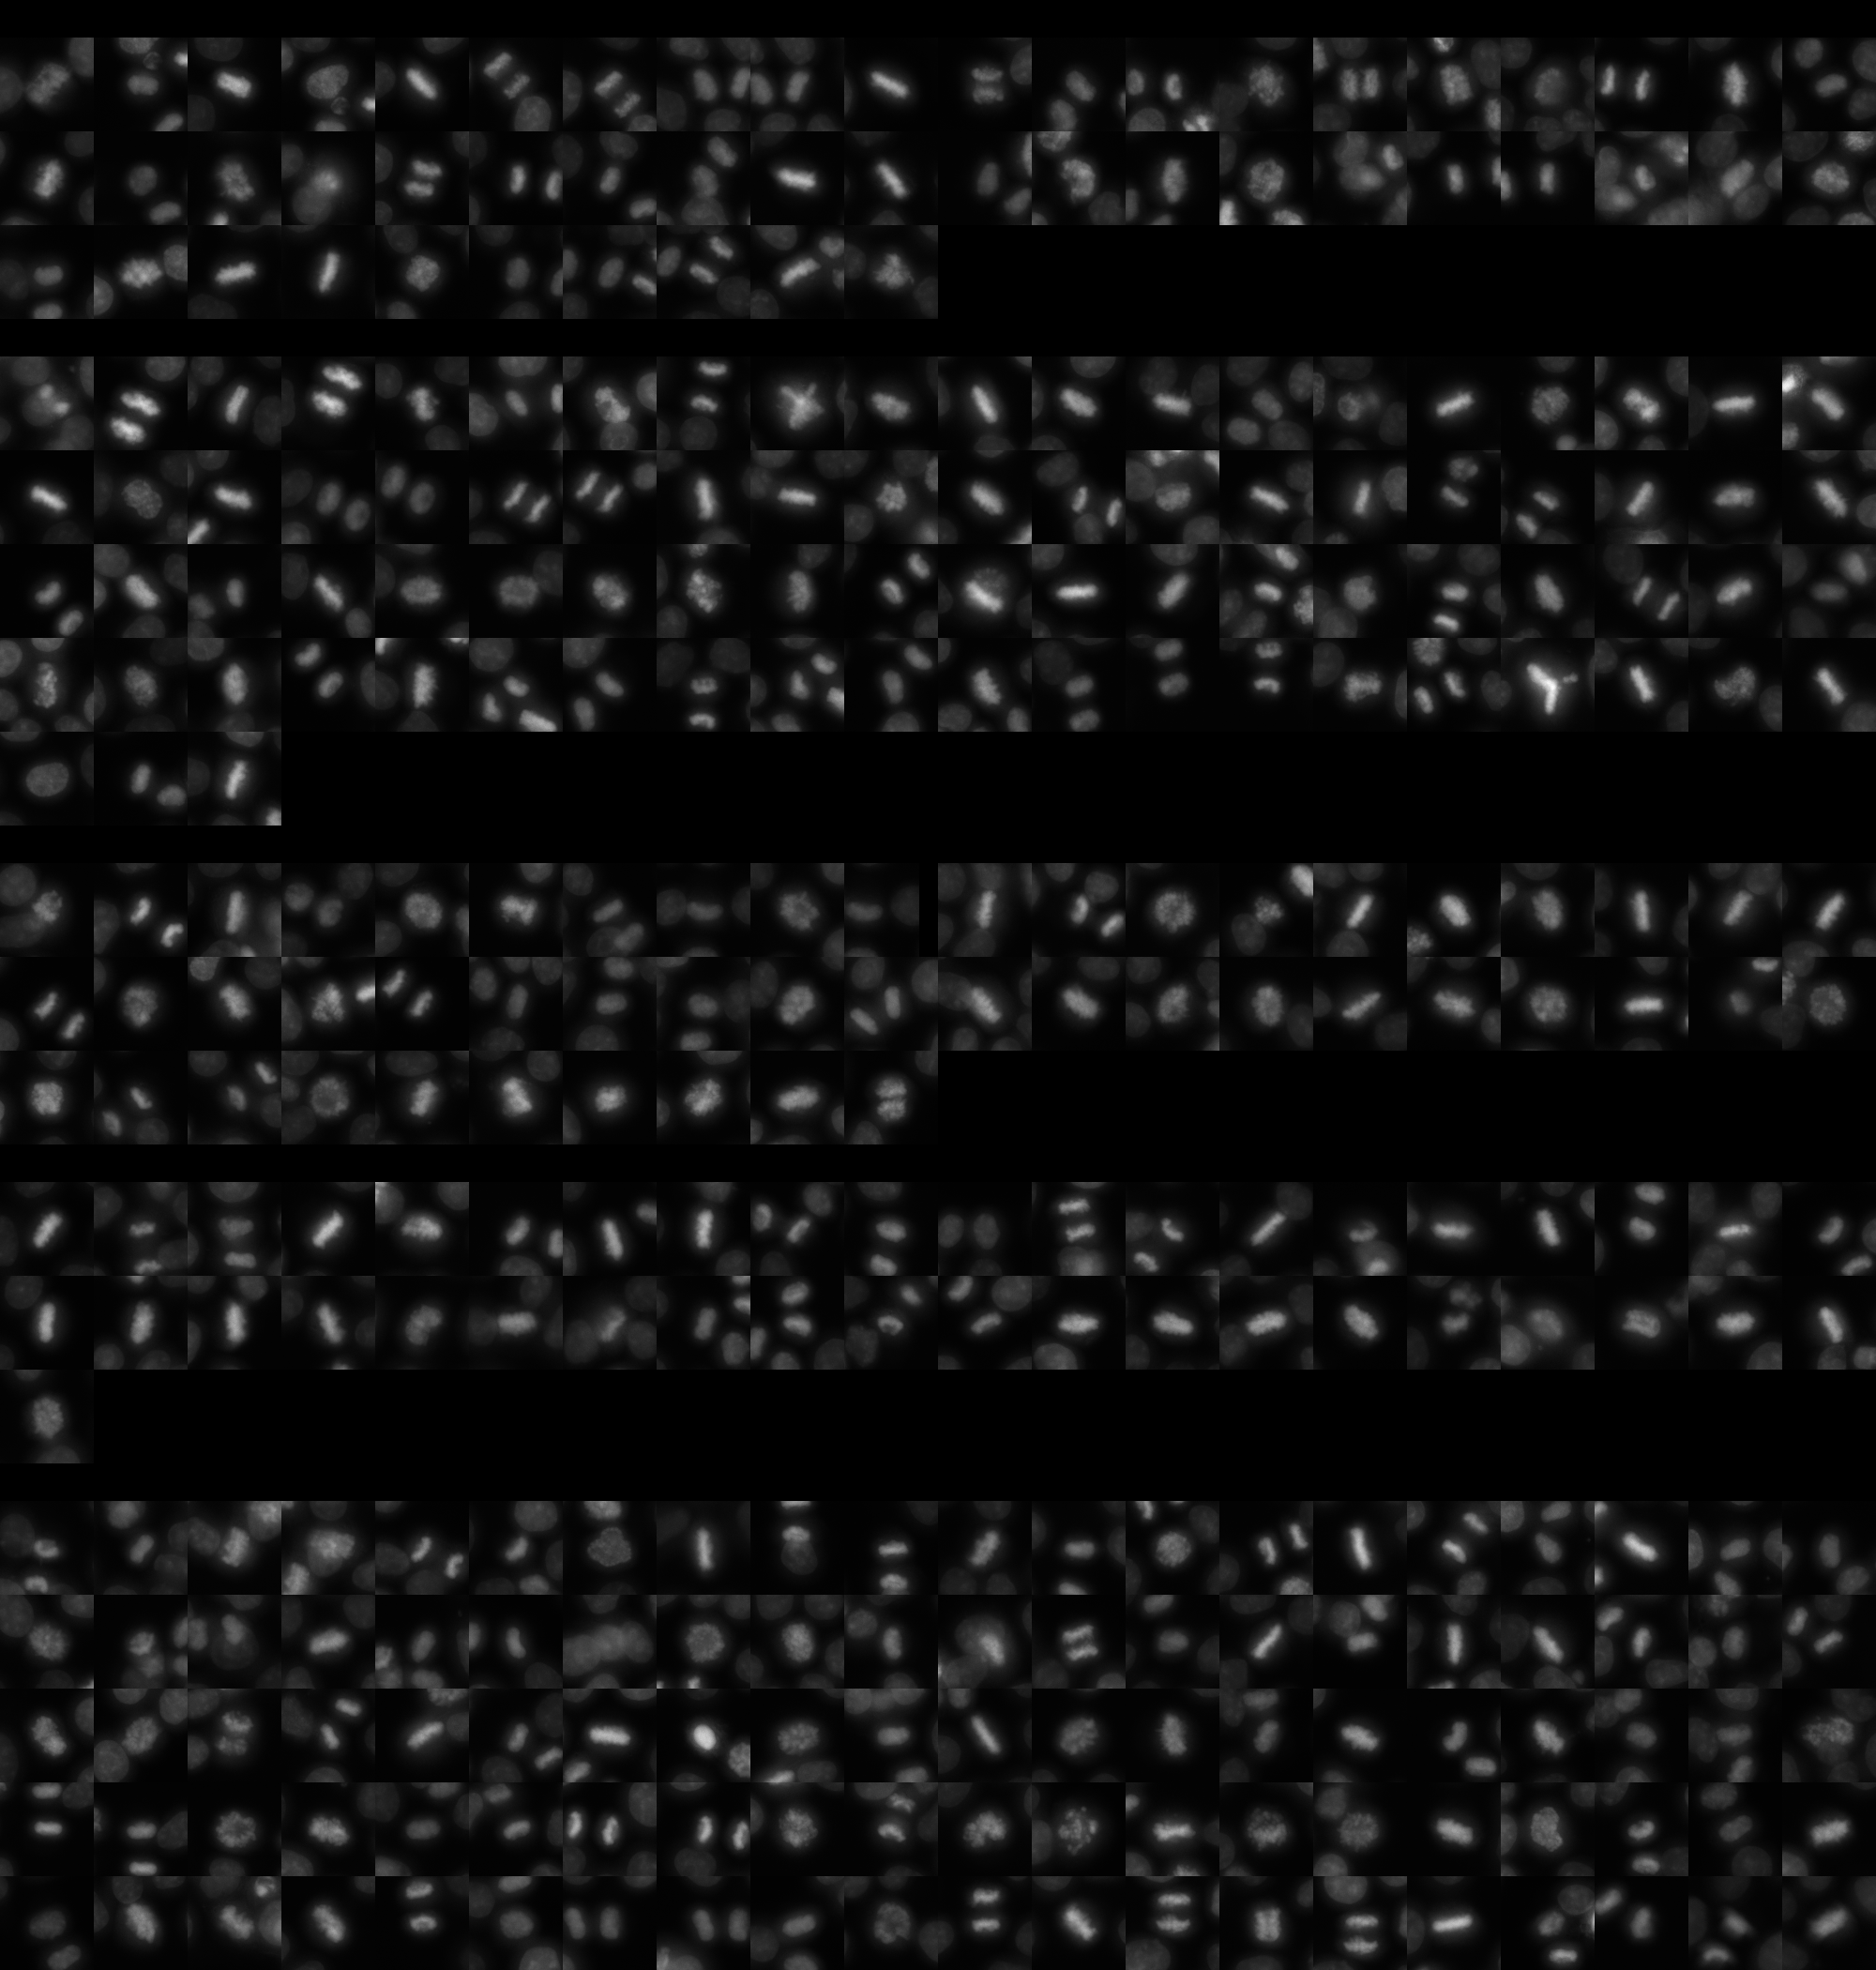
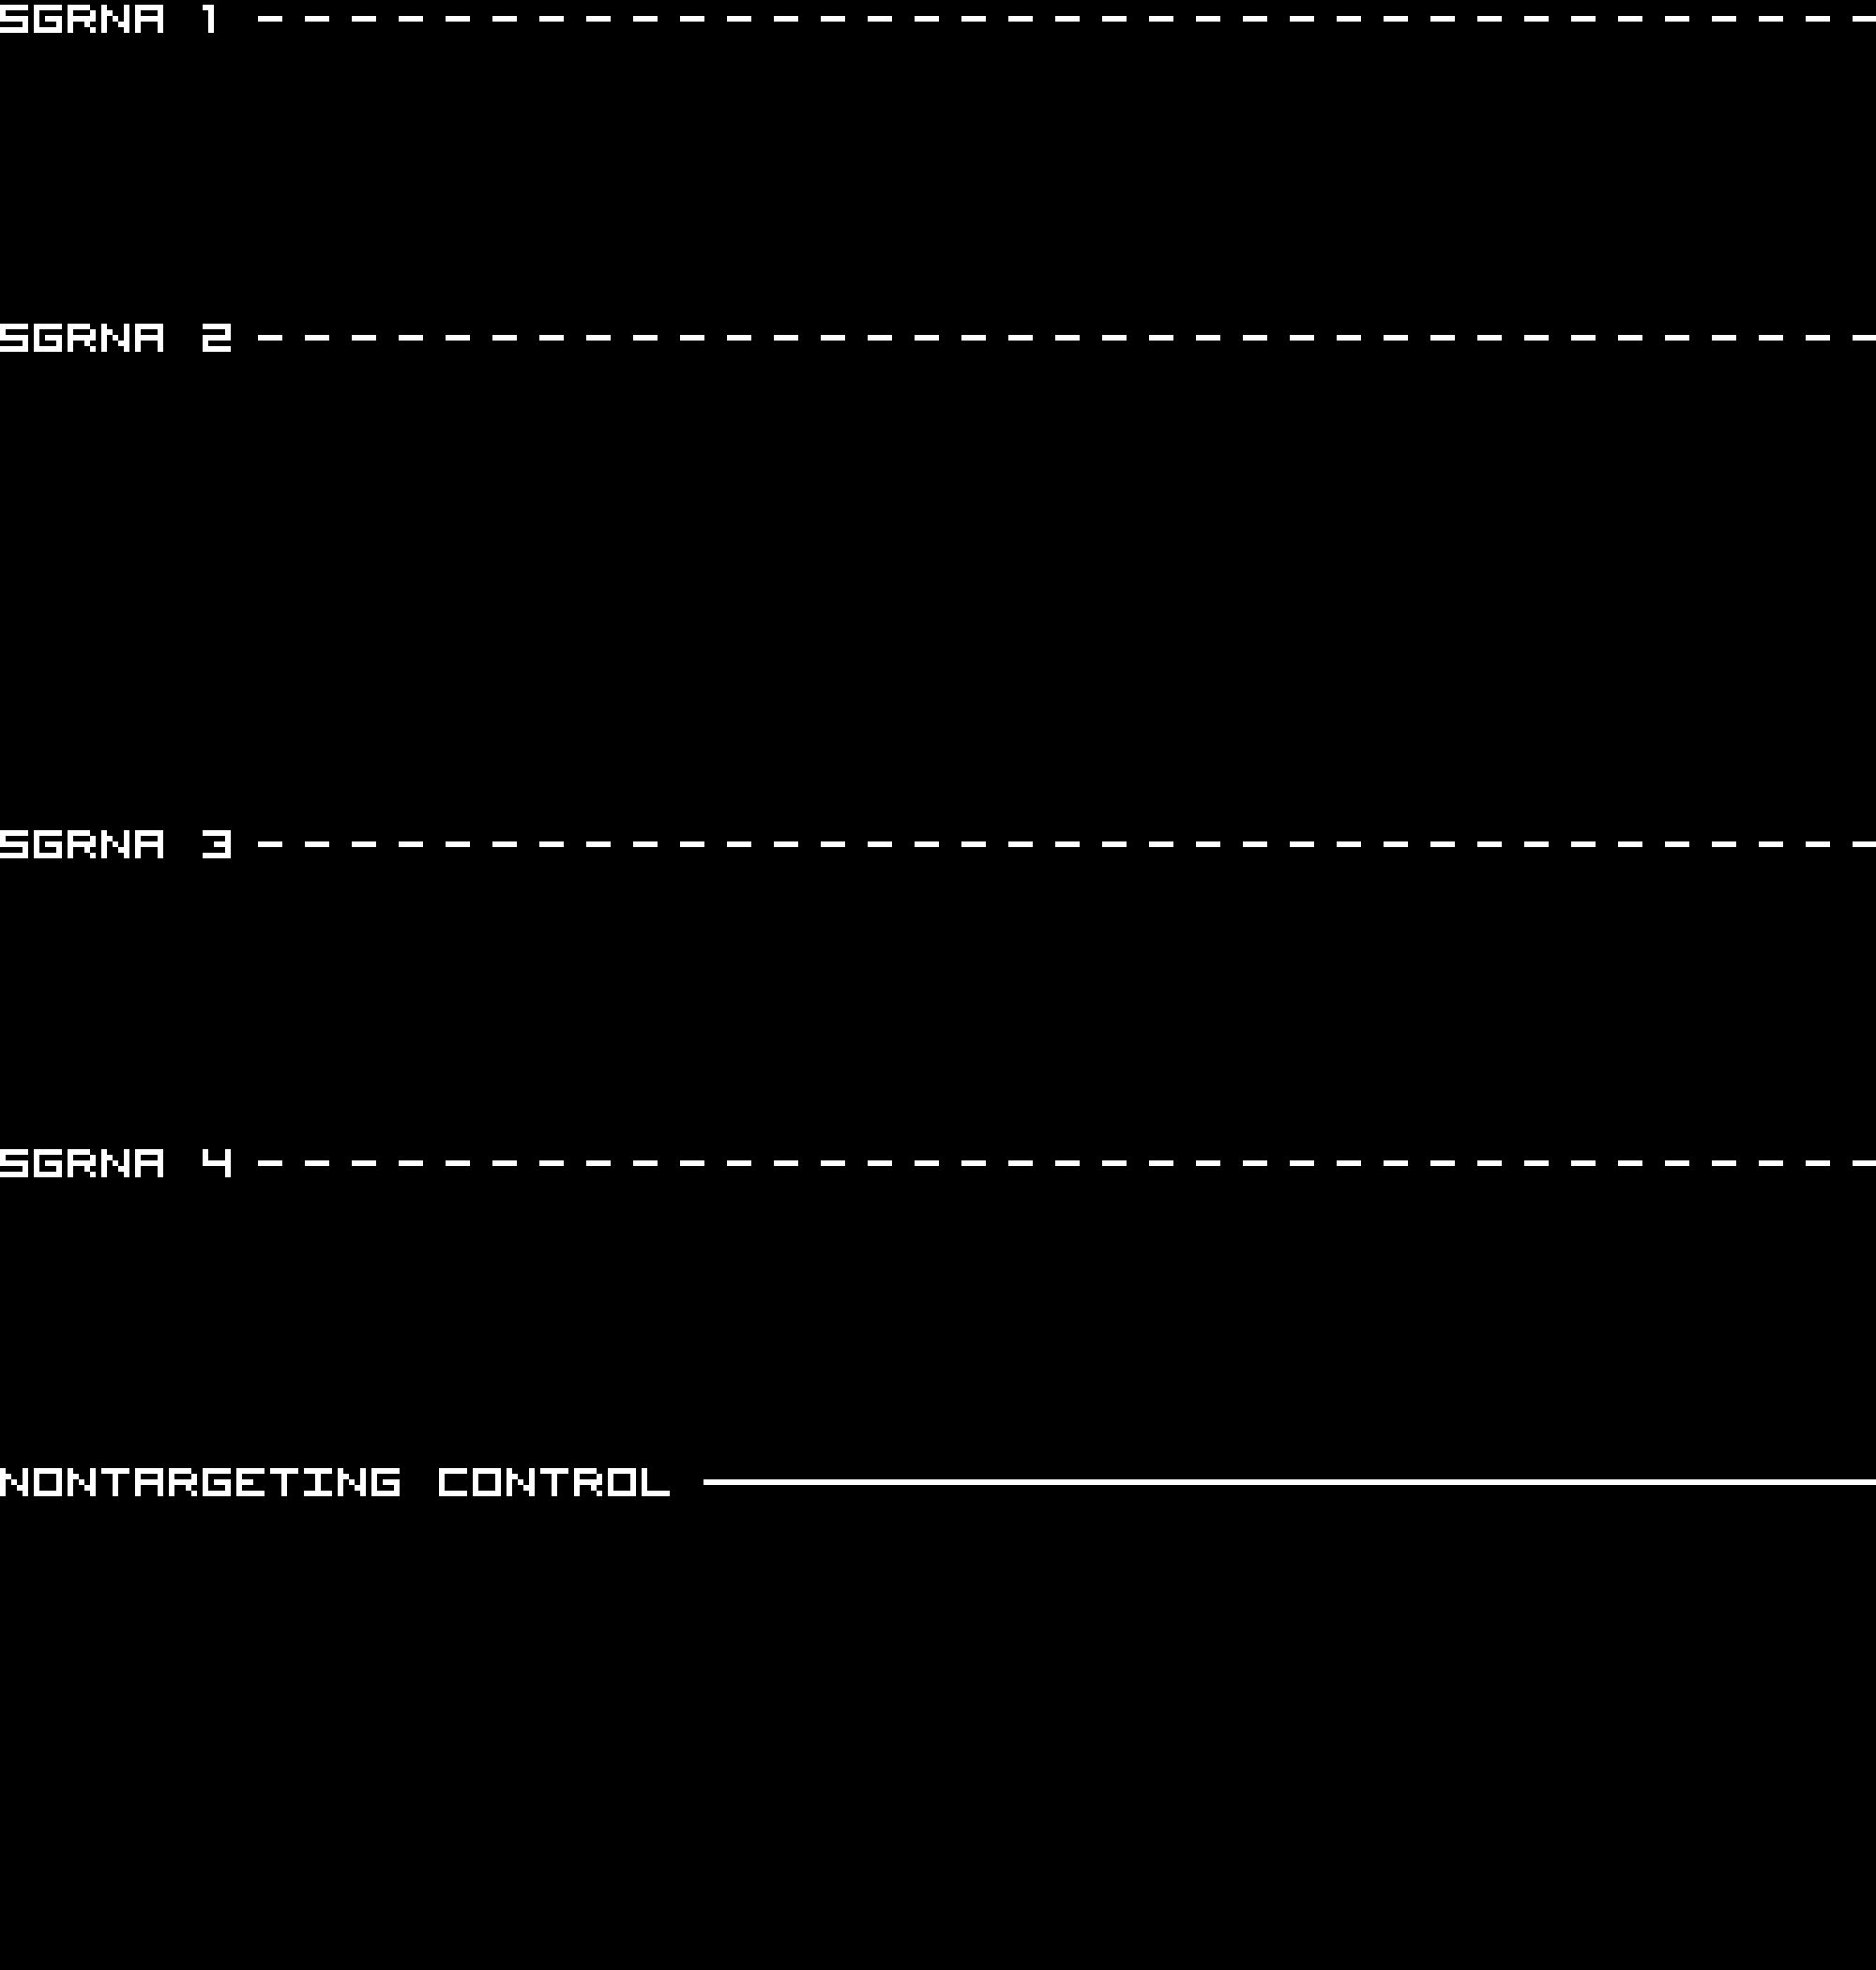
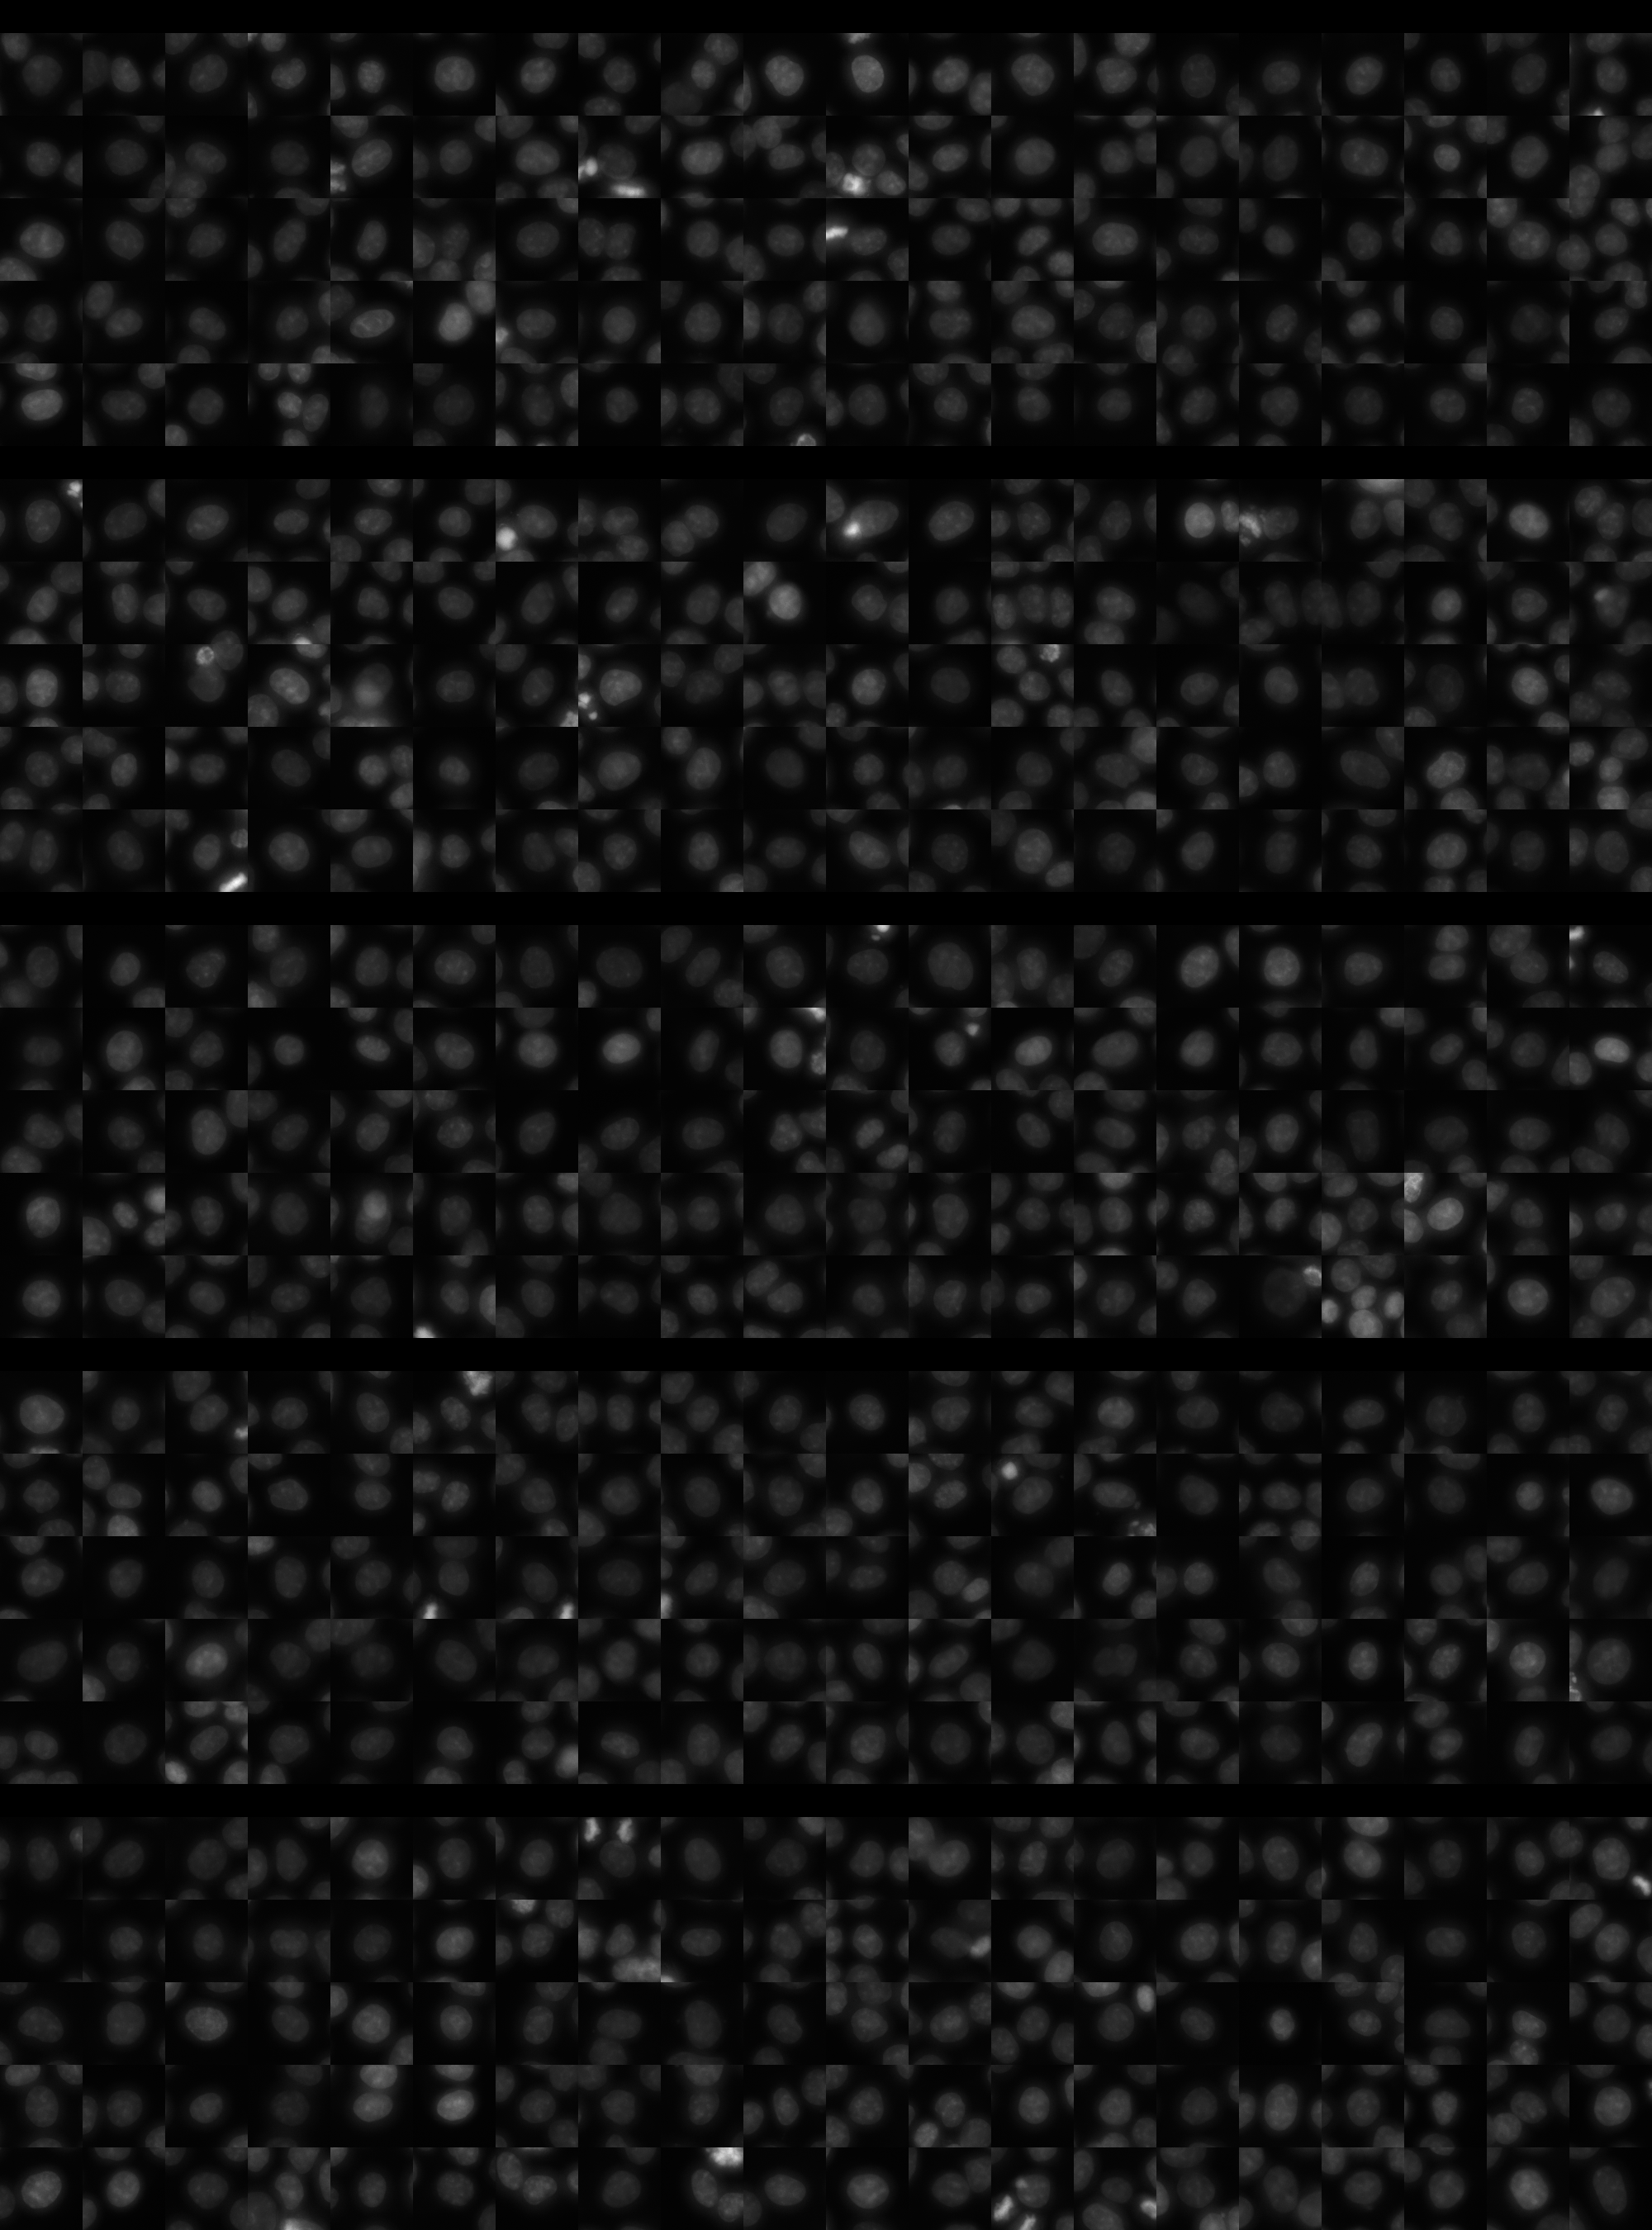
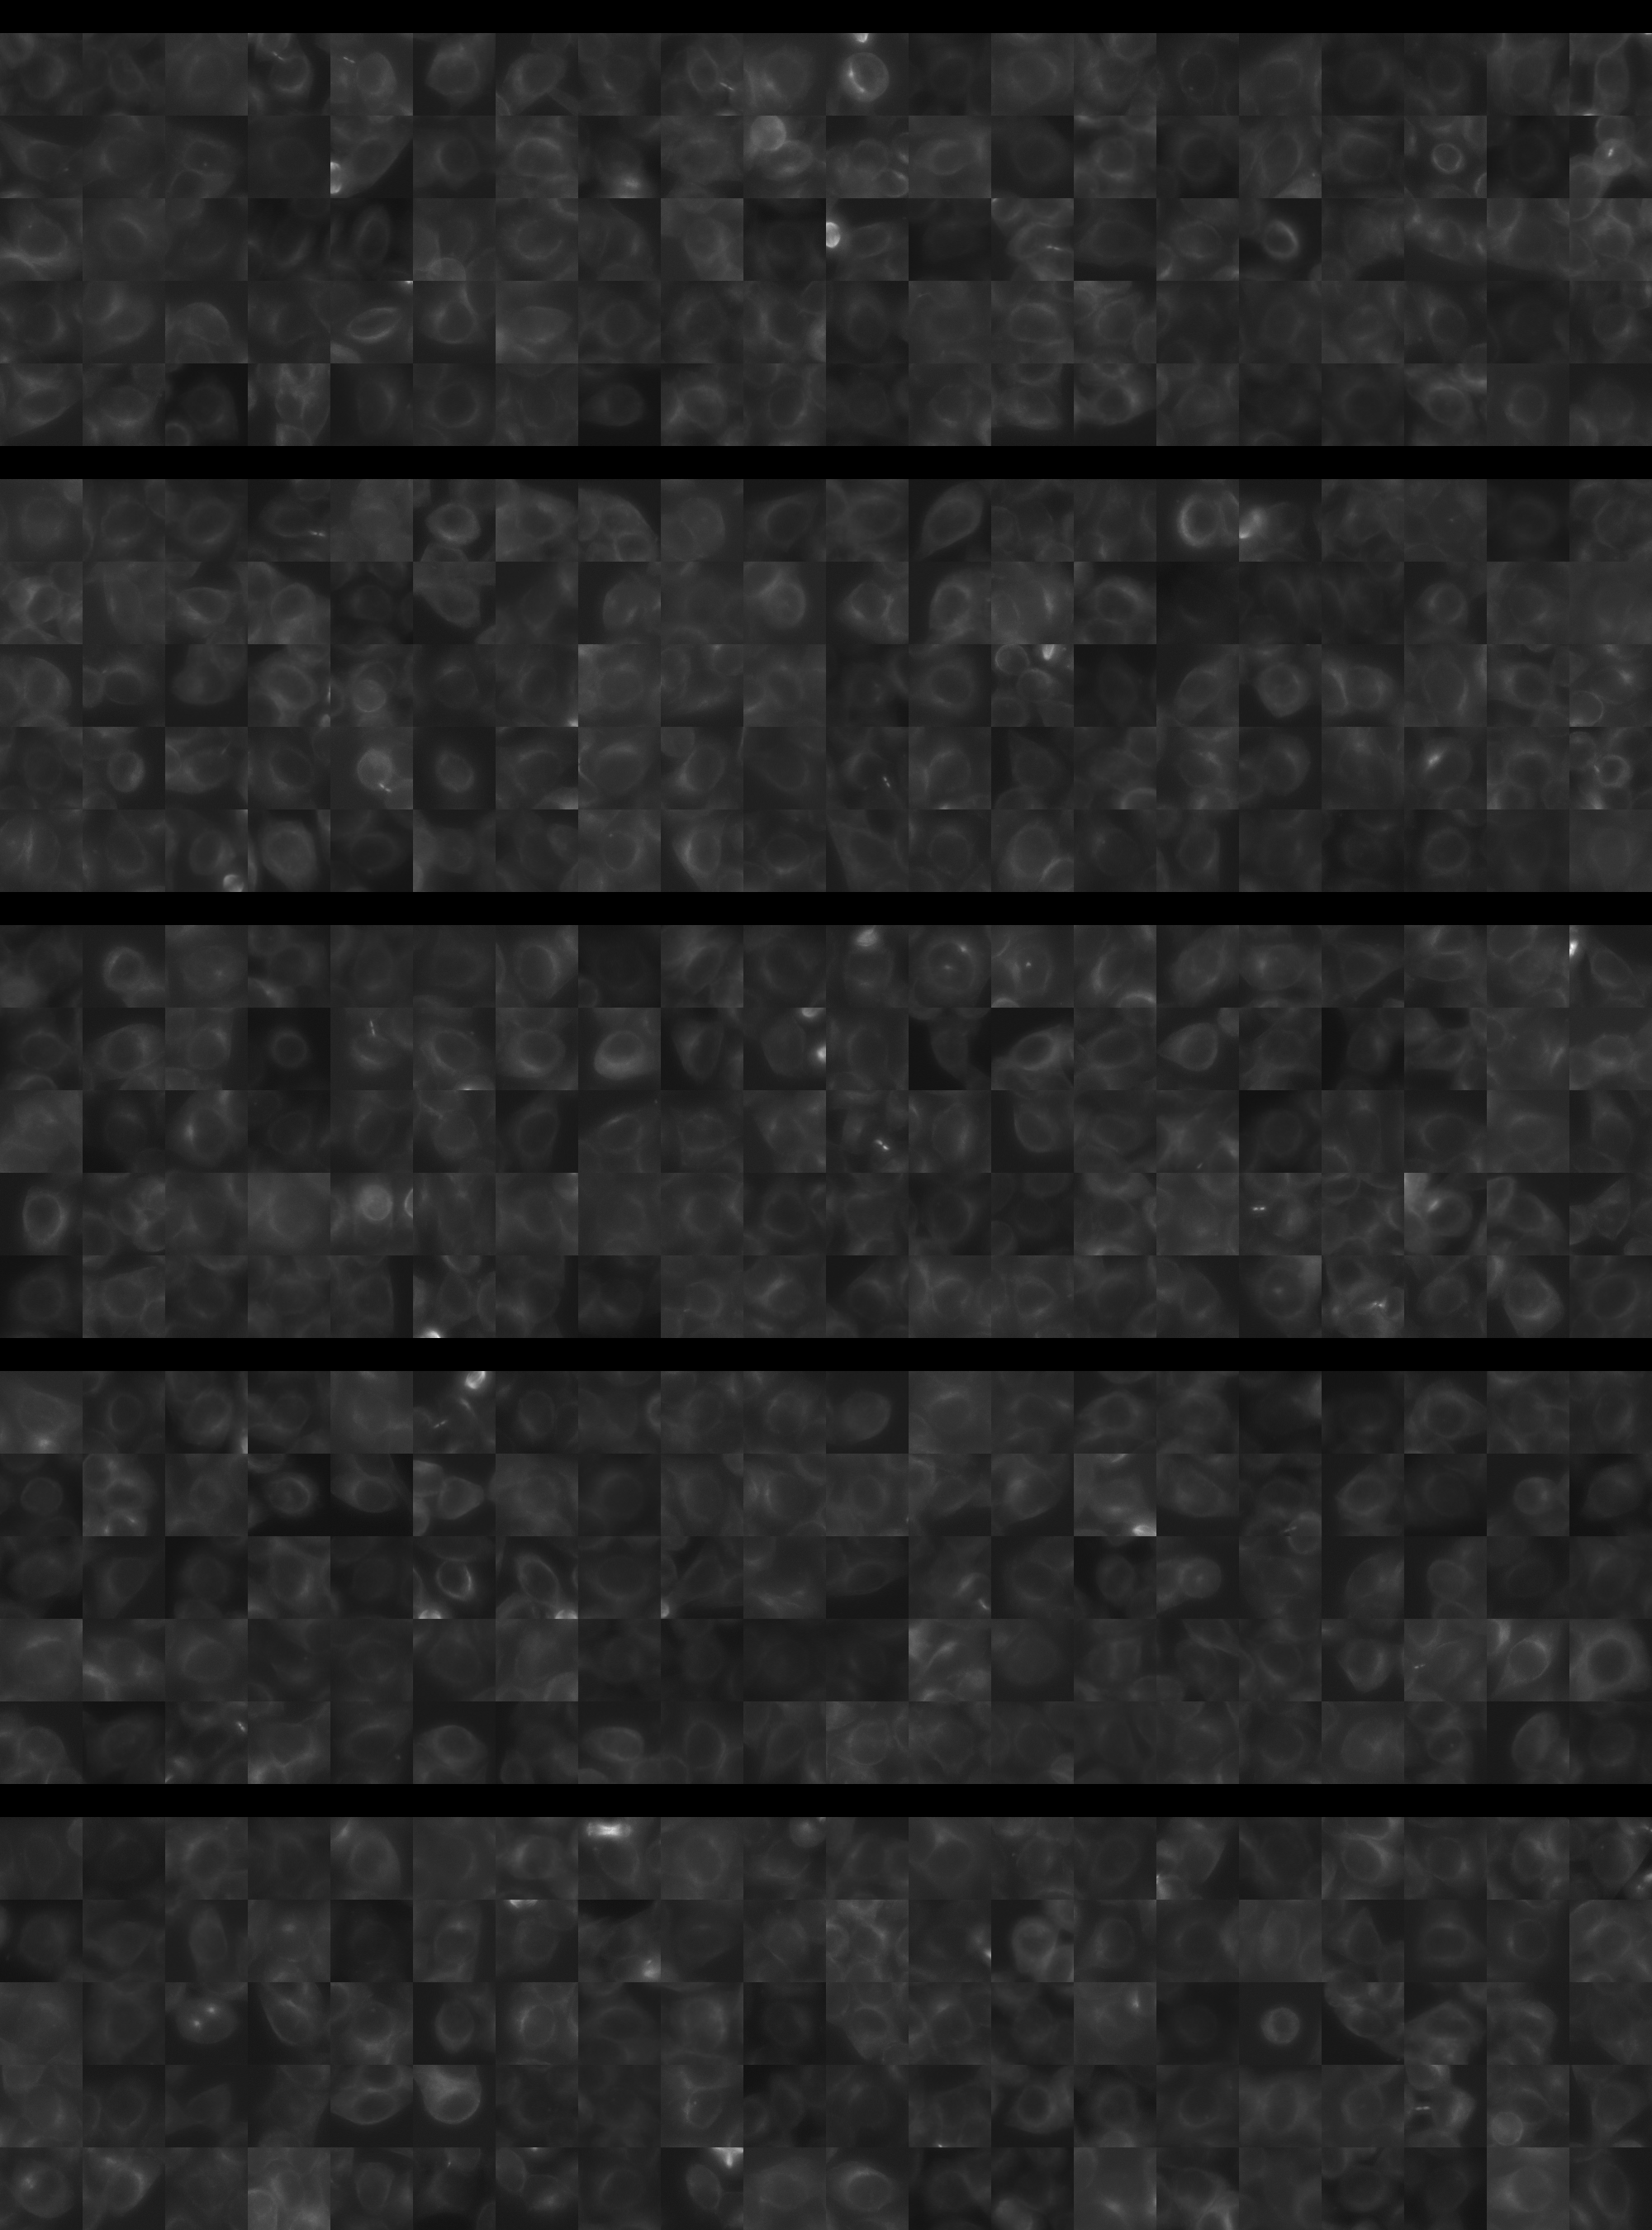
Each montage below shows randomly selected individual cell images for the same target gene separated by sgRNA, along with an example montage of cells expressing a non-targeting negative control sgRNA at the bottom. sgRNA labels in the montages correspond to the numbered sgRNA sequences in the gene info table above. The DNA (blue) and tubulin (green) channels are displayed by default, with gH2AX (grayscale) and actin (yellow) available using the check boxes. Channel brightness, contrast, and opacity are adjustable by clicking the arrow next to the channel name. When only one channel is selected, the display defaults to grayscale. Click the “Zoom” checkbox above the channel controls to enable image zooming (via scrolling) and panning (via click-and-drag).

The cell boxes displayed for this gene are square, 30.36 μm per side for the interphase montage and 30.36 μm per side for the mitotic montage.
Features

Interphase Score Rank FDR q-value
Nucleus DNA Integrated -9.176e-04 3164 of 5322 0.969
Nucleus DNA Mean 0.018 1437 of 5322 0.663
Nucleus gH2AX Mean 0.046 3633 of 5322 0.201
Nucleus DNA - gH2AX Correlation -7.526e-02 3277 of 5322 0.004
Nucleus Shape Area -5.798e-02 4556 of 5322 0.133
Nucleus Shape Eccentricity 0.075 415 of 5322 0.024
Nucleus Shape Form Factor -2.720e-02 1598 of 5322 0.512
Nucleus Shape Solidity -4.173e-02 2323 of 5322 0.195
Cell DNA Mass Displacement 0.017 3223 of 5322 0.812
Cell Tubulin Mean -3.741e-02 4032 of 5322 0.440
Cell Tubulin Mass Displacement 0.019 1860 of 5322 0.757
Cell Actin Mean -1.425e-02 3468 of 5322 0.840
Cell Tubulin - Actin Correlation 0.026 2381 of 5322 0.547
Cell DNA - Tubulin Correlation 0.021 2998 of 5322 0.627
Cell Shape Area -4.720e-02 4335 of 5322 0.250
Cell Shape Eccentricity 0.050 565 of 5322 0.298
Mitotic Score Rank FDR q-value
Nucleus DNA Integrated 0.016 3719 of 5322 0.996
Nucleus DNA Mean -4.131e-02 3597 of 5322 1.000
Nucleus DNA Mass Displacement 0.067 2428 of 5322 0.999
Nucleus DNA Mean Frac 3 -3.385e-02 3629 of 5322 1.000
Nucleus gH2AX Mean 0.093 1698 of 5322 1.000
Nucleus gH2AX Mean Frac 0 0.164 499 of 5322 1.000
Nucleus Tubulin Mean Frac 0 0.007 3385 of 5322 0.999
Nucleus Tubulin Mean Edge 0.106 1789 of 5322 0.999
Nucleus Tubulin Std Edge 0.127 979 of 5322 0.999
Nucleus Shape Area -6.028e-02 4534 of 5322 0.990
Nucleus Shape Eccentricity 0.100 858 of 5322 1.000
Nucleus Shape Form Factor 0.032 995 of 5322 0.998
Cell Tubulin Mean 0.012 3334 of 5322 1.000
Cell Tubulin Mean Frac 3 -9.811e-02 2921 of 5322 0.999
Cell Actin Mean 0.084 2092 of 5322 0.997
Cell Shape Area -2.947e-02 4247 of 5322 0.998
( Reset Zoom )
Brightness
Contrast
Opacity
Brightness
Contrast
Opacity
Brightness
Contrast
Opacity
Brightness
Contrast
Opacity
Brightness
Contrast
Opacity

( Reset Zoom )
Brightness
Contrast
Opacity
Brightness
Contrast
Opacity
Brightness
Contrast
Opacity
Brightness
Contrast
Opacity
Brightness
Contrast
Opacity

MIT Central Accessability