LMNB1

Gene symbol: LMNB1
Gene: 4001
Uniprot Function: Lamins are components of the nuclear lamina, a fibrous layer on the nucleoplasmic side of the inner nuclear membrane, which is thought to provide a framework for the nuclear envelope and may also interact with chromatin.
Mitotic Index 0.0248
Interphase Cluster: #104 (23 genes)
Mitotic Cluster: #1 (61 genes)
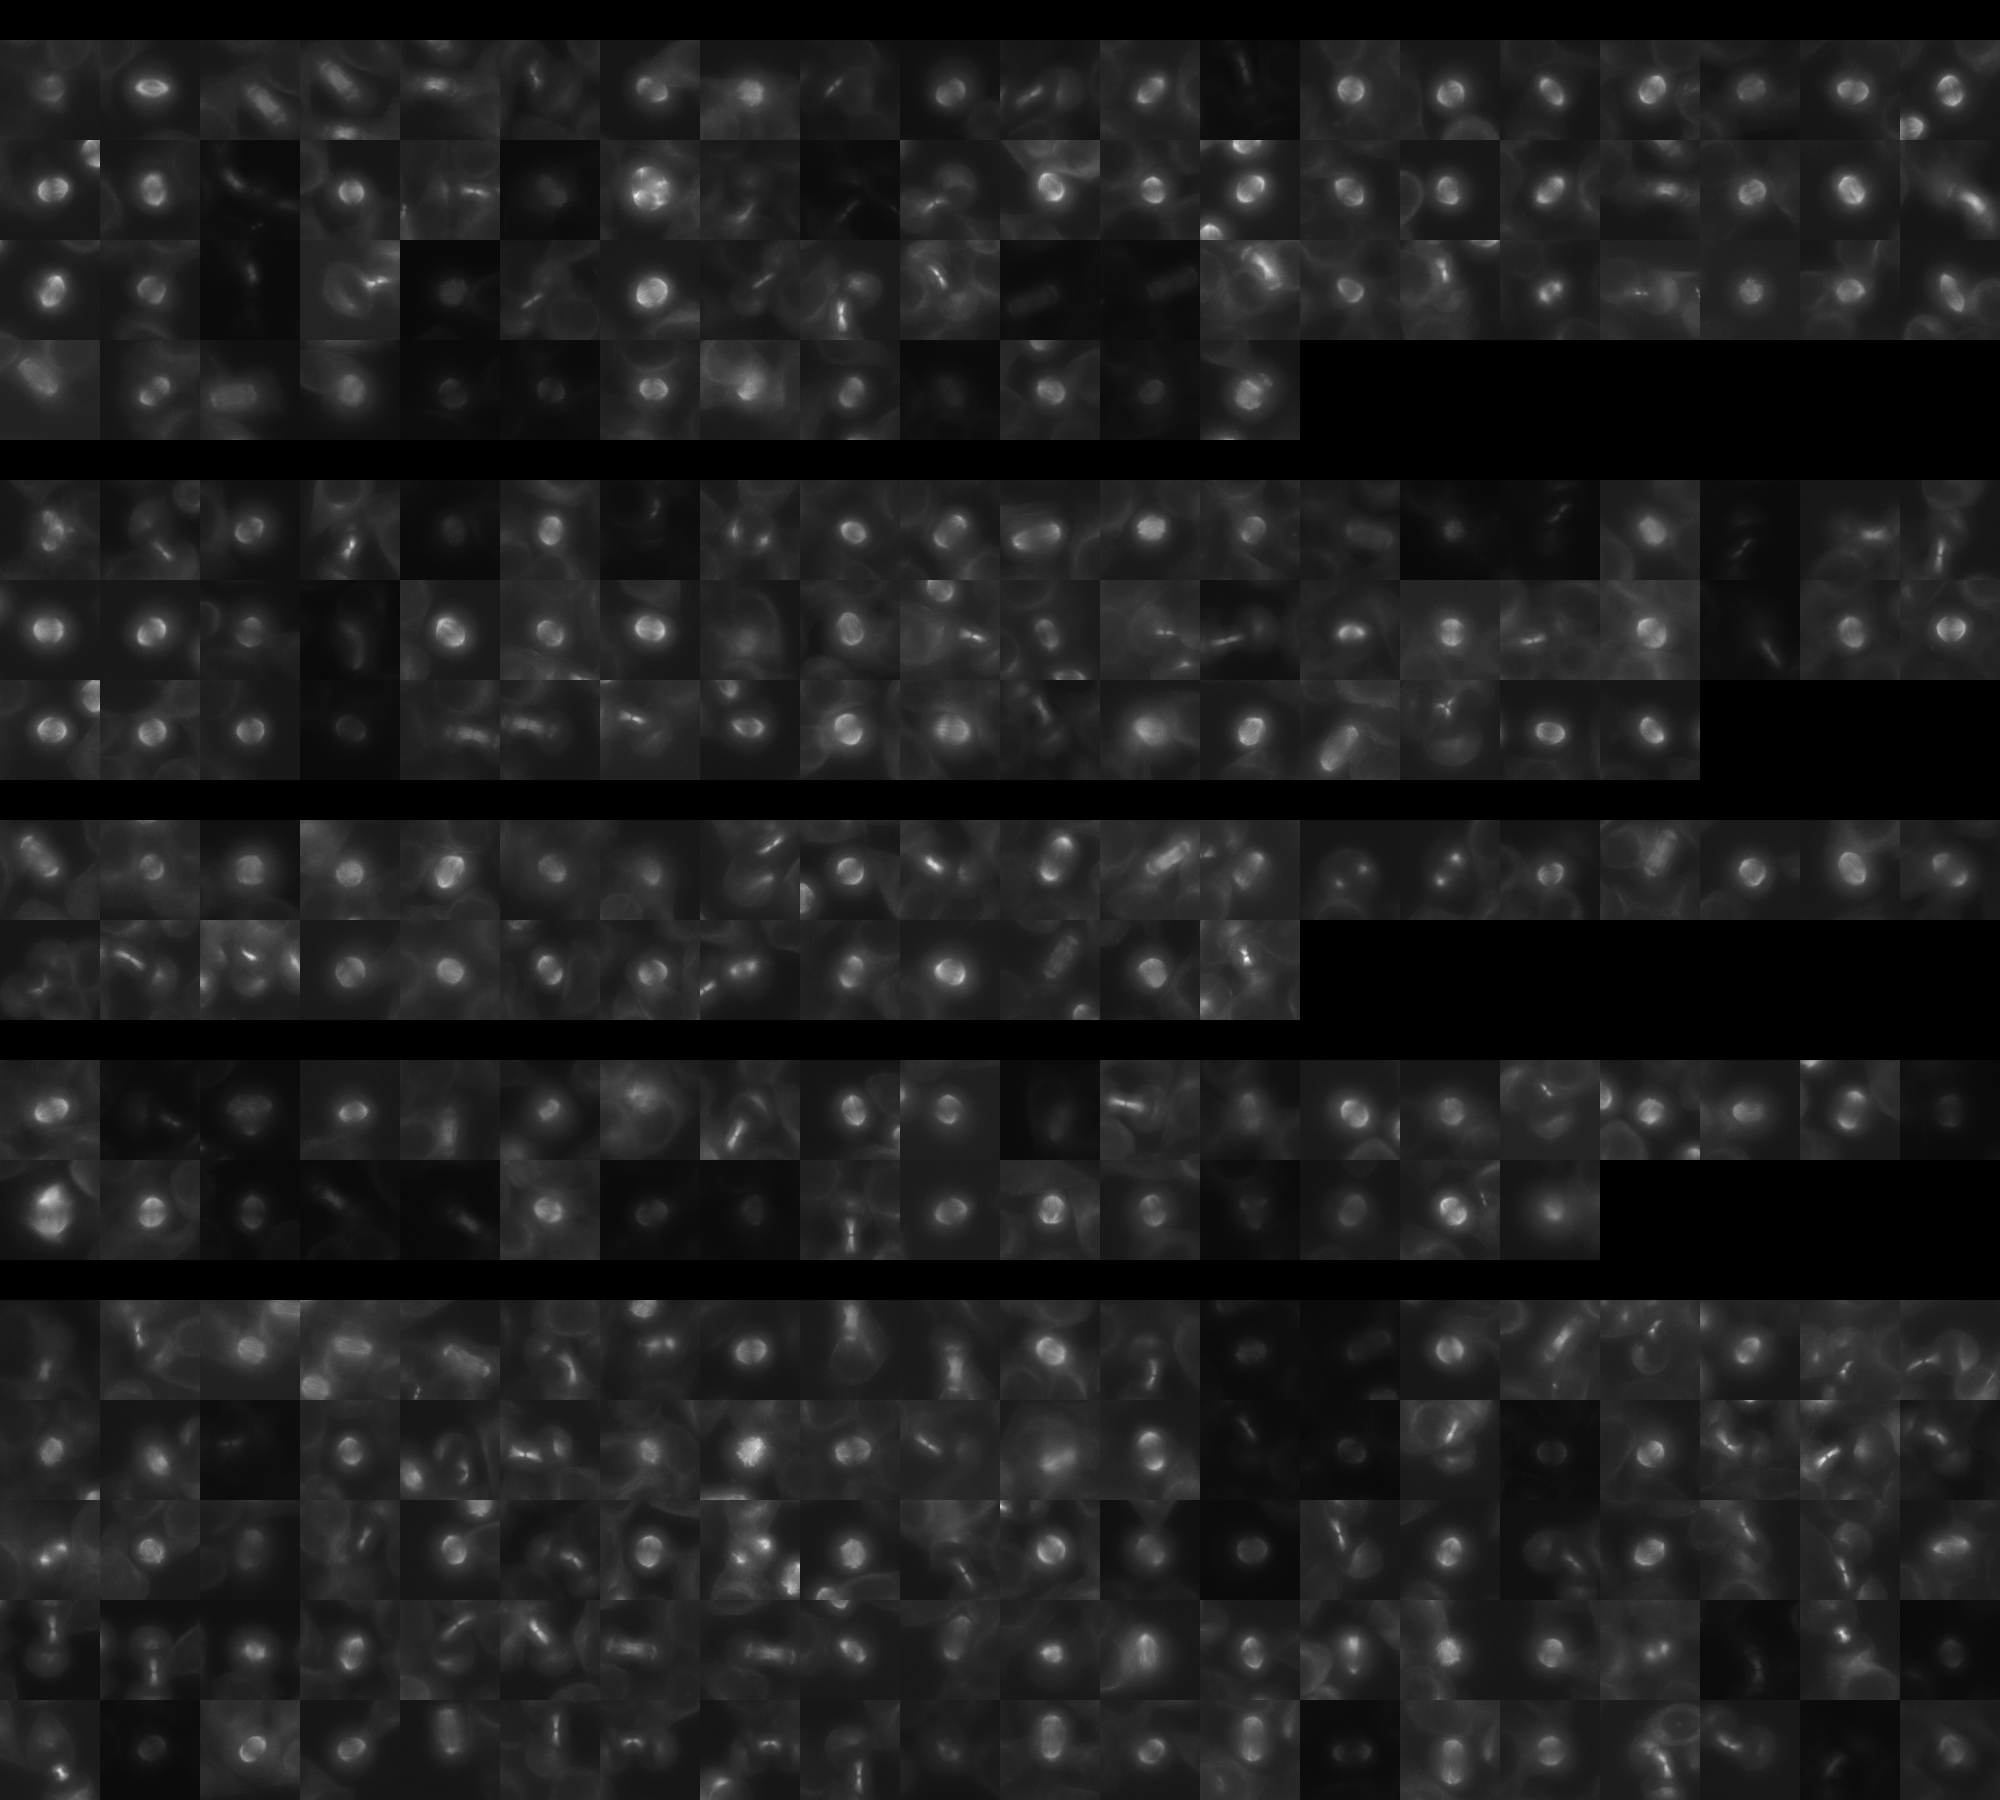
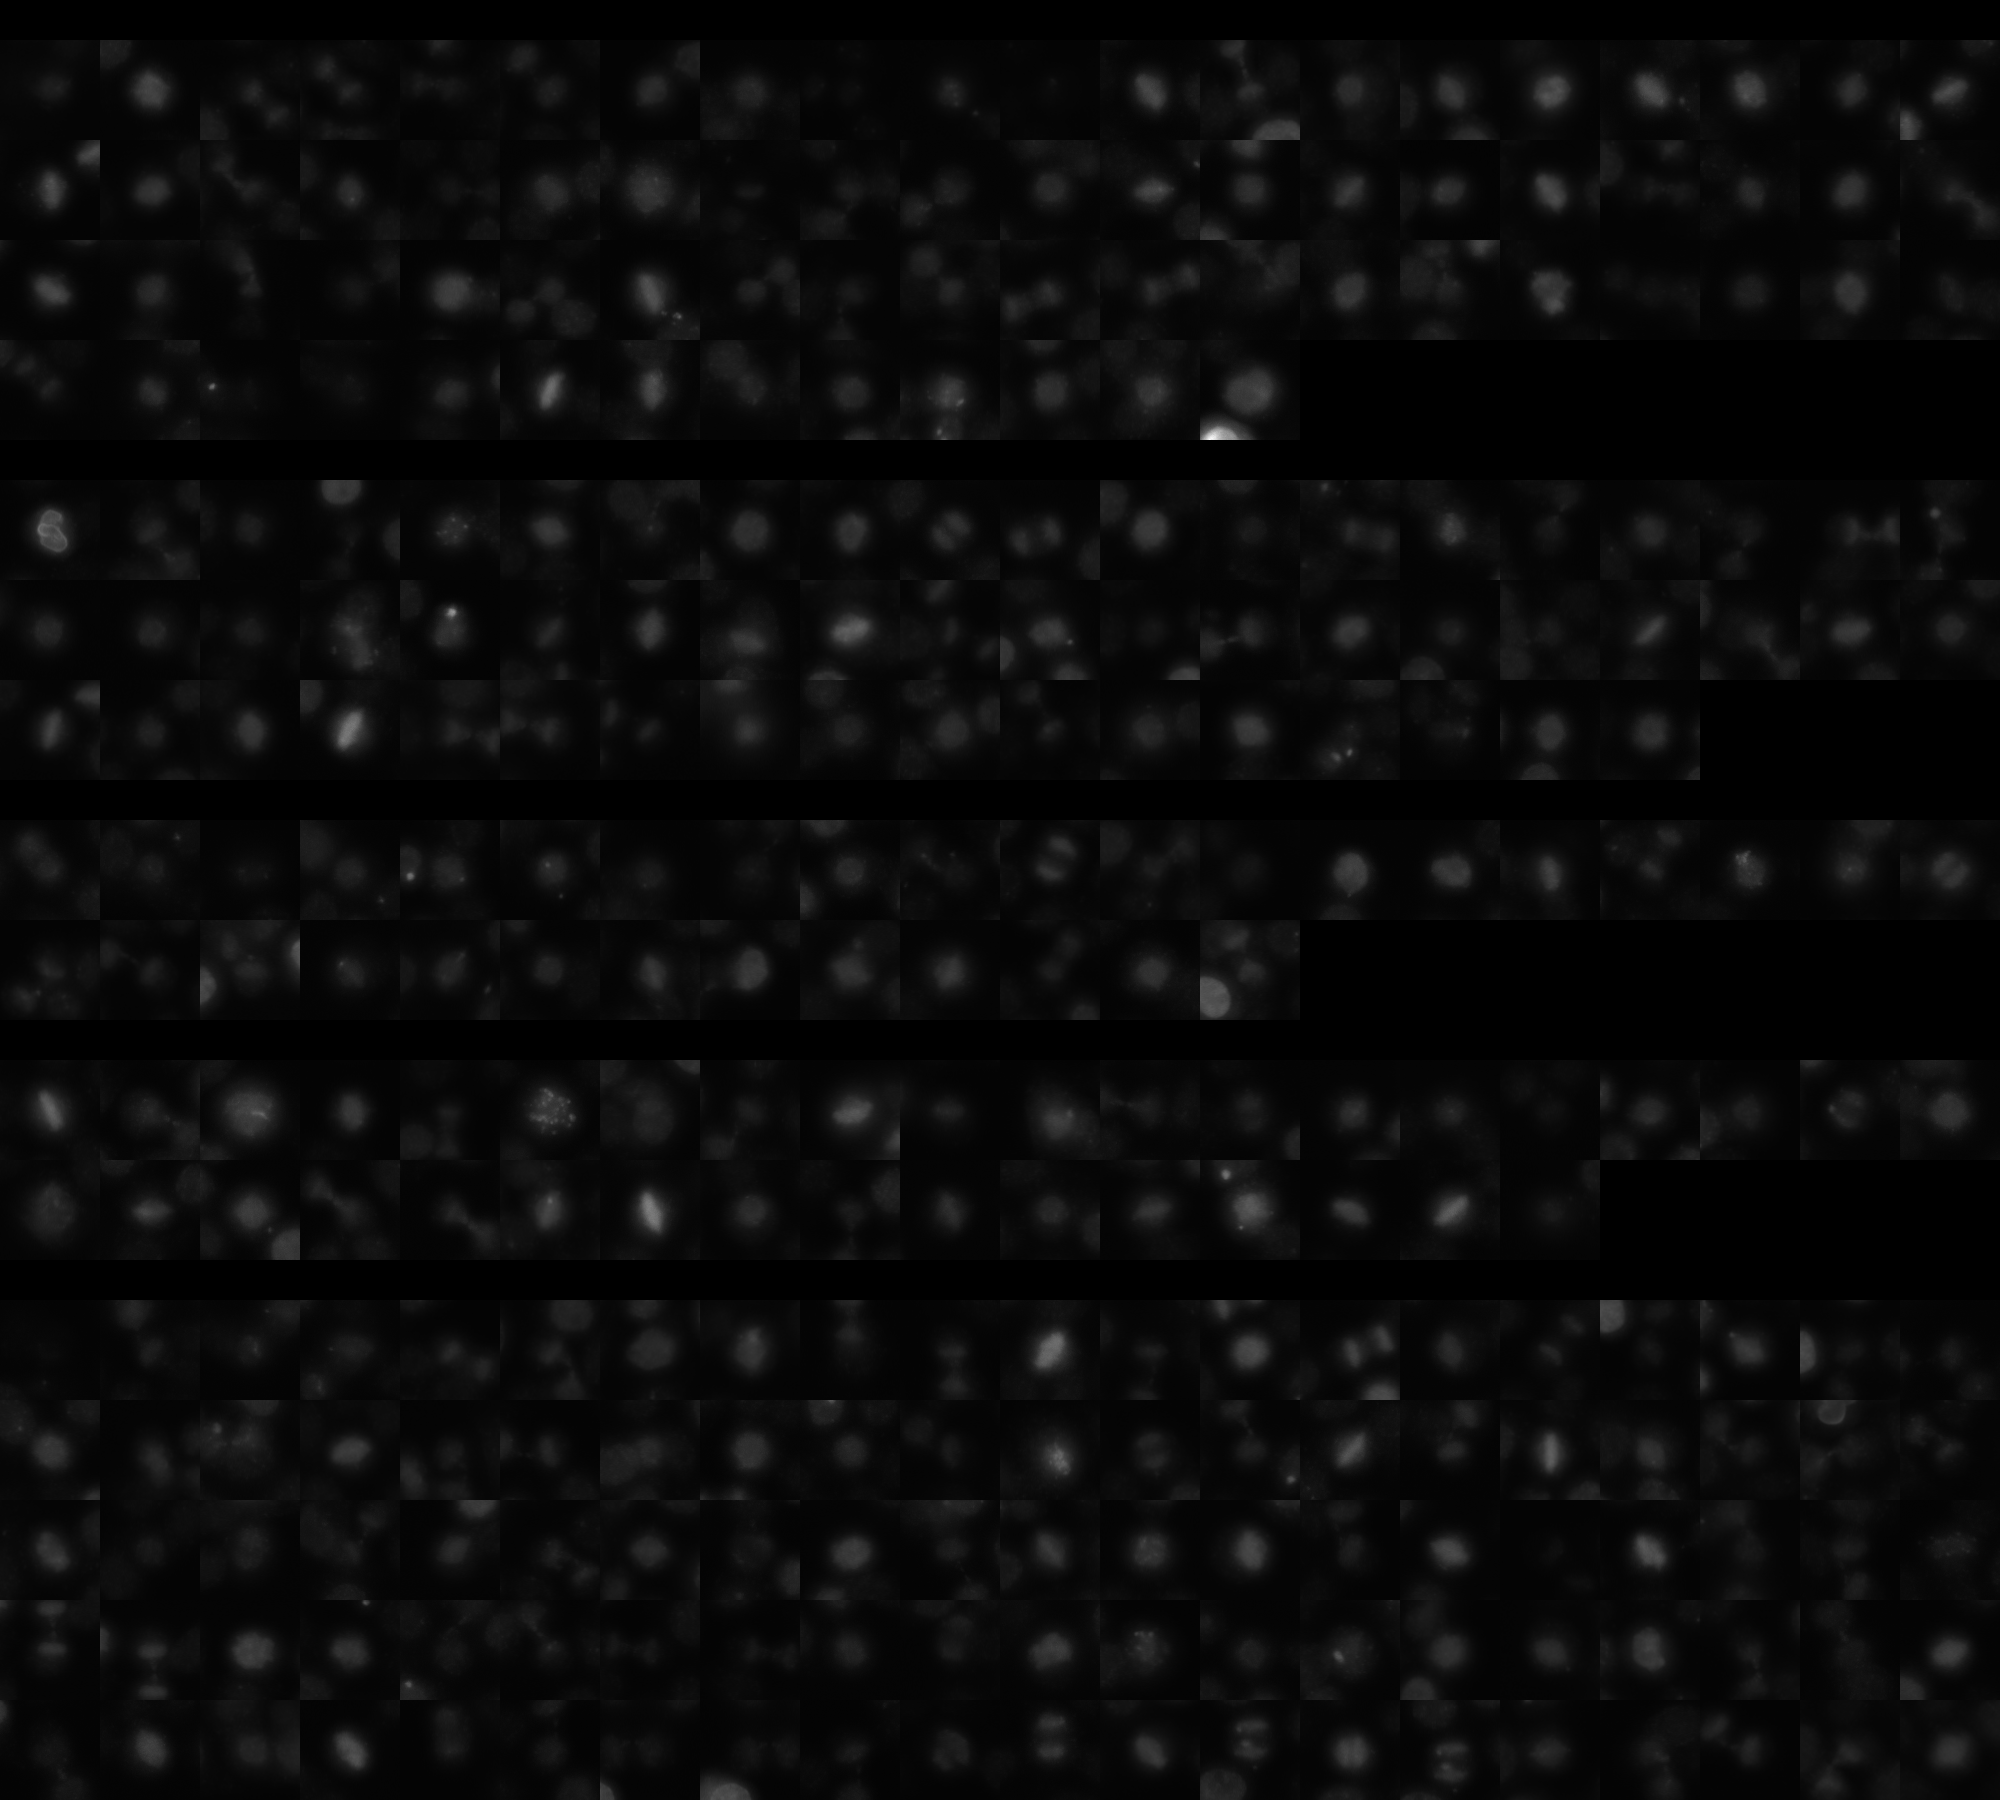
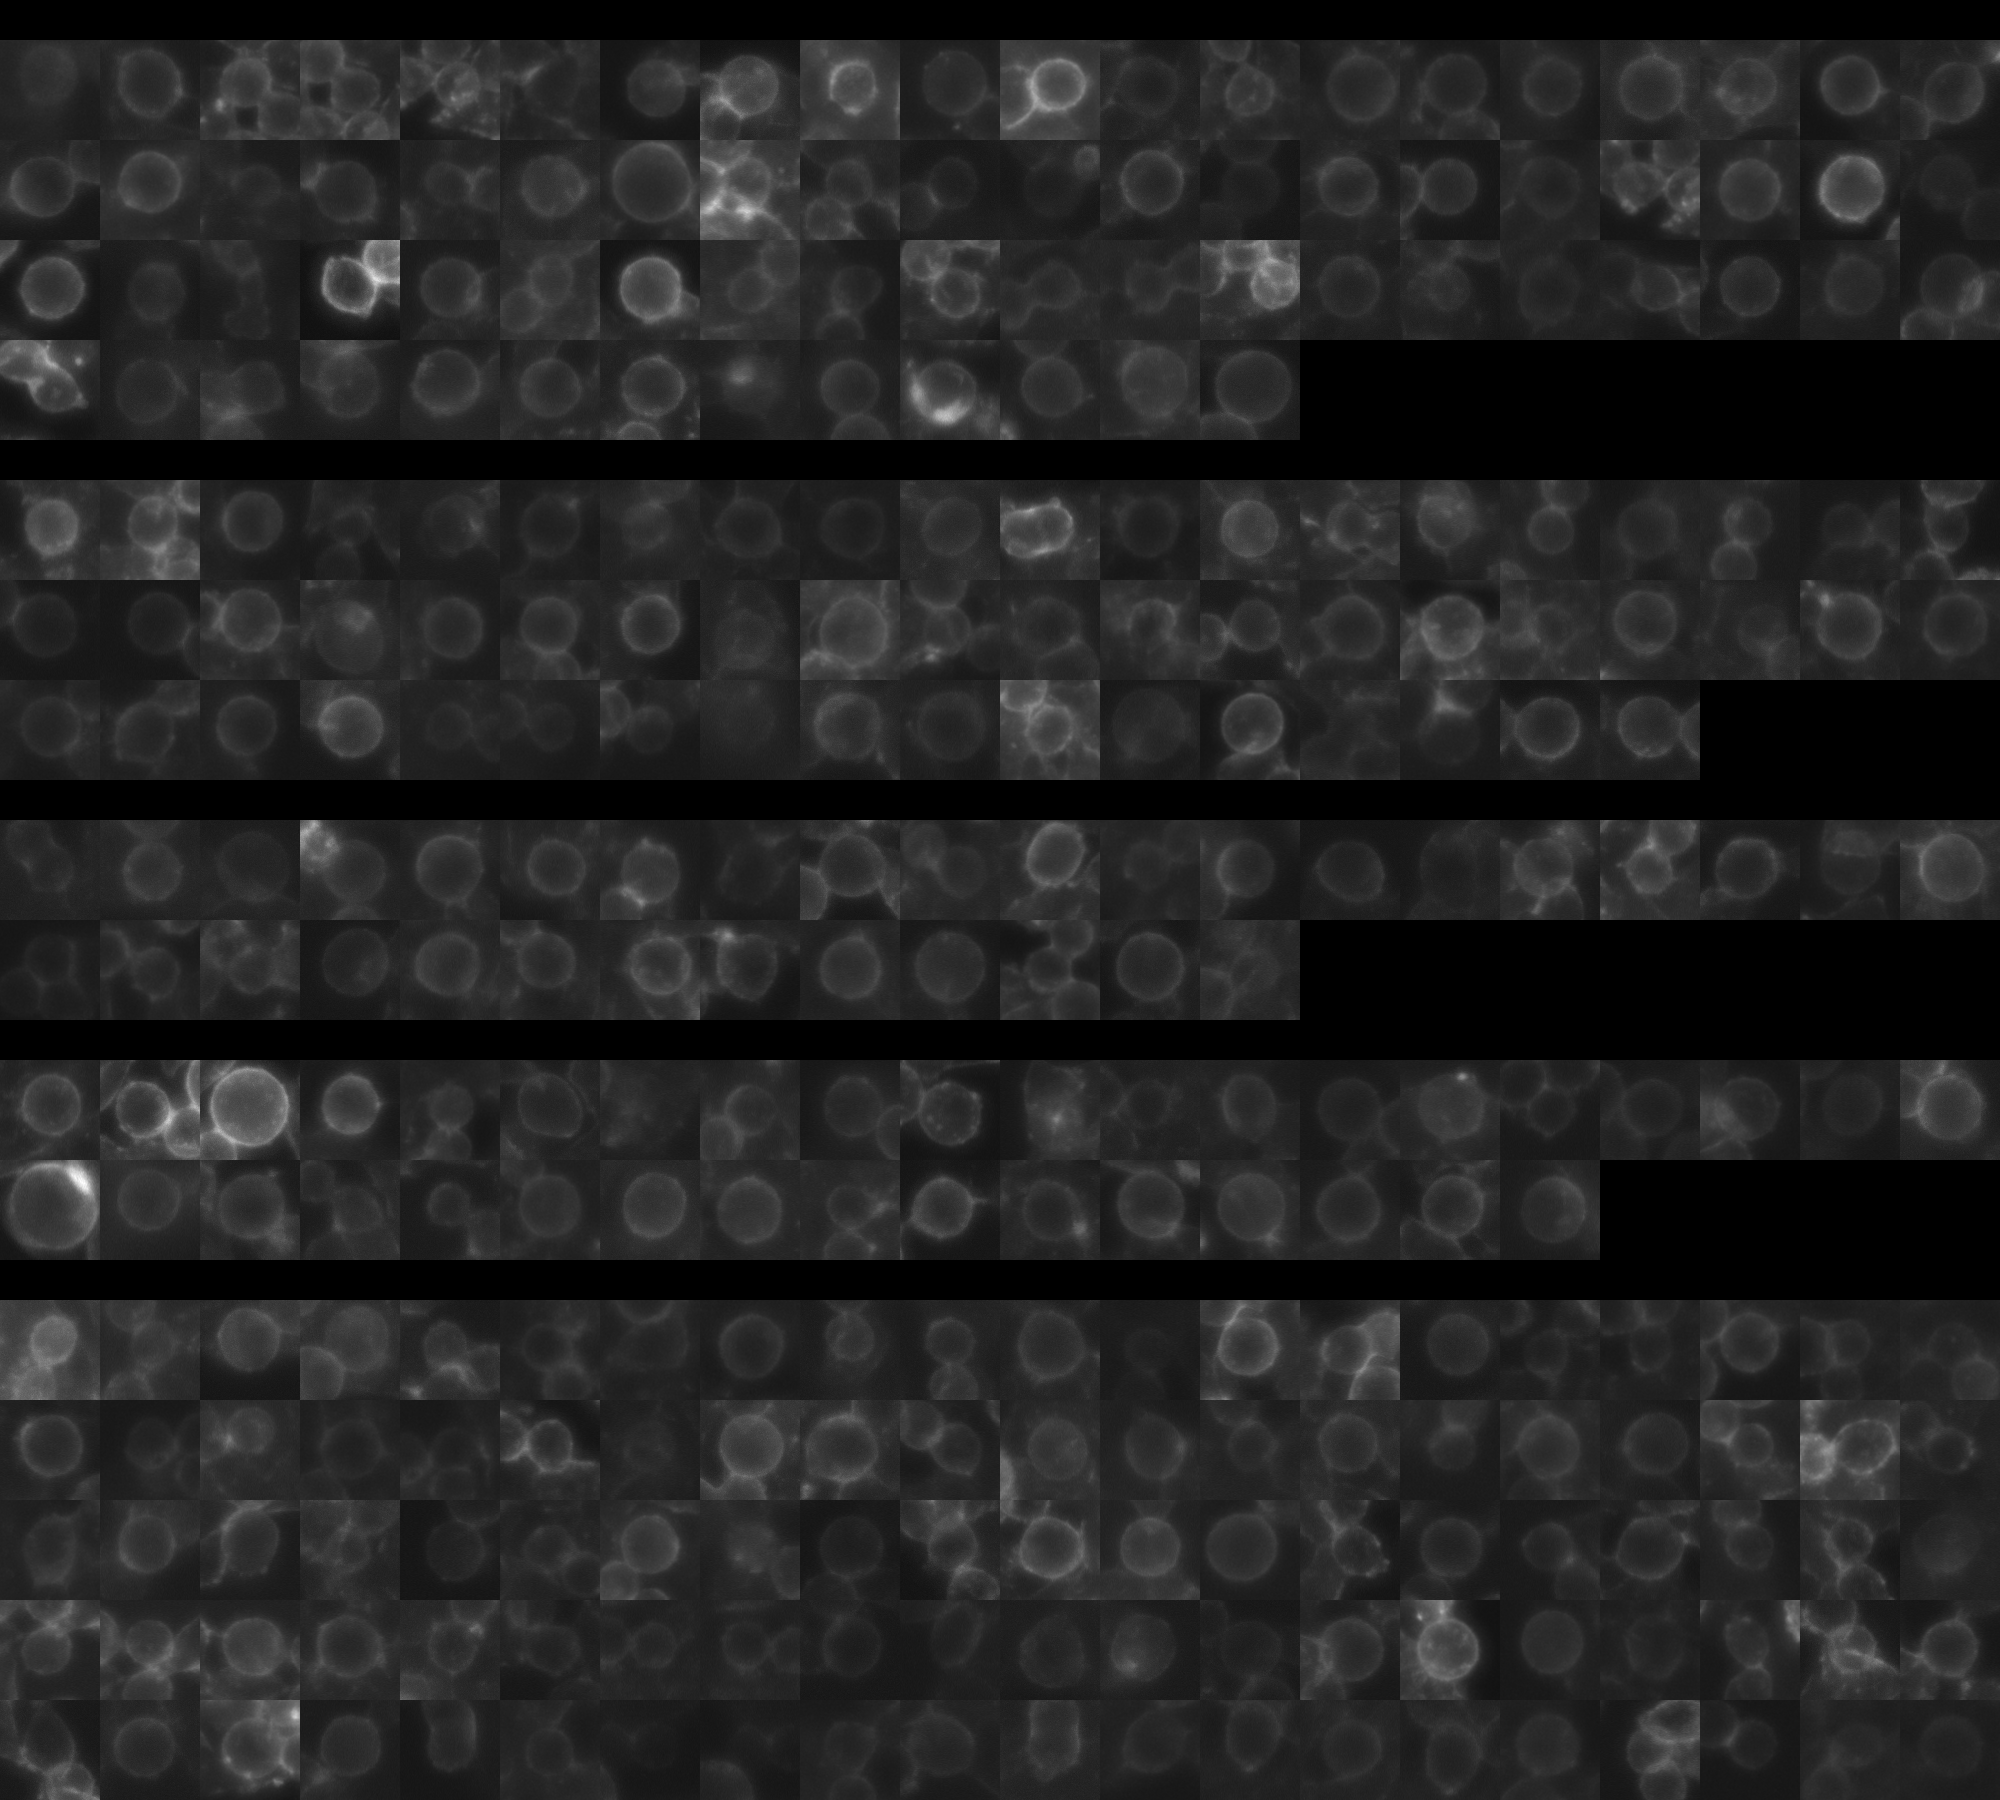
sgRNA 1: AAAGGCTCTCAATTCTCATG (interphase cells: 2764, mitotic cells: 73)
sgRNA 2: AGCAACATGATGCCCAAGTG (interphase cells: 1974, mitotic cells: 57)
sgRNA 3: TCTTGATGTAAAGTTAGCCC (interphase cells: 1510, mitotic cells: 33)
sgRNA 4: TGTACGTACACTACGACTTG (interphase cells: 1574, mitotic cells: 36)

Interphase Cluster

Mitotic Cluster

Overview

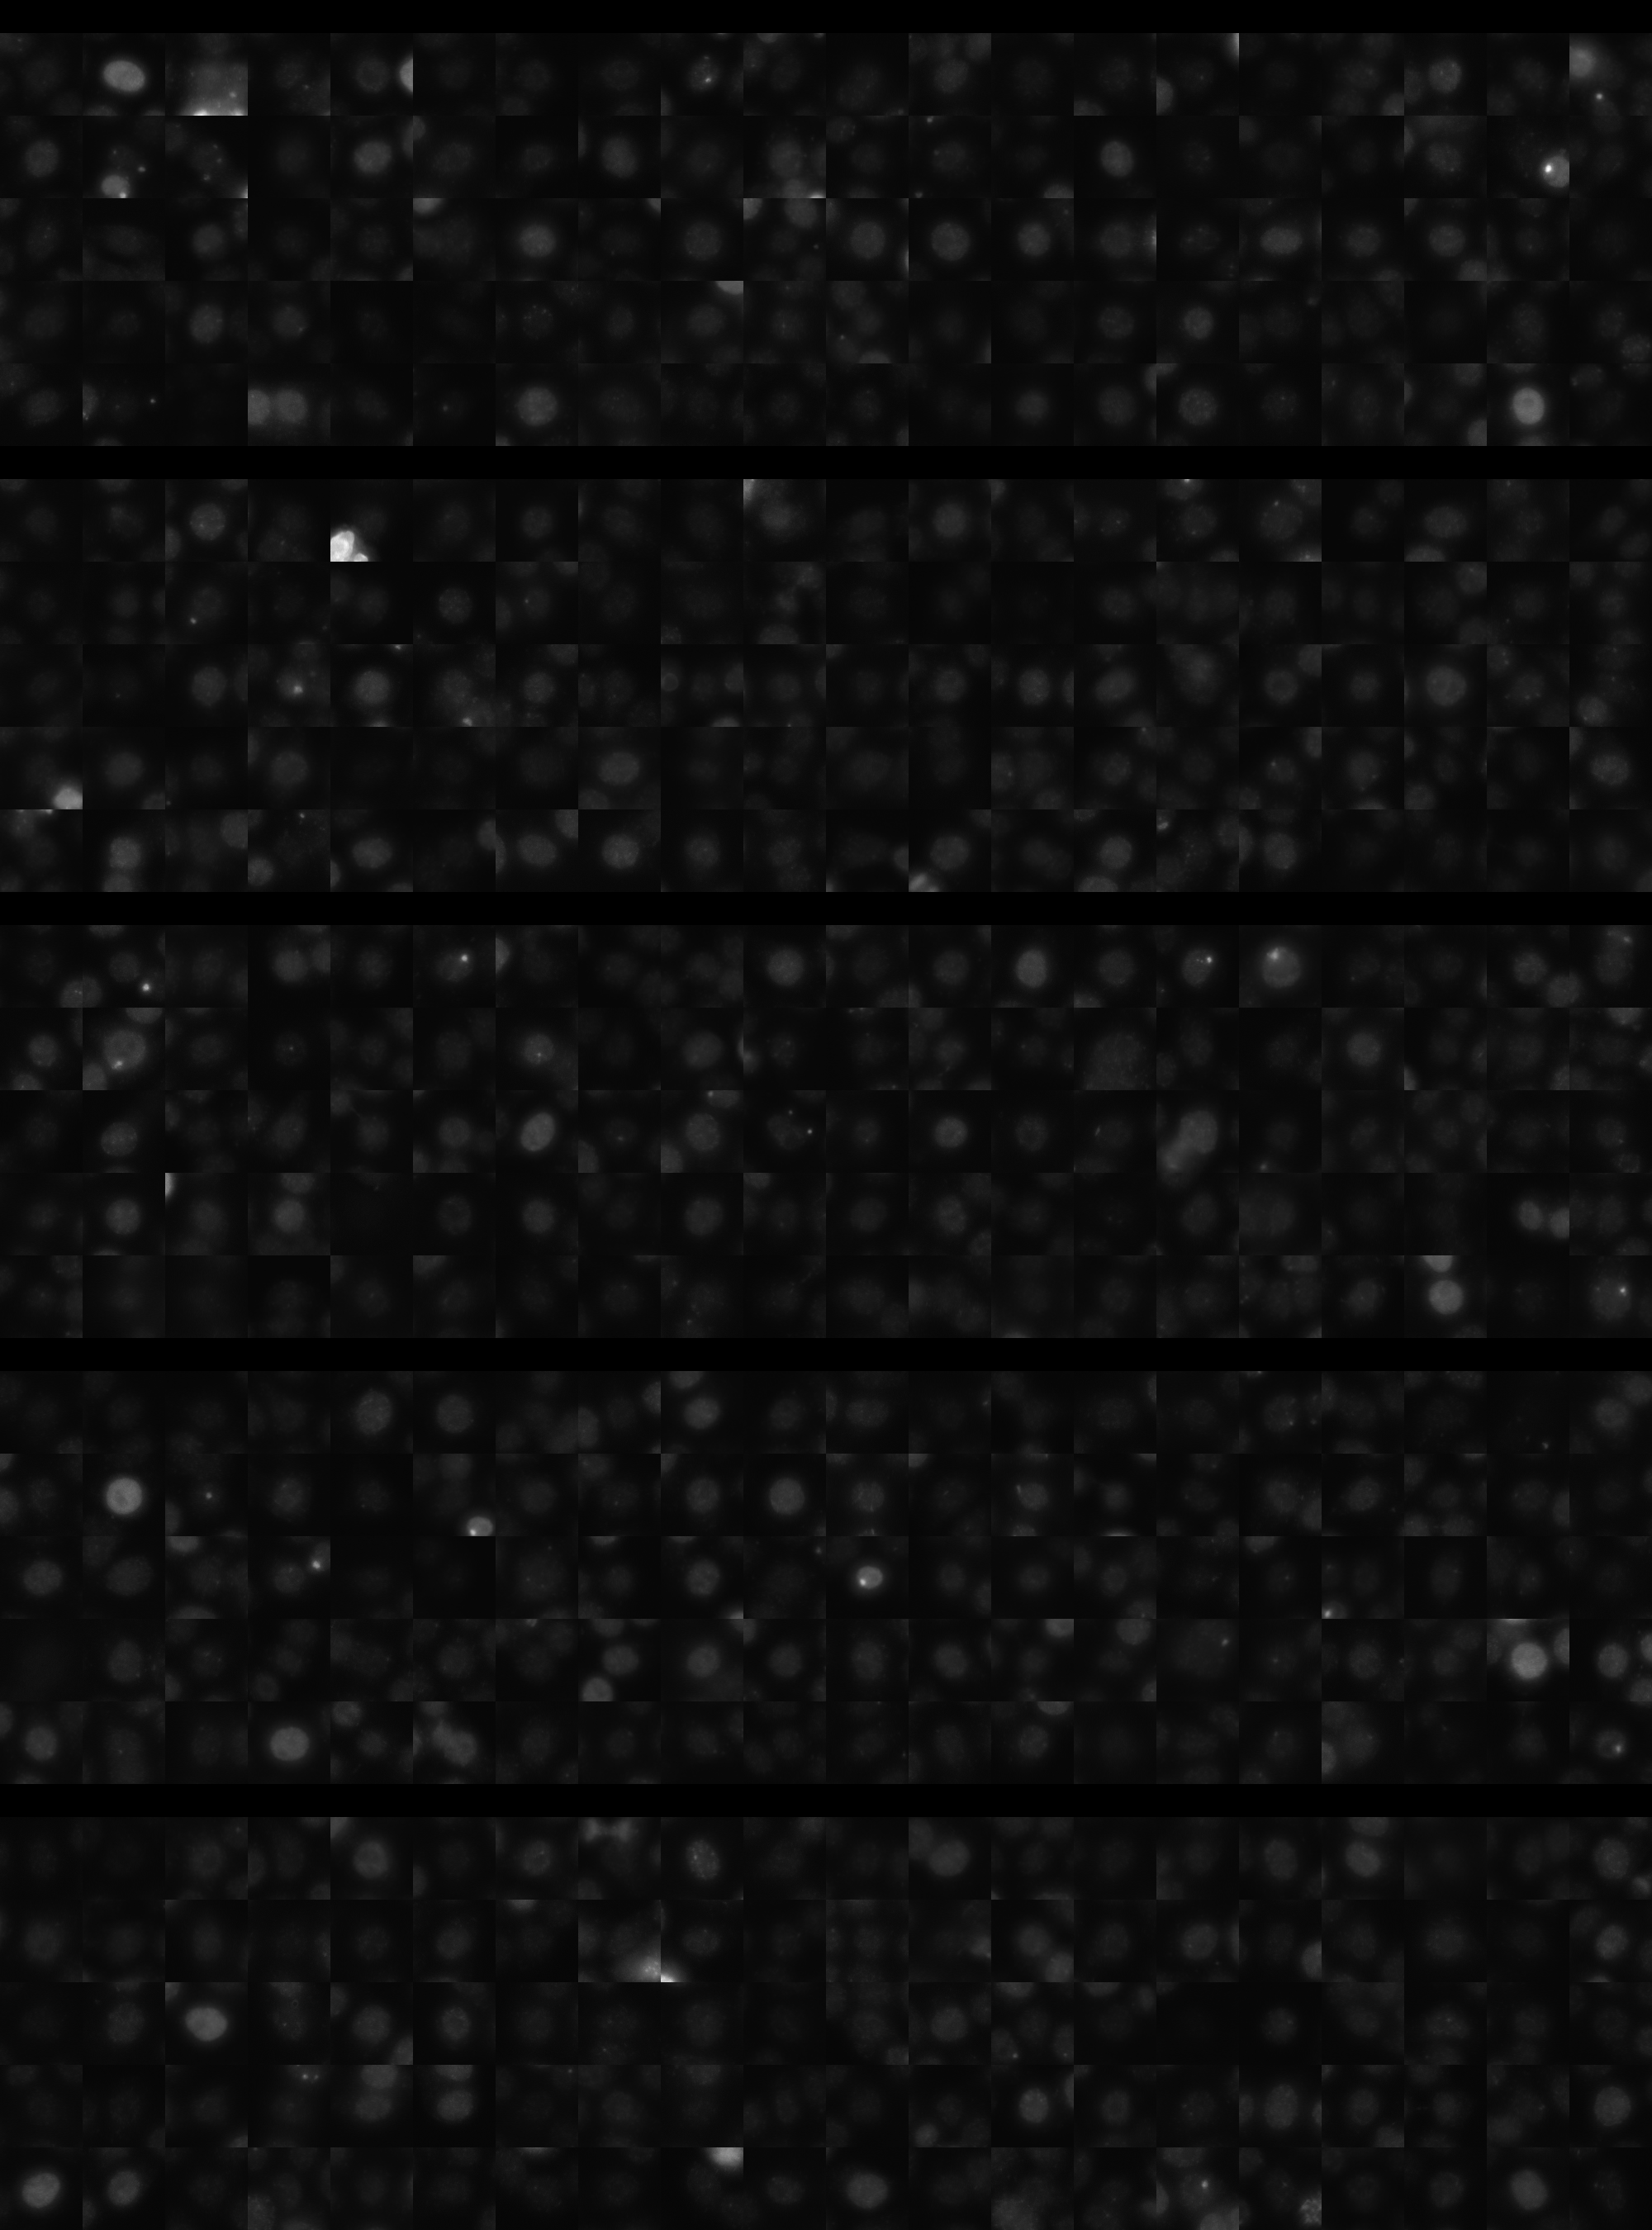
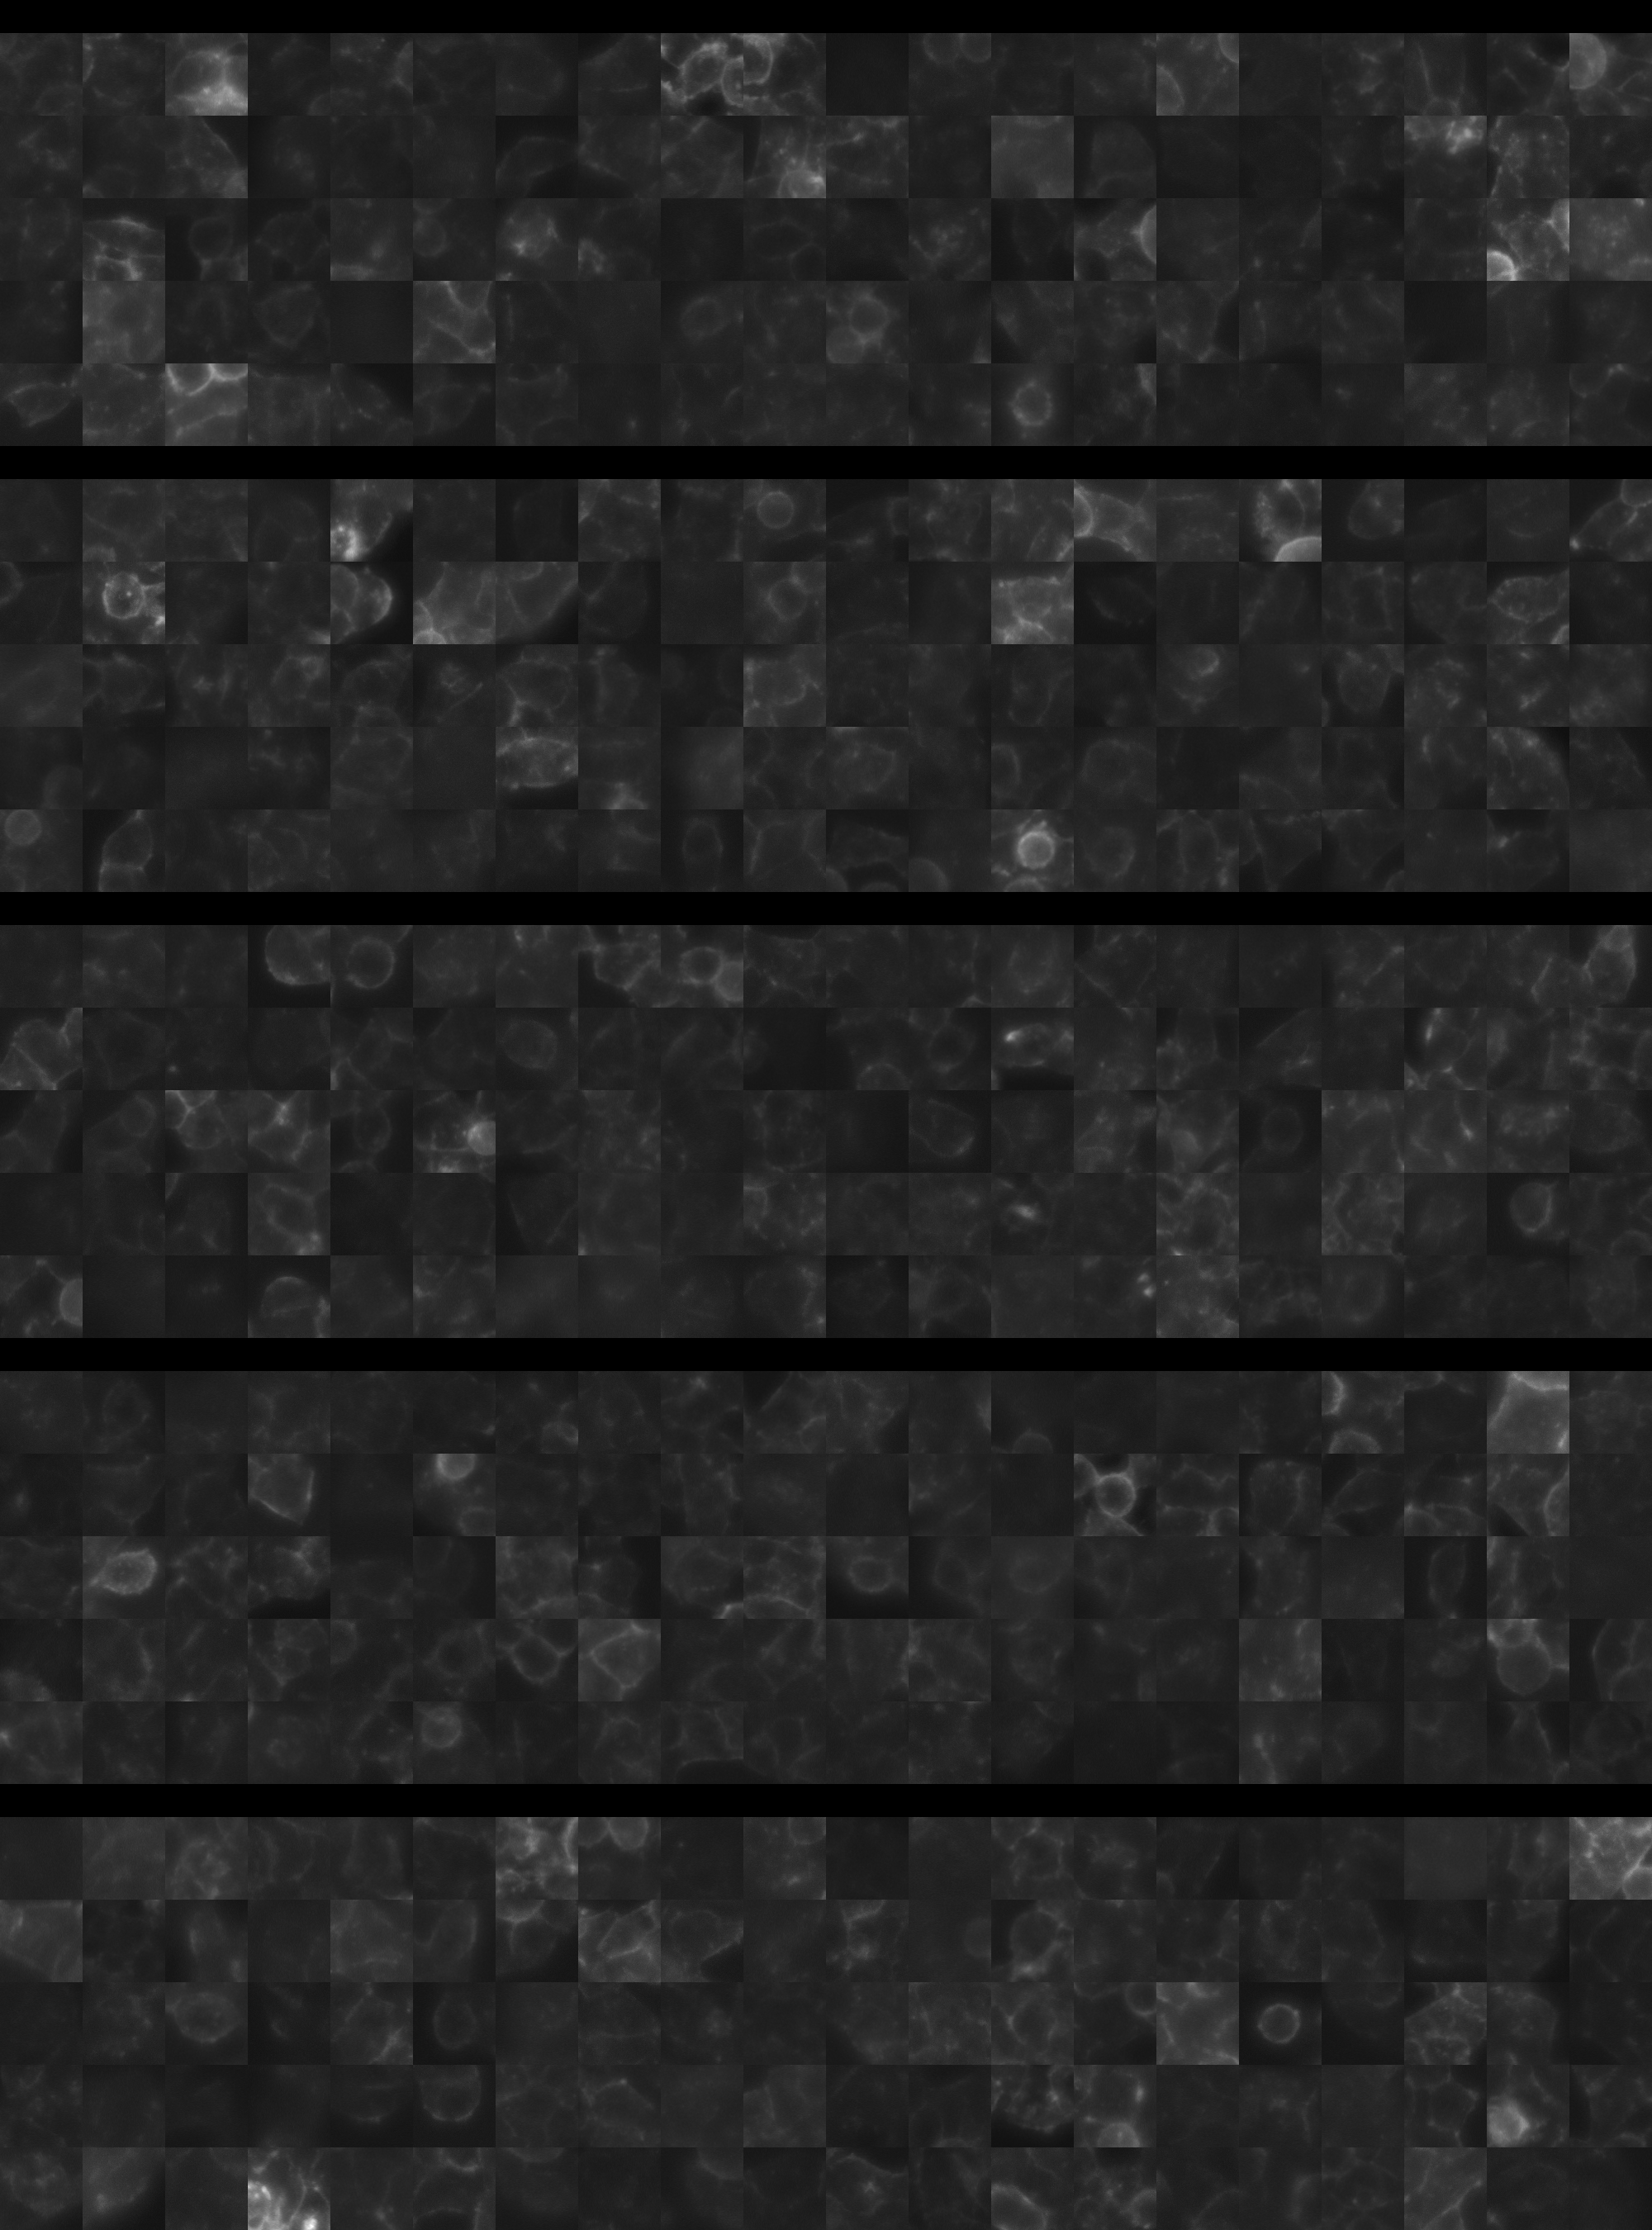
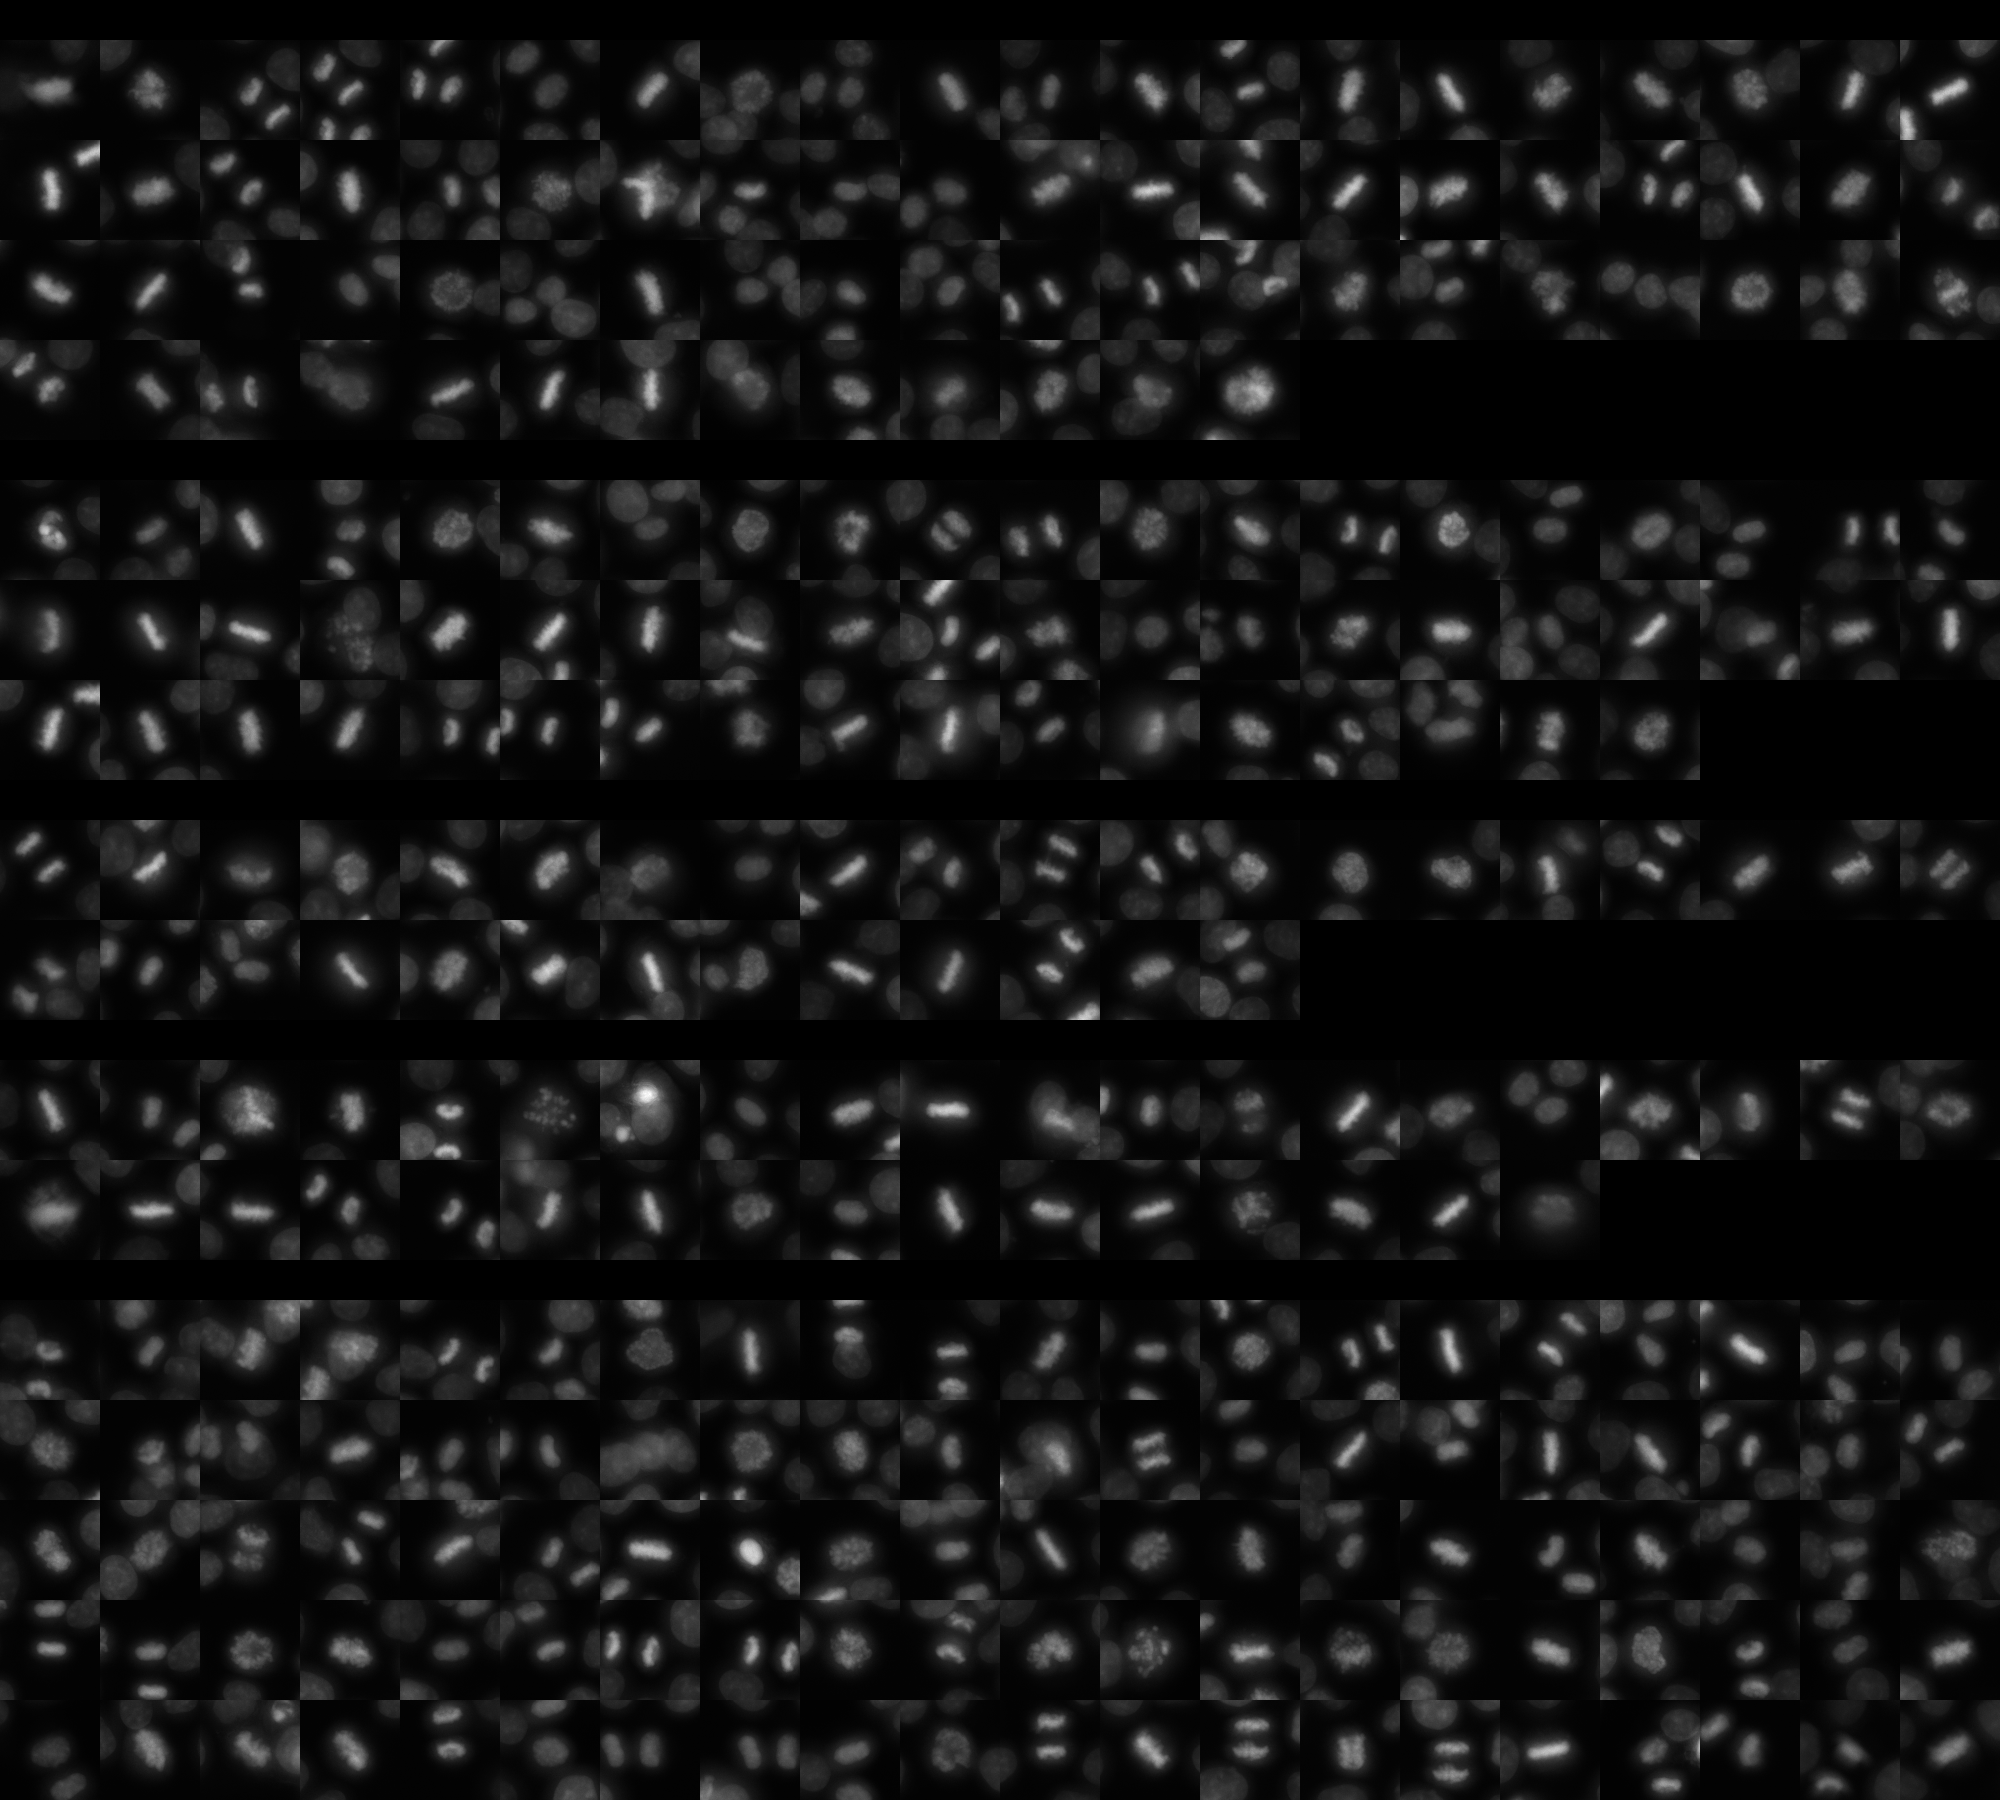
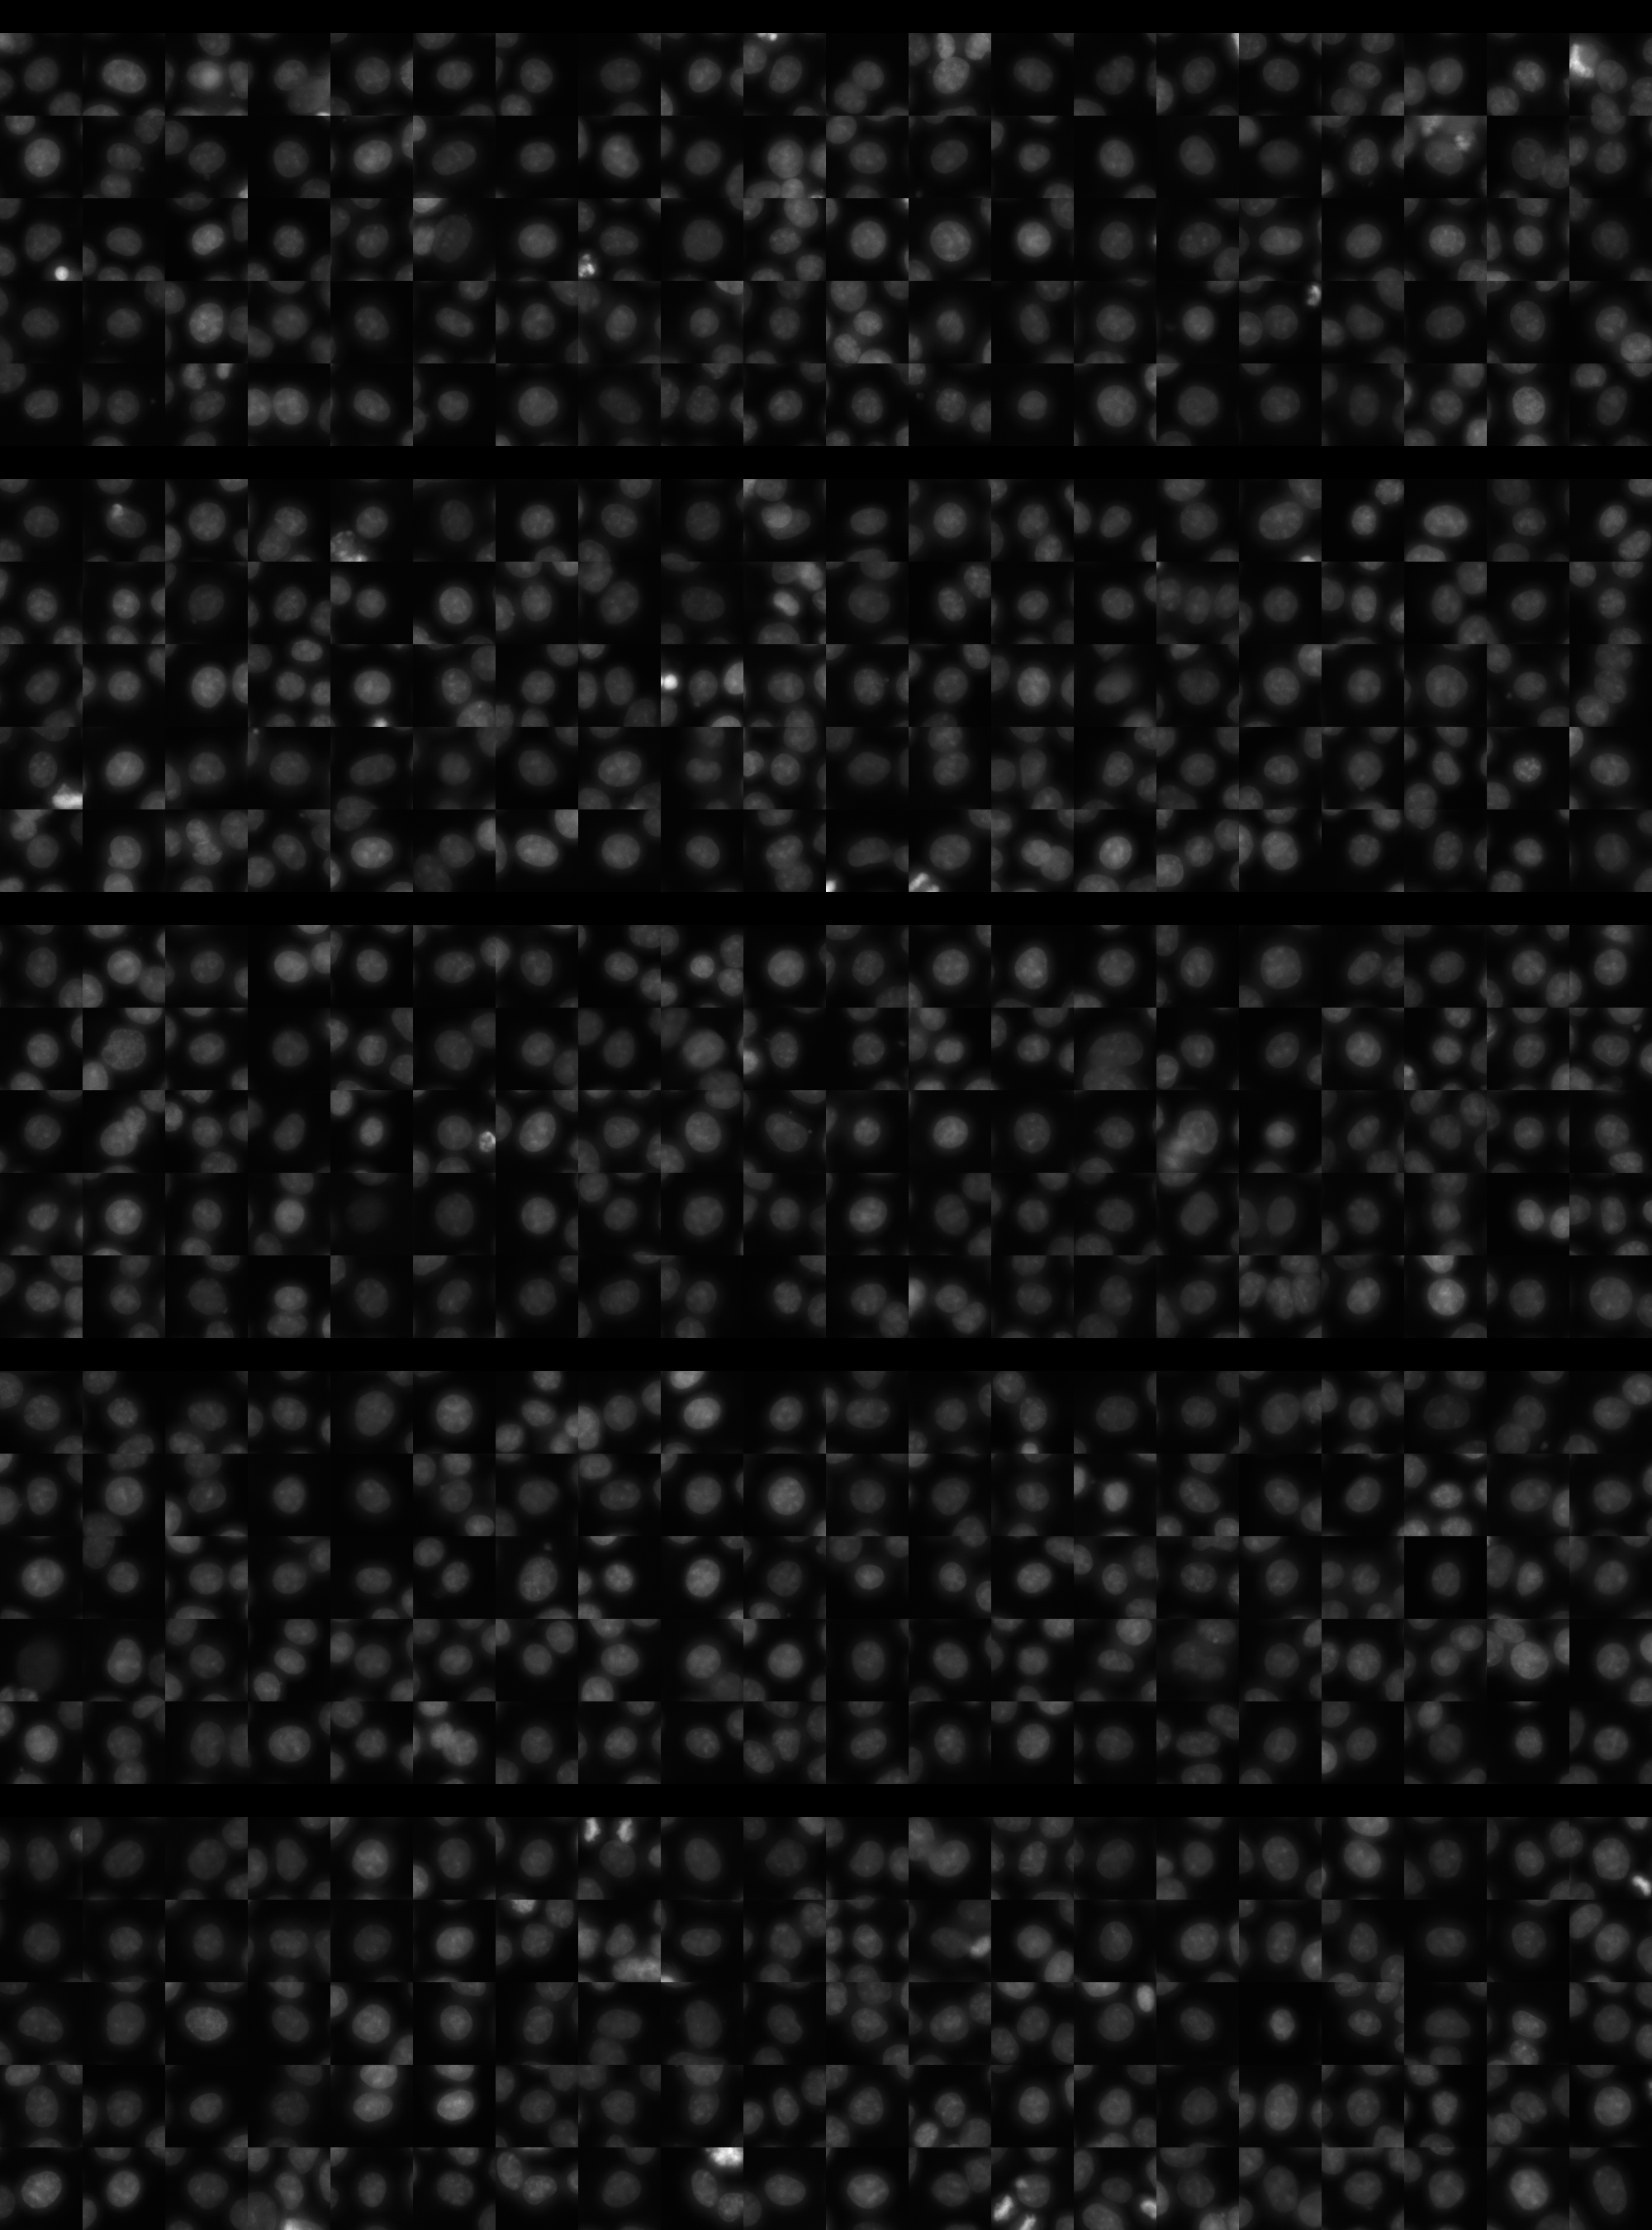
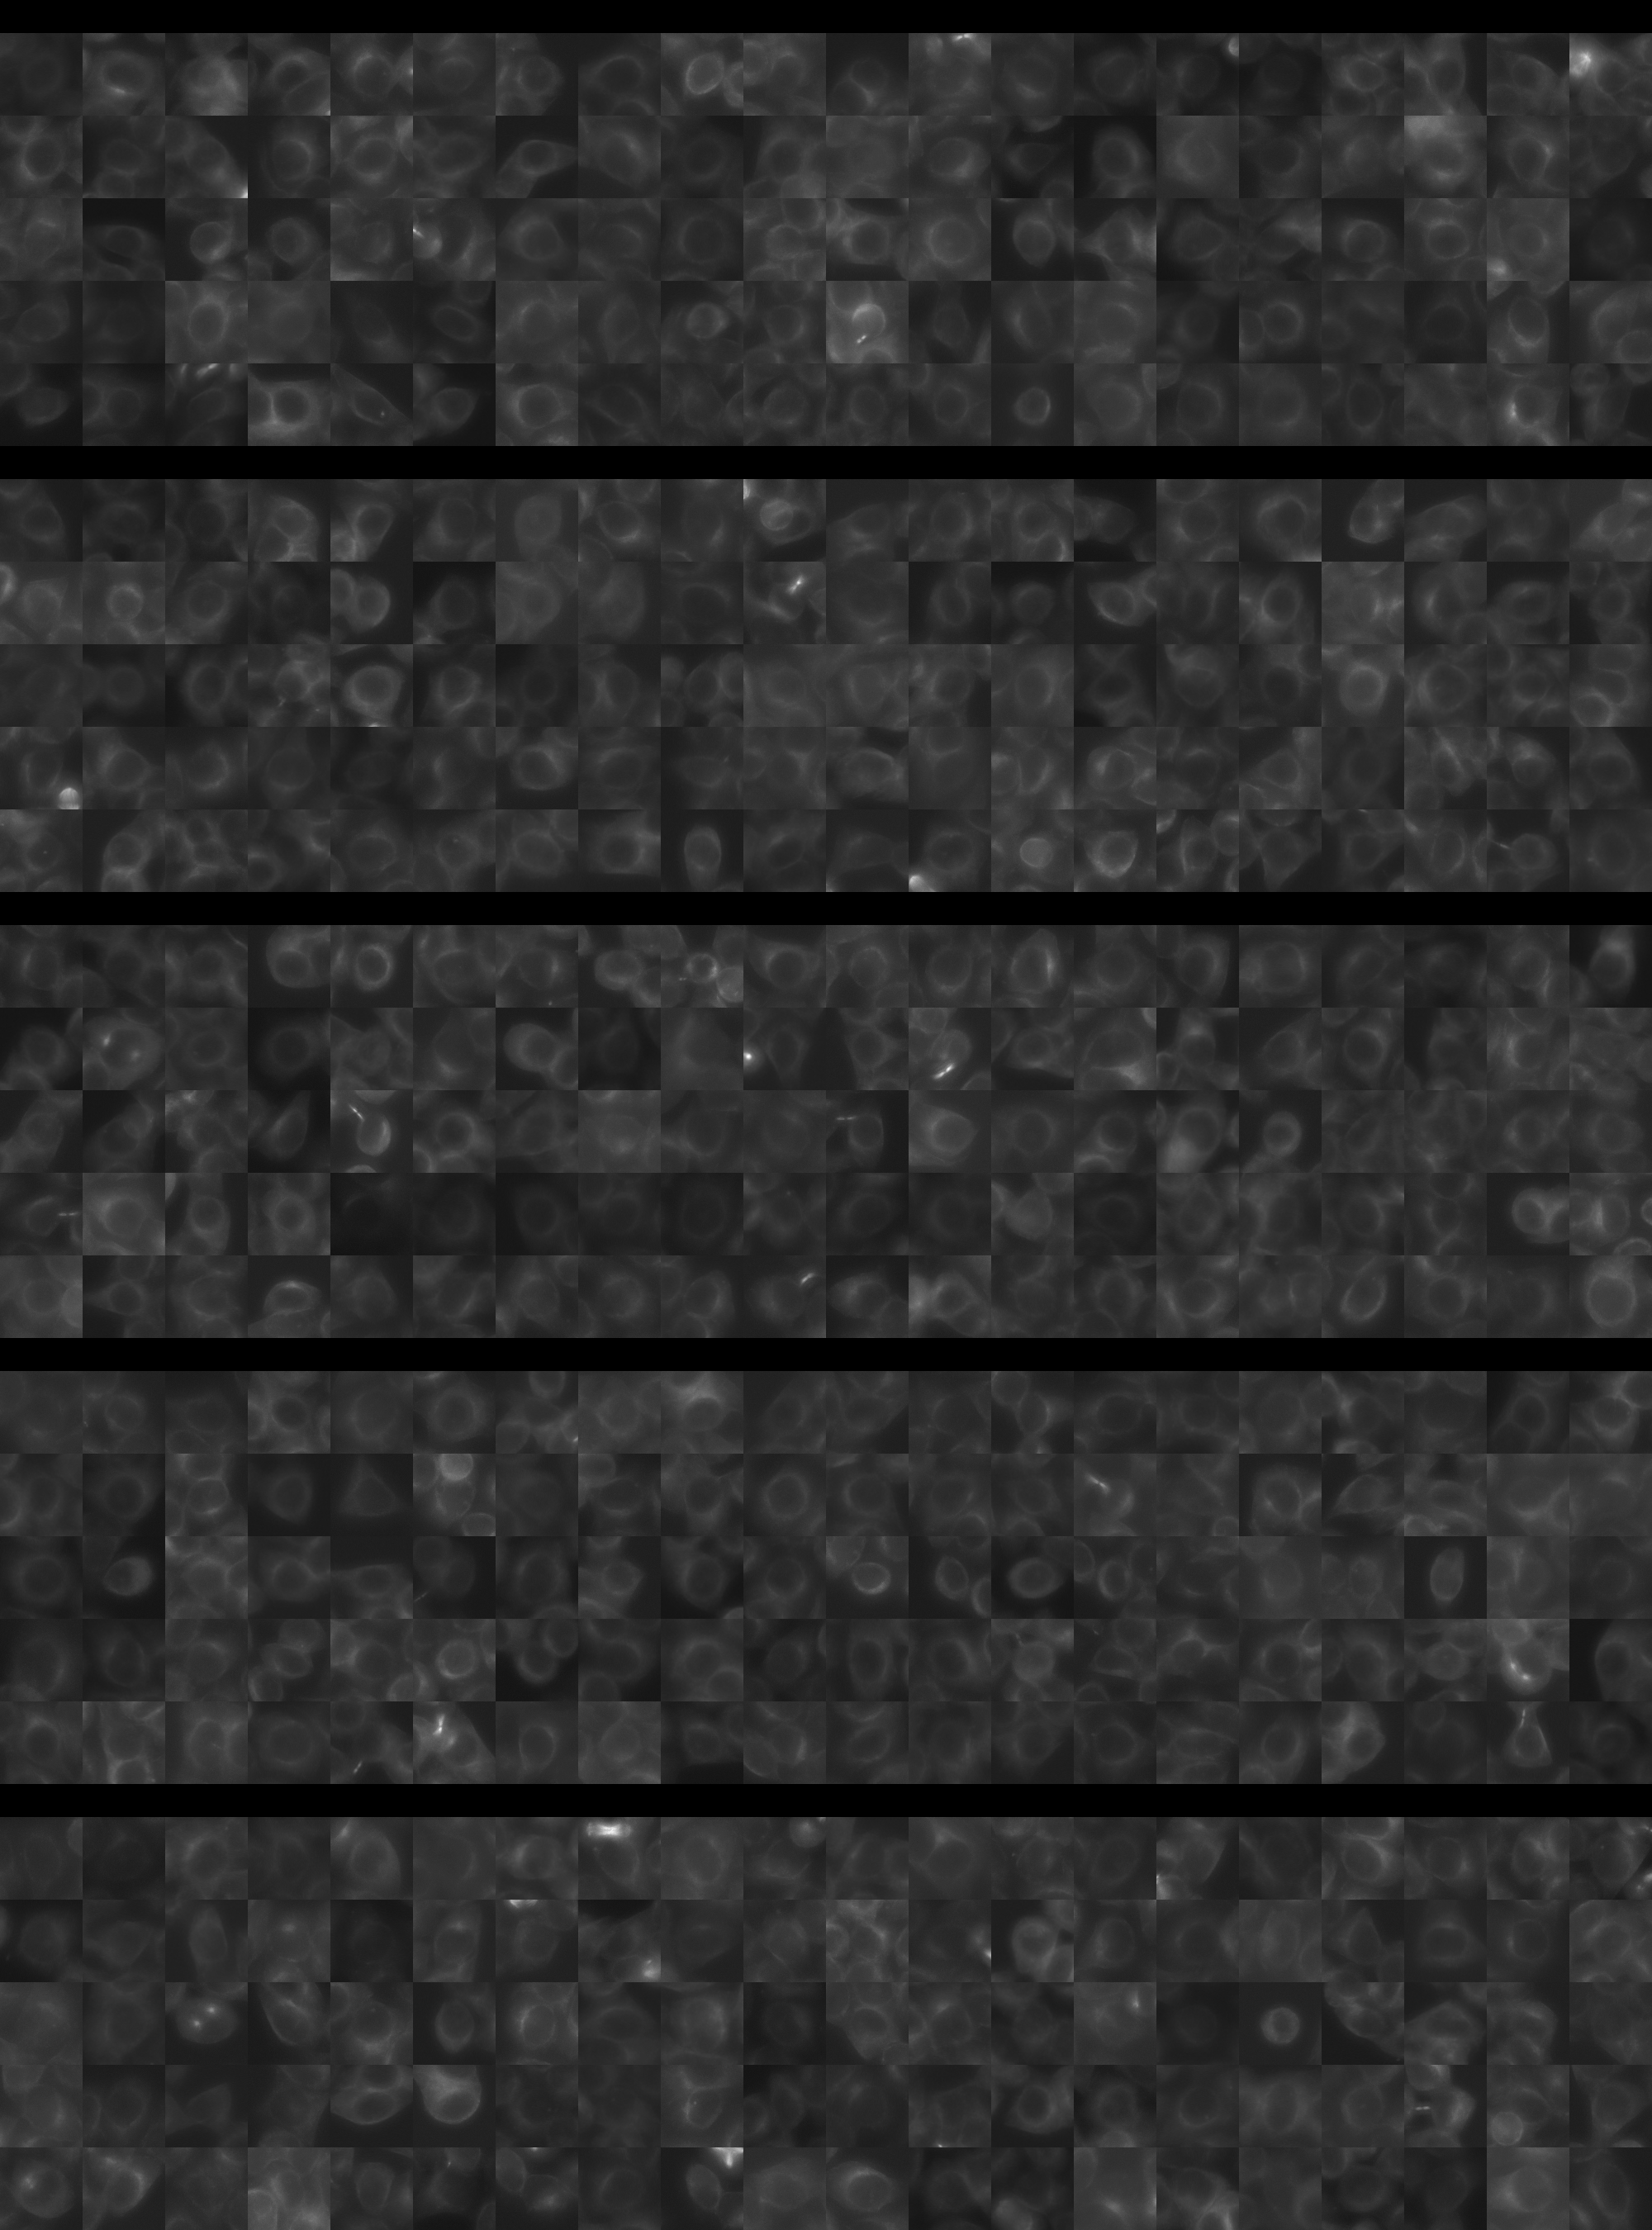
Each montage below shows randomly selected individual cell images for the same target gene separated by sgRNA, along with an example montage of cells expressing a non-targeting negative control sgRNA at the bottom. sgRNA labels in the montages correspond to the numbered sgRNA sequences in the gene info table above. The DNA (blue) and tubulin (green) channels are displayed by default, with gH2AX (grayscale) and actin (yellow) available using the check boxes. Channel brightness, contrast, and opacity are adjustable by clicking the arrow next to the channel name. When only one channel is selected, the display defaults to grayscale. Click the “Zoom” checkbox above the channel controls to enable image zooming (via scrolling) and panning (via click-and-drag).

The cell boxes displayed for this gene are square, 30.36 μm per side for the interphase montage and 30.36 μm per side for the mitotic montage.
Features

Interphase Score Rank FDR q-value
Nucleus DNA Integrated -6.314e-03 3436 of 5322 0.915
Nucleus DNA Mean 0.271 238 of 5322 1.505e-04
Nucleus gH2AX Mean 0.147 1071 of 5322 2.456e-04
Nucleus DNA - gH2AX Correlation 0.134 125 of 5322 1.021e-04
Nucleus Shape Area -3.243e-01 5123 of 5322 1.633e-04
Nucleus Shape Eccentricity -4.805e-01 5320 of 5322 4.529e-04
Nucleus Shape Form Factor 0.047 93 of 5322 0.102
Nucleus Shape Solidity -4.034e-02 2254 of 5322 0.210
Cell DNA Mass Displacement 0.080 401 of 5322 0.042
Cell Tubulin Mean 0.116 388 of 5322 0.002
Cell Tubulin Mass Displacement 0.074 308 of 5322 0.019
Cell Actin Mean 0.109 729 of 5322 0.009
Cell Tubulin - Actin Correlation 0.140 331 of 5322 2.896e-04
Cell DNA - Tubulin Correlation -1.568e-01 5270 of 5322 1.948e-04
Cell Shape Area -4.972e-02 4369 of 5322 0.226
Cell Shape Eccentricity -1.715e-02 4648 of 5322 0.859
Mitotic Score Rank FDR q-value
Nucleus DNA Integrated 0.220 1077 of 5322 0.807
Nucleus DNA Mean 0.202 567 of 5322 1.000
Nucleus DNA Mass Displacement 0.071 2367 of 5322 0.999
Nucleus DNA Mean Frac 3 -2.179e-01 5078 of 5322 1.000
Nucleus gH2AX Mean -9.933e-02 4228 of 5322 1.000
Nucleus gH2AX Mean Frac 0 0.153 562 of 5322 1.000
Nucleus Tubulin Mean Frac 0 0.068 2449 of 5322 0.999
Nucleus Tubulin Mean Edge 0.186 930 of 5322 0.996
Nucleus Tubulin Std Edge 0.098 1293 of 5322 0.999
Nucleus Shape Area 0.049 3356 of 5322 0.990
Nucleus Shape Eccentricity 0.037 1548 of 5322 1.000
Nucleus Shape Form Factor -1.373e-01 3388 of 5322 0.998
Cell Tubulin Mean 0.114 1861 of 5322 0.997
Cell Tubulin Mean Frac 3 -1.250e-01 3222 of 5322 0.999
Cell Actin Mean 0.022 2905 of 5322 0.997
Cell Shape Area 0.129 2220 of 5322 0.998
( Reset Zoom )
Brightness
Contrast
Opacity
Brightness
Contrast
Opacity
Brightness
Contrast
Opacity
Brightness
Contrast
Opacity
Brightness
Contrast
Opacity

( Reset Zoom )
Brightness
Contrast
Opacity
Brightness
Contrast
Opacity
Brightness
Contrast
Opacity
Brightness
Contrast
Opacity
Brightness
Contrast
Opacity

MIT Central Accessability