LCN6

Due to sgRNA sequence design constraints two or more of the sgRNAs used to target this gene have multiple genomic target sites, potentially impacting the observed phenotype through increased DNA damage.
Gene symbol: LCN6
Gene: 158062
Uniprot Function: May play a role in male fertility.
Mitotic Index 0.0275
Interphase Cluster: #193 (12 genes)
Mitotic Cluster: #140 (20 genes)
sgRNA 1: AGGGTGTGACCAGAGTGTCA (interphase cells: 1046, mitotic cells: 20)
sgRNA 2: CAACCACACGGCCTGGGCCC (interphase cells: 1411, mitotic cells: 33)
sgRNA 3: GATAAAGCGAAACTCCGGAT (interphase cells: 710, mitotic cells: 23)
sgRNA 4: TCACTCCAGAAAACAACCTG (interphase cells: 1721, mitotic cells: 62)

Interphase Cluster

Mitotic Cluster

Overview

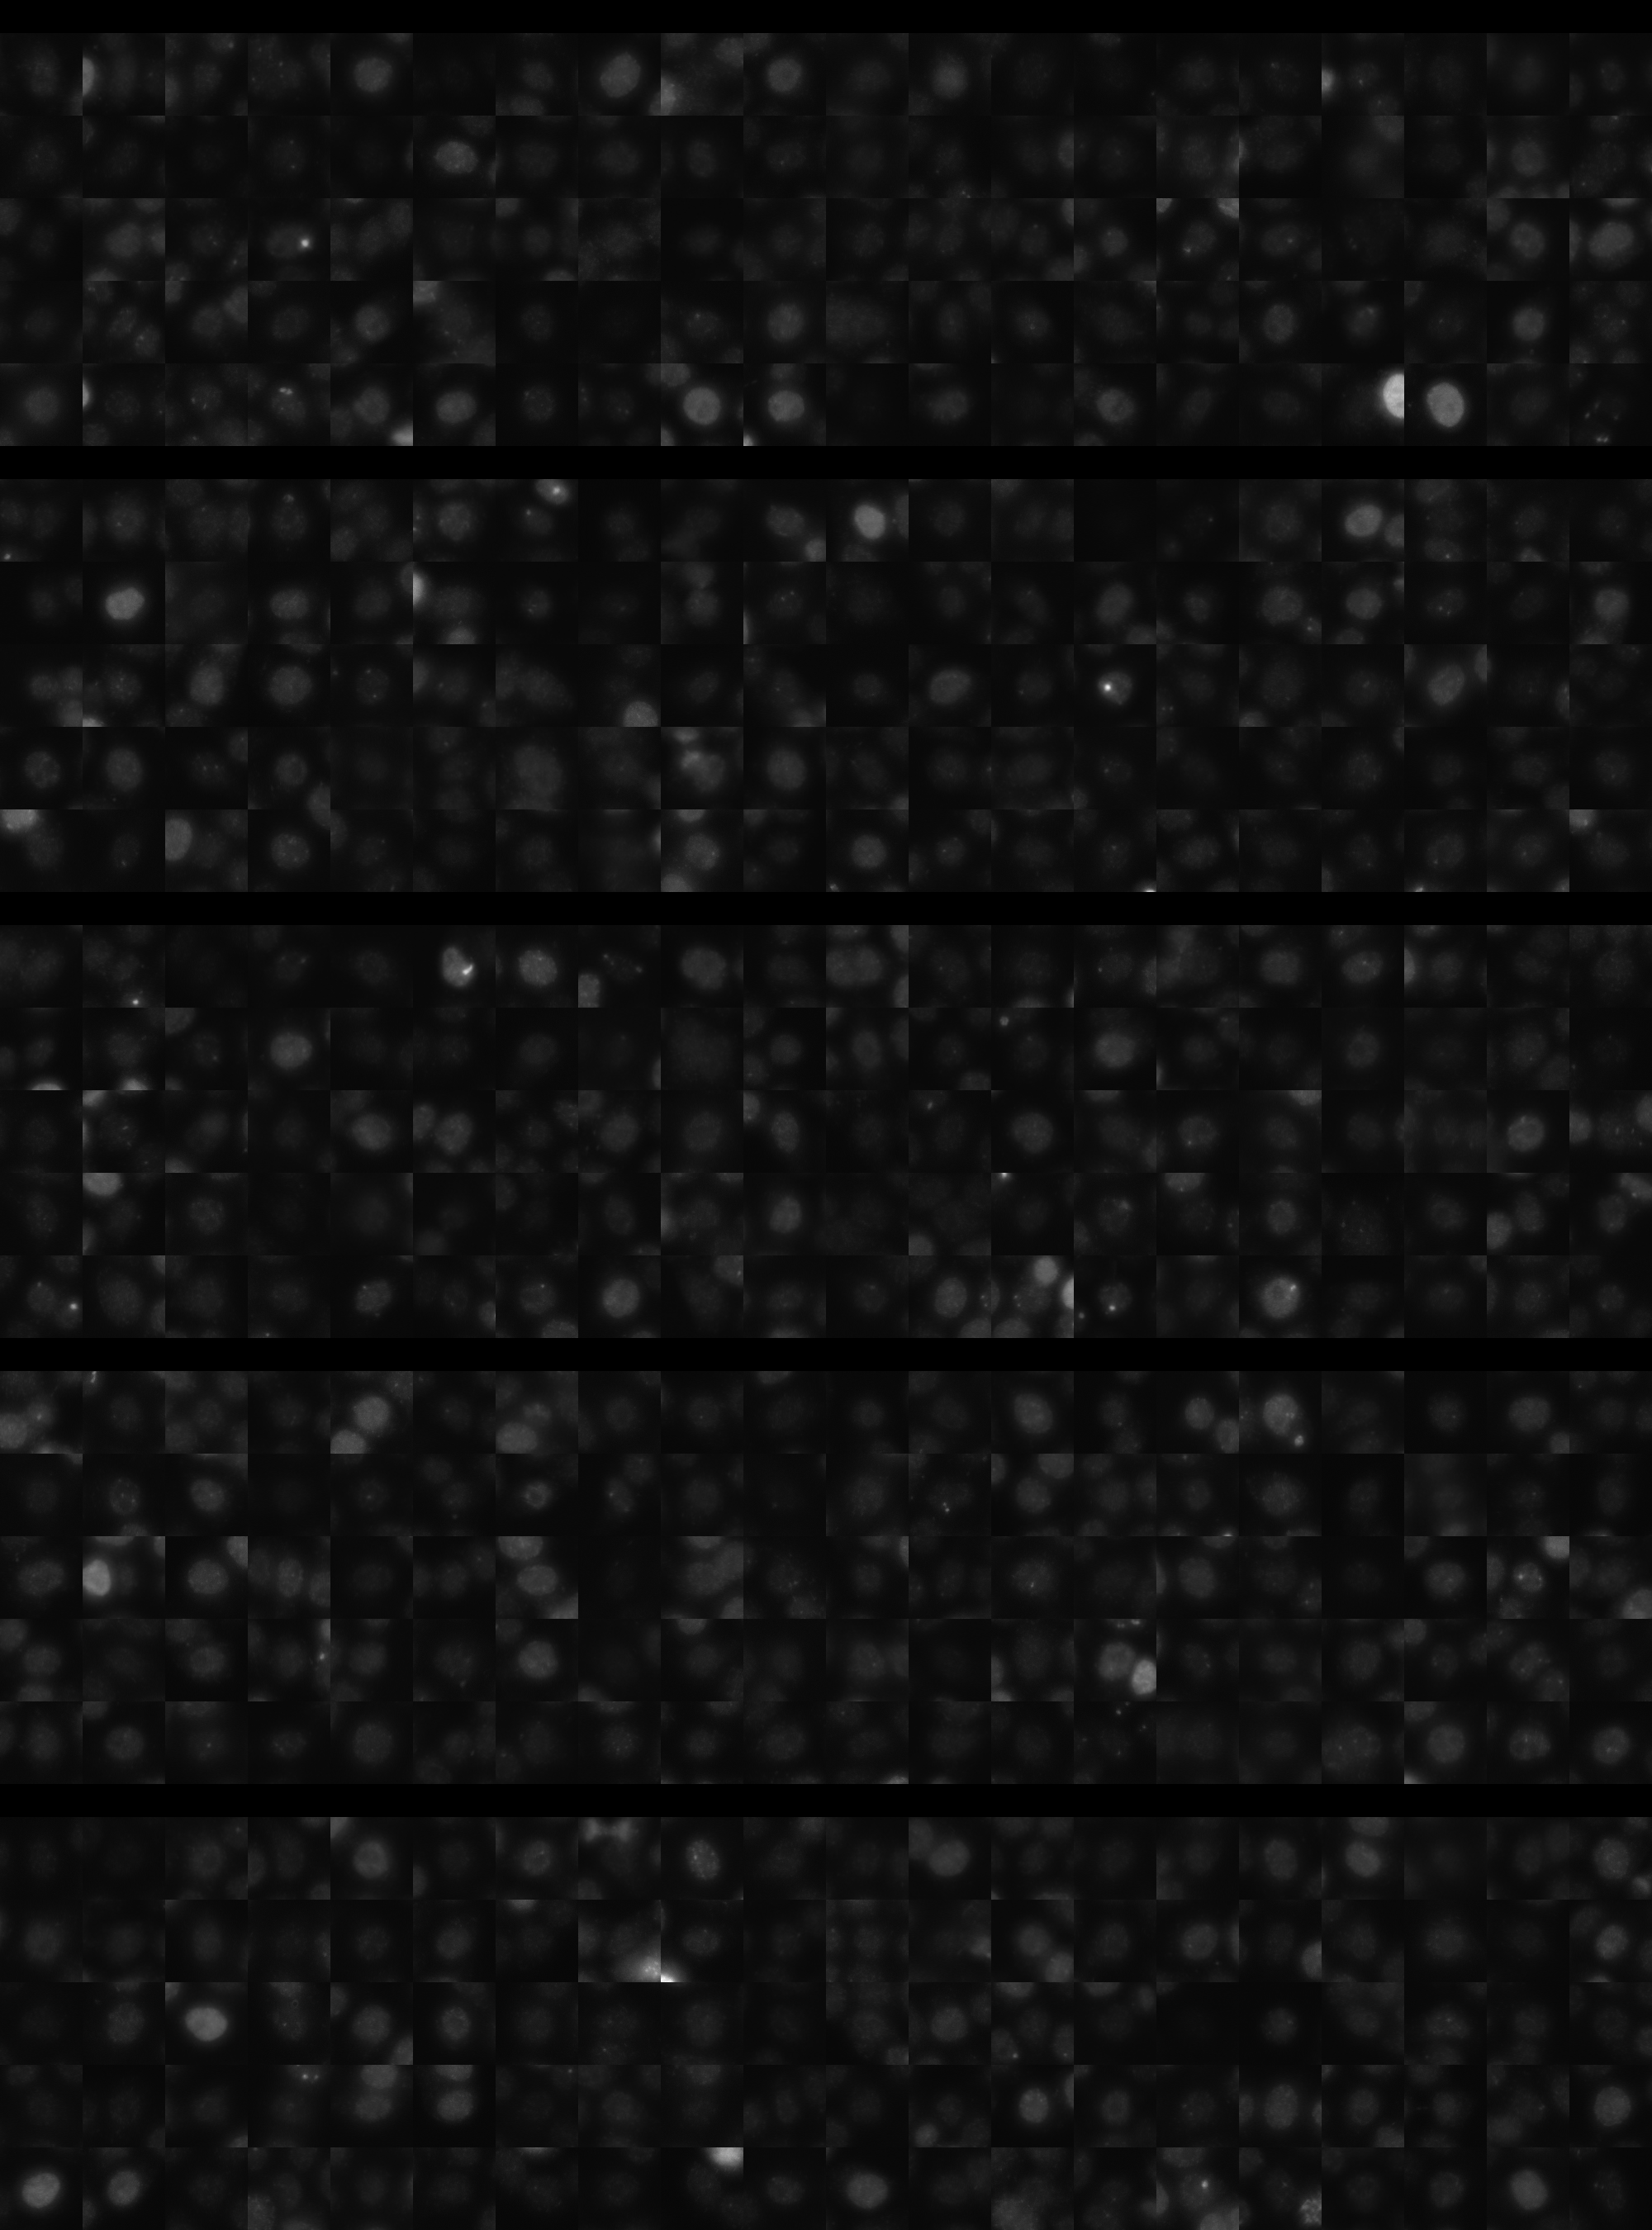
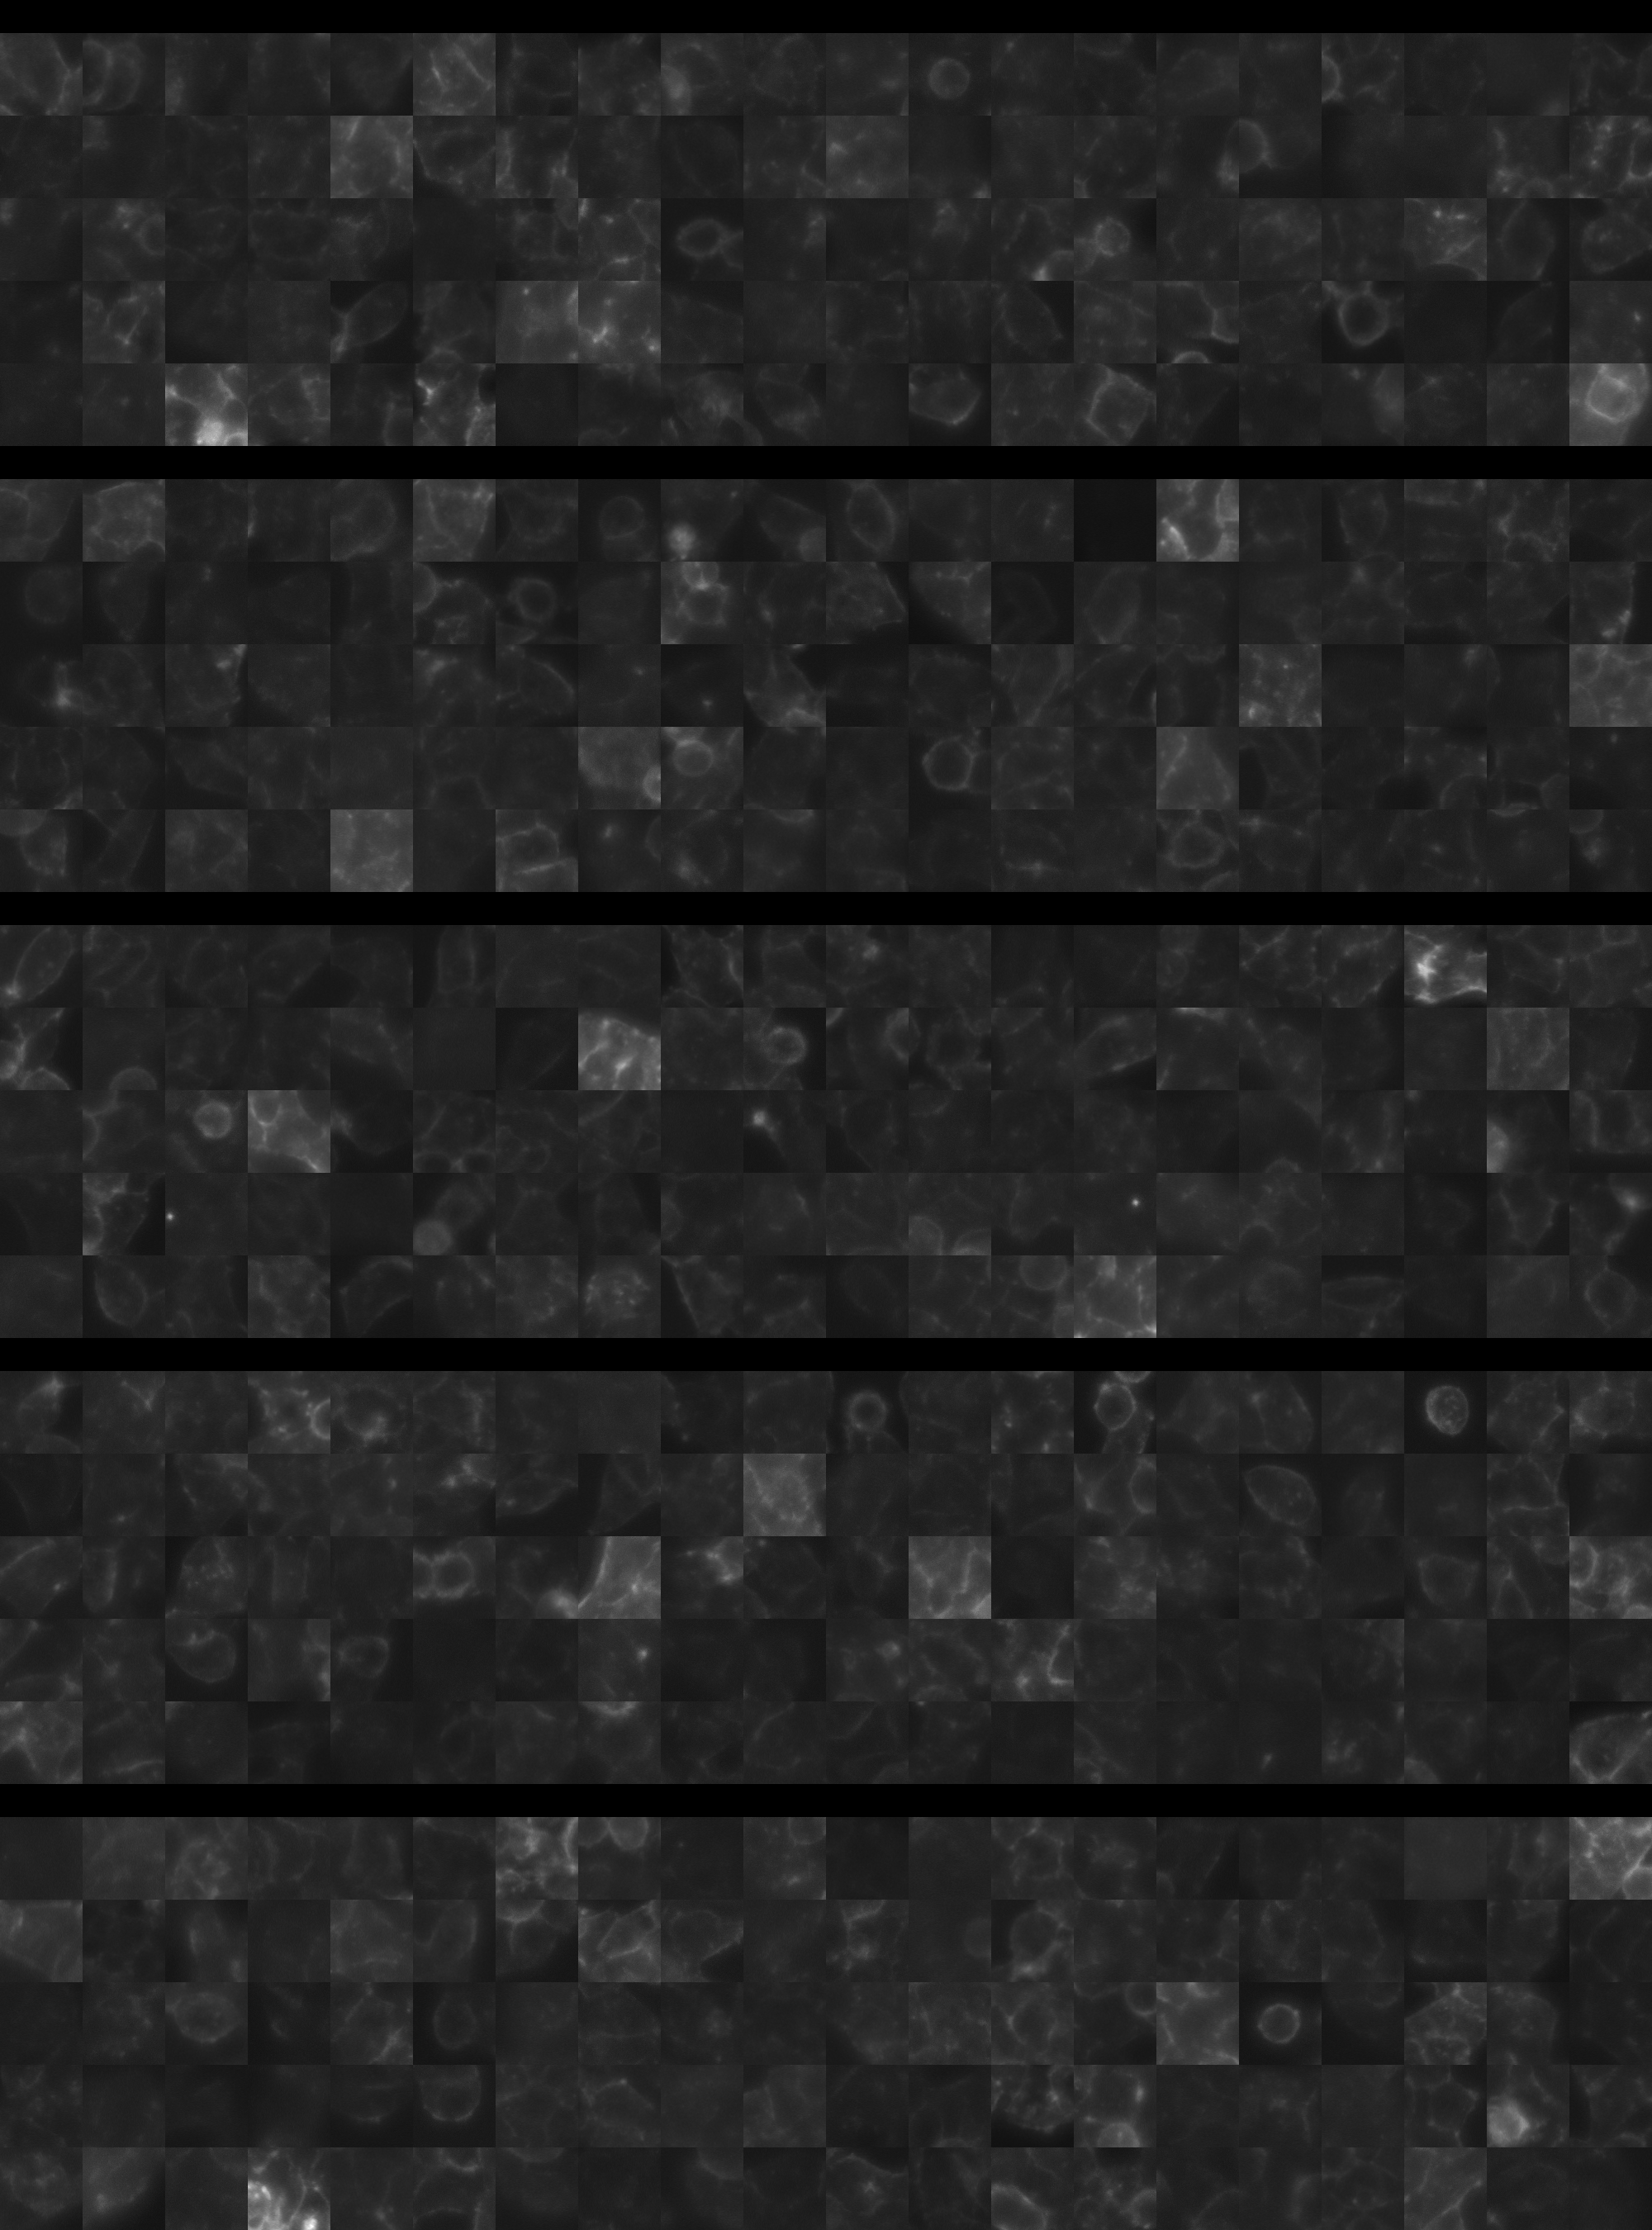
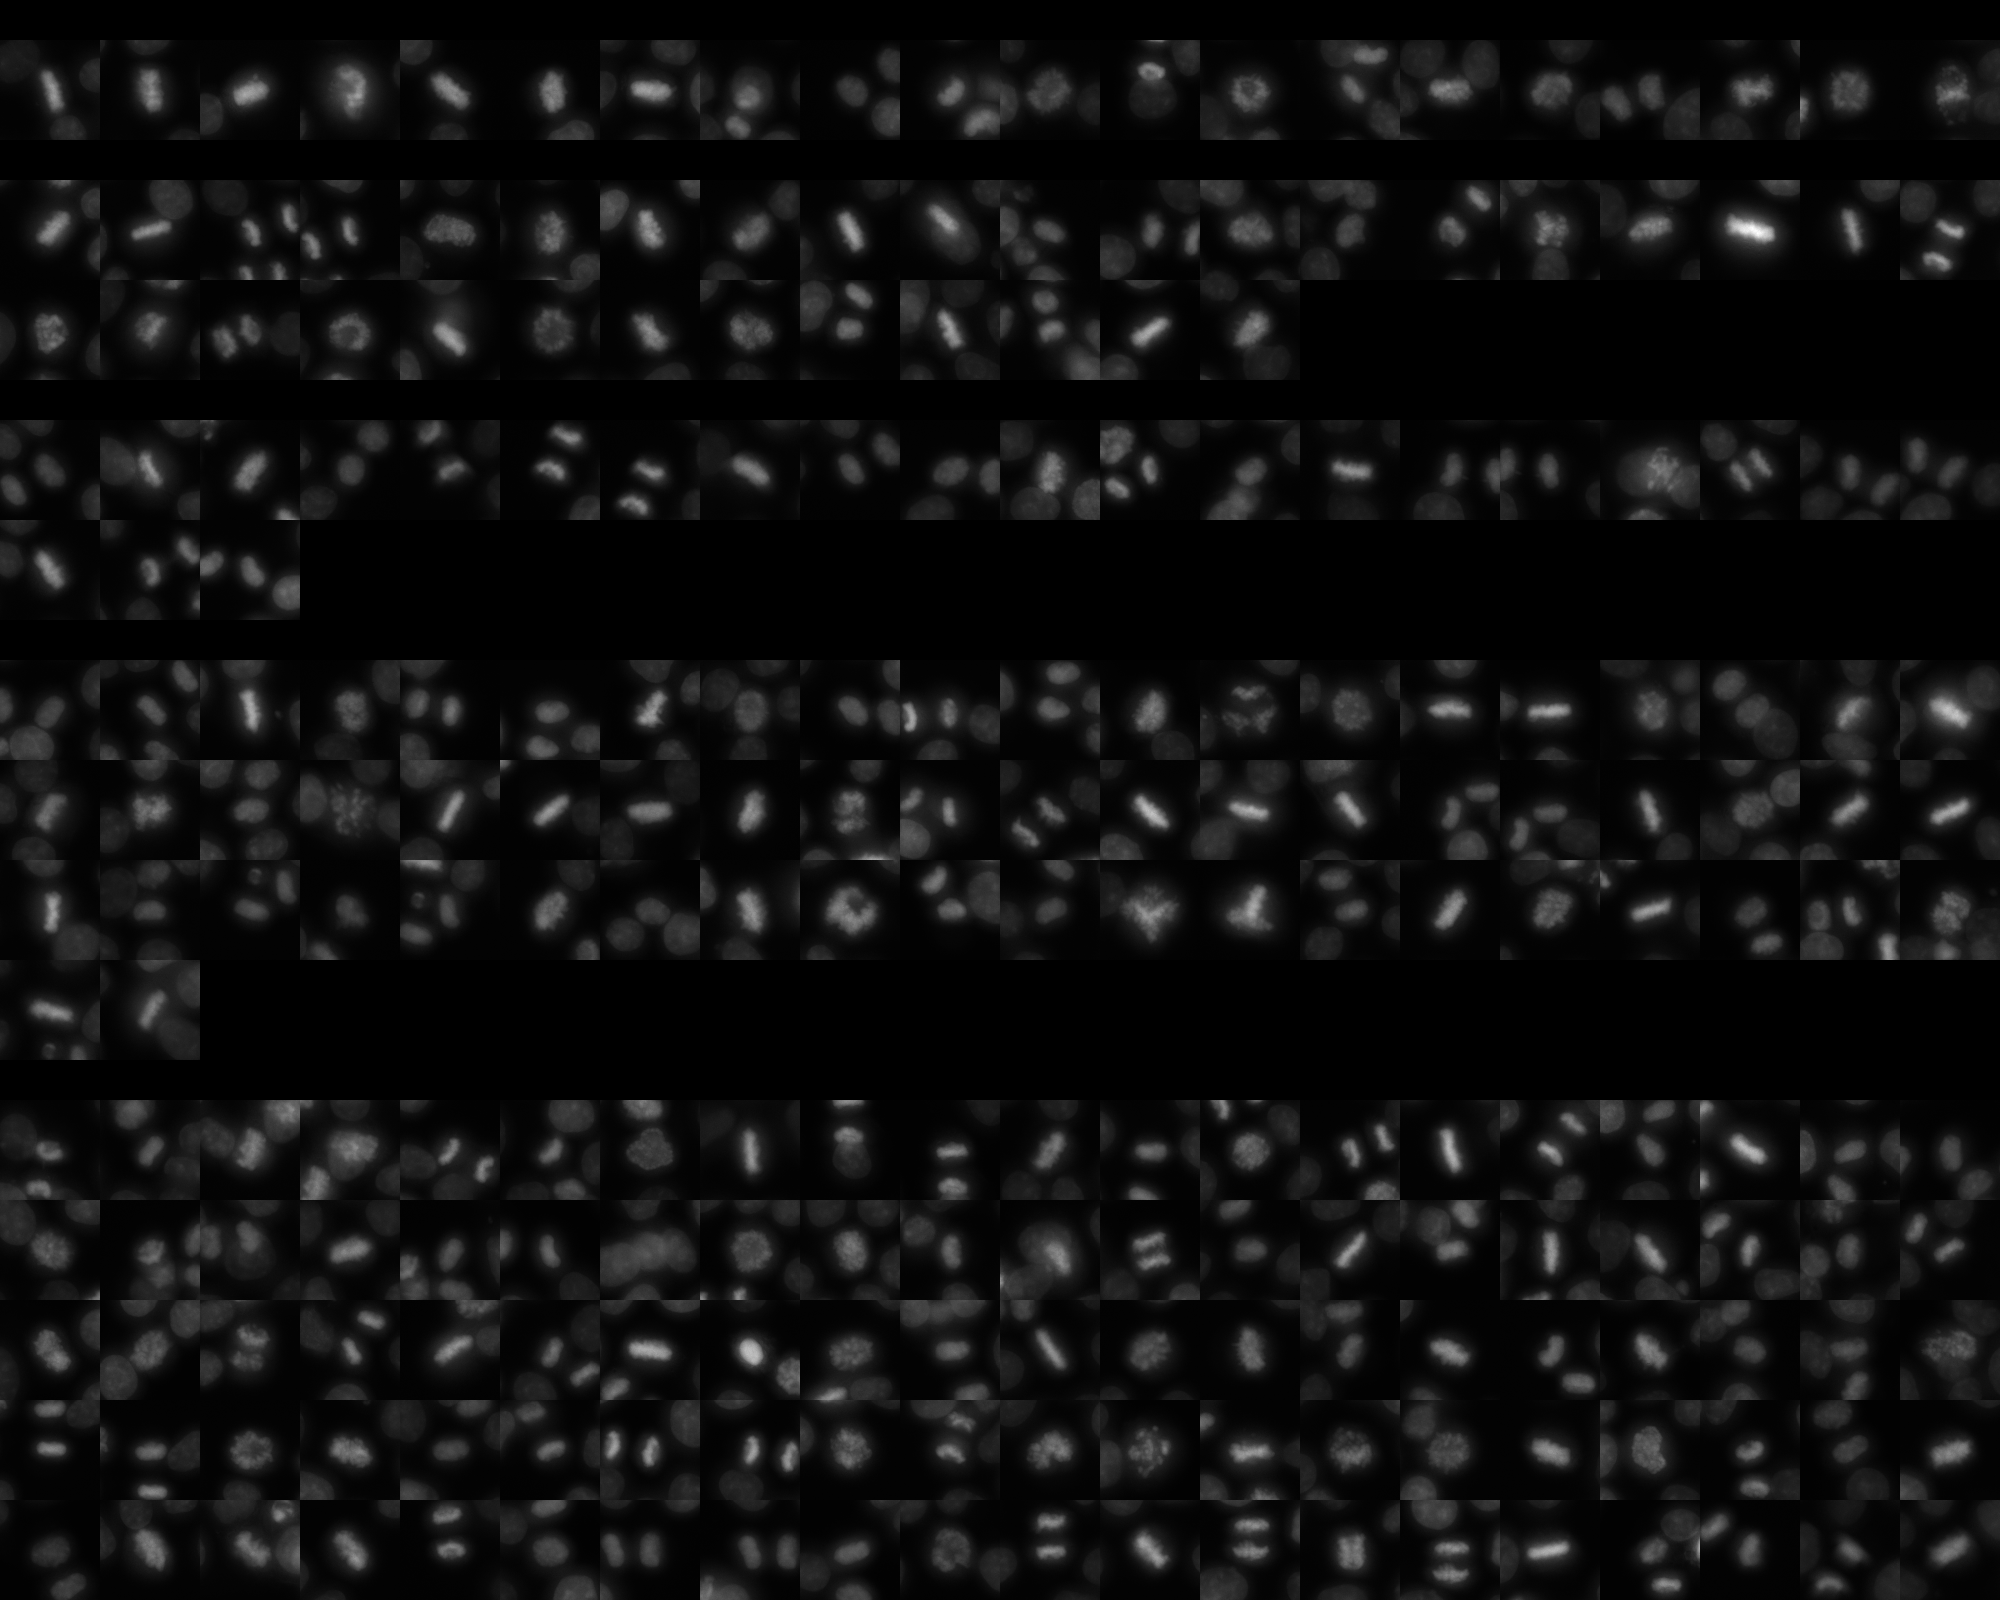
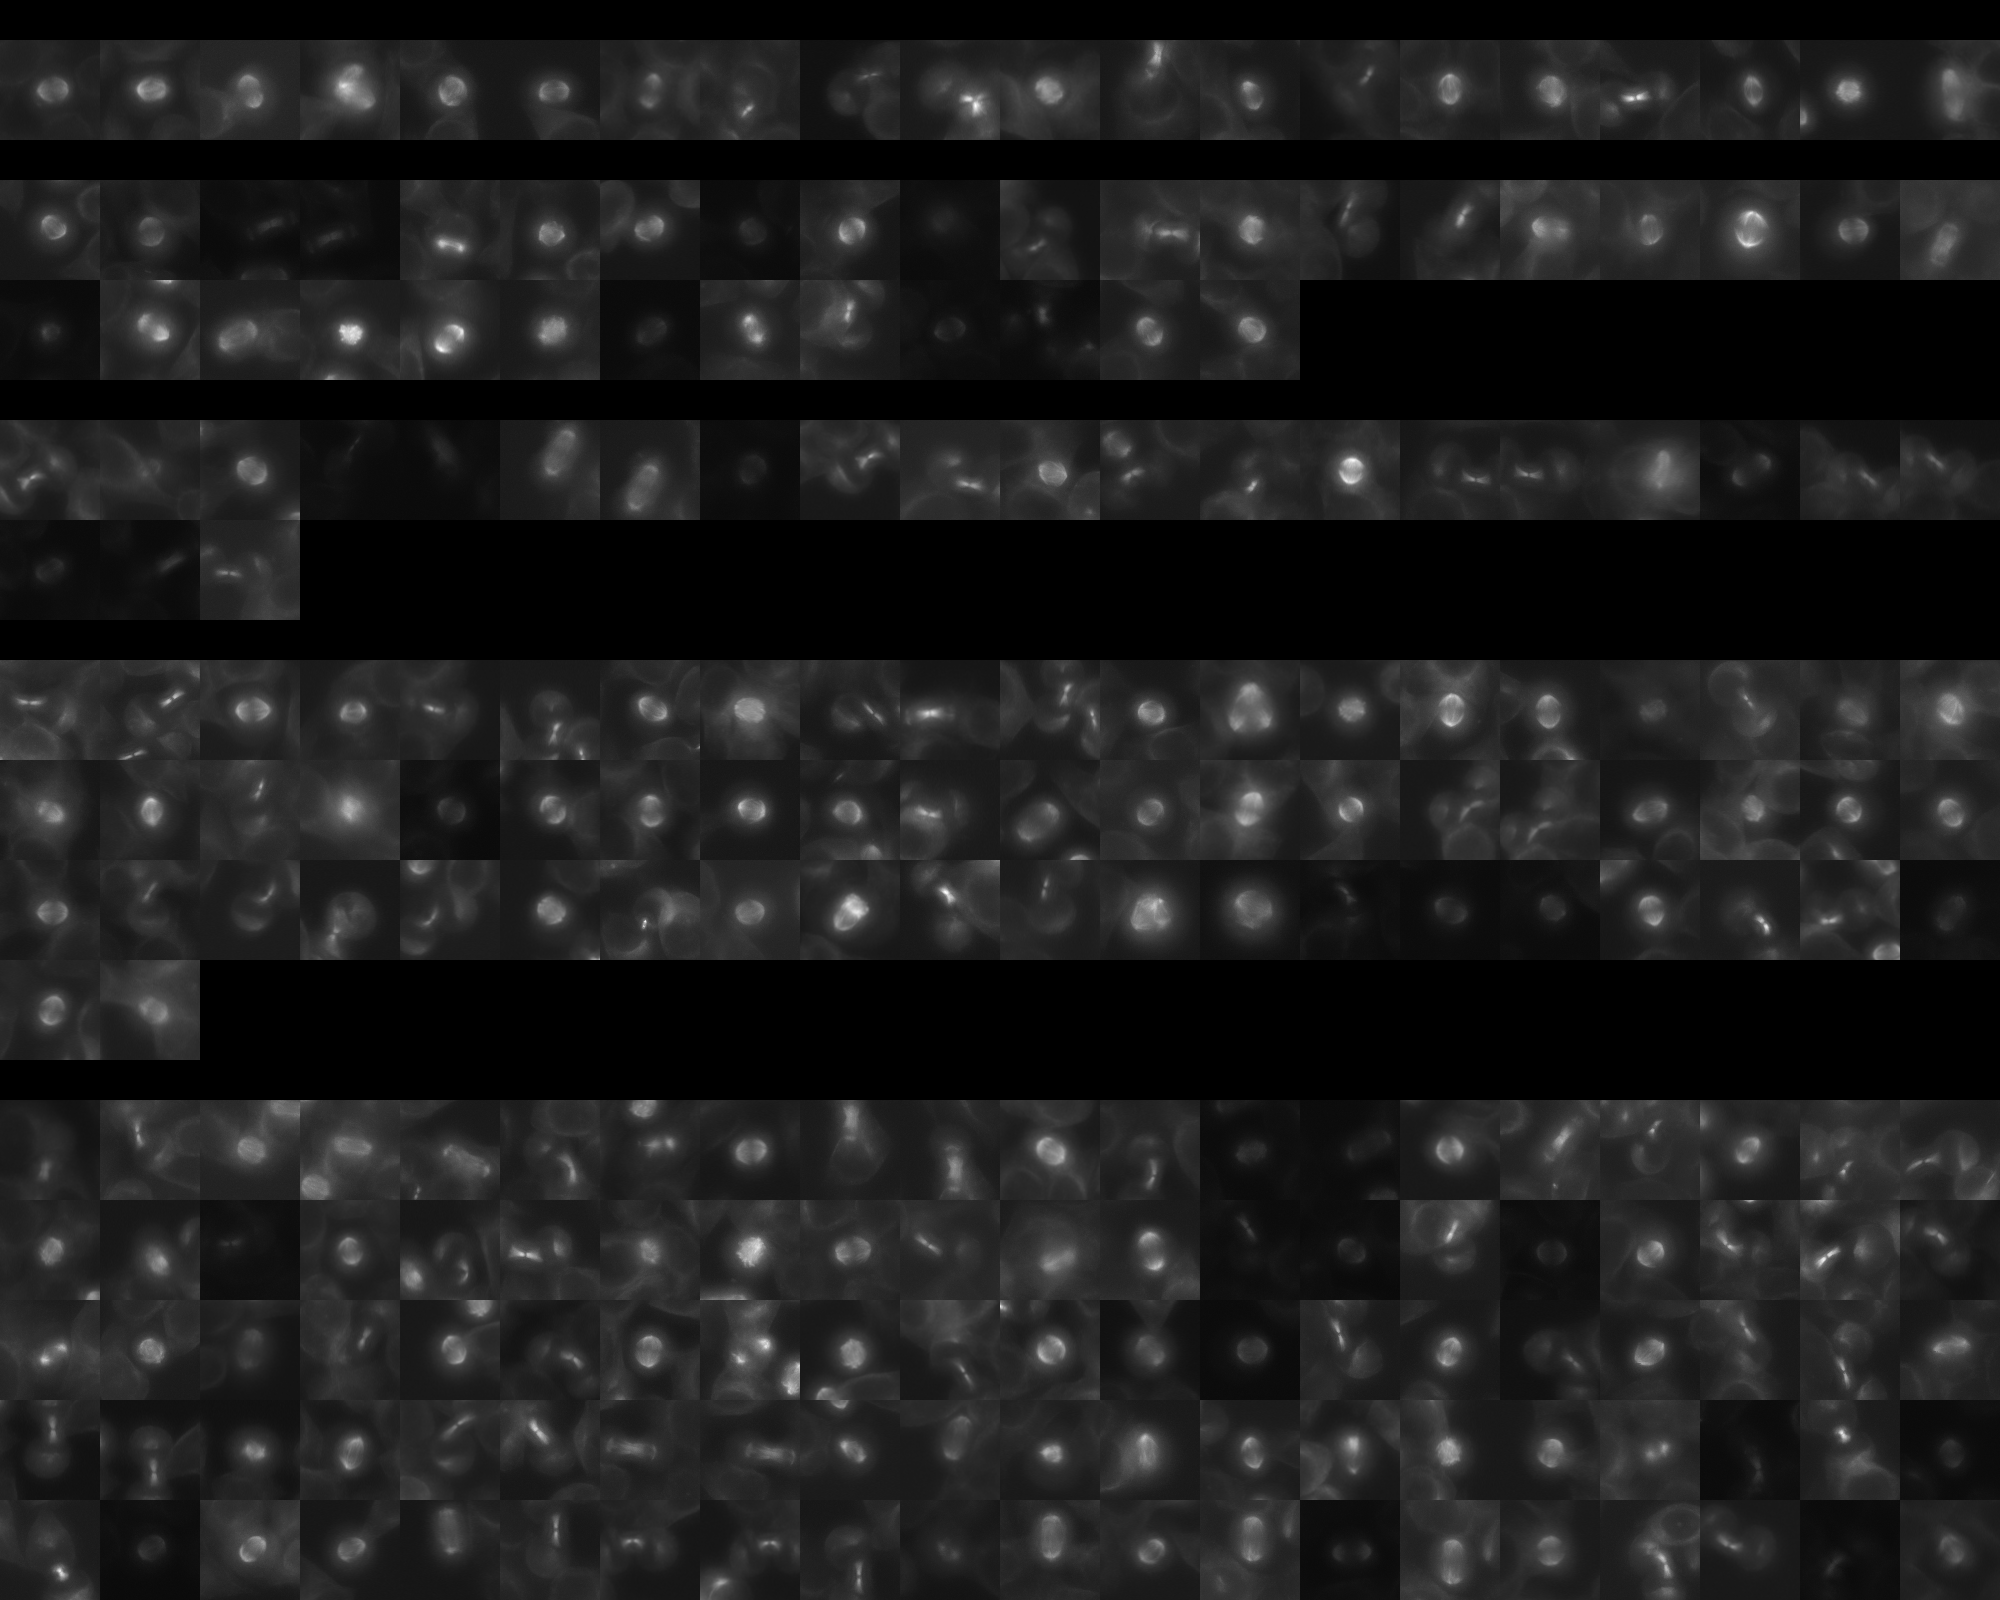
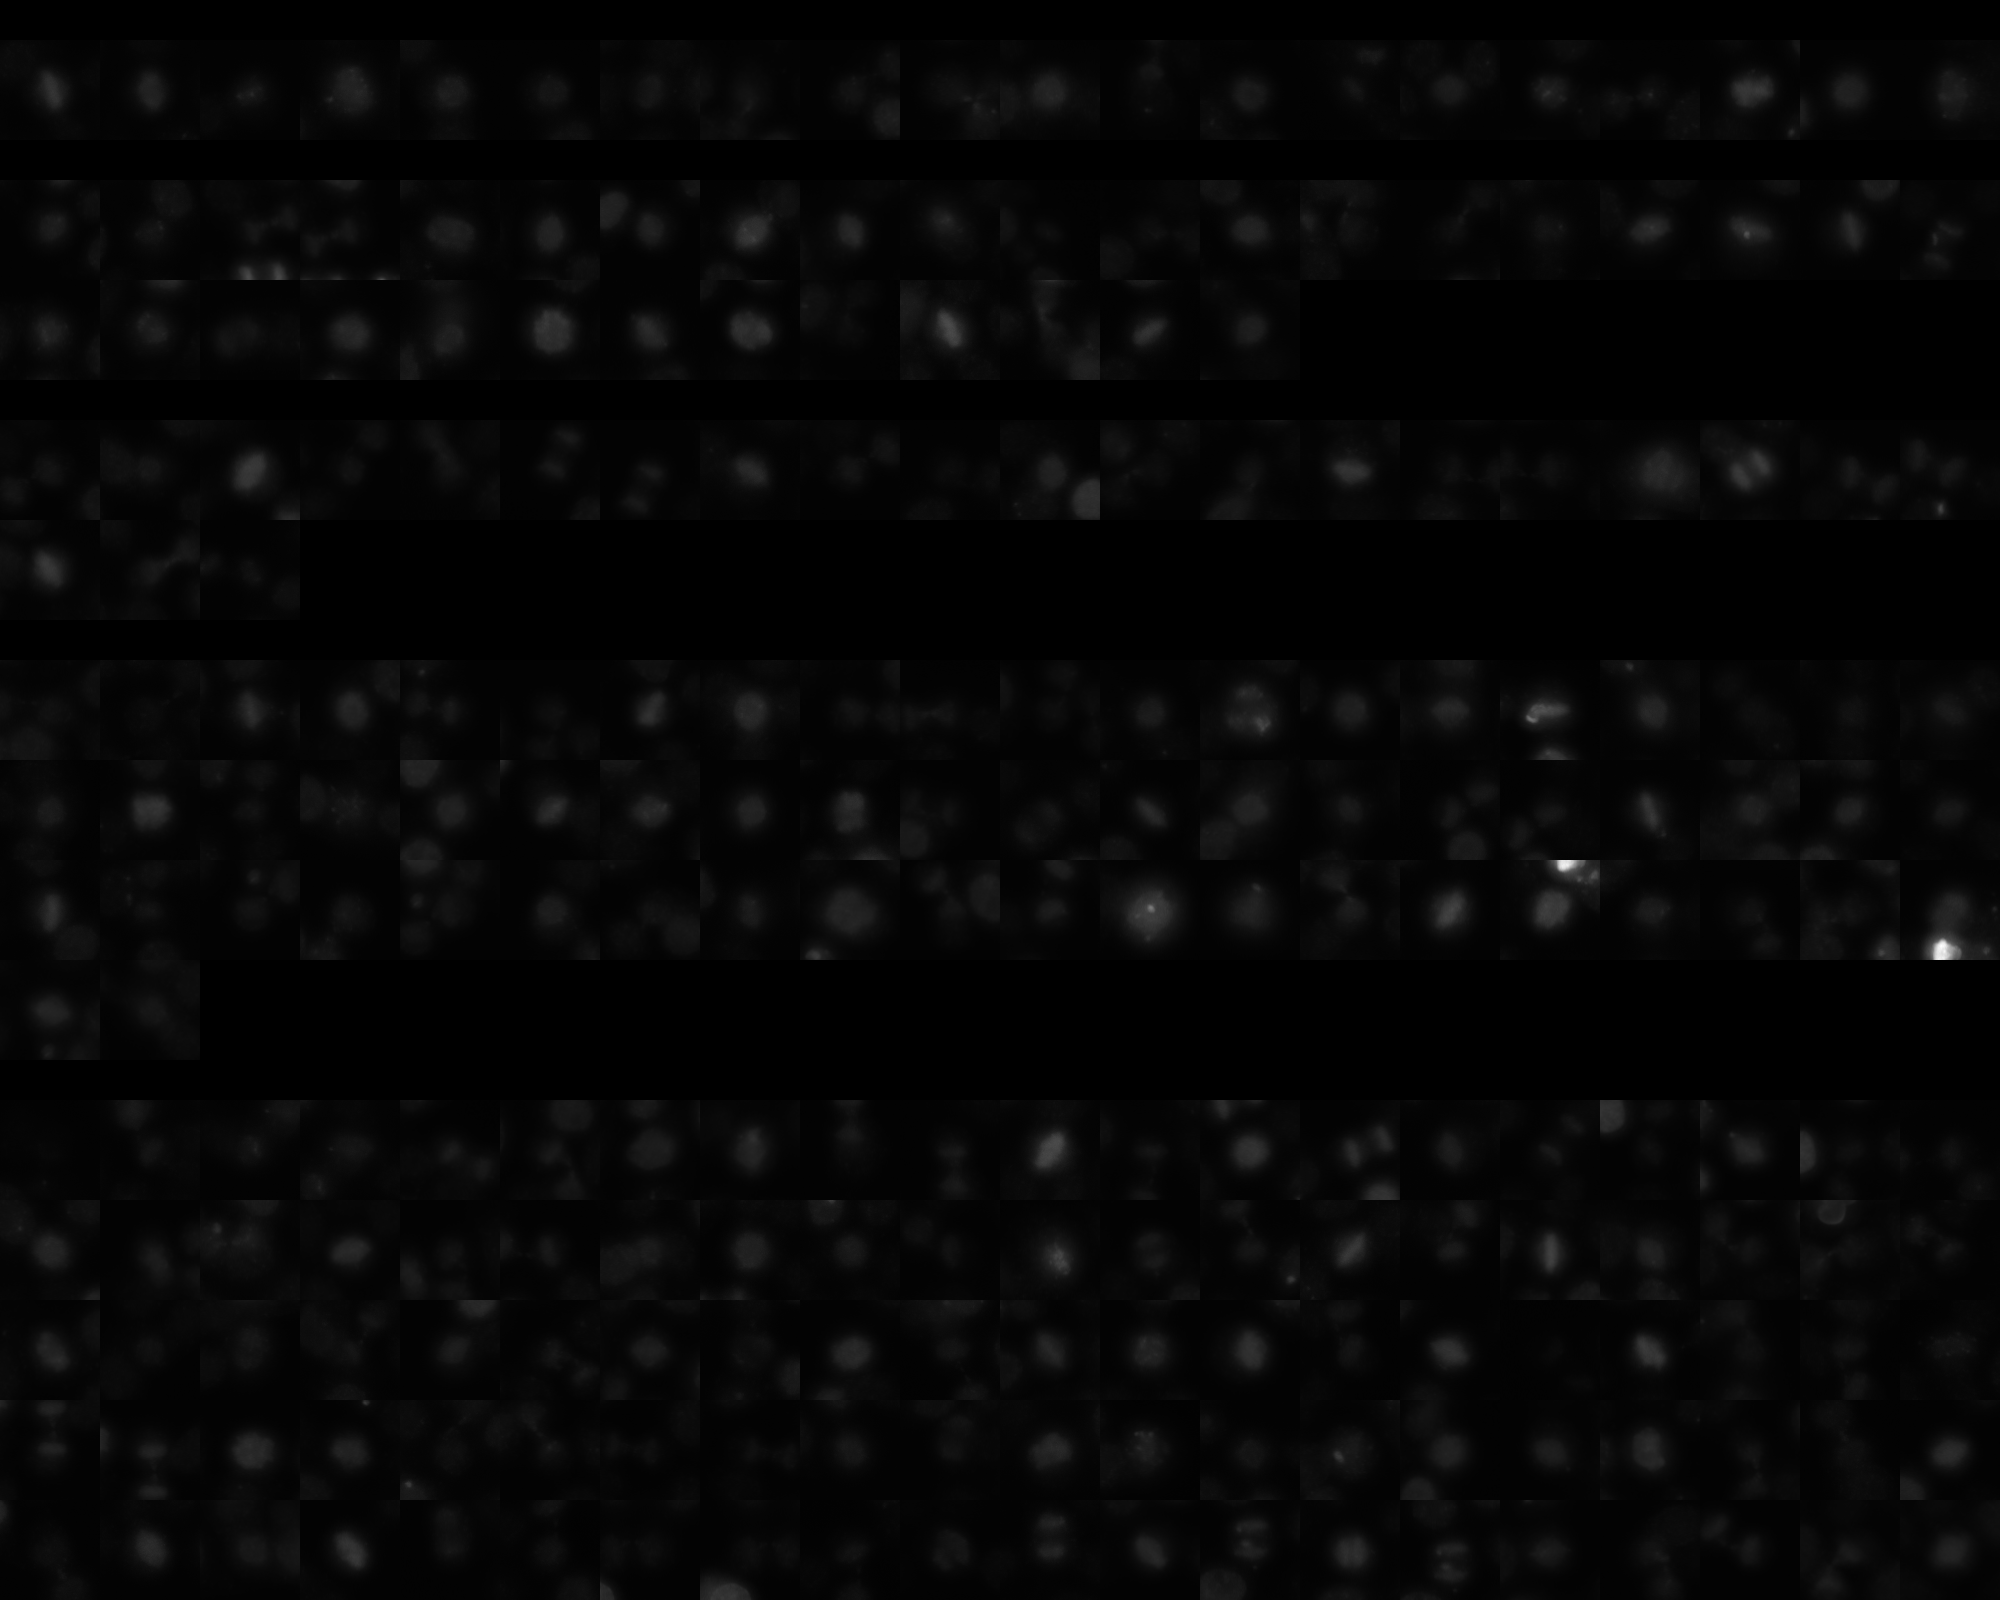
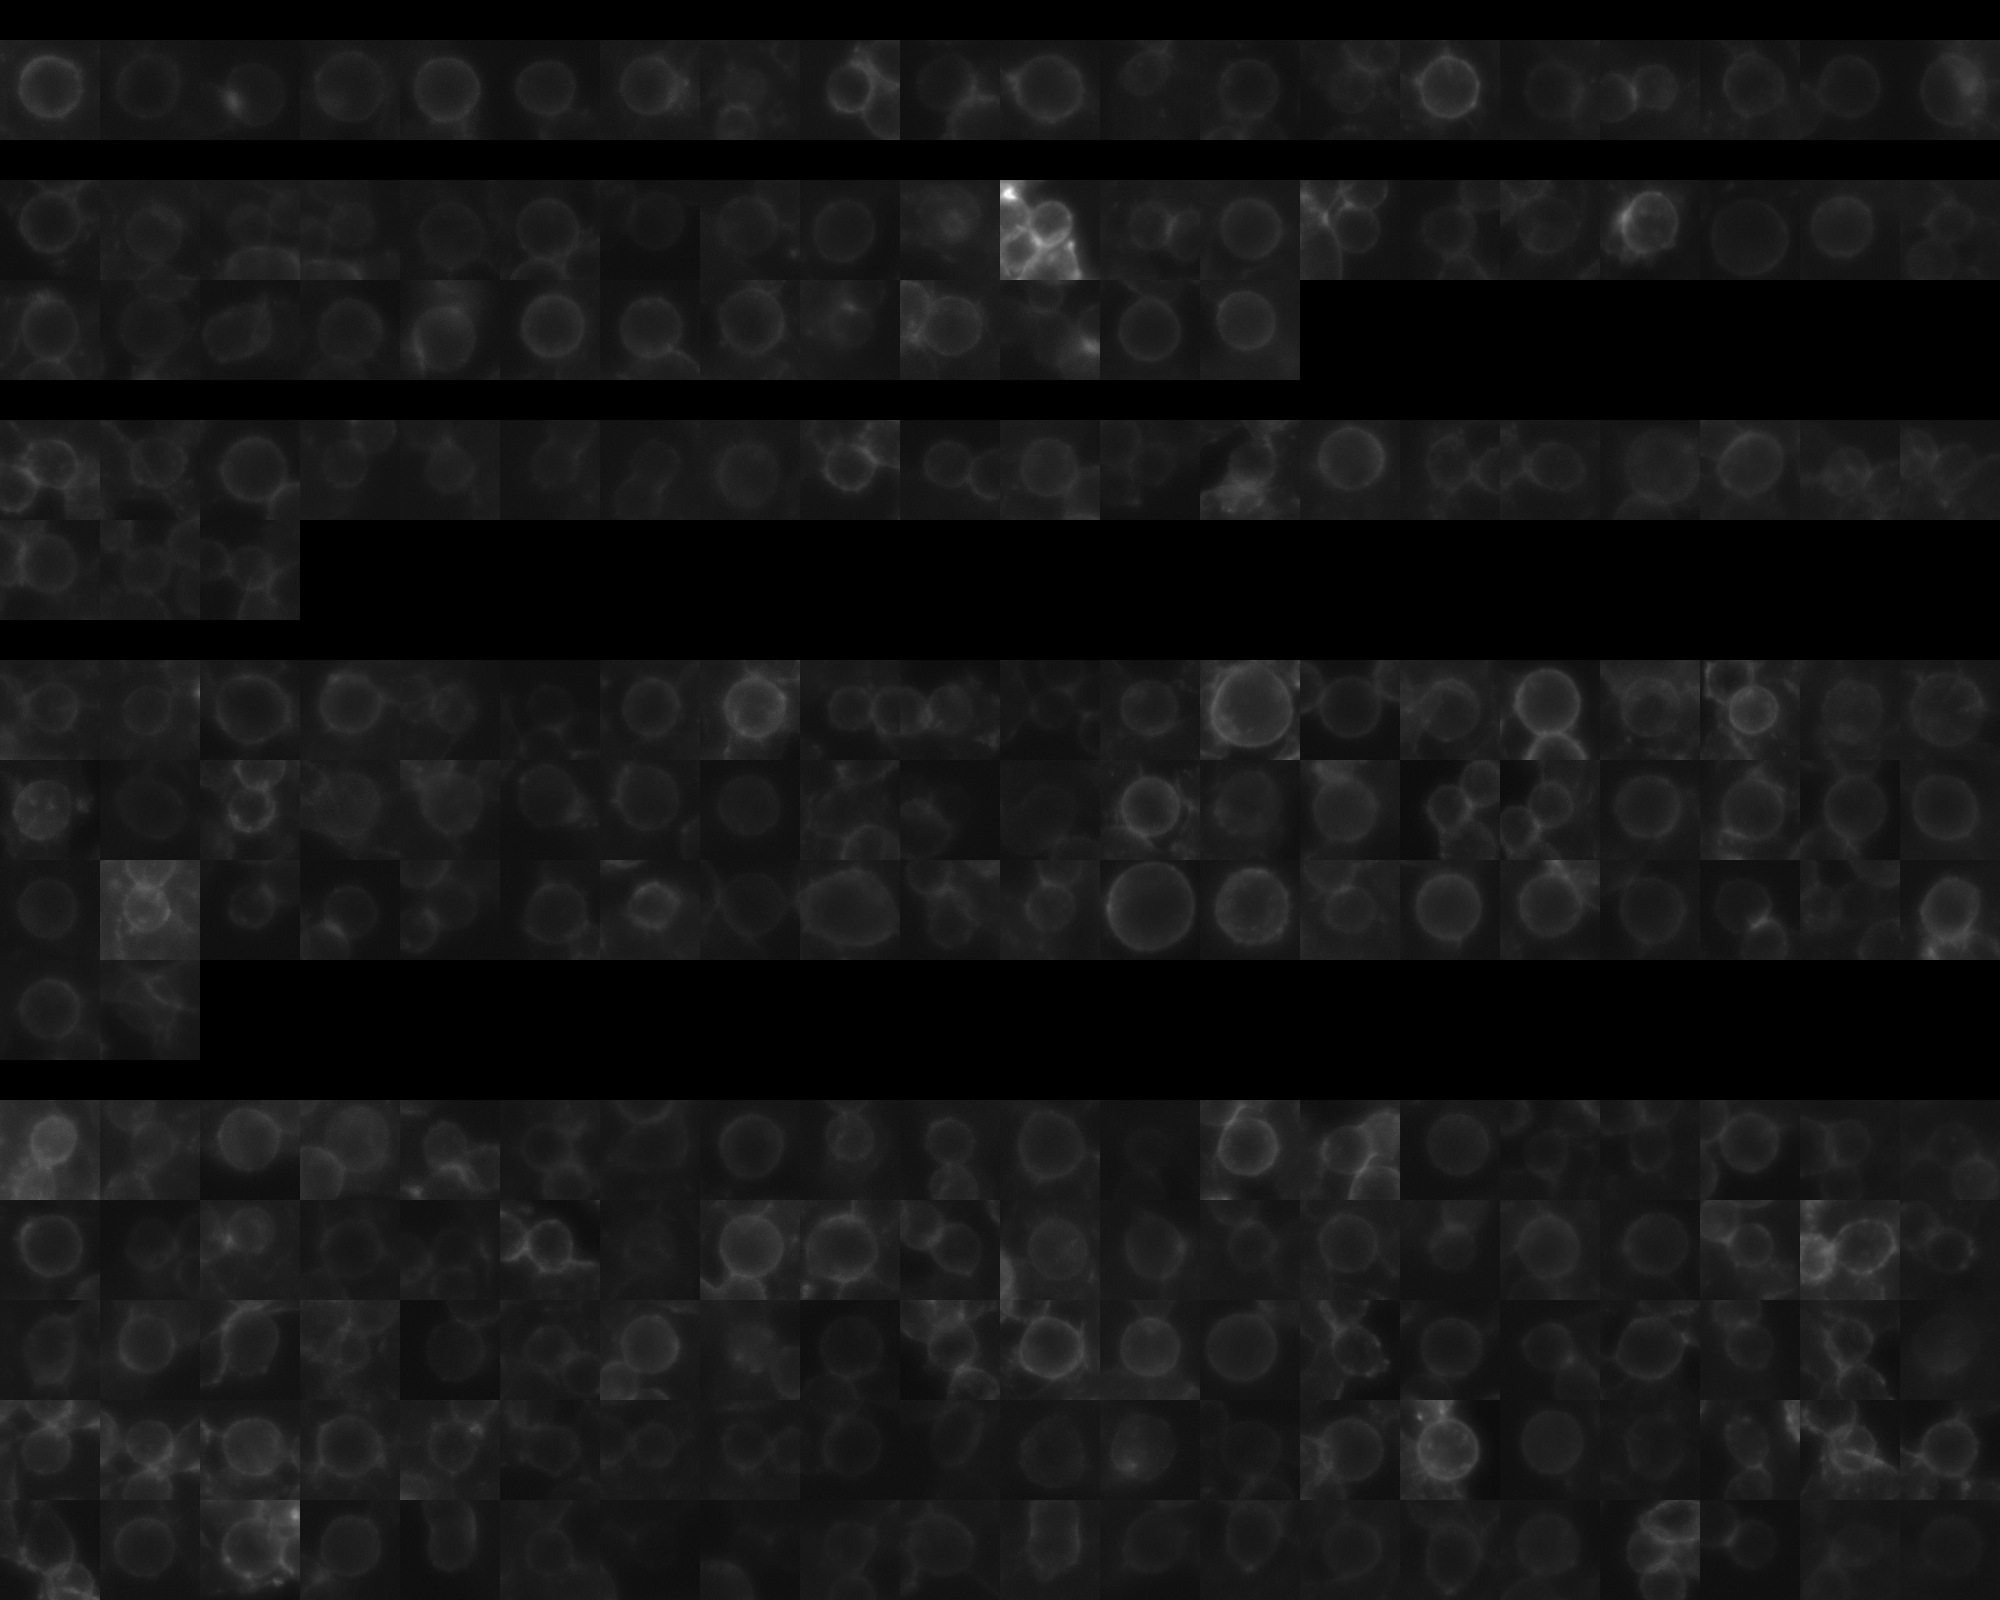
Each montage below shows randomly selected individual cell images for the same target gene separated by sgRNA, along with an example montage of cells expressing a non-targeting negative control sgRNA at the bottom. sgRNA labels in the montages correspond to the numbered sgRNA sequences in the gene info table above. The DNA (blue) and tubulin (green) channels are displayed by default, with gH2AX (grayscale) and actin (yellow) available using the check boxes. Channel brightness, contrast, and opacity are adjustable by clicking the arrow next to the channel name. When only one channel is selected, the display defaults to grayscale. Click the “Zoom” checkbox above the channel controls to enable image zooming (via scrolling) and panning (via click-and-drag).

The cell boxes displayed for this gene are square, 30.36 μm per side for the interphase montage and 30.36 μm per side for the mitotic montage.
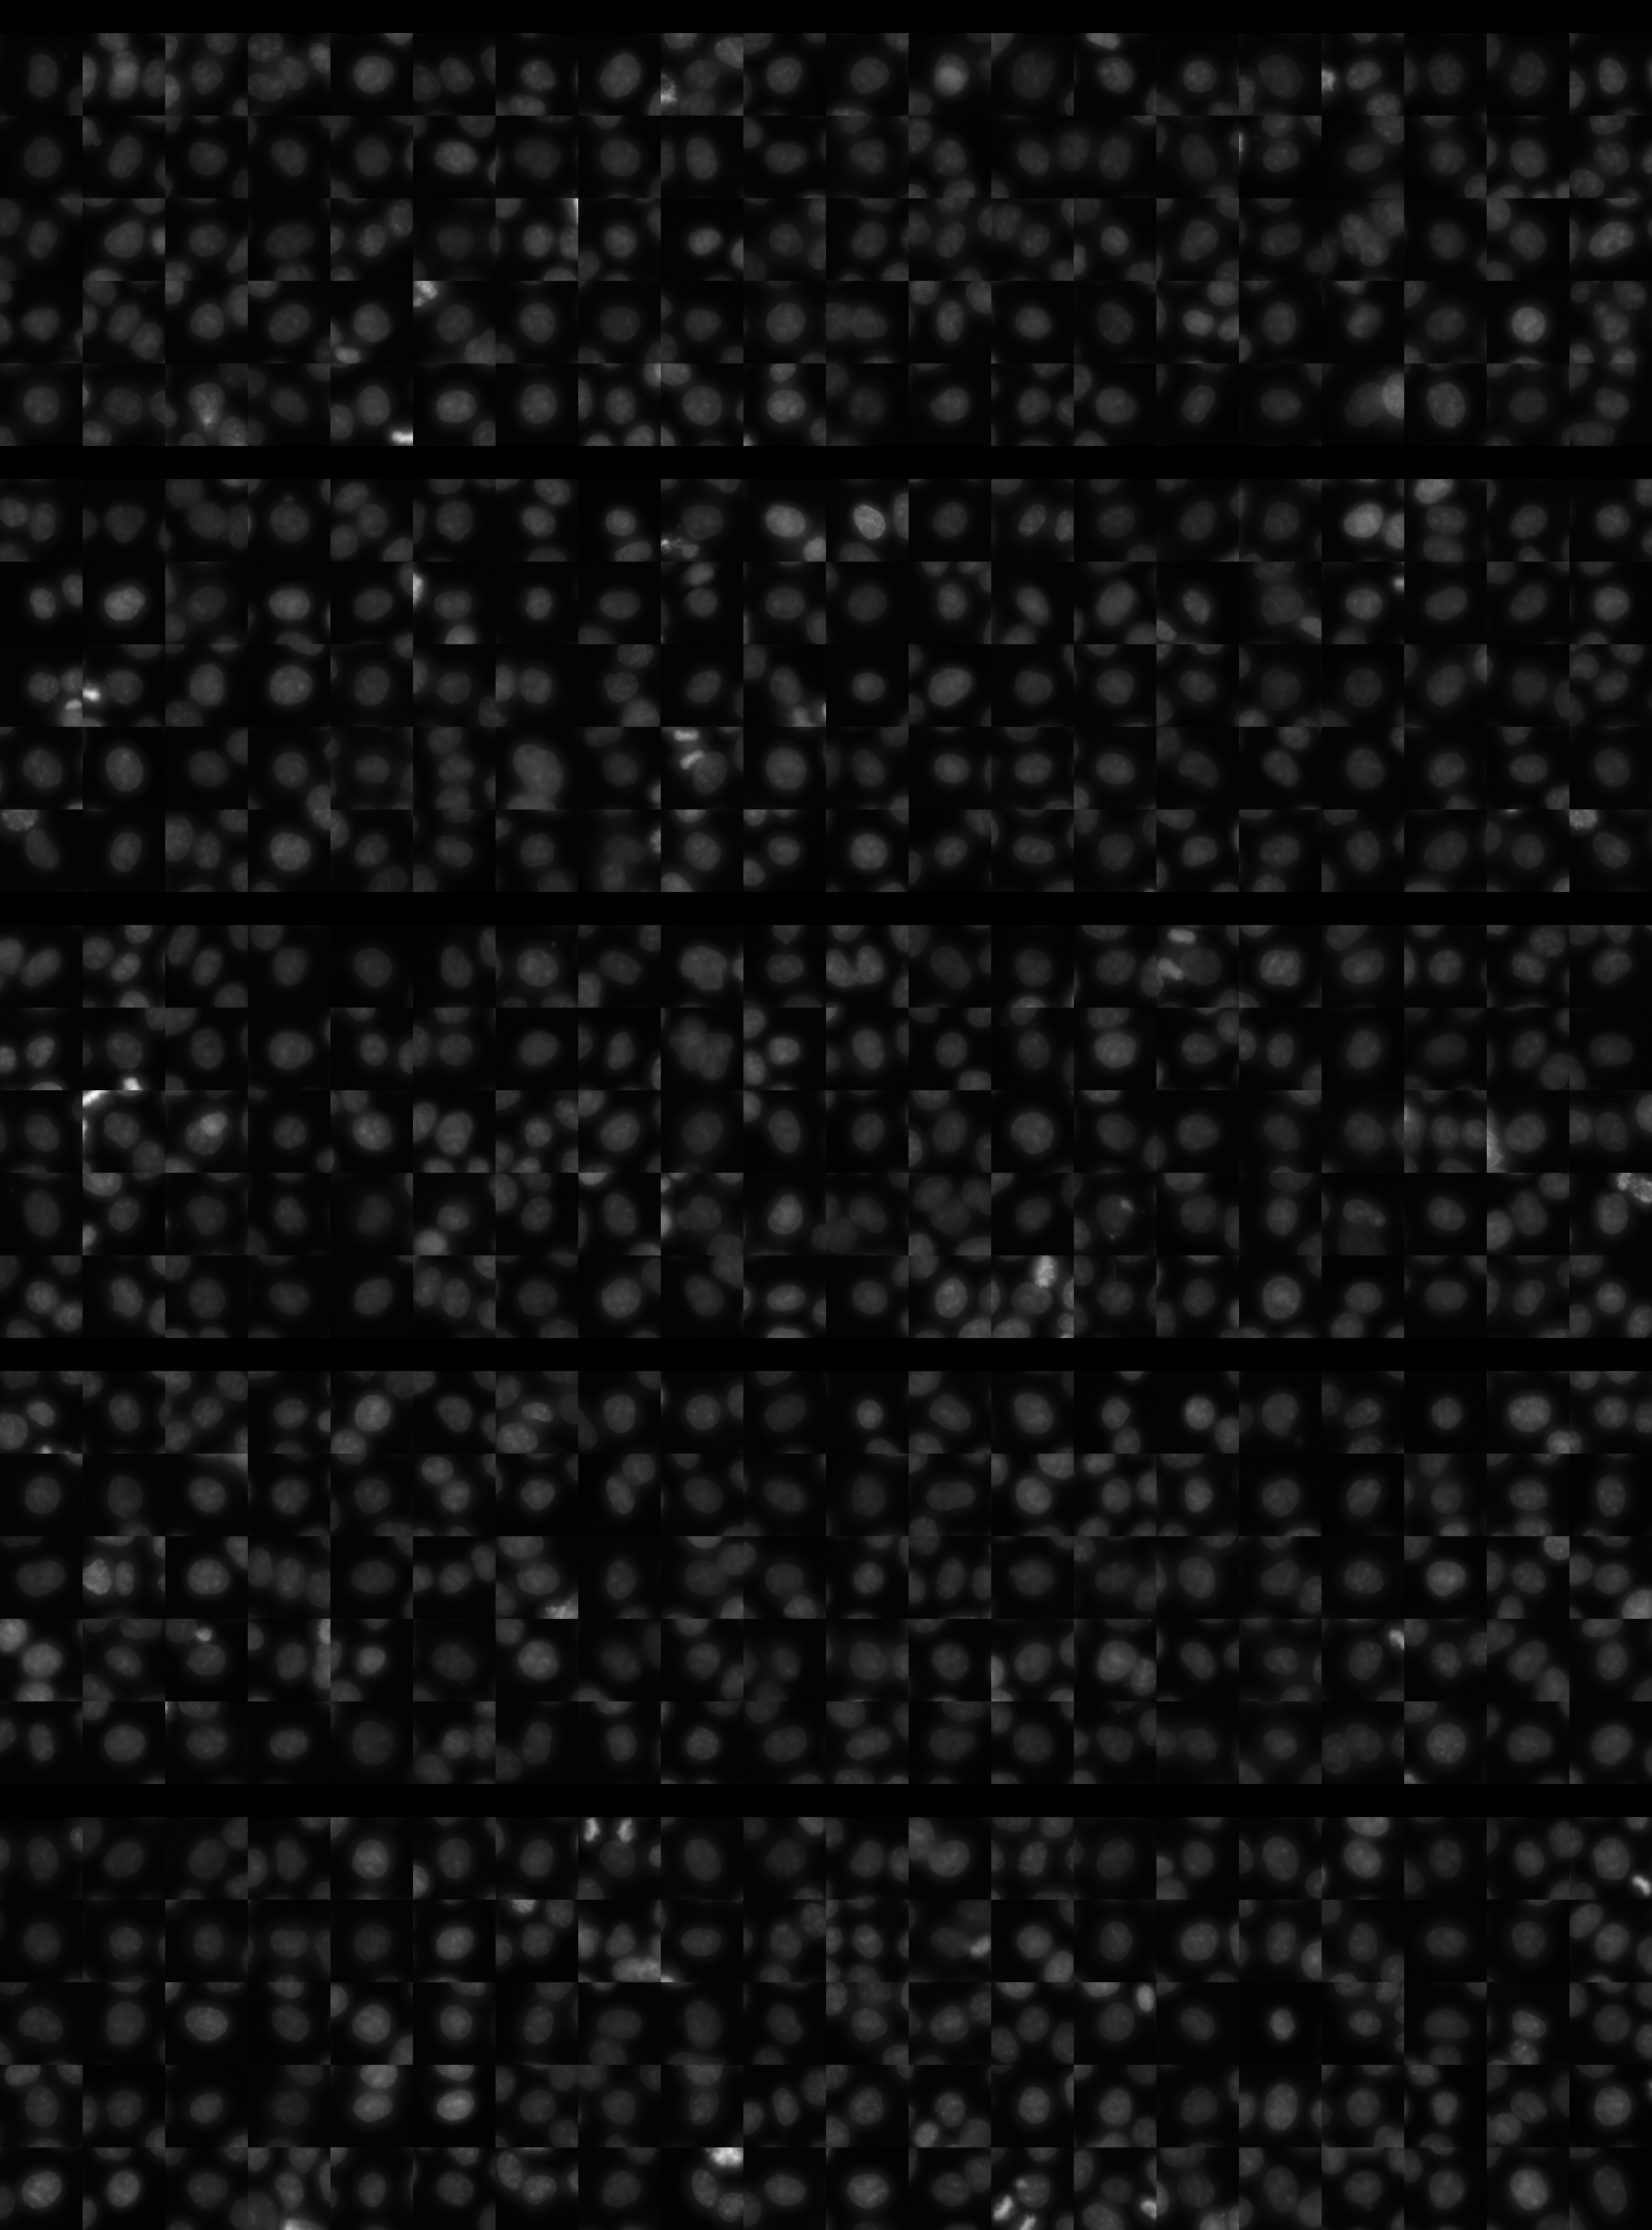
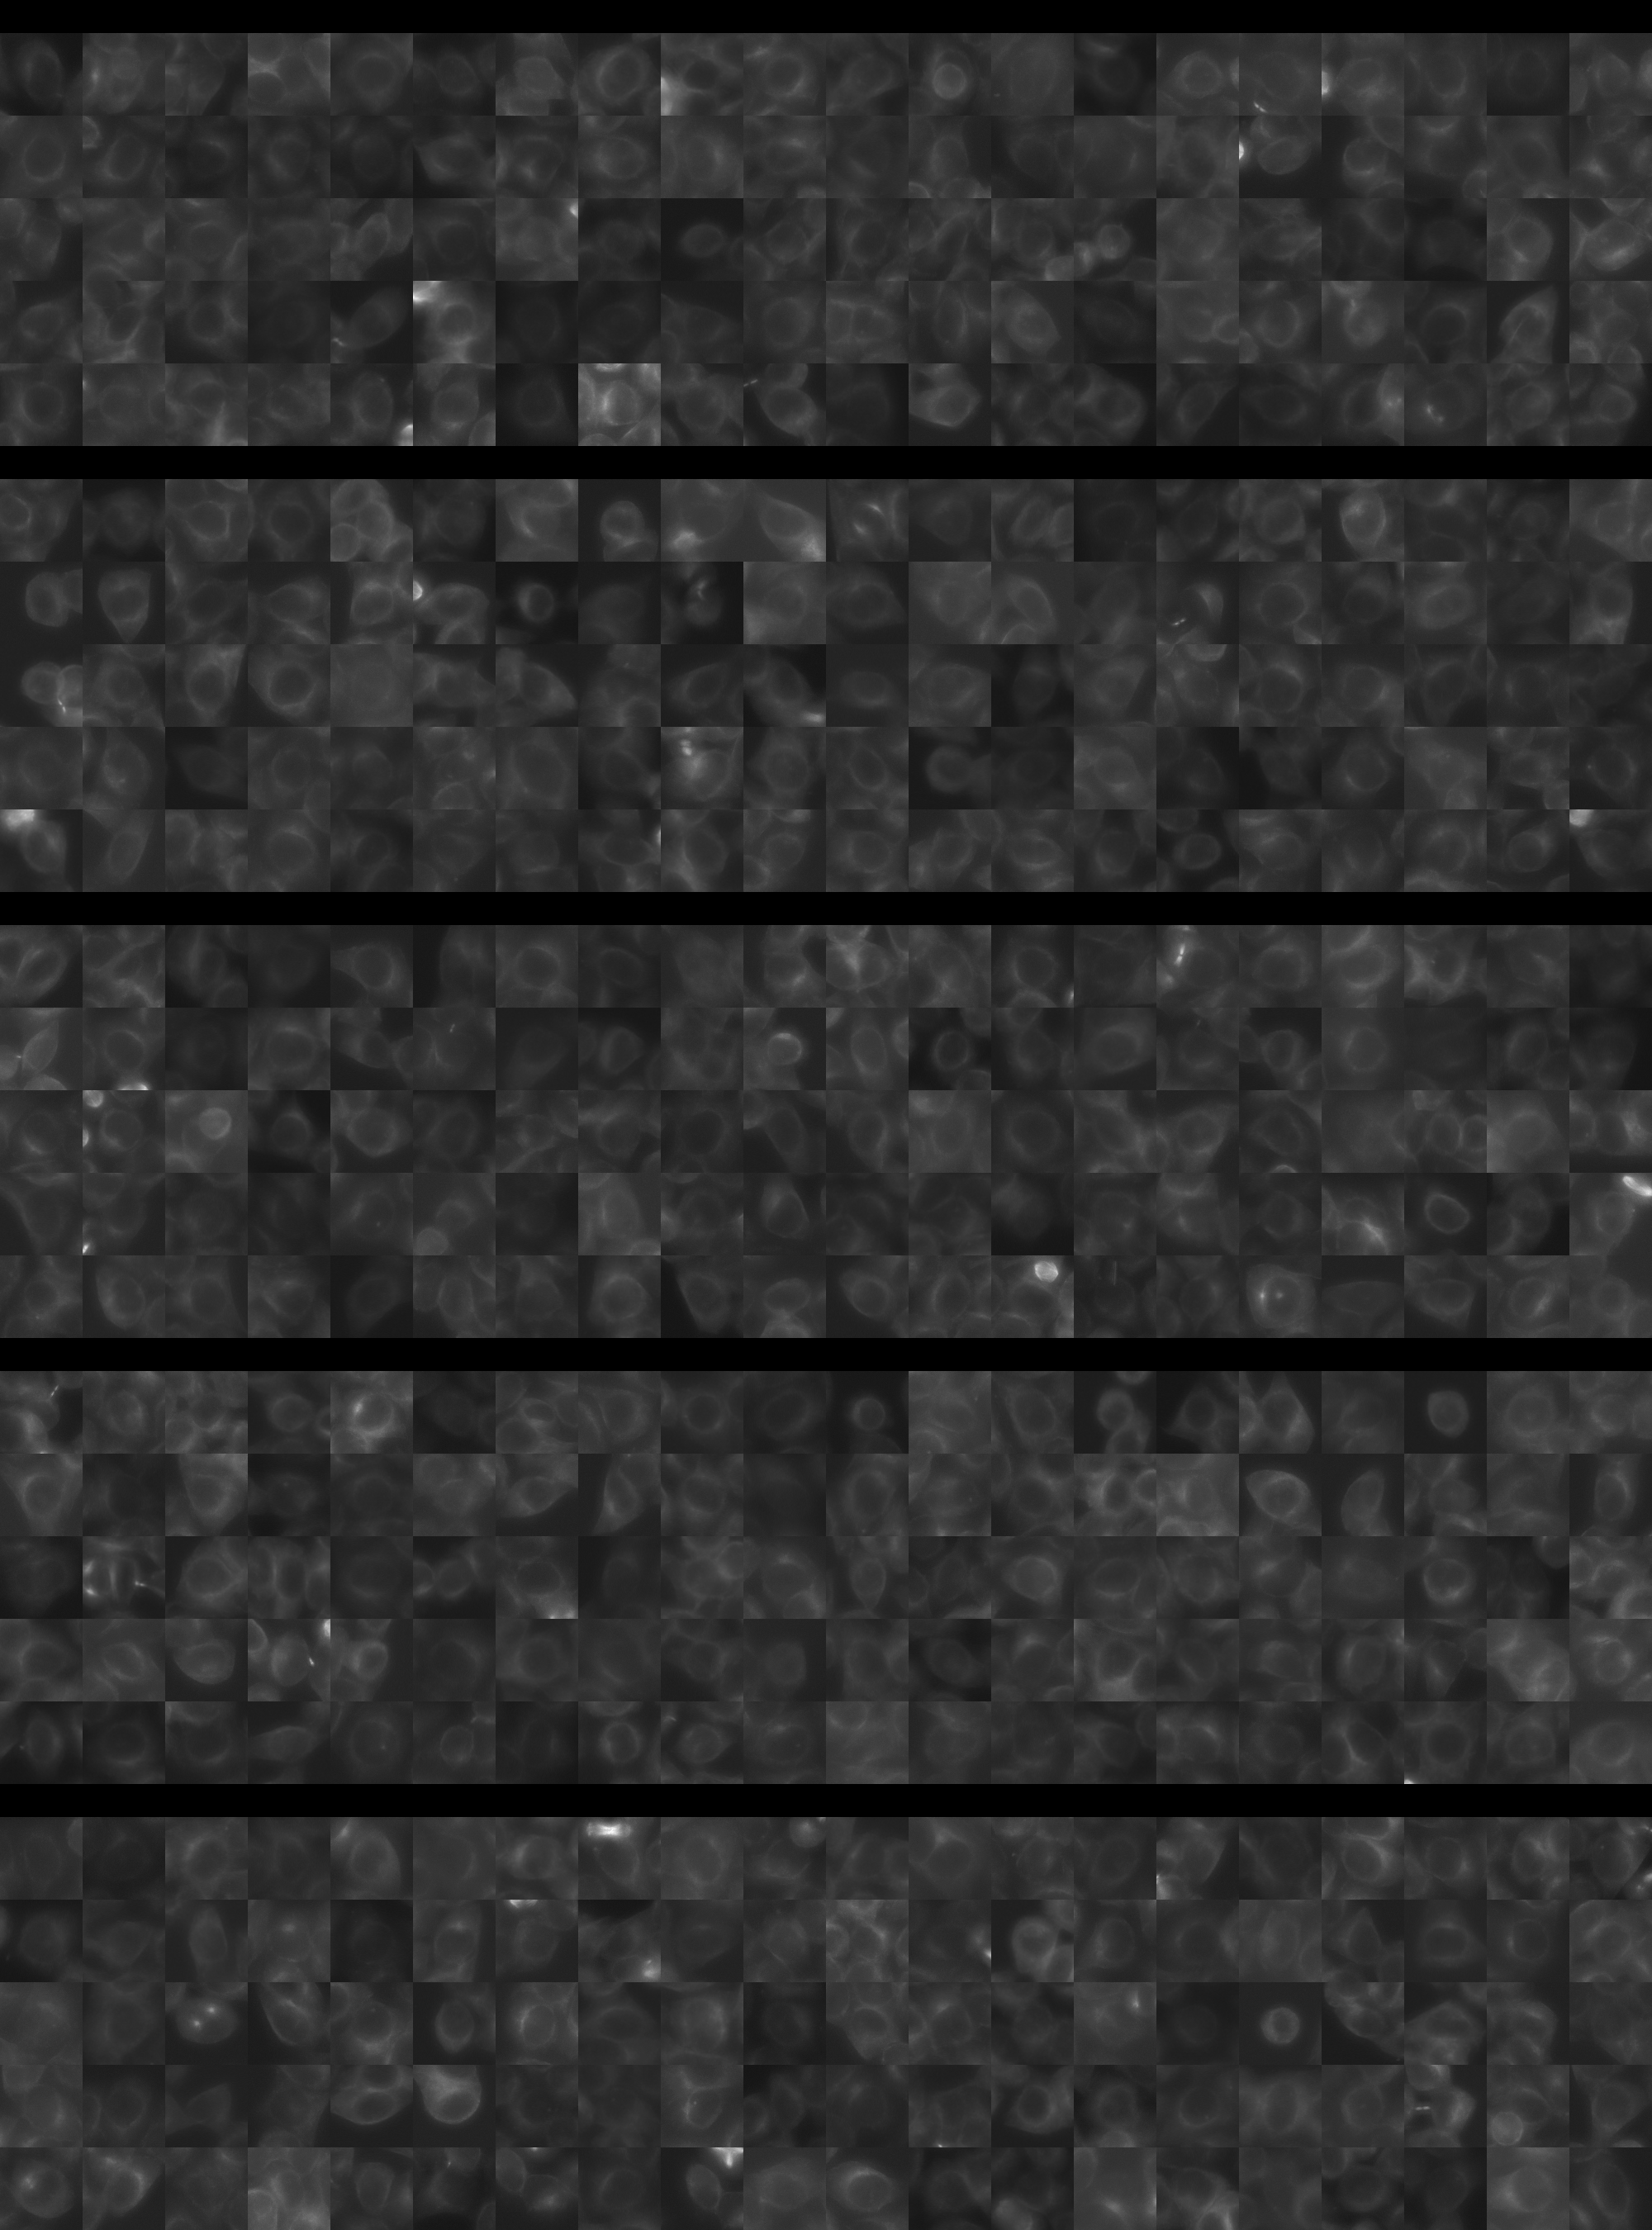
Features

Interphase Score Rank FDR q-value
Nucleus DNA Integrated 0.059 824 of 5322 0.355
Nucleus DNA Mean -2.954e-03 2070 of 5322 0.989
Nucleus gH2AX Mean 0.091 2190 of 5322 0.032
Nucleus DNA - gH2AX Correlation -7.459e-02 3258 of 5322 0.014
Nucleus Shape Area 0.009 2946 of 5322 0.972
Nucleus Shape Eccentricity 9.910e-04 3301 of 5322 0.960
Nucleus Shape Form Factor -4.138e-02 2266 of 5322 0.334
Nucleus Shape Solidity -2.696e-02 1611 of 5322 0.481
Cell DNA Mass Displacement 0.029 2357 of 5322 0.669
Cell Tubulin Mean 0.032 1598 of 5322 0.494
Cell Tubulin Mass Displacement 0.018 1896 of 5322 0.802
Cell Actin Mean 0.023 2232 of 5322 0.691
Cell Tubulin - Actin Correlation 0.050 1417 of 5322 0.255
Cell DNA - Tubulin Correlation 0.023 2907 of 5322 0.631
Cell Shape Area 0.017 2612 of 5322 0.935
Cell Shape Eccentricity -5.950e-04 3744 of 5322 0.999
Mitotic Score Rank FDR q-value
Nucleus DNA Integrated -5.812e-02 4490 of 5322 0.974
Nucleus DNA Mean -1.321e-01 4585 of 5322 1.000
Nucleus DNA Mass Displacement 0.208 695 of 5322 0.999
Nucleus DNA Mean Frac 3 0.120 1320 of 5322 1.000
Nucleus gH2AX Mean -6.457e-02 3839 of 5322 1.000
Nucleus gH2AX Mean Frac 0 -6.239e-02 3273 of 5322 1.000
Nucleus Tubulin Mean Frac 0 -6.068e-02 4298 of 5322 0.999
Nucleus Tubulin Mean Edge 0.057 2404 of 5322 0.999
Nucleus Tubulin Std Edge -1.946e-02 2834 of 5322 0.999
Nucleus Shape Area 0.176 1721 of 5322 0.948
Nucleus Shape Eccentricity -1.029e-01 3604 of 5322 1.000
Nucleus Shape Form Factor -1.124e-01 3028 of 5322 0.998
Cell Tubulin Mean 0.081 2323 of 5322 0.997
Cell Tubulin Mean Frac 3 0.245 120 of 5322 0.999
Cell Actin Mean -5.074e-02 3876 of 5322 0.997
Cell Shape Area 0.191 1484 of 5322 0.994
( Reset Zoom )
Brightness
Contrast
Opacity
Brightness
Contrast
Opacity
Brightness
Contrast
Opacity
Brightness
Contrast
Opacity
Brightness
Contrast
Opacity

( Reset Zoom )
Brightness
Contrast
Opacity
Brightness
Contrast
Opacity
Brightness
Contrast
Opacity
Brightness
Contrast
Opacity
Brightness
Contrast
Opacity

MIT Central Accessability