KDM8

Gene symbol: KDM8
Gene: 79831
Uniprot Function: Bifunctional enzyme that acts both as an endopeptidase and 2-oxoglutarate-dependent monoxygenase (PubMed:28847961, PubMed:29459673, PubMed:28982940, PubMed:29563586). Endopeptidase that cleaves histones N-terminal tails at the carboxyl side of methylated arginine or lysine residues, to generate 'tailless nucleosomes', which may trigger transcription elongation (PubMed:28847961, PubMed:29459673, PubMed:28982940). Preferentially recognizes and cleaves monomethylated and dimethylated arginine residues of histones H2, H3 and H4. After initial cleavage, continues to digest histones tails via its aminopeptidase activity (PubMed:28847961, PubMed:29459673). Upon DNA damage, cleaves the N-terminal tail of histone H3 at monomethylated lysine residues, preferably at monomethylated 'Lys-9' (H3K9me1). The histone variant H3F3A is the major target for cleavage (PubMed:28982940). Additionnally, acts as Fe(2+) and 2-oxoglutarate-dependent monoxygenase, catalyzing (R)-stereospecific hydroxylation at C-3 of 'Arg-137' of RPS6 and 'Arg-141' of RCCD1, but the biological significance of this activity remains to be established (PubMed:29563586). Regulates mitosis through different mechanisms: Plays a role in transcriptional repression of satellite repeats, possibly by regulating H3K36 methylation levels in centromeric regions together with RCCD1. Possibly together with RCCD1, is involved in proper mitotic spindle organization and chromosome segregation (PubMed:24981860). Negatively regulates cell cycle repressor CDKN1A/p21, which controls G1/S phase transition (PubMed:24740926). Required for G2/M phase cell cycle progression. Regulates expression of CCNA1/cyclin-A1, leading to cancer cell proliferation (PubMed:20457893). Also, plays a role in regulating alpha-tubulin acetylation and cytoskeletal microtubule stability involved in epithelial to mesenchymal transition (PubMed:28455245). Regulates the circadian gene expression in the liver (By similarity). Represses the transcriptional activator activity of the CLOCK-ARNTL/BMAL1 heterodimer in a catalytically-independent manner (PubMed:30500822). Negatively regulates the protein stability and function of CRY1; required for AMPK-FBXL3-induced CRY1 degradation (PubMed:30500822).
Mitotic Index 0.0285
Interphase Cluster: #51 (30 genes)
Mitotic Cluster: #18 (40 genes)
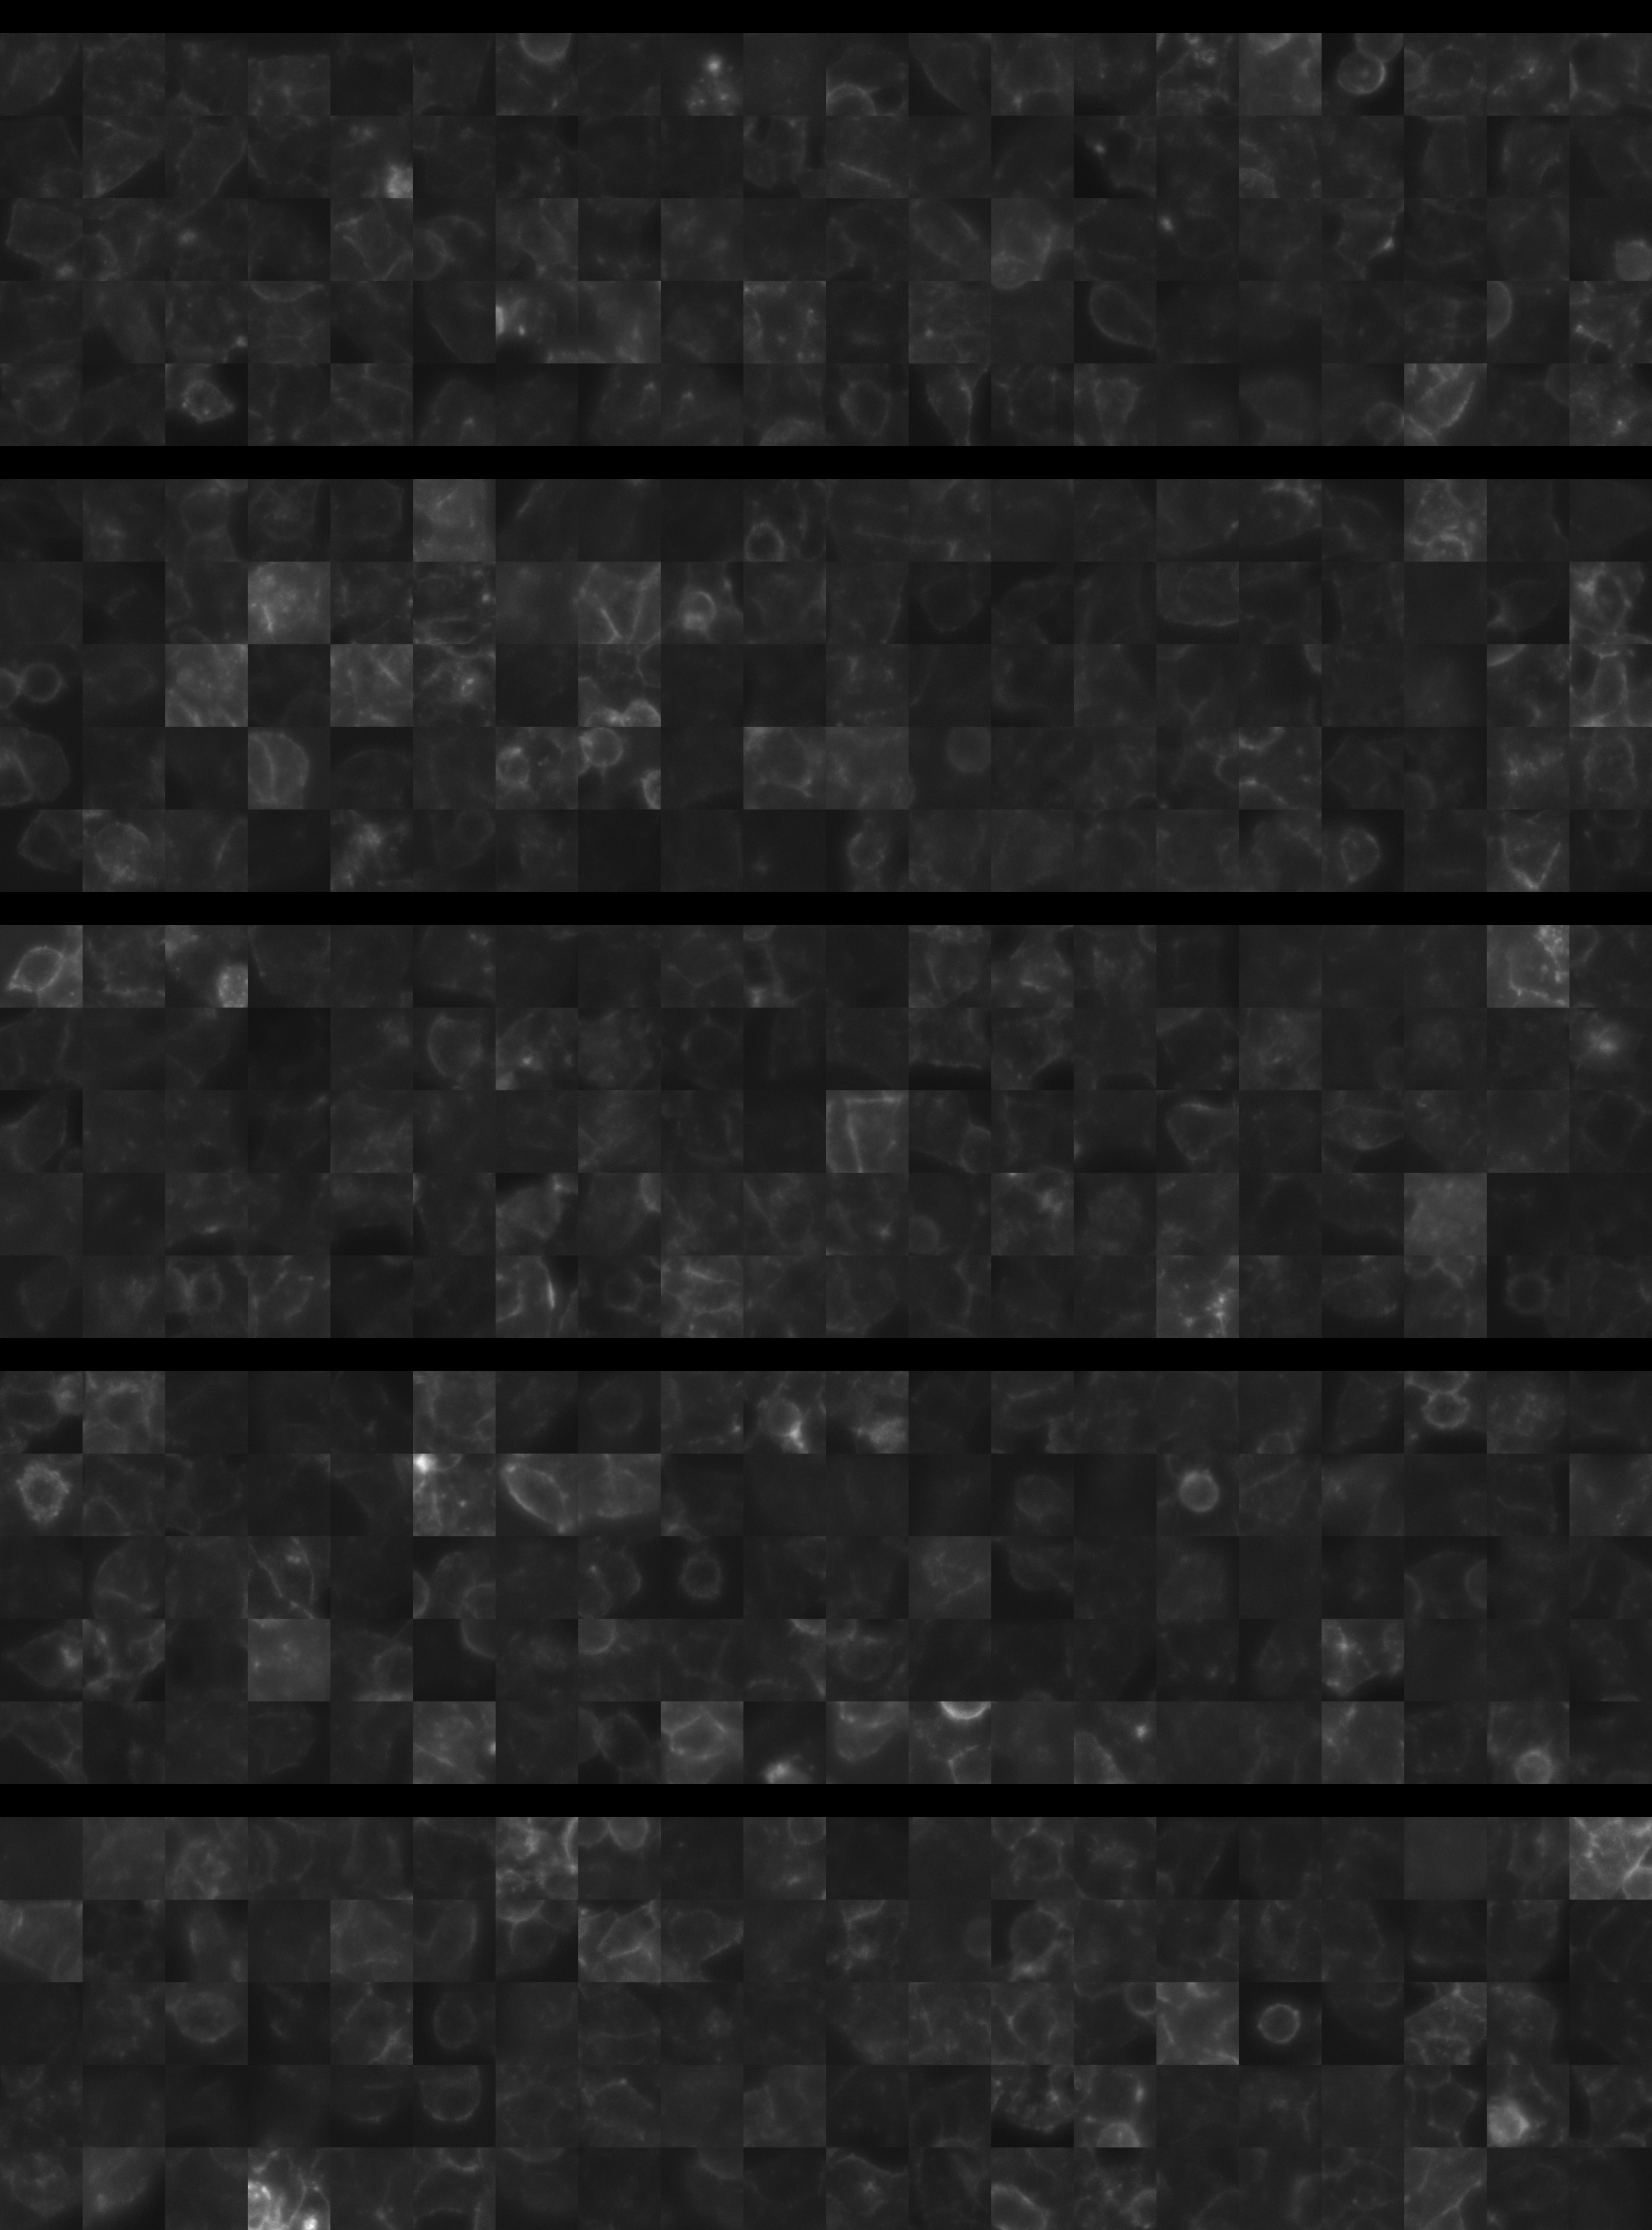
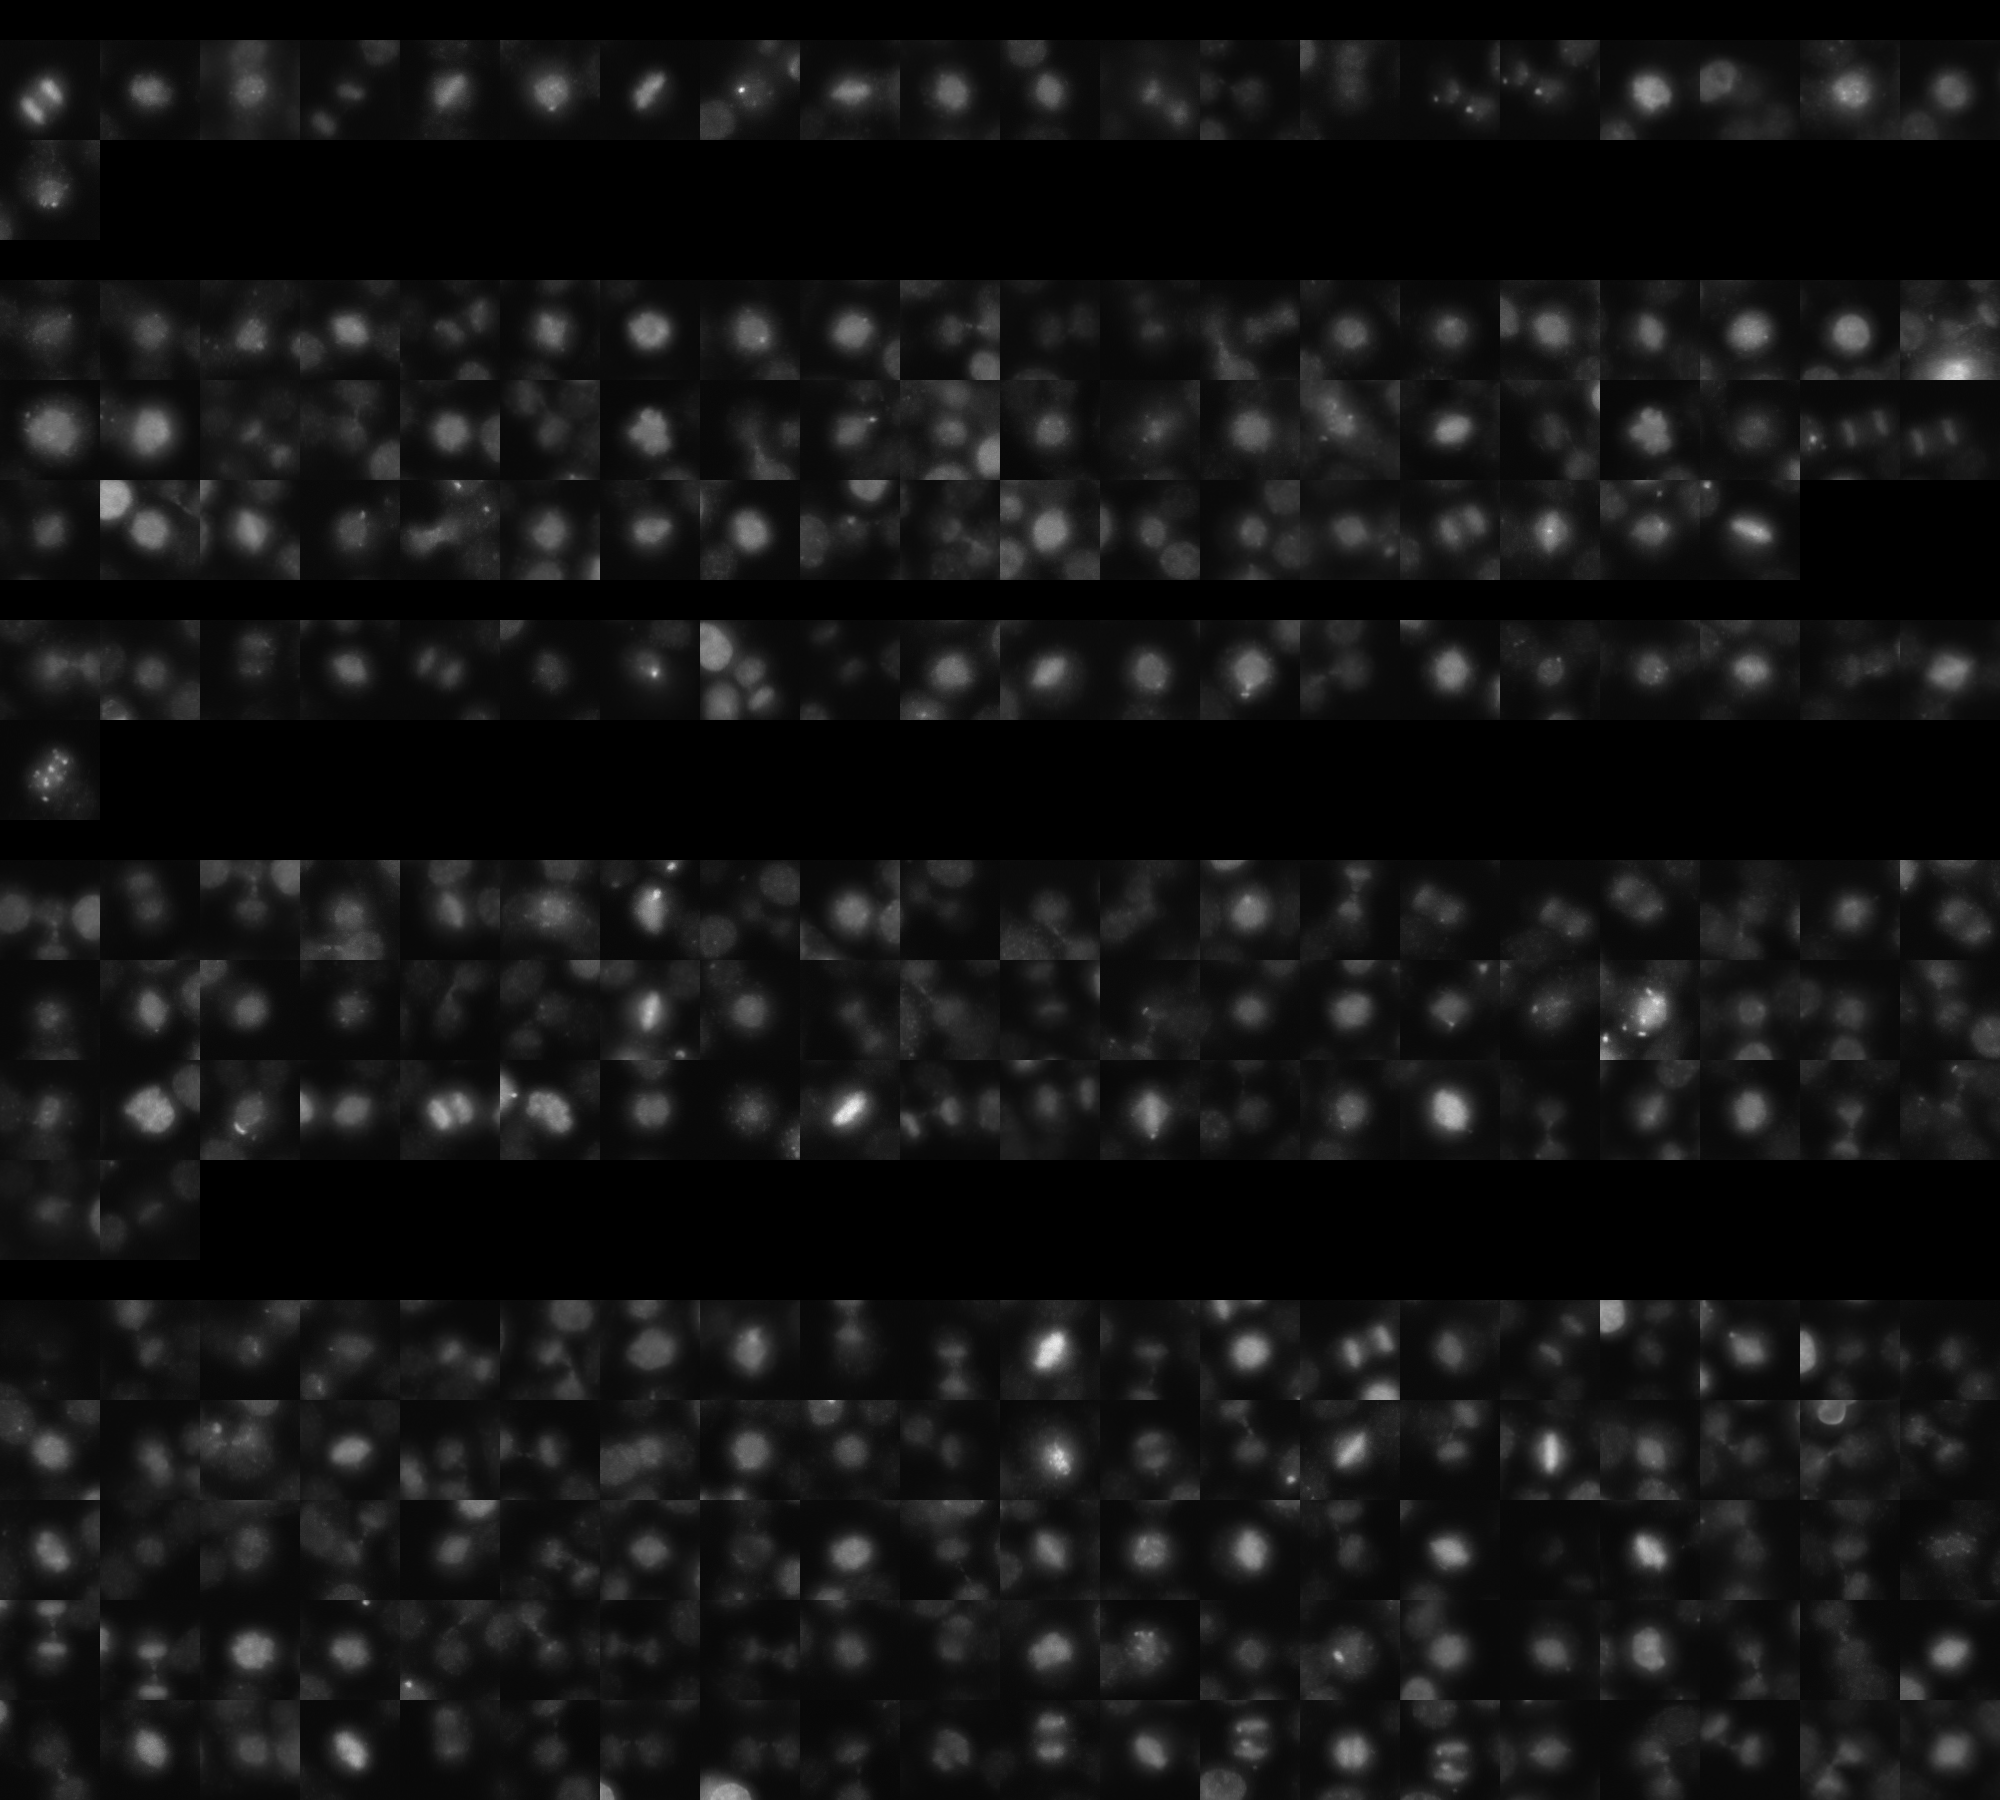
sgRNA 1: AGACCTGAAGTTGGACCTCG (interphase cells: 755, mitotic cells: 21)
sgRNA 2: CAGAAAGCAAGGGCGGACCA (interphase cells: 2103, mitotic cells: 58)
sgRNA 3: GAACTCGTTGACCGTCATGA (interphase cells: 812, mitotic cells: 21)
sgRNA 4: TCCTGGGAGAAGCTCAACAC (interphase cells: 1844, mitotic cells: 62)

Interphase Cluster

Mitotic Cluster

Overview

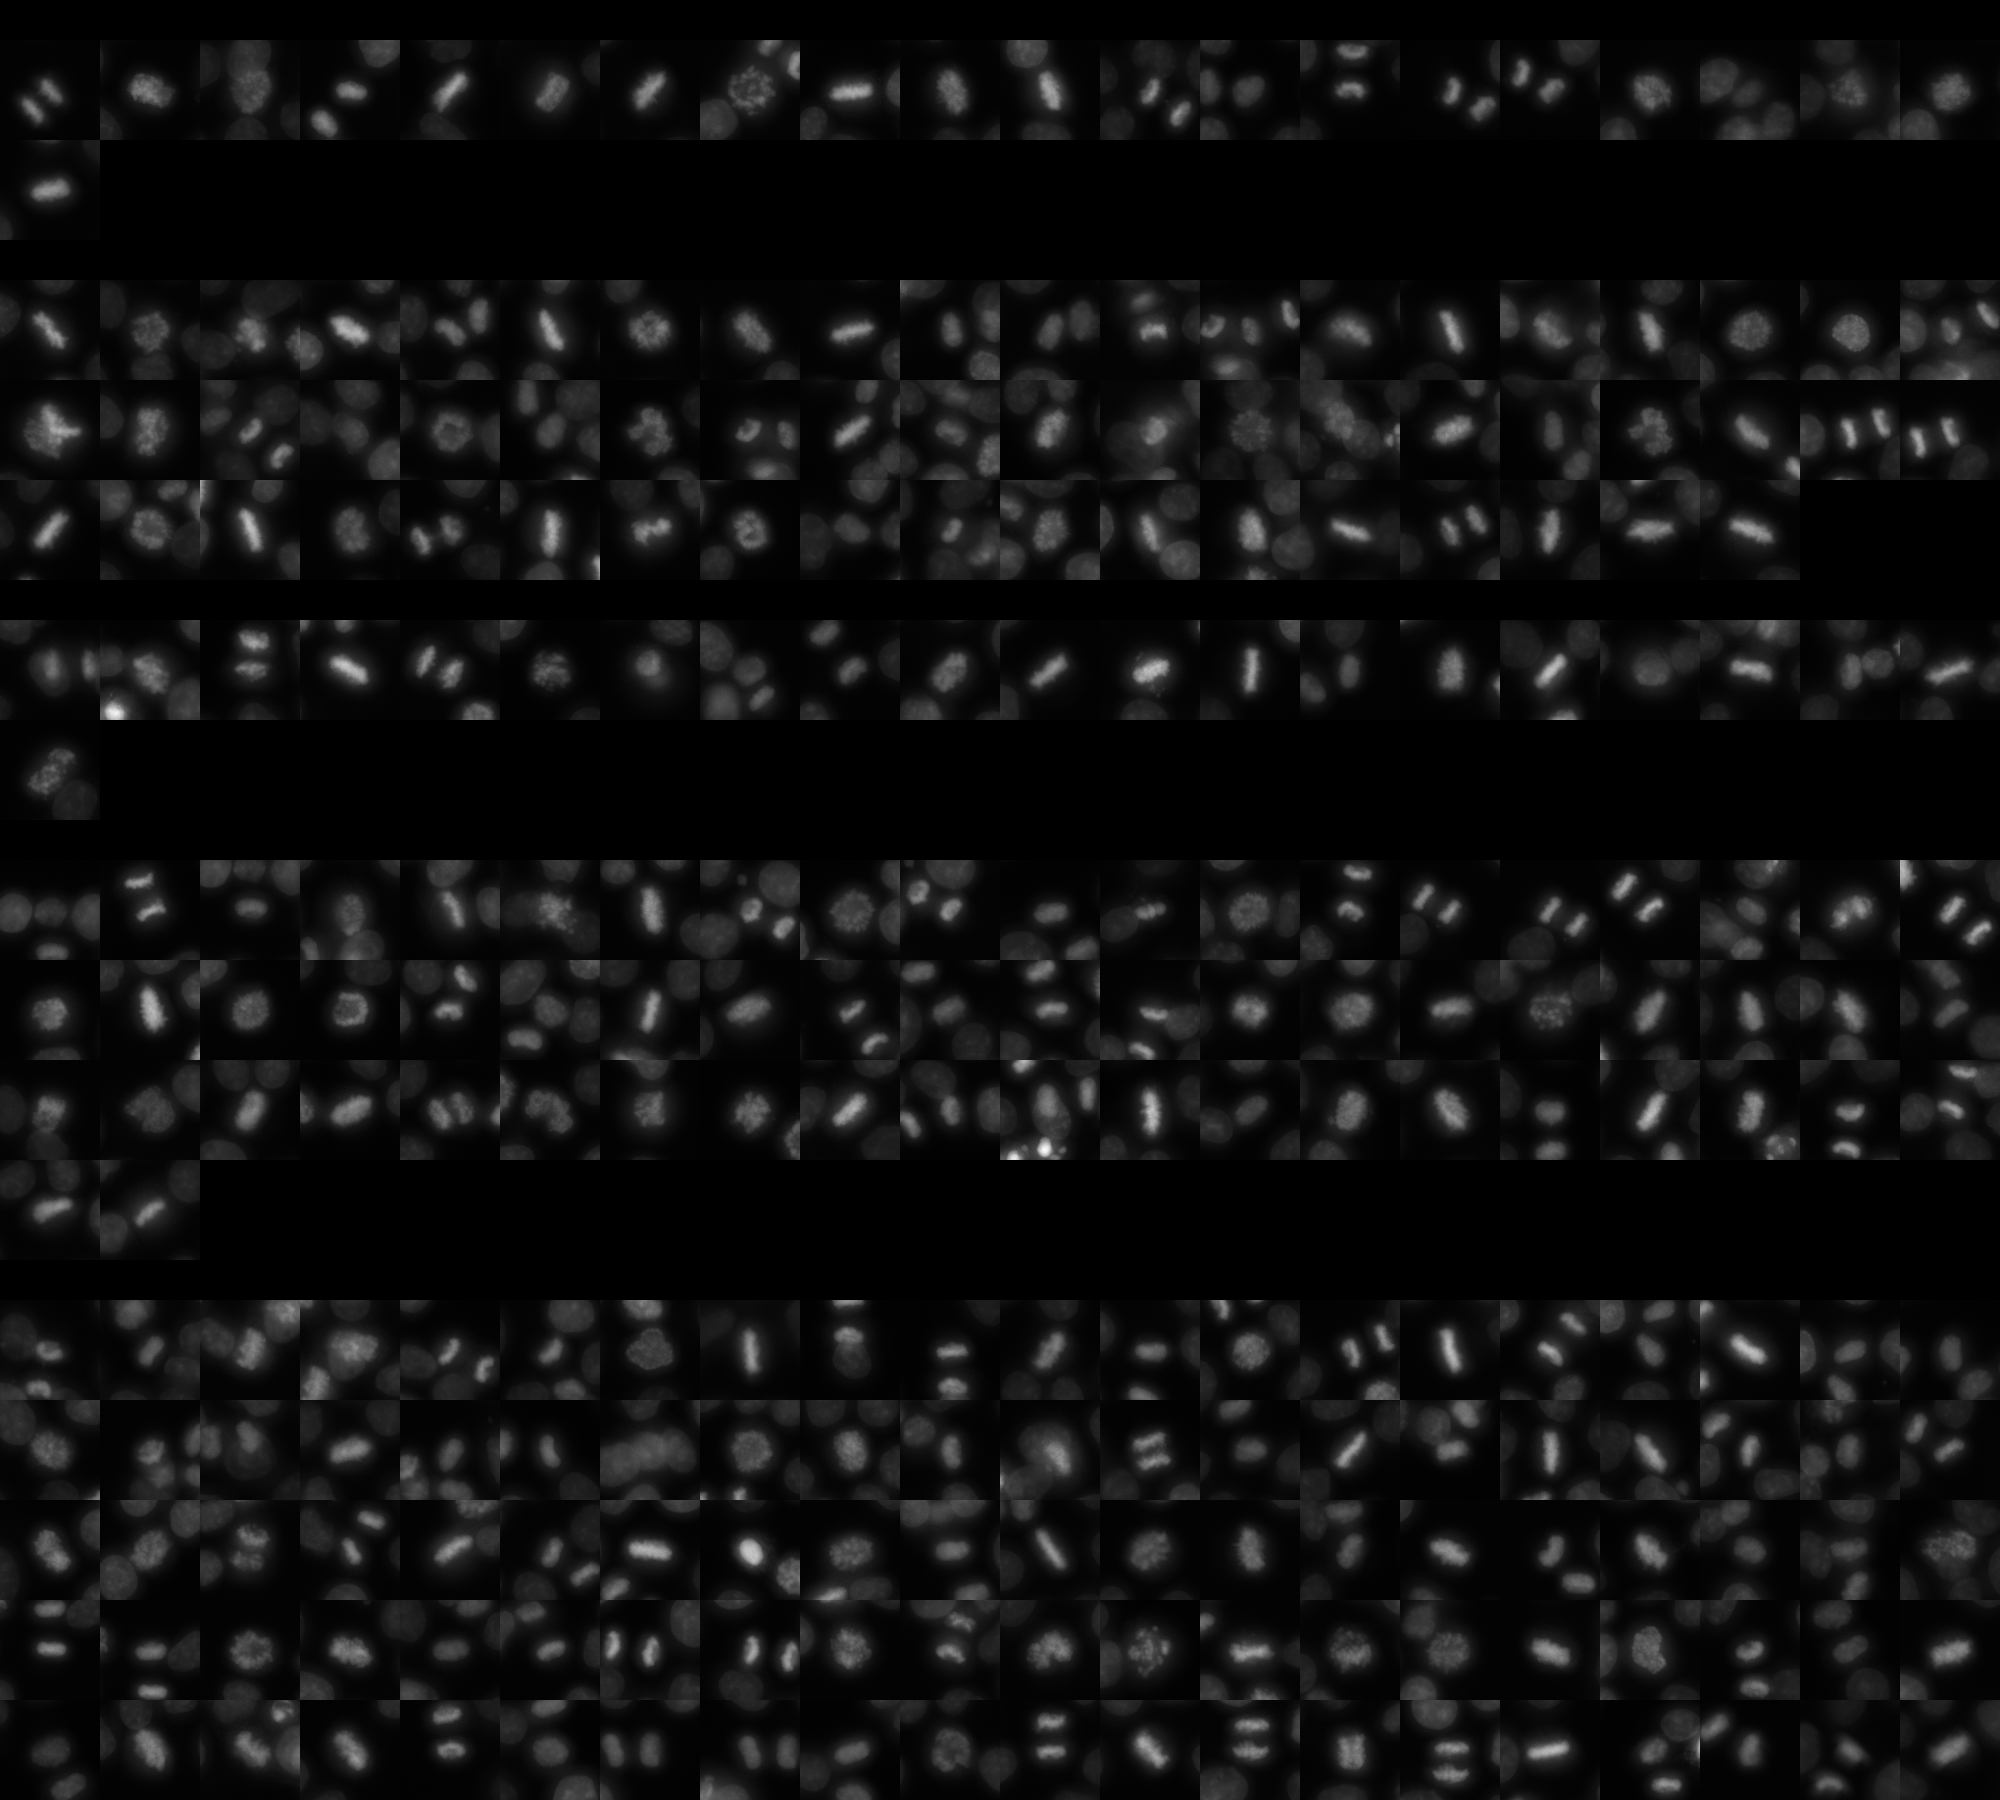
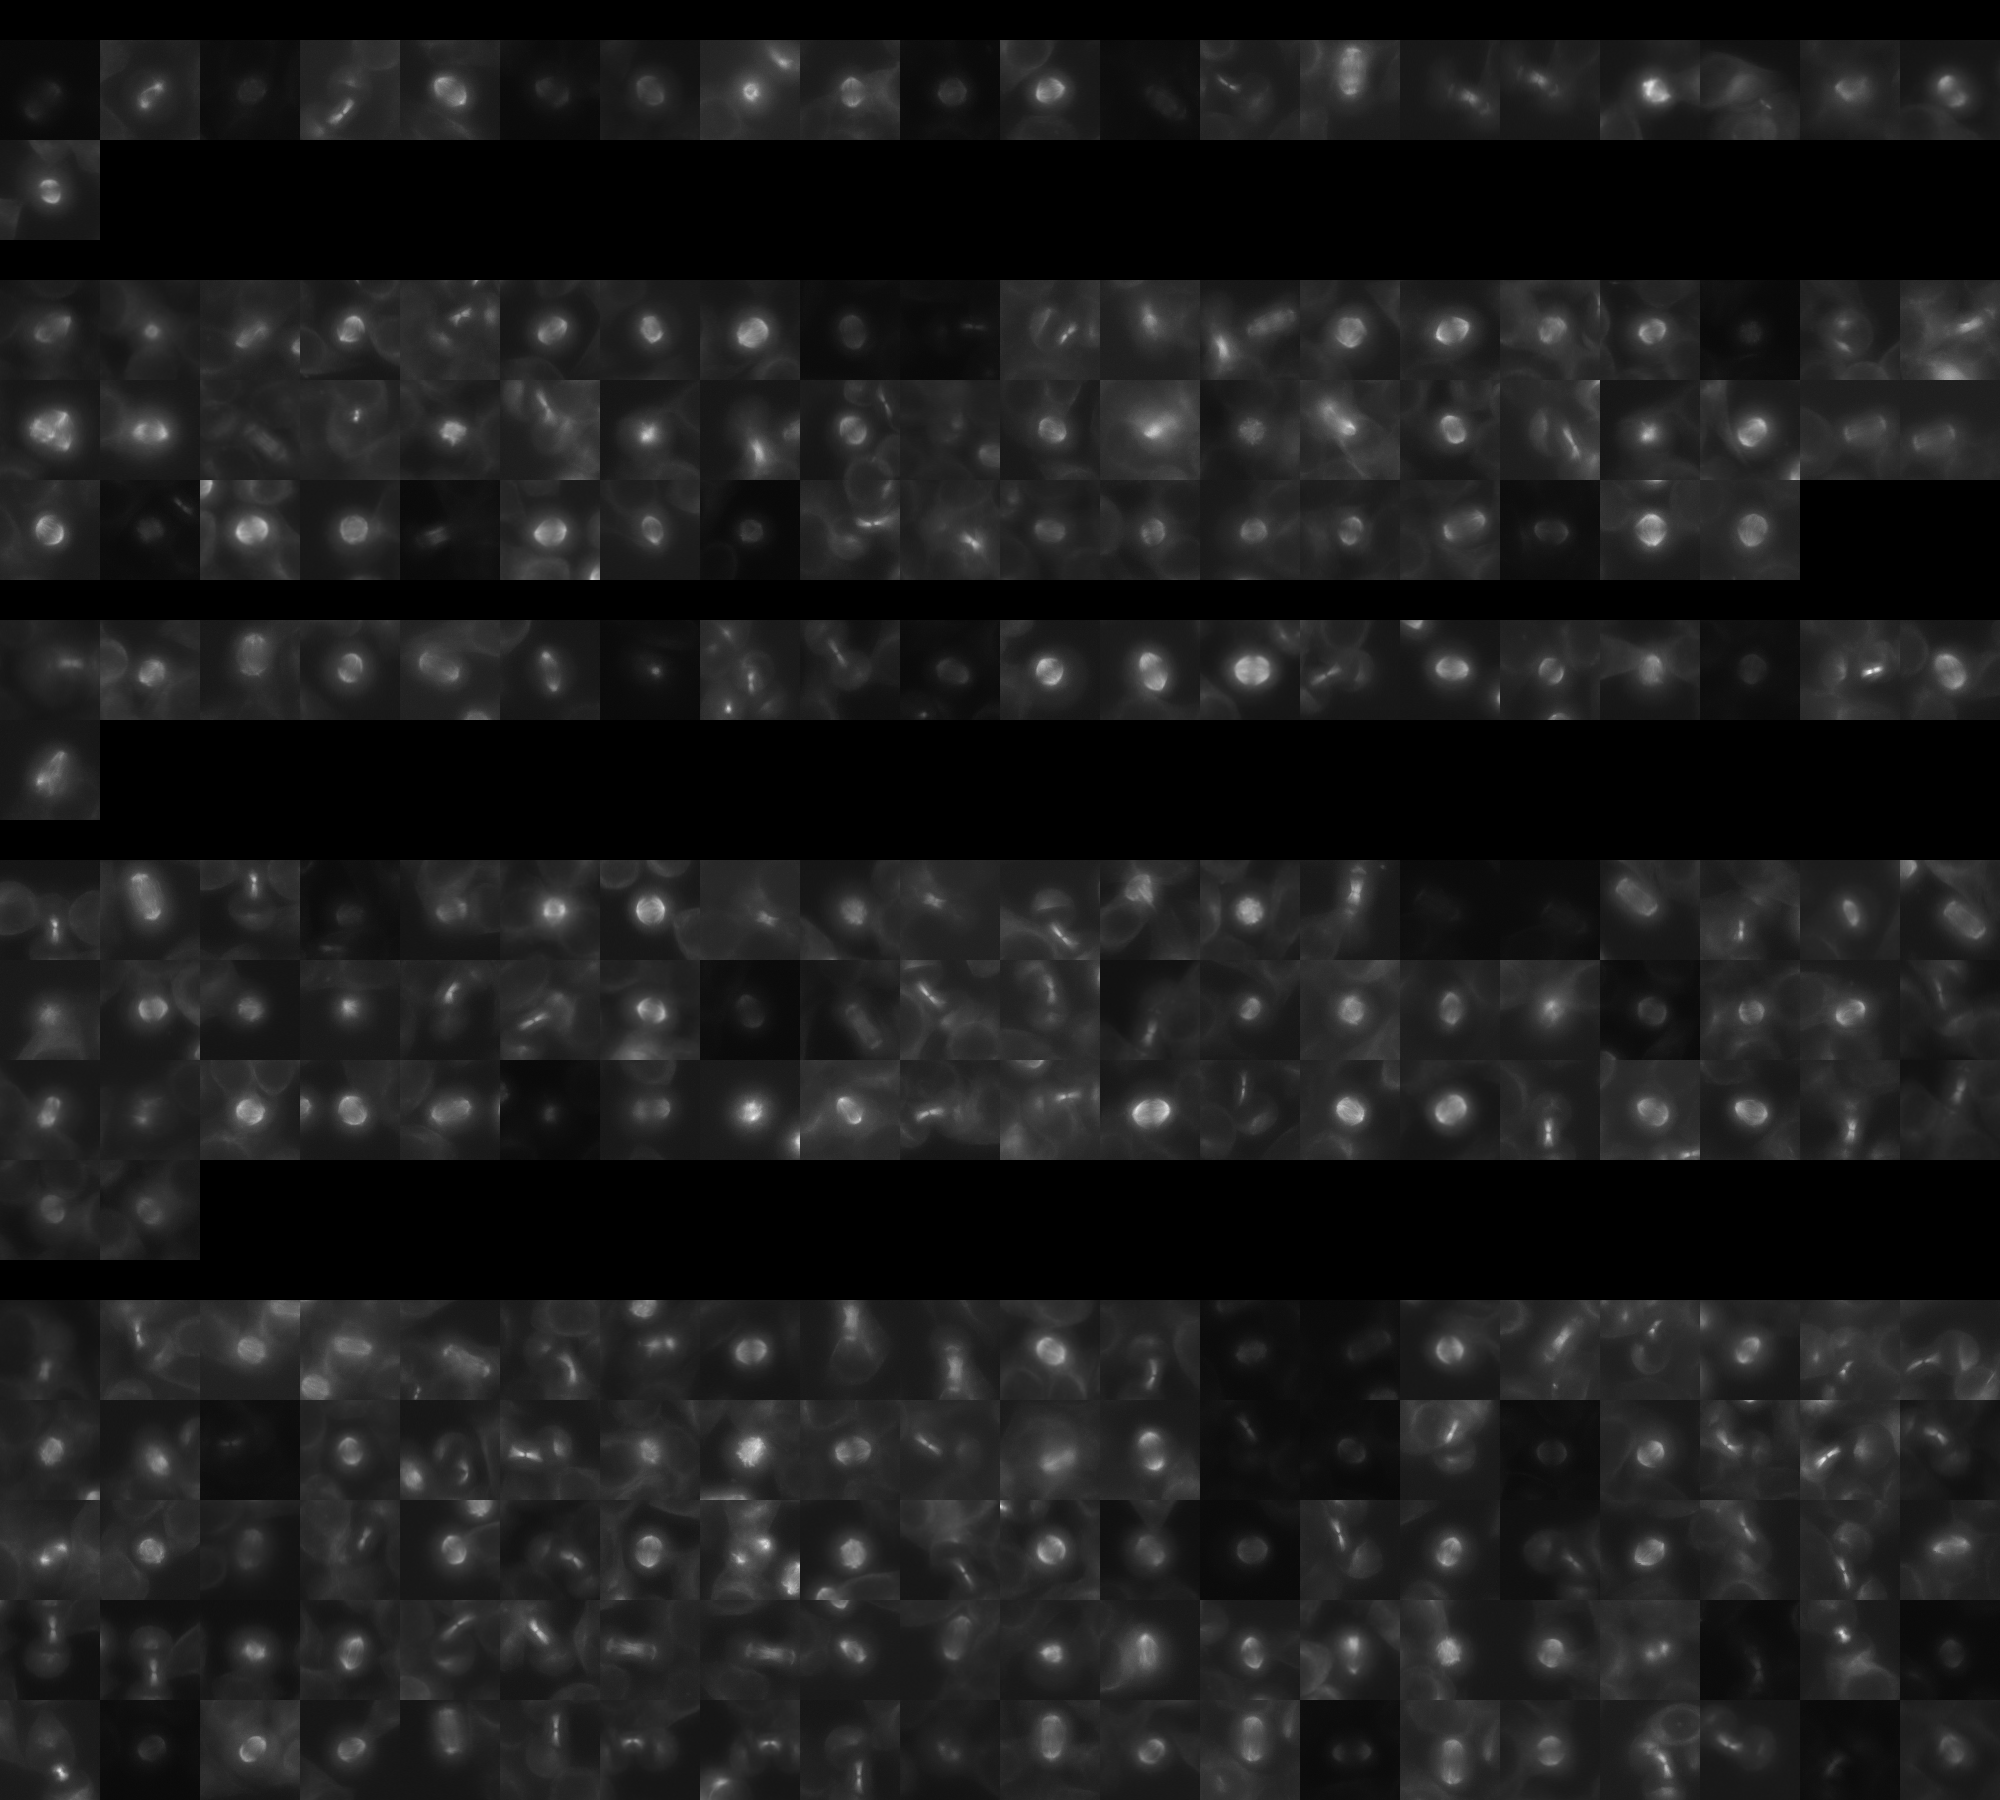
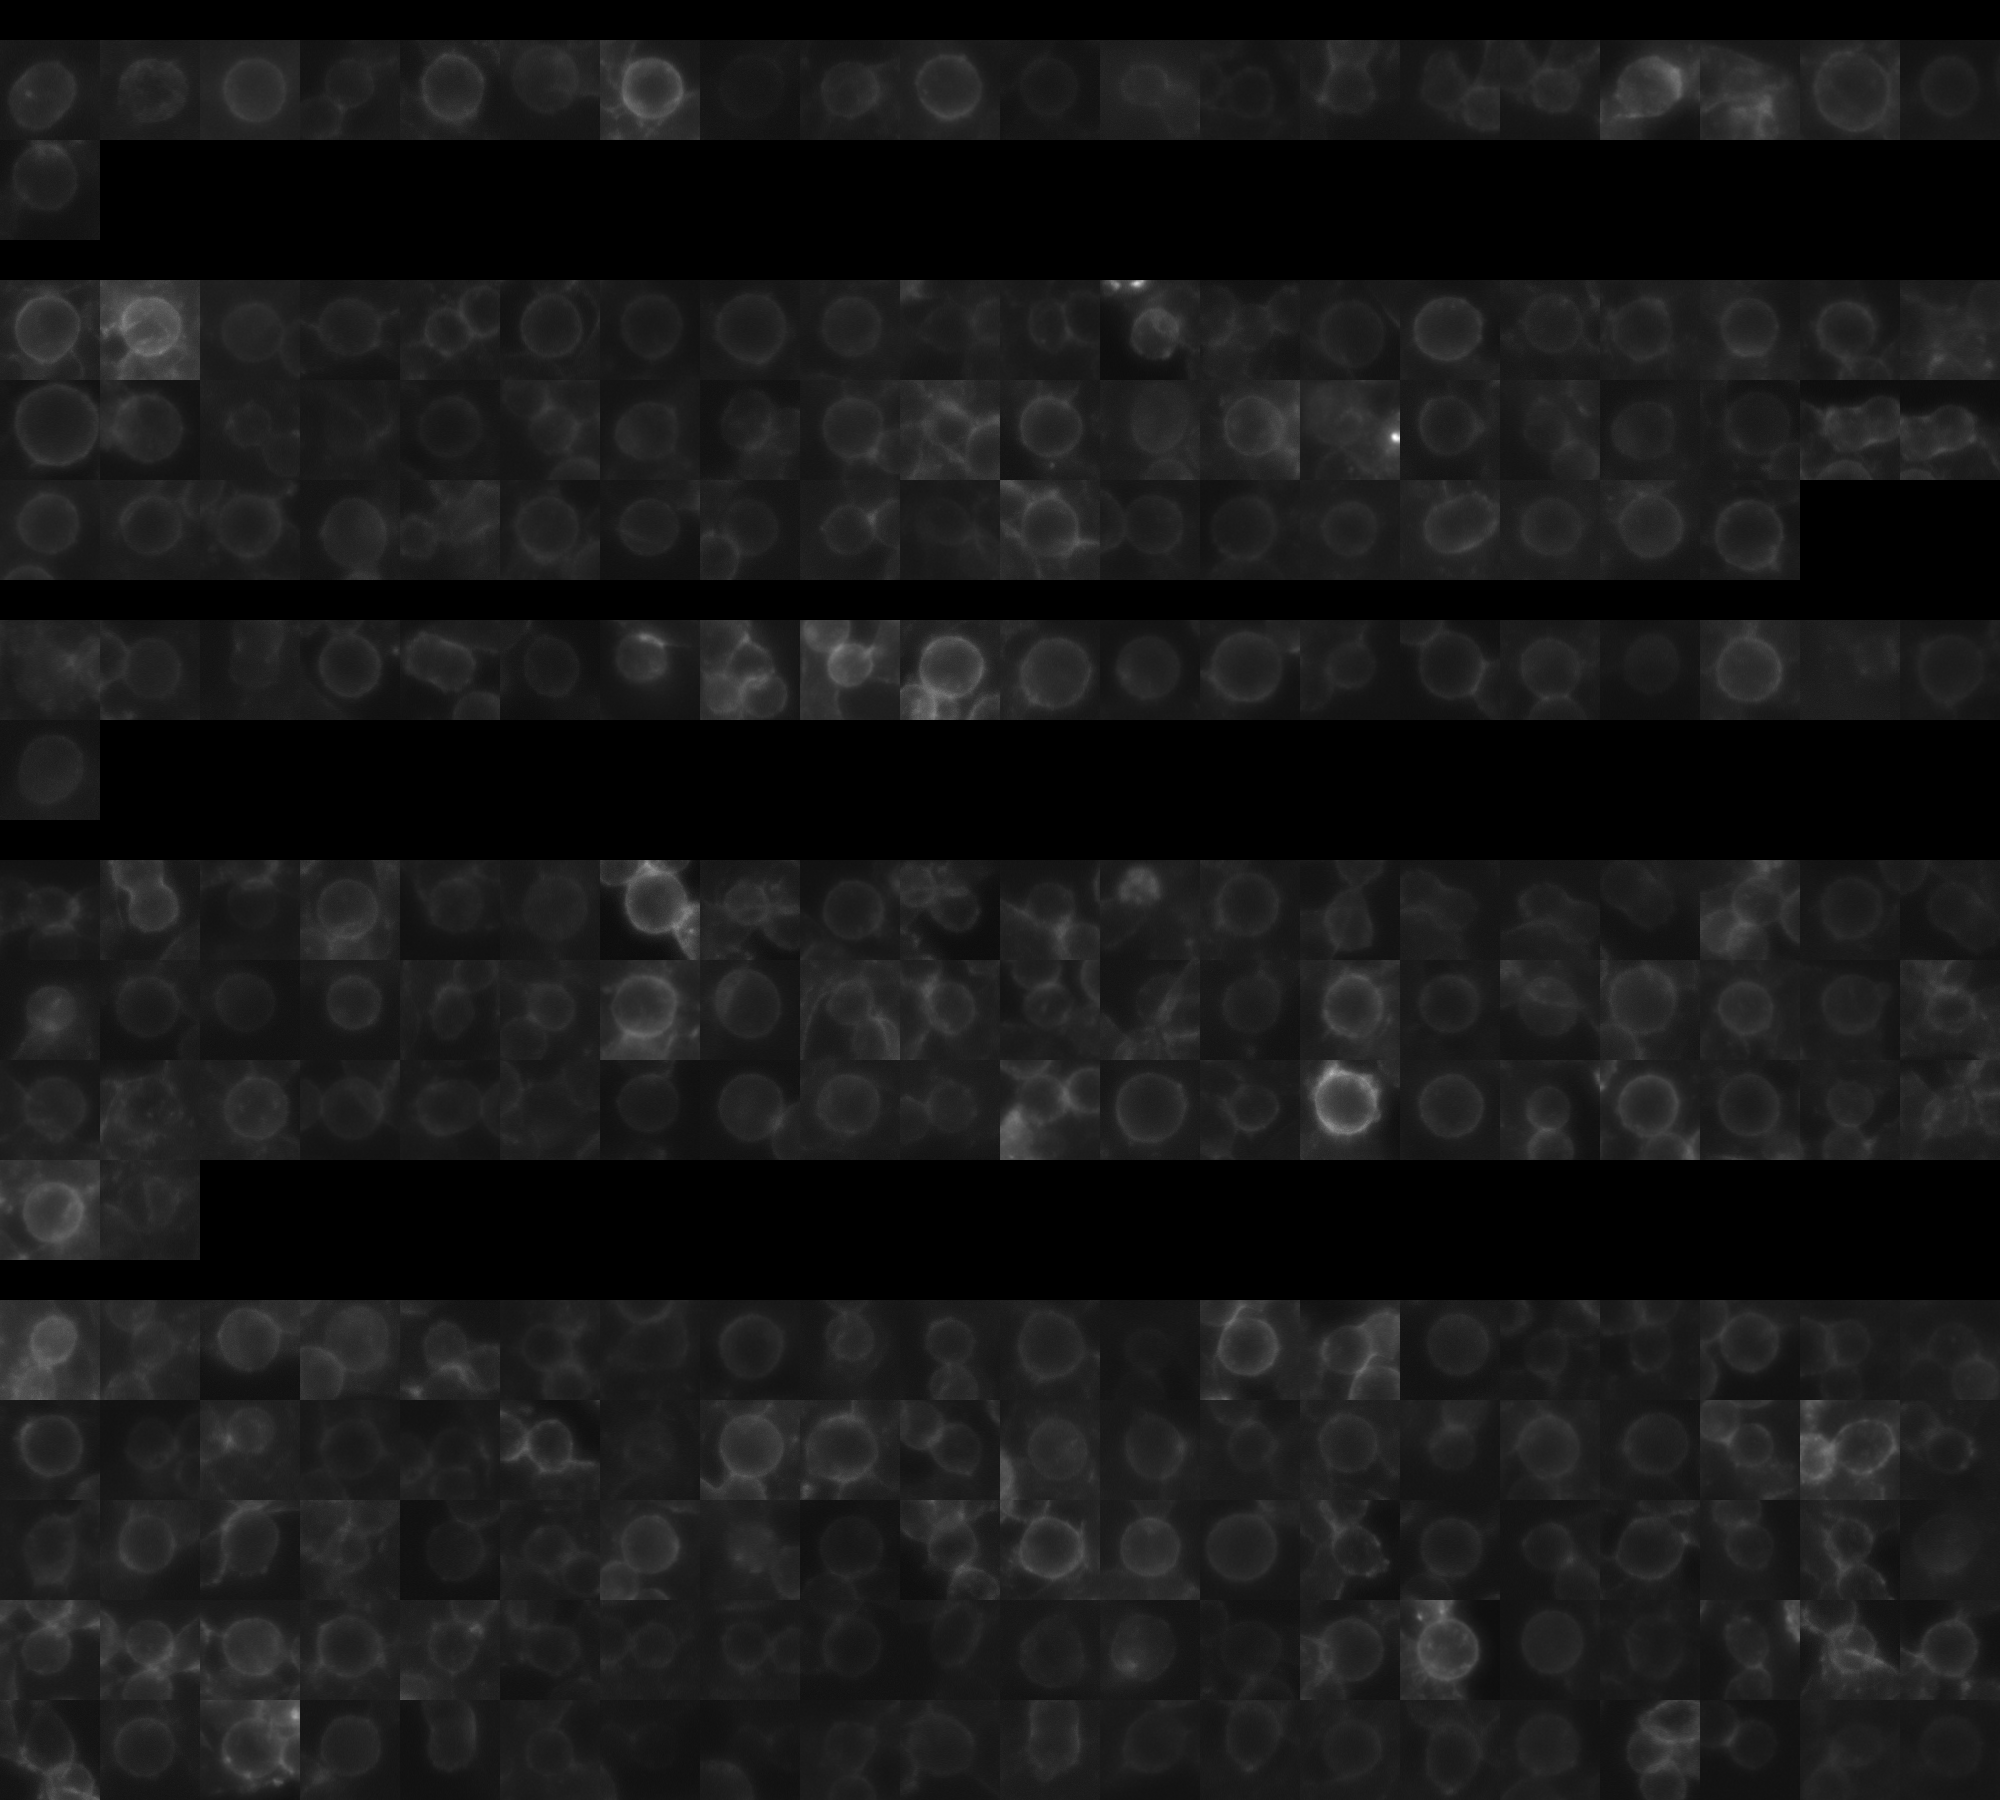
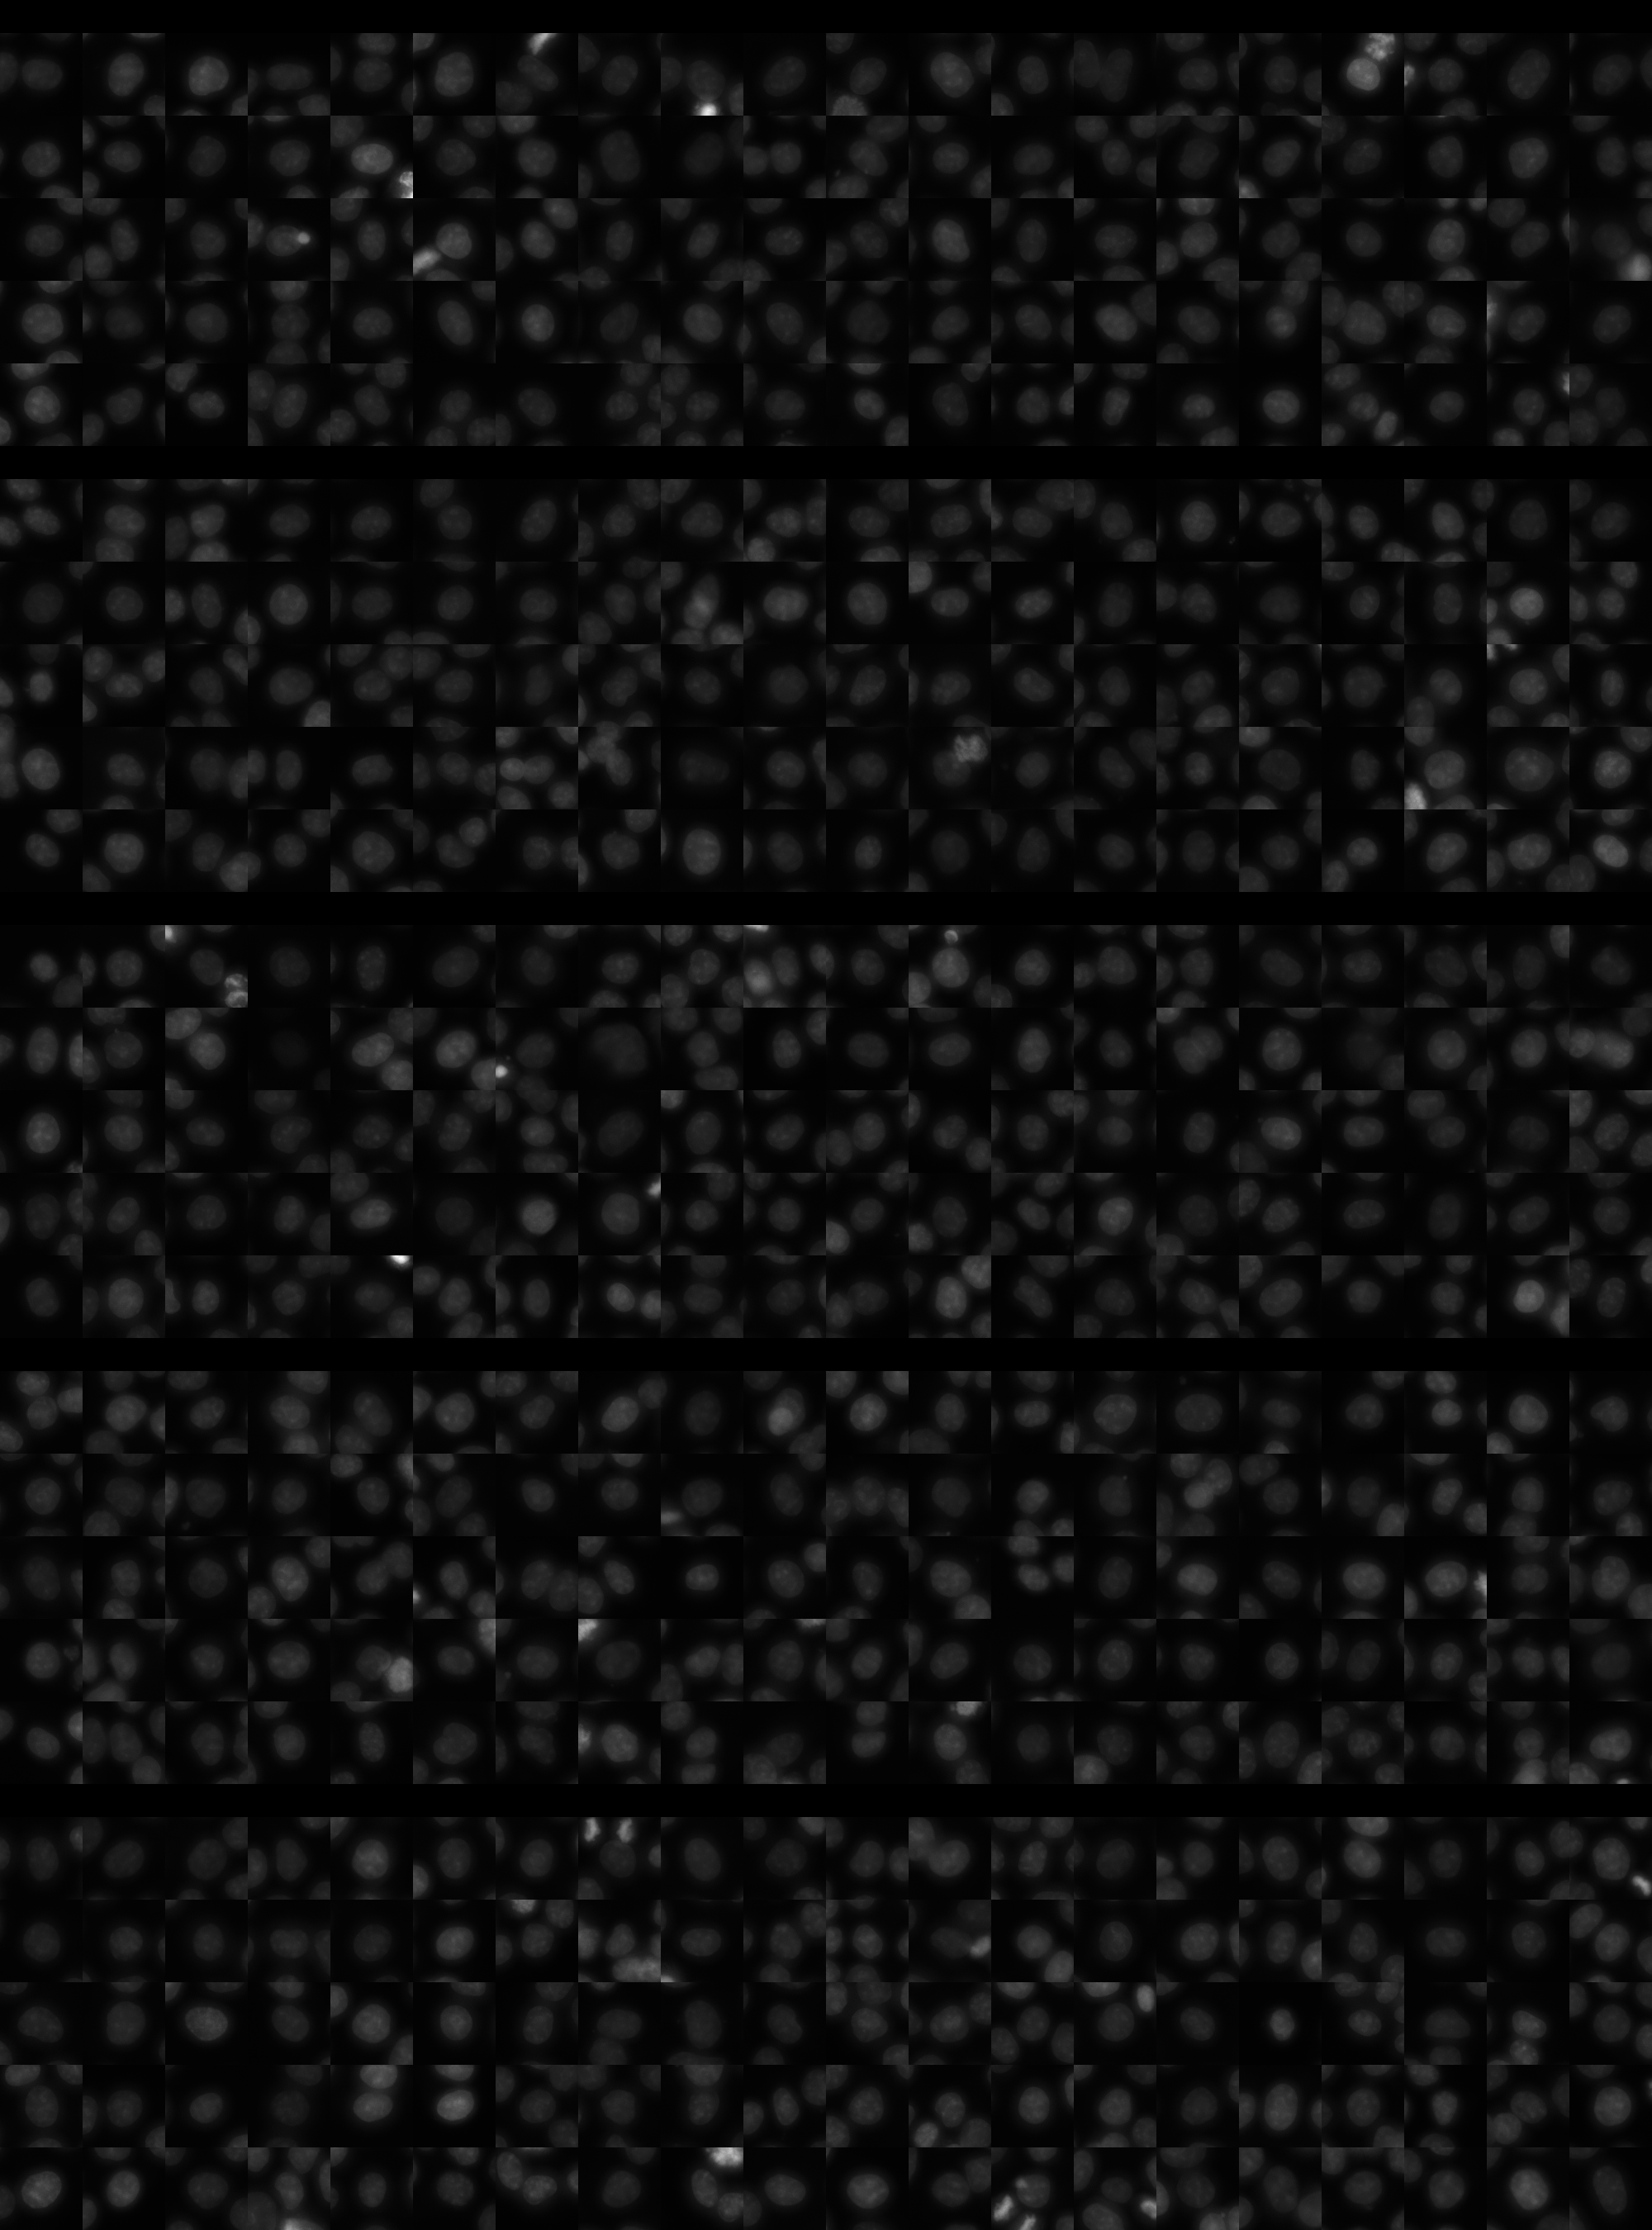
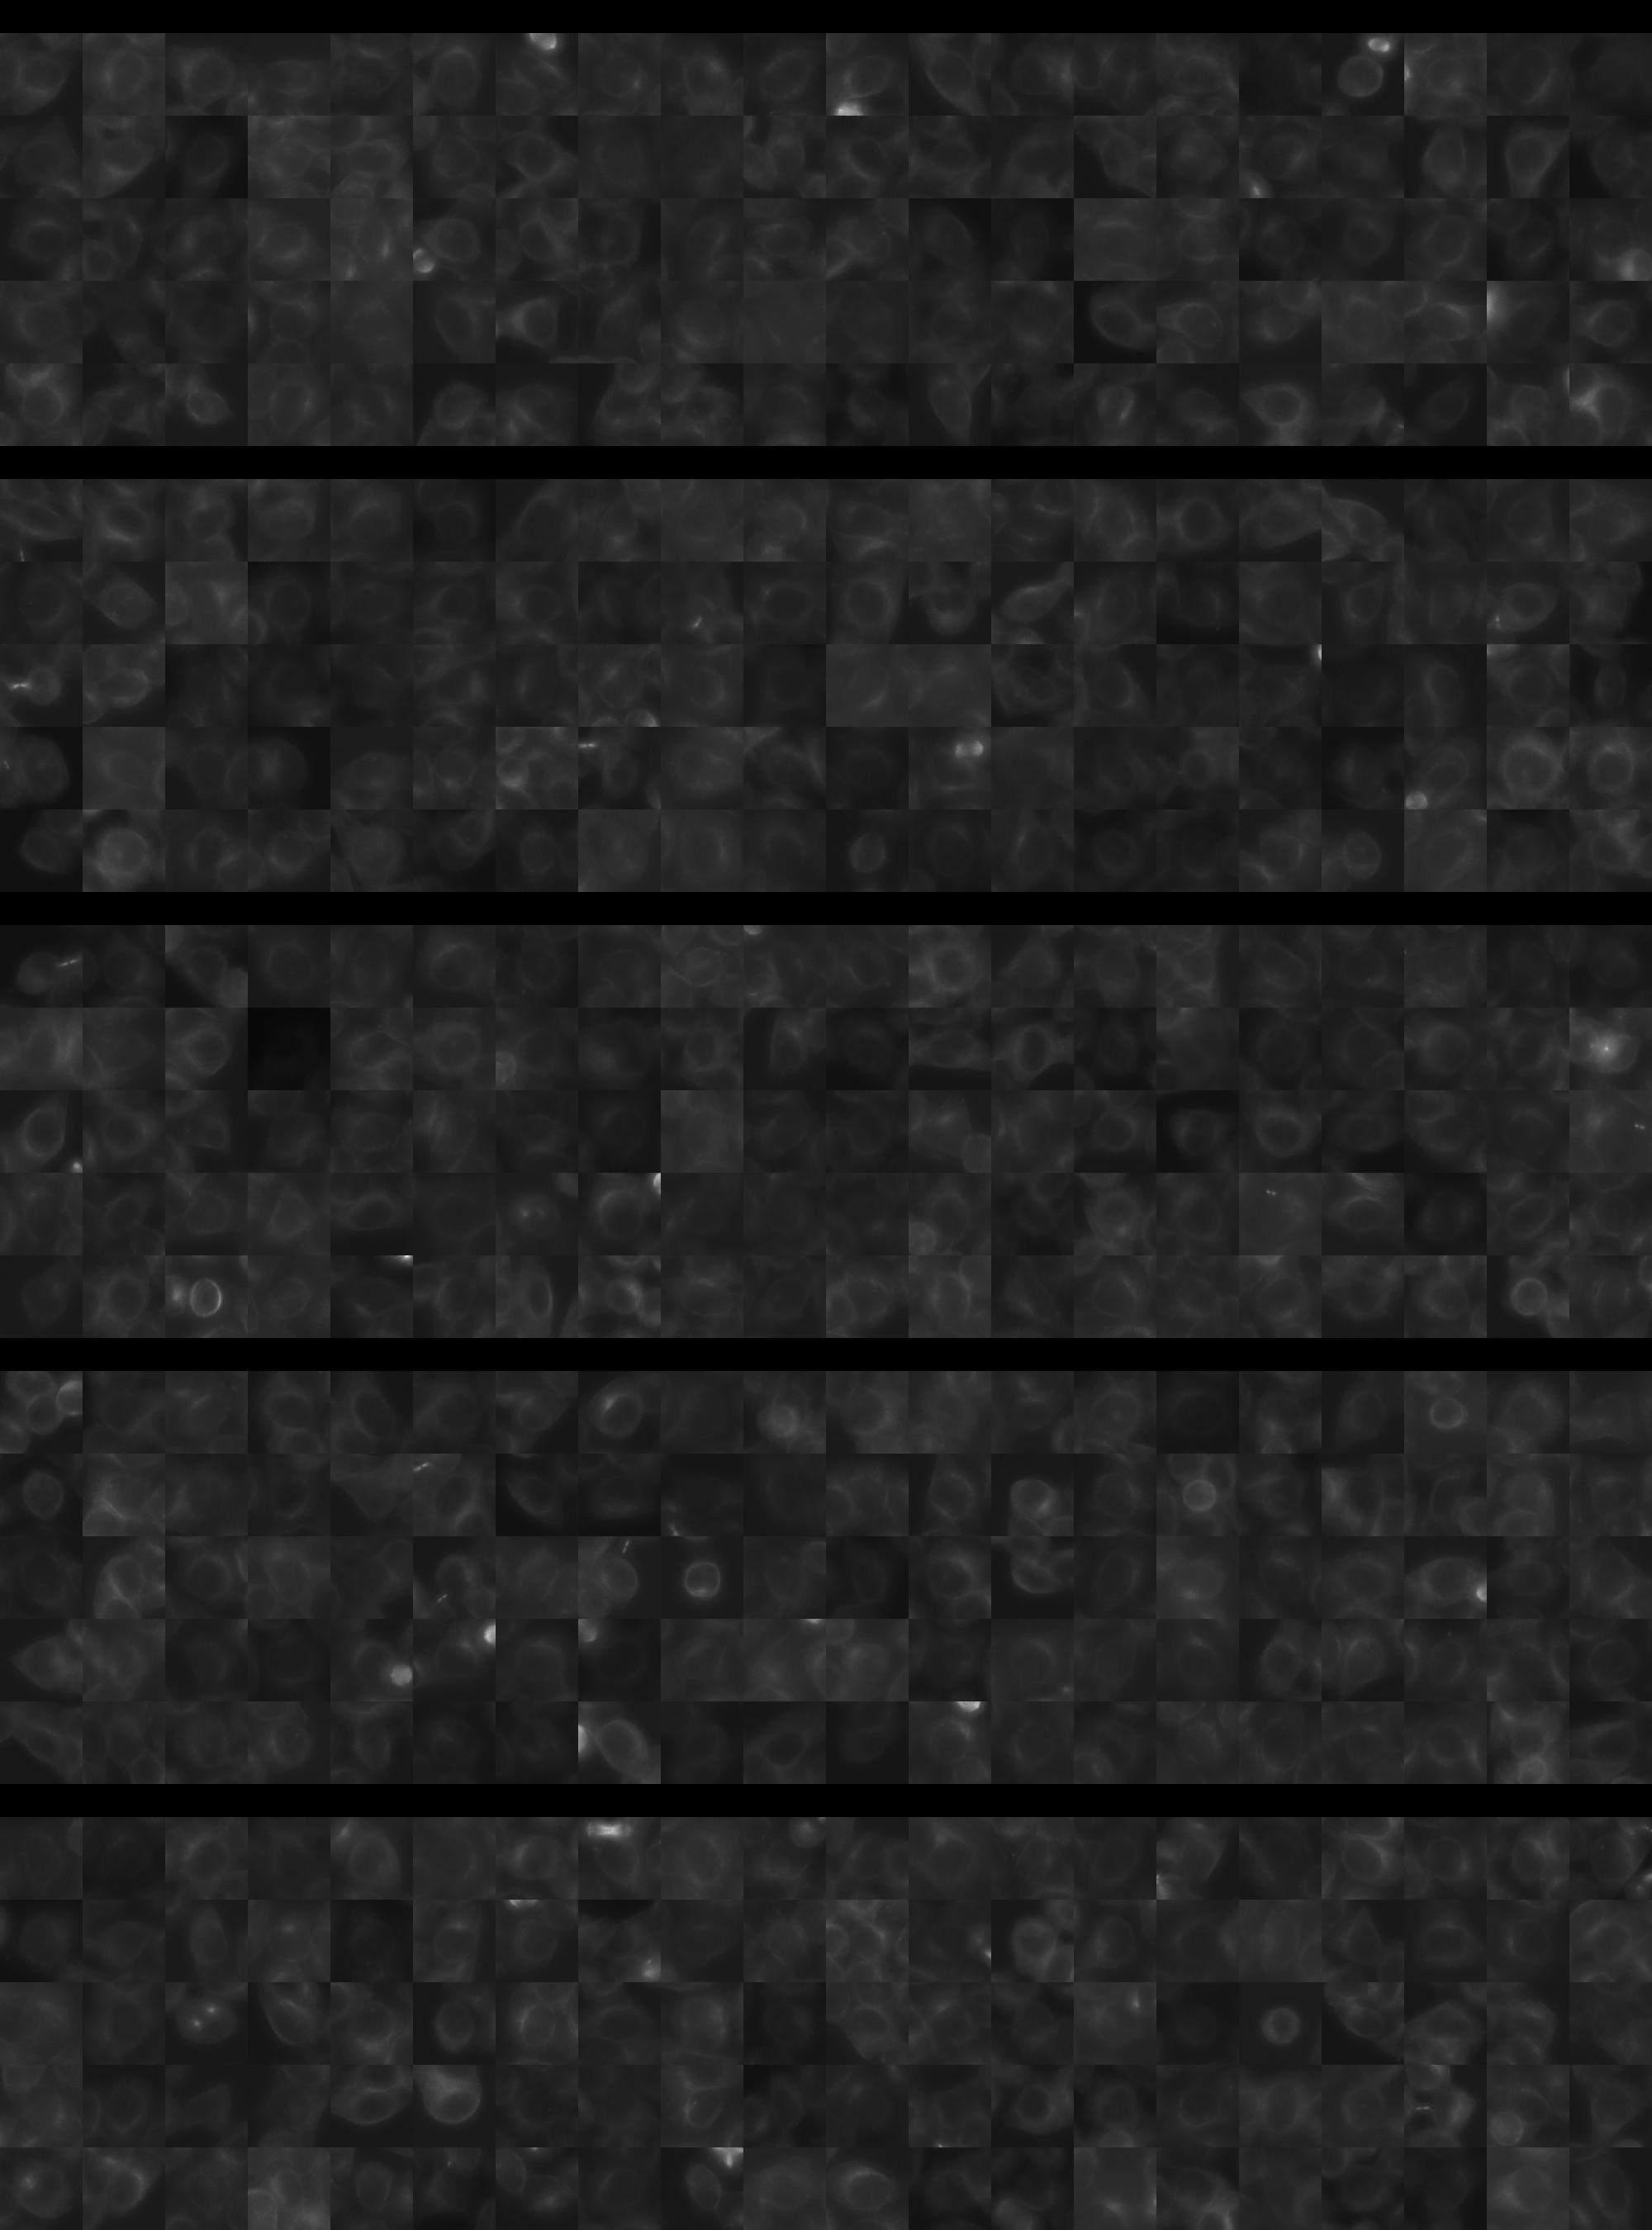
Each montage below shows randomly selected individual cell images for the same target gene separated by sgRNA, along with an example montage of cells expressing a non-targeting negative control sgRNA at the bottom. sgRNA labels in the montages correspond to the numbered sgRNA sequences in the gene info table above. The DNA (blue) and tubulin (green) channels are displayed by default, with gH2AX (grayscale) and actin (yellow) available using the check boxes. Channel brightness, contrast, and opacity are adjustable by clicking the arrow next to the channel name. When only one channel is selected, the display defaults to grayscale. Click the “Zoom” checkbox above the channel controls to enable image zooming (via scrolling) and panning (via click-and-drag).

The cell boxes displayed for this gene are square, 30.36 μm per side for the interphase montage and 30.36 μm per side for the mitotic montage.
Features

Interphase Score Rank FDR q-value
Nucleus DNA Integrated 0.006 2849 of 5322 0.979
Nucleus DNA Mean -1.017e-01 4603 of 5322 0.015
Nucleus gH2AX Mean 0.095 2077 of 5322 0.022
Nucleus DNA - gH2AX Correlation -2.546e-02 1577 of 5322 0.397
Nucleus Shape Area 0.058 1438 of 5322 0.323
Nucleus Shape Eccentricity 0.059 710 of 5322 0.123
Nucleus Shape Form Factor -1.824e-02 1184 of 5322 0.730
Nucleus Shape Solidity 6.917e-04 618 of 5322 0.972
Cell DNA Mass Displacement -1.247e-02 4884 of 5322 0.820
Cell Tubulin Mean 0.013 2232 of 5322 0.784
Cell Tubulin Mass Displacement -2.647e-03 3183 of 5322 0.986
Cell Actin Mean -7.555e-02 4731 of 5322 0.109
Cell Tubulin - Actin Correlation -3.873e-02 4889 of 5322 0.401
Cell DNA - Tubulin Correlation -2.437e-02 4577 of 5322 0.577
Cell Shape Area 0.021 2458 of 5322 0.882
Cell Shape Eccentricity 0.017 2361 of 5322 0.859
Mitotic Score Rank FDR q-value
Nucleus DNA Integrated 0.082 2749 of 5322 0.984
Nucleus DNA Mean -5.779e-02 3814 of 5322 1.000
Nucleus DNA Mass Displacement -1.358e-01 4955 of 5322 0.999
Nucleus DNA Mean Frac 3 -7.899e-02 4208 of 5322 1.000
Nucleus gH2AX Mean 0.354 231 of 5322 1.000
Nucleus gH2AX Mean Frac 0 -7.751e-02 3471 of 5322 1.000
Nucleus Tubulin Mean Frac 0 0.125 1610 of 5322 0.999
Nucleus Tubulin Mean Edge 0.220 663 of 5322 0.999
Nucleus Tubulin Std Edge 0.041 1983 of 5322 0.999
Nucleus Shape Area 0.045 3410 of 5322 0.990
Nucleus Shape Eccentricity 0.056 1304 of 5322 1.000
Nucleus Shape Form Factor -8.069e-02 2578 of 5322 0.998
Cell Tubulin Mean 0.292 462 of 5322 0.997
Cell Tubulin Mean Frac 3 -3.384e-01 4873 of 5322 0.999
Cell Actin Mean 0.072 2253 of 5322 0.997
Cell Shape Area 0.129 2216 of 5322 0.998
( Reset Zoom )
Brightness
Contrast
Opacity
Brightness
Contrast
Opacity
Brightness
Contrast
Opacity
Brightness
Contrast
Opacity
Brightness
Contrast
Opacity

( Reset Zoom )
Brightness
Contrast
Opacity
Brightness
Contrast
Opacity
Brightness
Contrast
Opacity
Brightness
Contrast
Opacity
Brightness
Contrast
Opacity

MIT Central Accessability