ITGAV

Gene symbol: ITGAV
Gene: 3685
Uniprot Function: The alpha-V (ITGAV) integrins are receptors for vitronectin, cytotactin, fibronectin, fibrinogen, laminin, matrix metalloproteinase-2, osteopontin, osteomodulin, prothrombin, thrombospondin and vWF. They recognize the sequence R-G-D in a wide array of ligands. ITGAV:ITGB3 binds to fractalkine (CX3CL1) and may act as its coreceptor in CX3CR1-dependent fractalkine signaling (PubMed:23125415). ITGAV:ITGB3 binds to NRG1 (via EGF domain) and this binding is essential for NRG1-ERBB signaling (PubMed:20682778). ITGAV:ITGB3 binds to FGF1 and this binding is essential for FGF1 signaling (PubMed:18441324). ITGAV:ITGB3 binds to FGF2 and this binding is essential for FGF2 signaling (PubMed:28302677). ITGAV:ITGB3 binds to IGF1 and this binding is essential for IGF1 signaling (PubMed:19578119). ITGAV:ITGB3 binds to IGF2 and this binding is essential for IGF2 signaling (PubMed:28873464). ITGAV:ITGB3 binds to IL1B and this binding is essential for IL1B signaling (PubMed:29030430). ITGAV:ITGB3 binds to PLA2G2A via a site (site 2) which is distinct from the classical ligand-binding site (site 1) and this induces integrin conformational changes and enhanced ligand binding to site 1 (PubMed:18635536, PubMed:25398877). ITGAV:ITGB3 and ITGAV:ITGB6 act as a receptor for fibrillin-1 (FBN1) and mediate R-G-D-dependent cell adhesion to FBN1 (PubMed:12807887, PubMed:17158881). Integrin alpha-V/beta-6 or alpha-V/beta-8 (ITGAV:ITGB6 or ITGAV:ITGB8) mediates R-G-D-dependent release of transforming growth factor beta-1 (TGF-beta-1) from regulatory Latency-associated peptide (LAP), thereby playing a key role in TGF-beta-1 activation (PubMed:15184403, PubMed:22278742, PubMed:28117447). ITGAV:ITGB3 act as a receptor for CD40LG (PubMed:31331973).
Mitotic Index 0.0185
Interphase Cluster: #29 (35 genes)
Mitotic Cluster: #45 (30 genes)
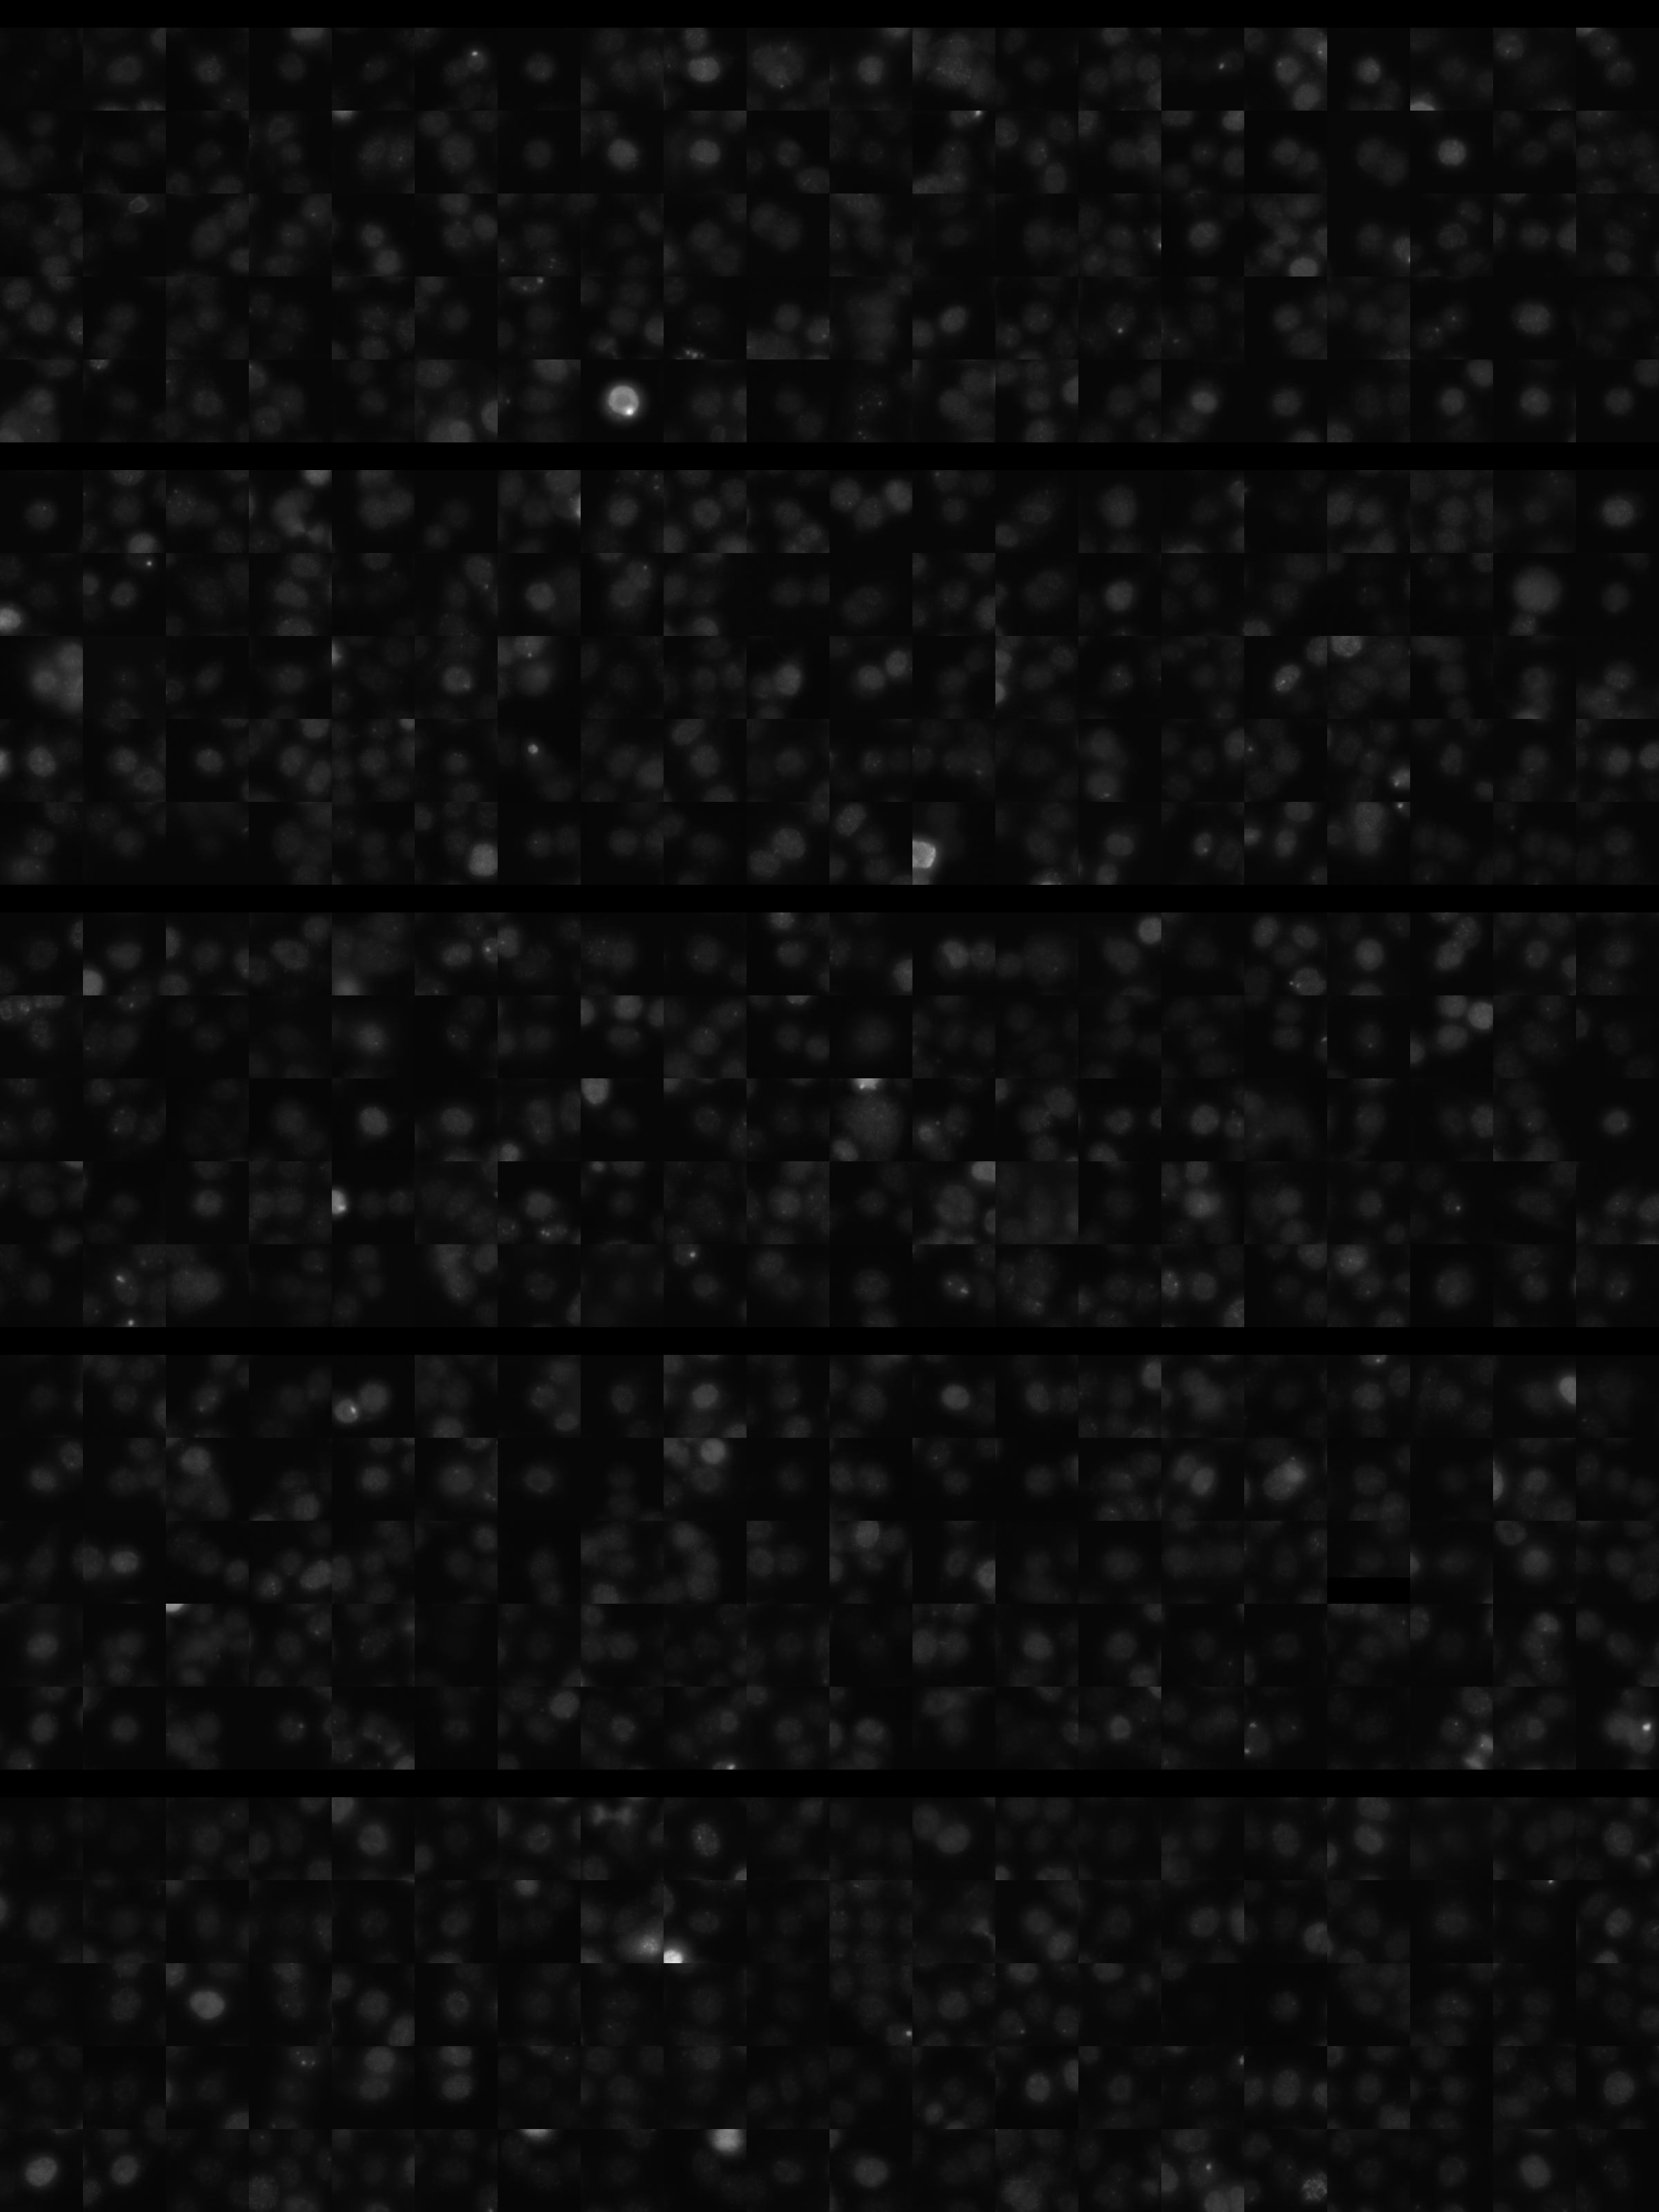
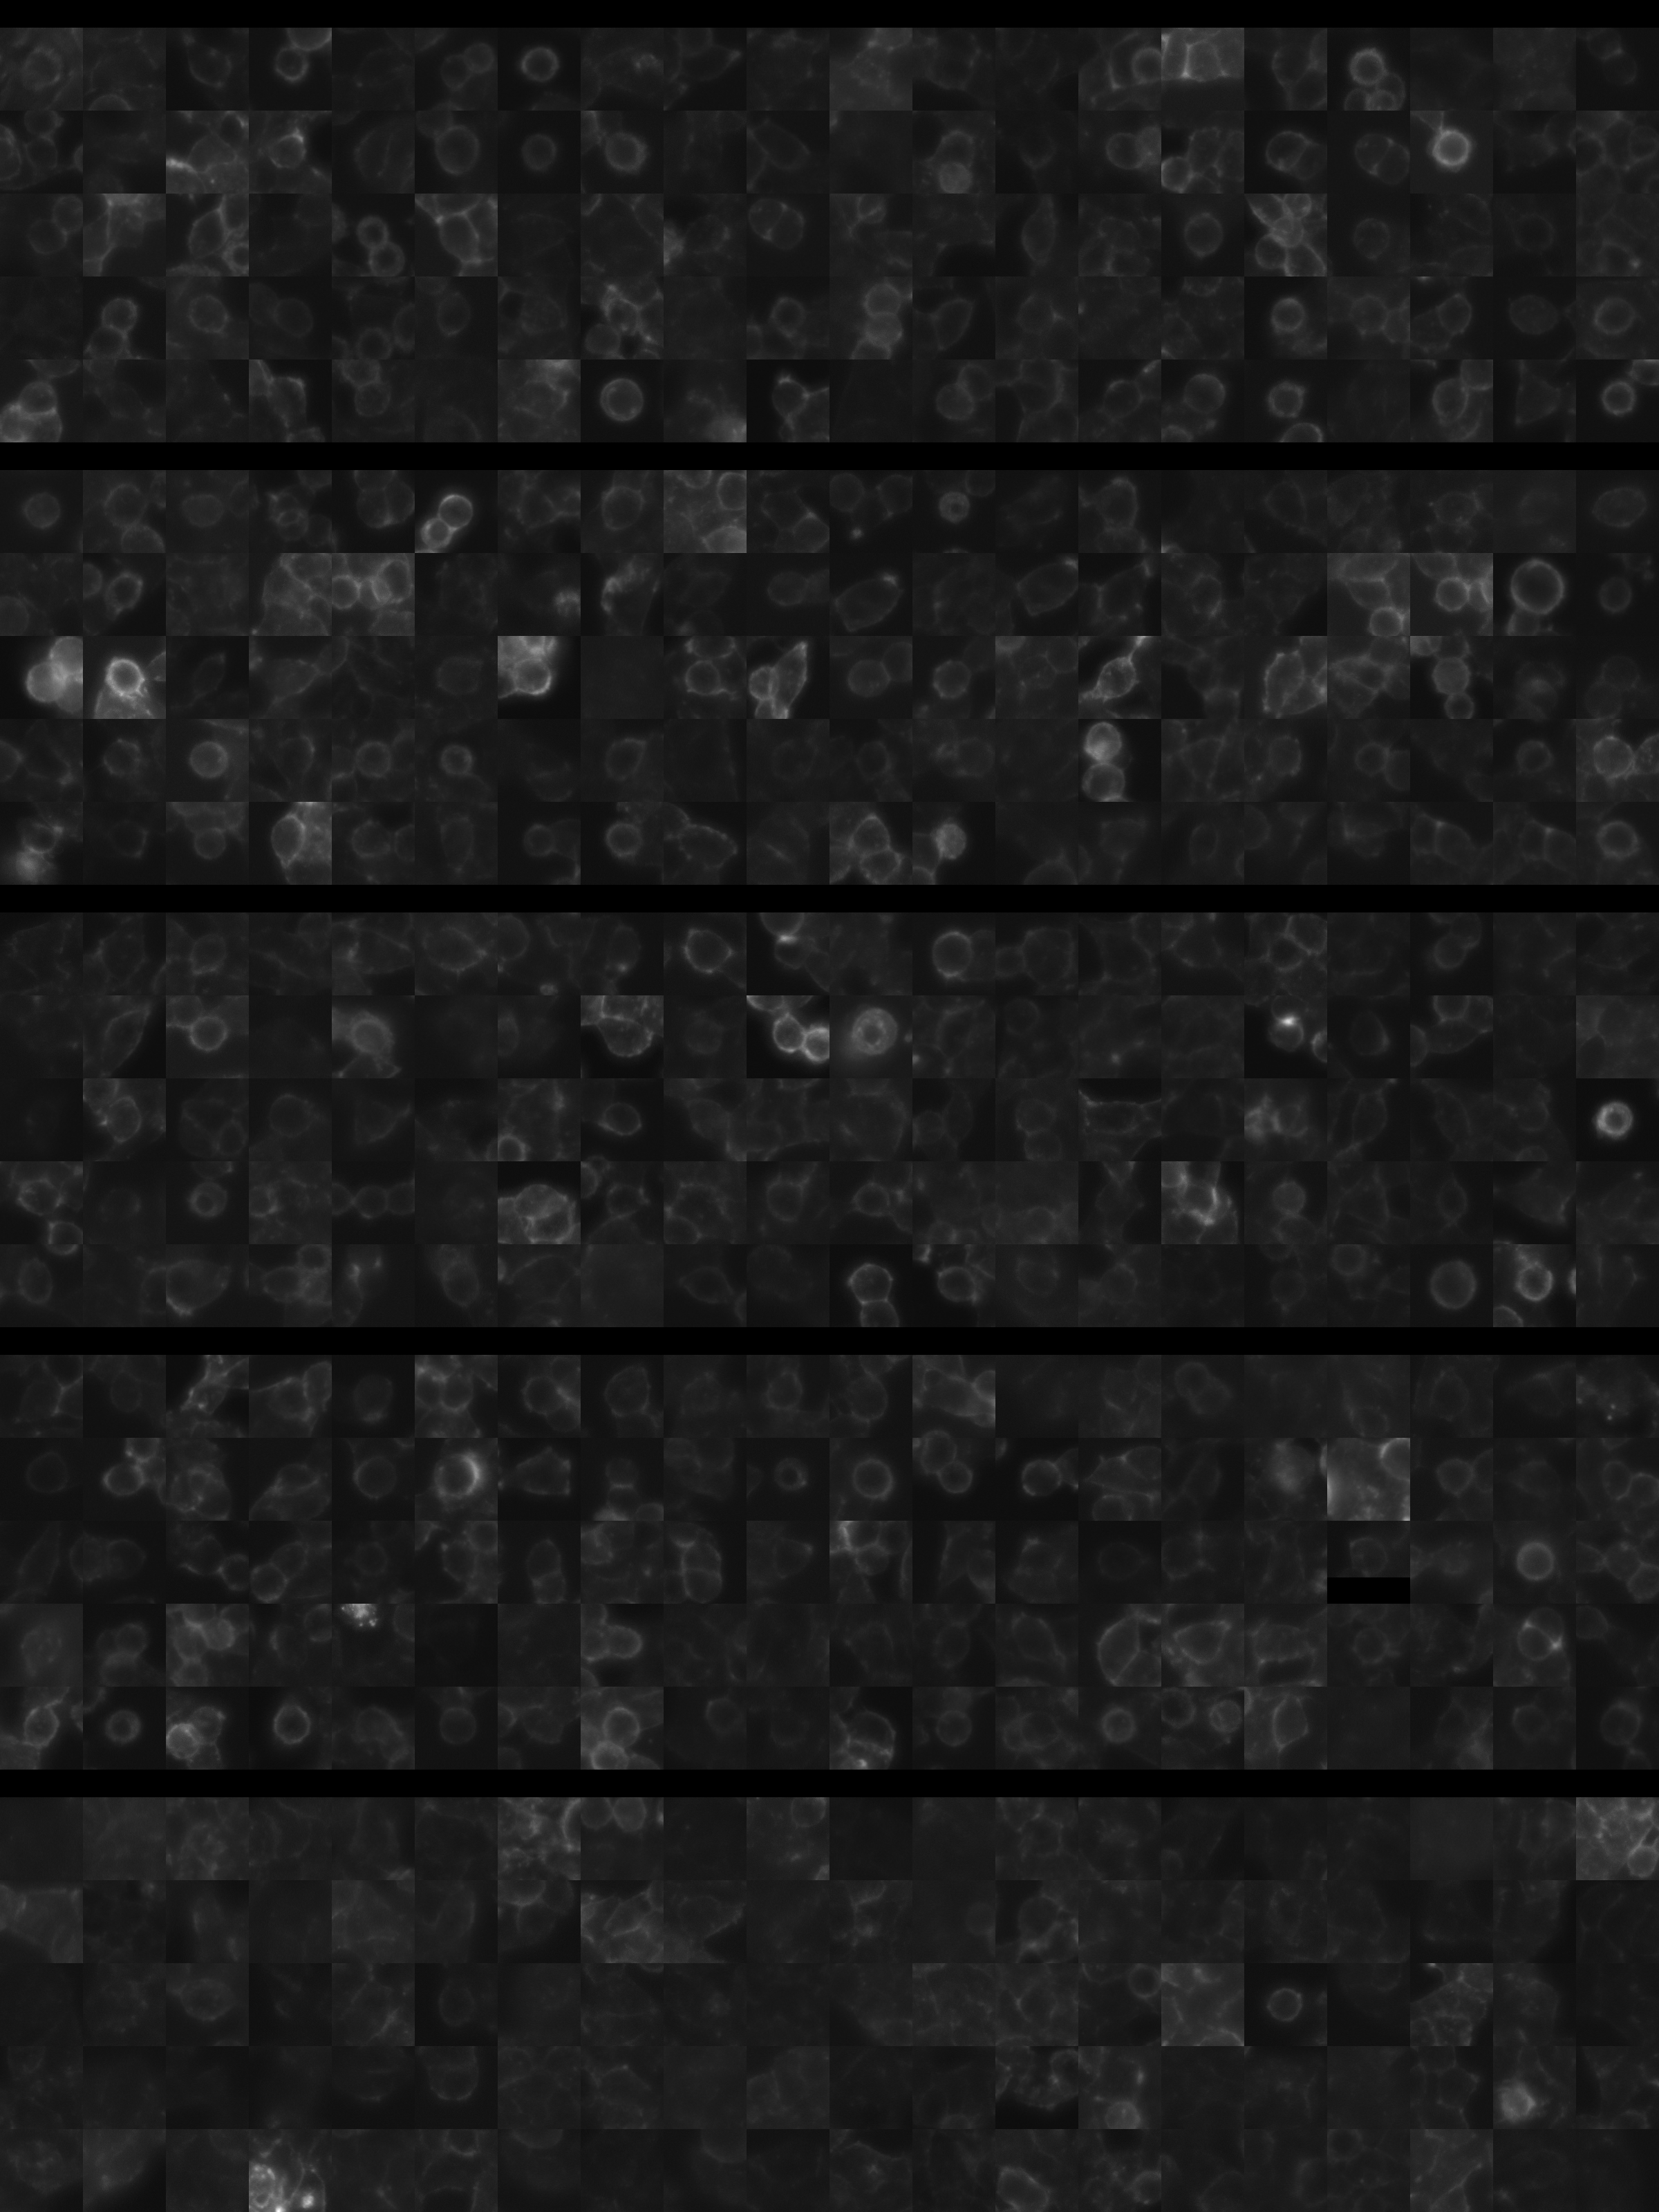
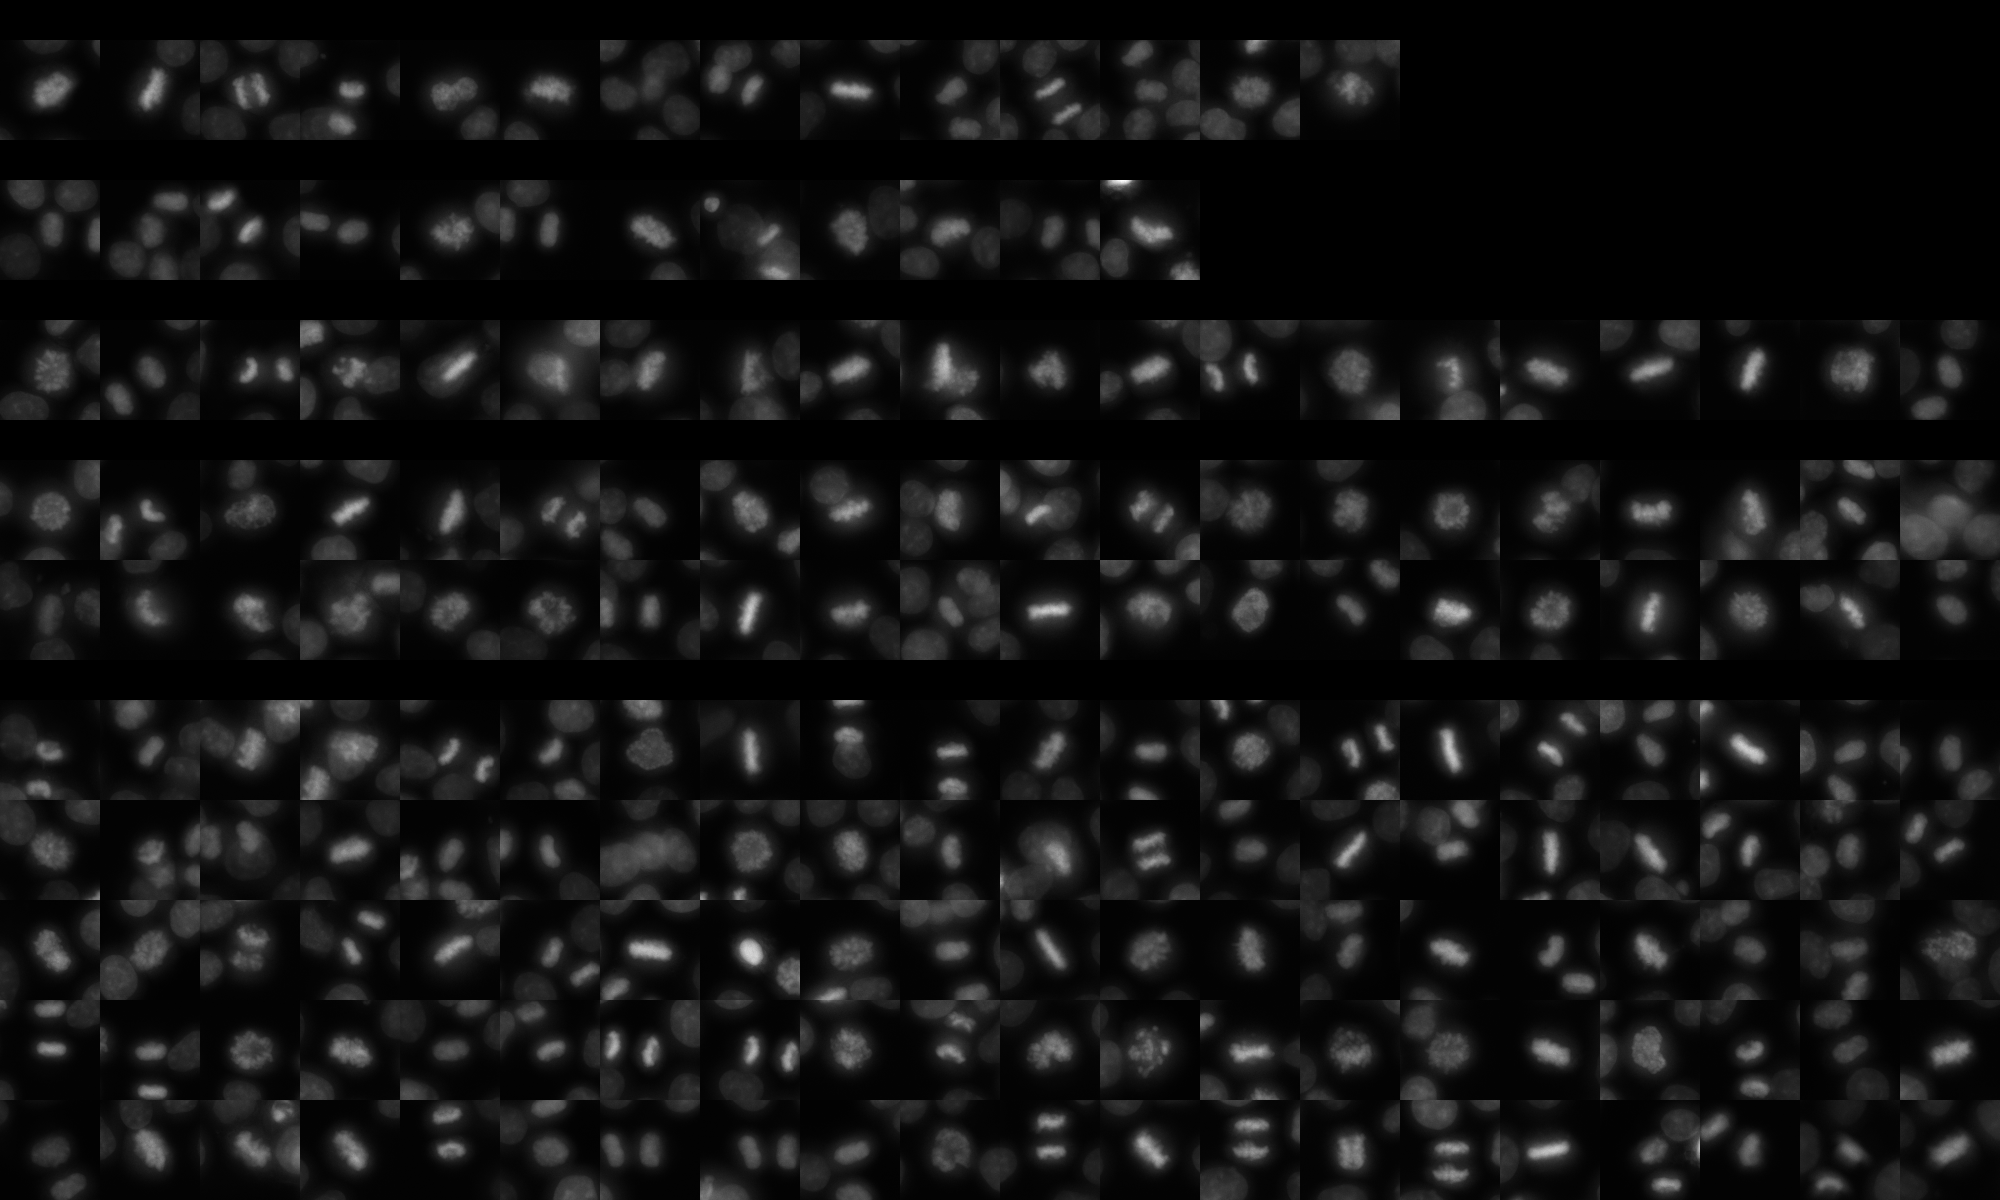
sgRNA 1: AACGATGAGCTCAGCTTCGT (interphase cells: 1099, mitotic cells: 14)
sgRNA 2: AAGTTACTTCGGCTTCGCCG (interphase cells: 752, mitotic cells: 12)
sgRNA 3: AGAACATGACTATTTCAAGG (interphase cells: 1187, mitotic cells: 20)
sgRNA 4: GCACCTCTCTTCATGGATCG (interphase cells: 1537, mitotic cells: 40)

Interphase Cluster

Mitotic Cluster

Overview

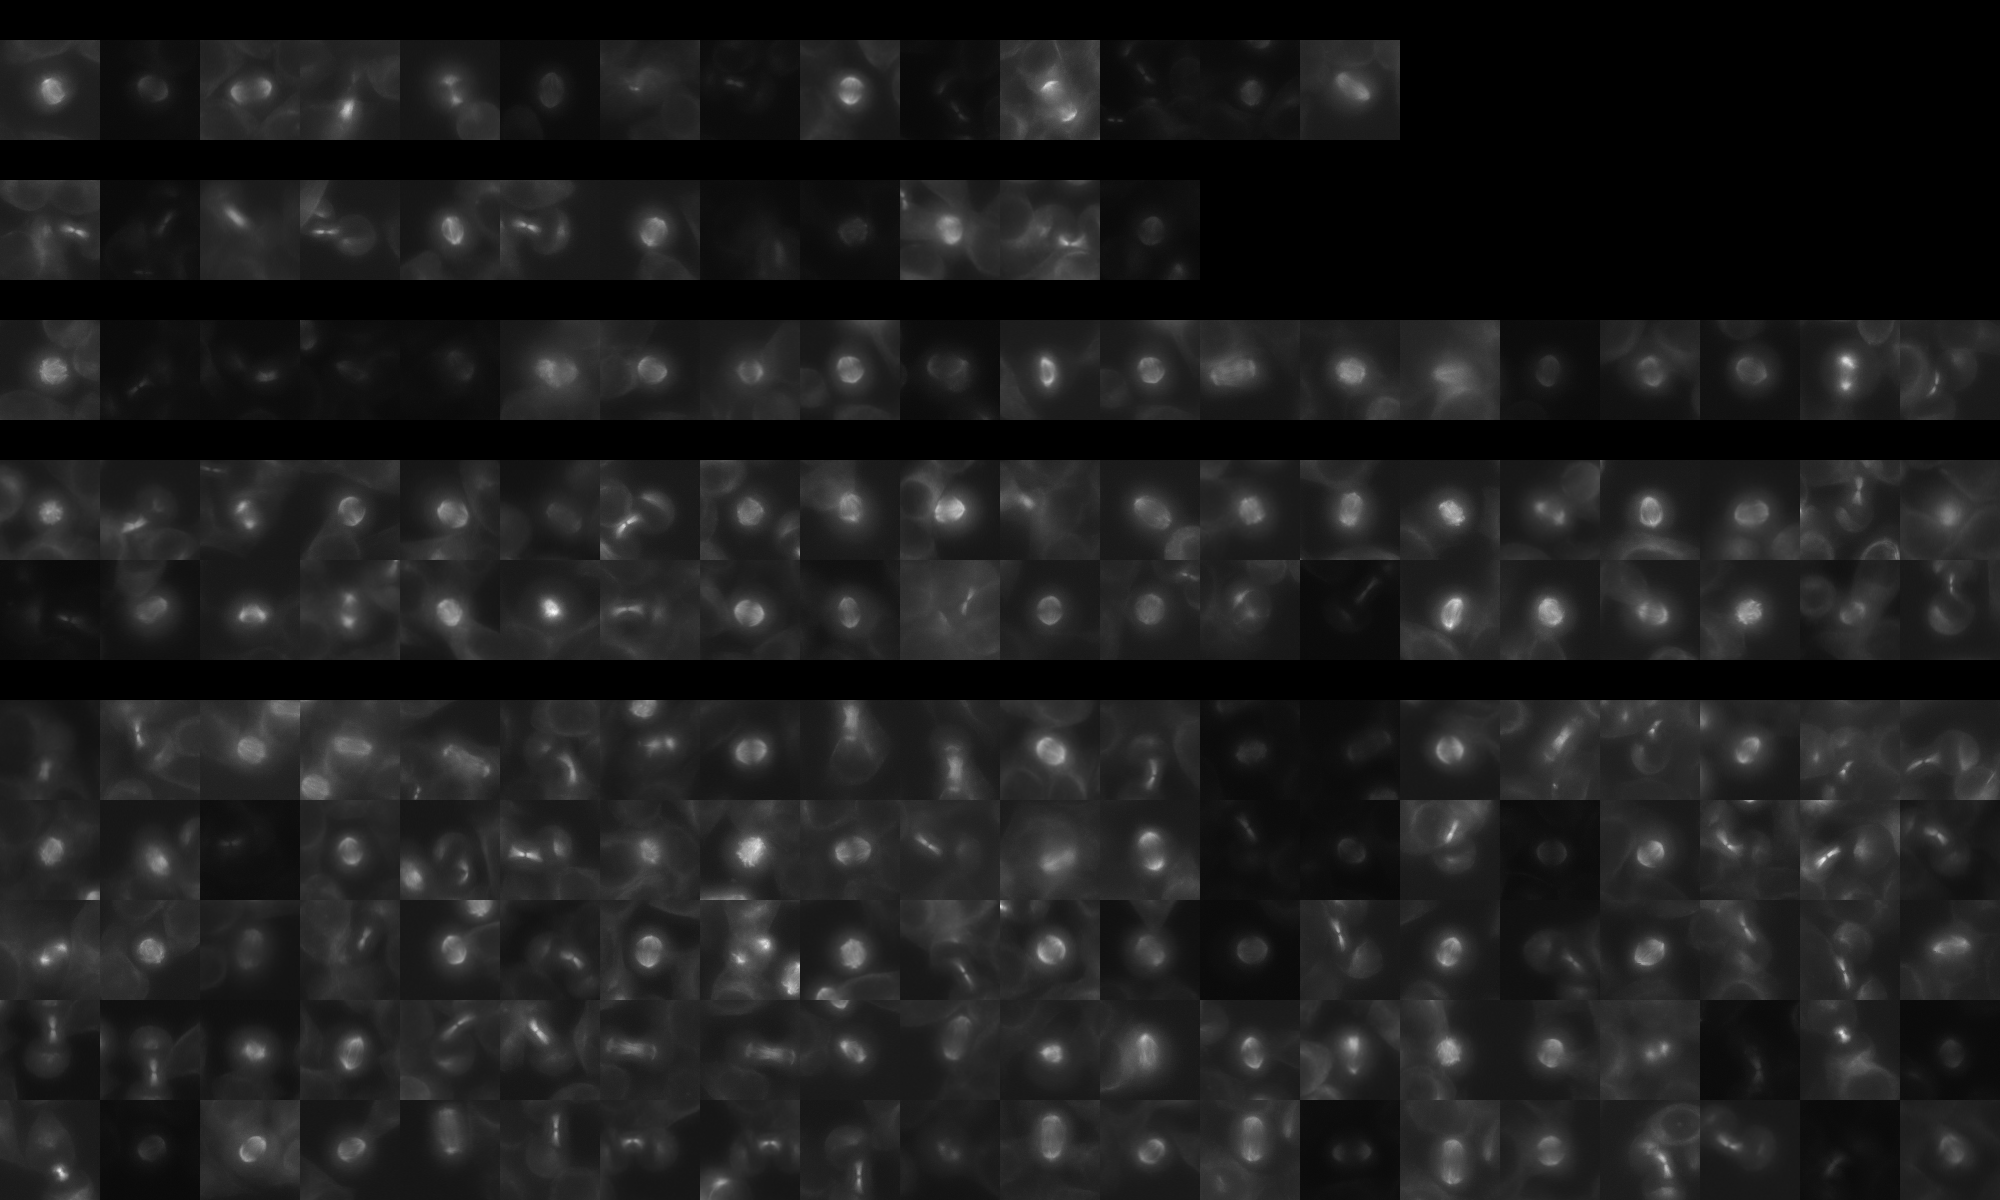
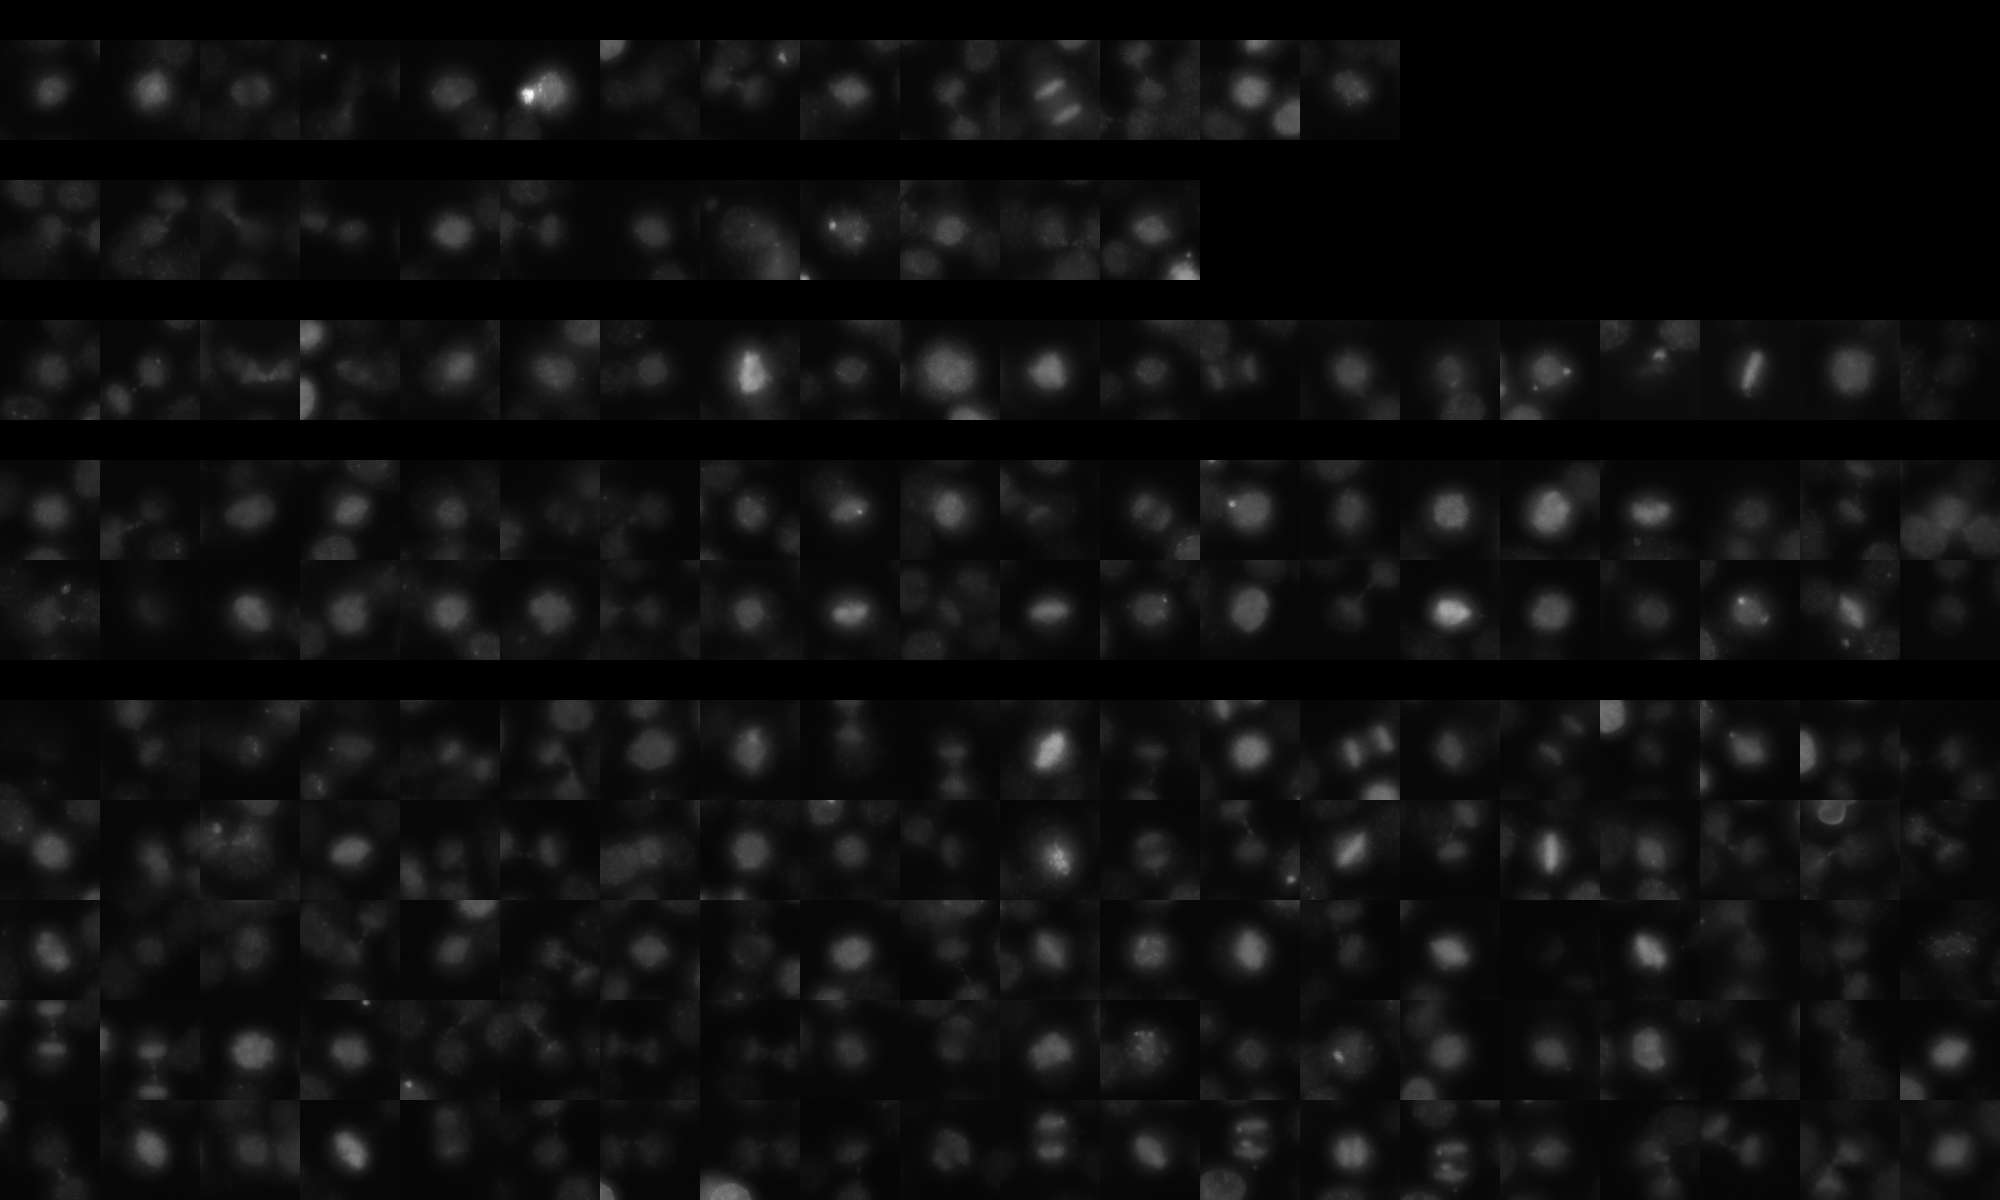
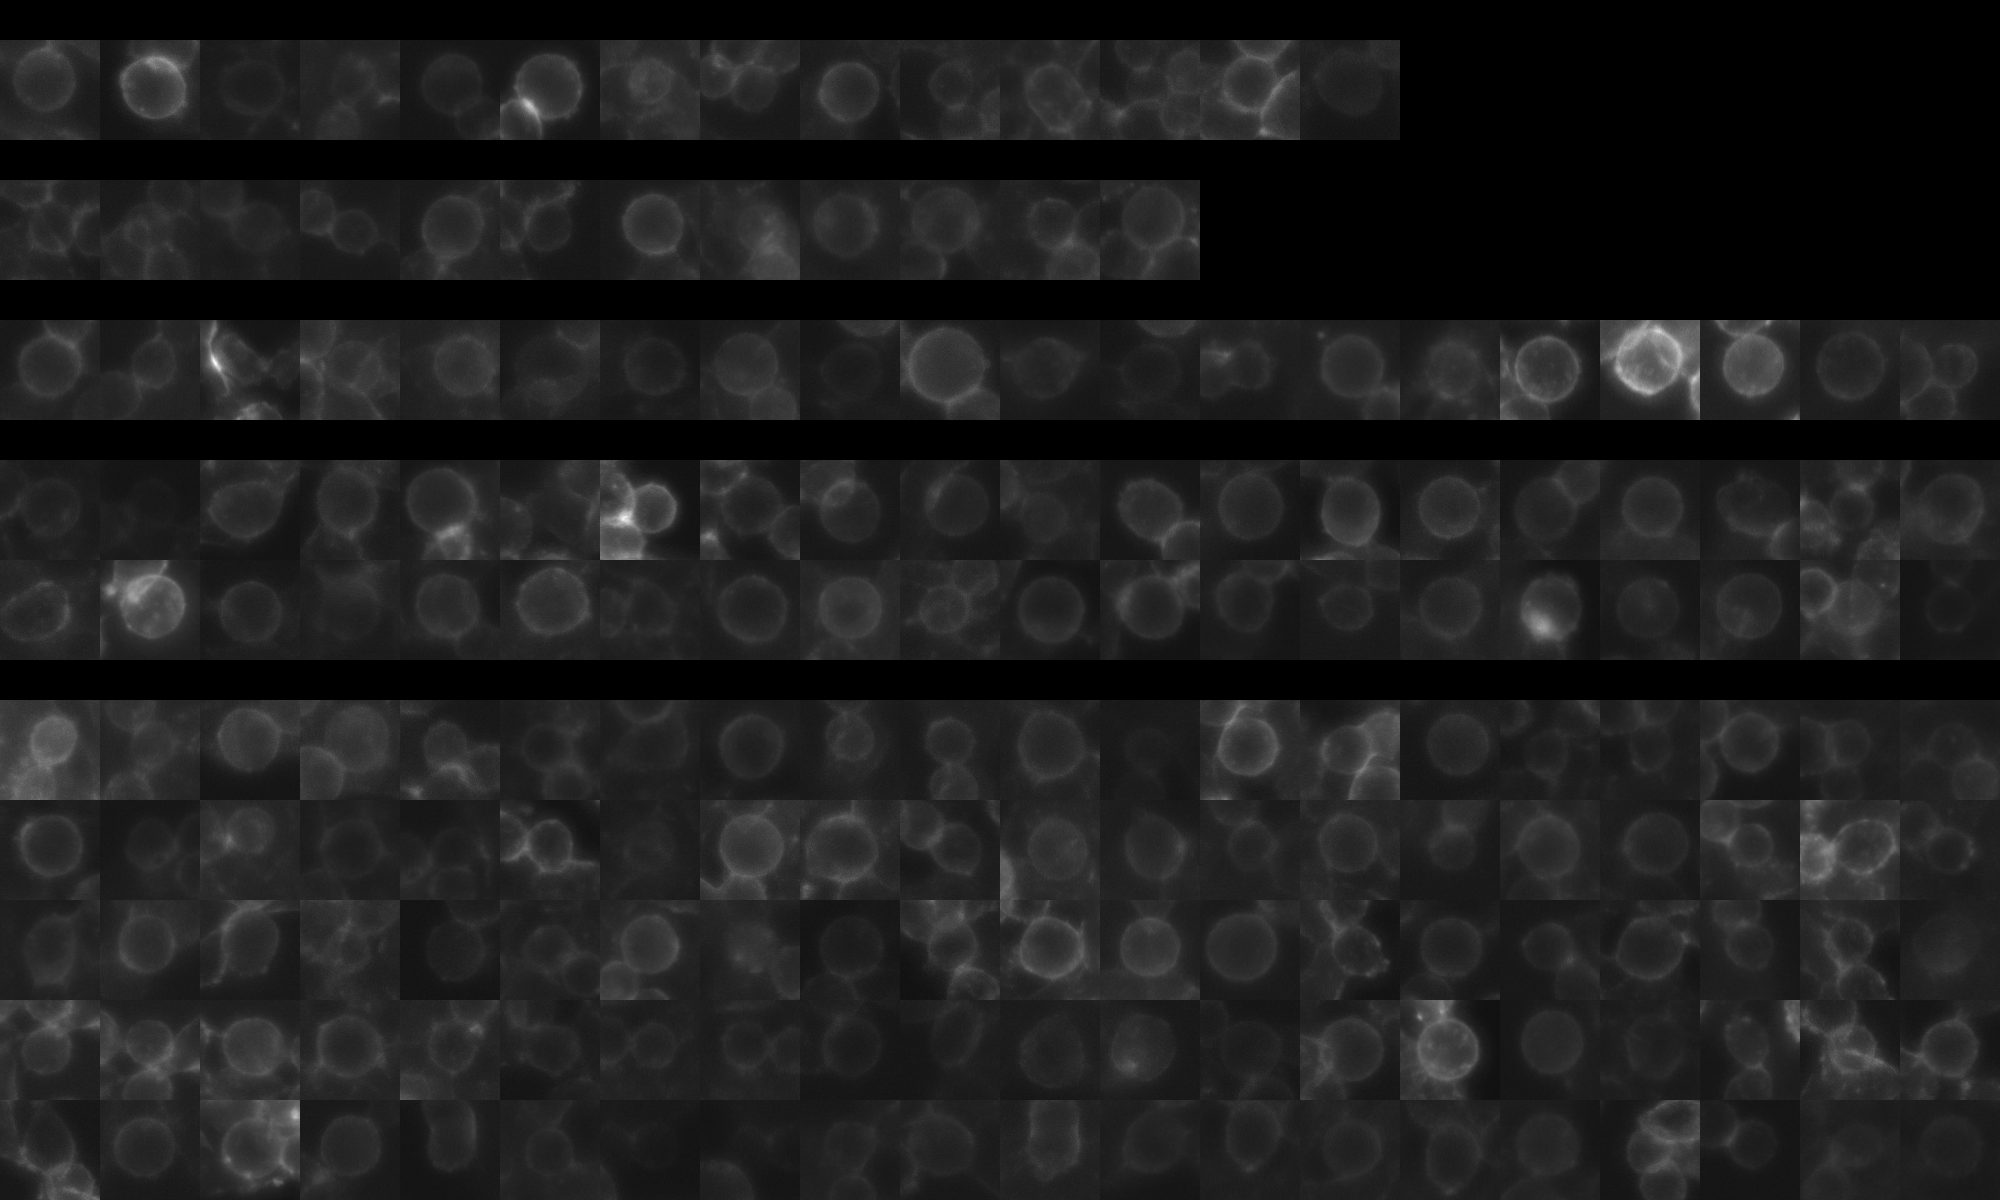
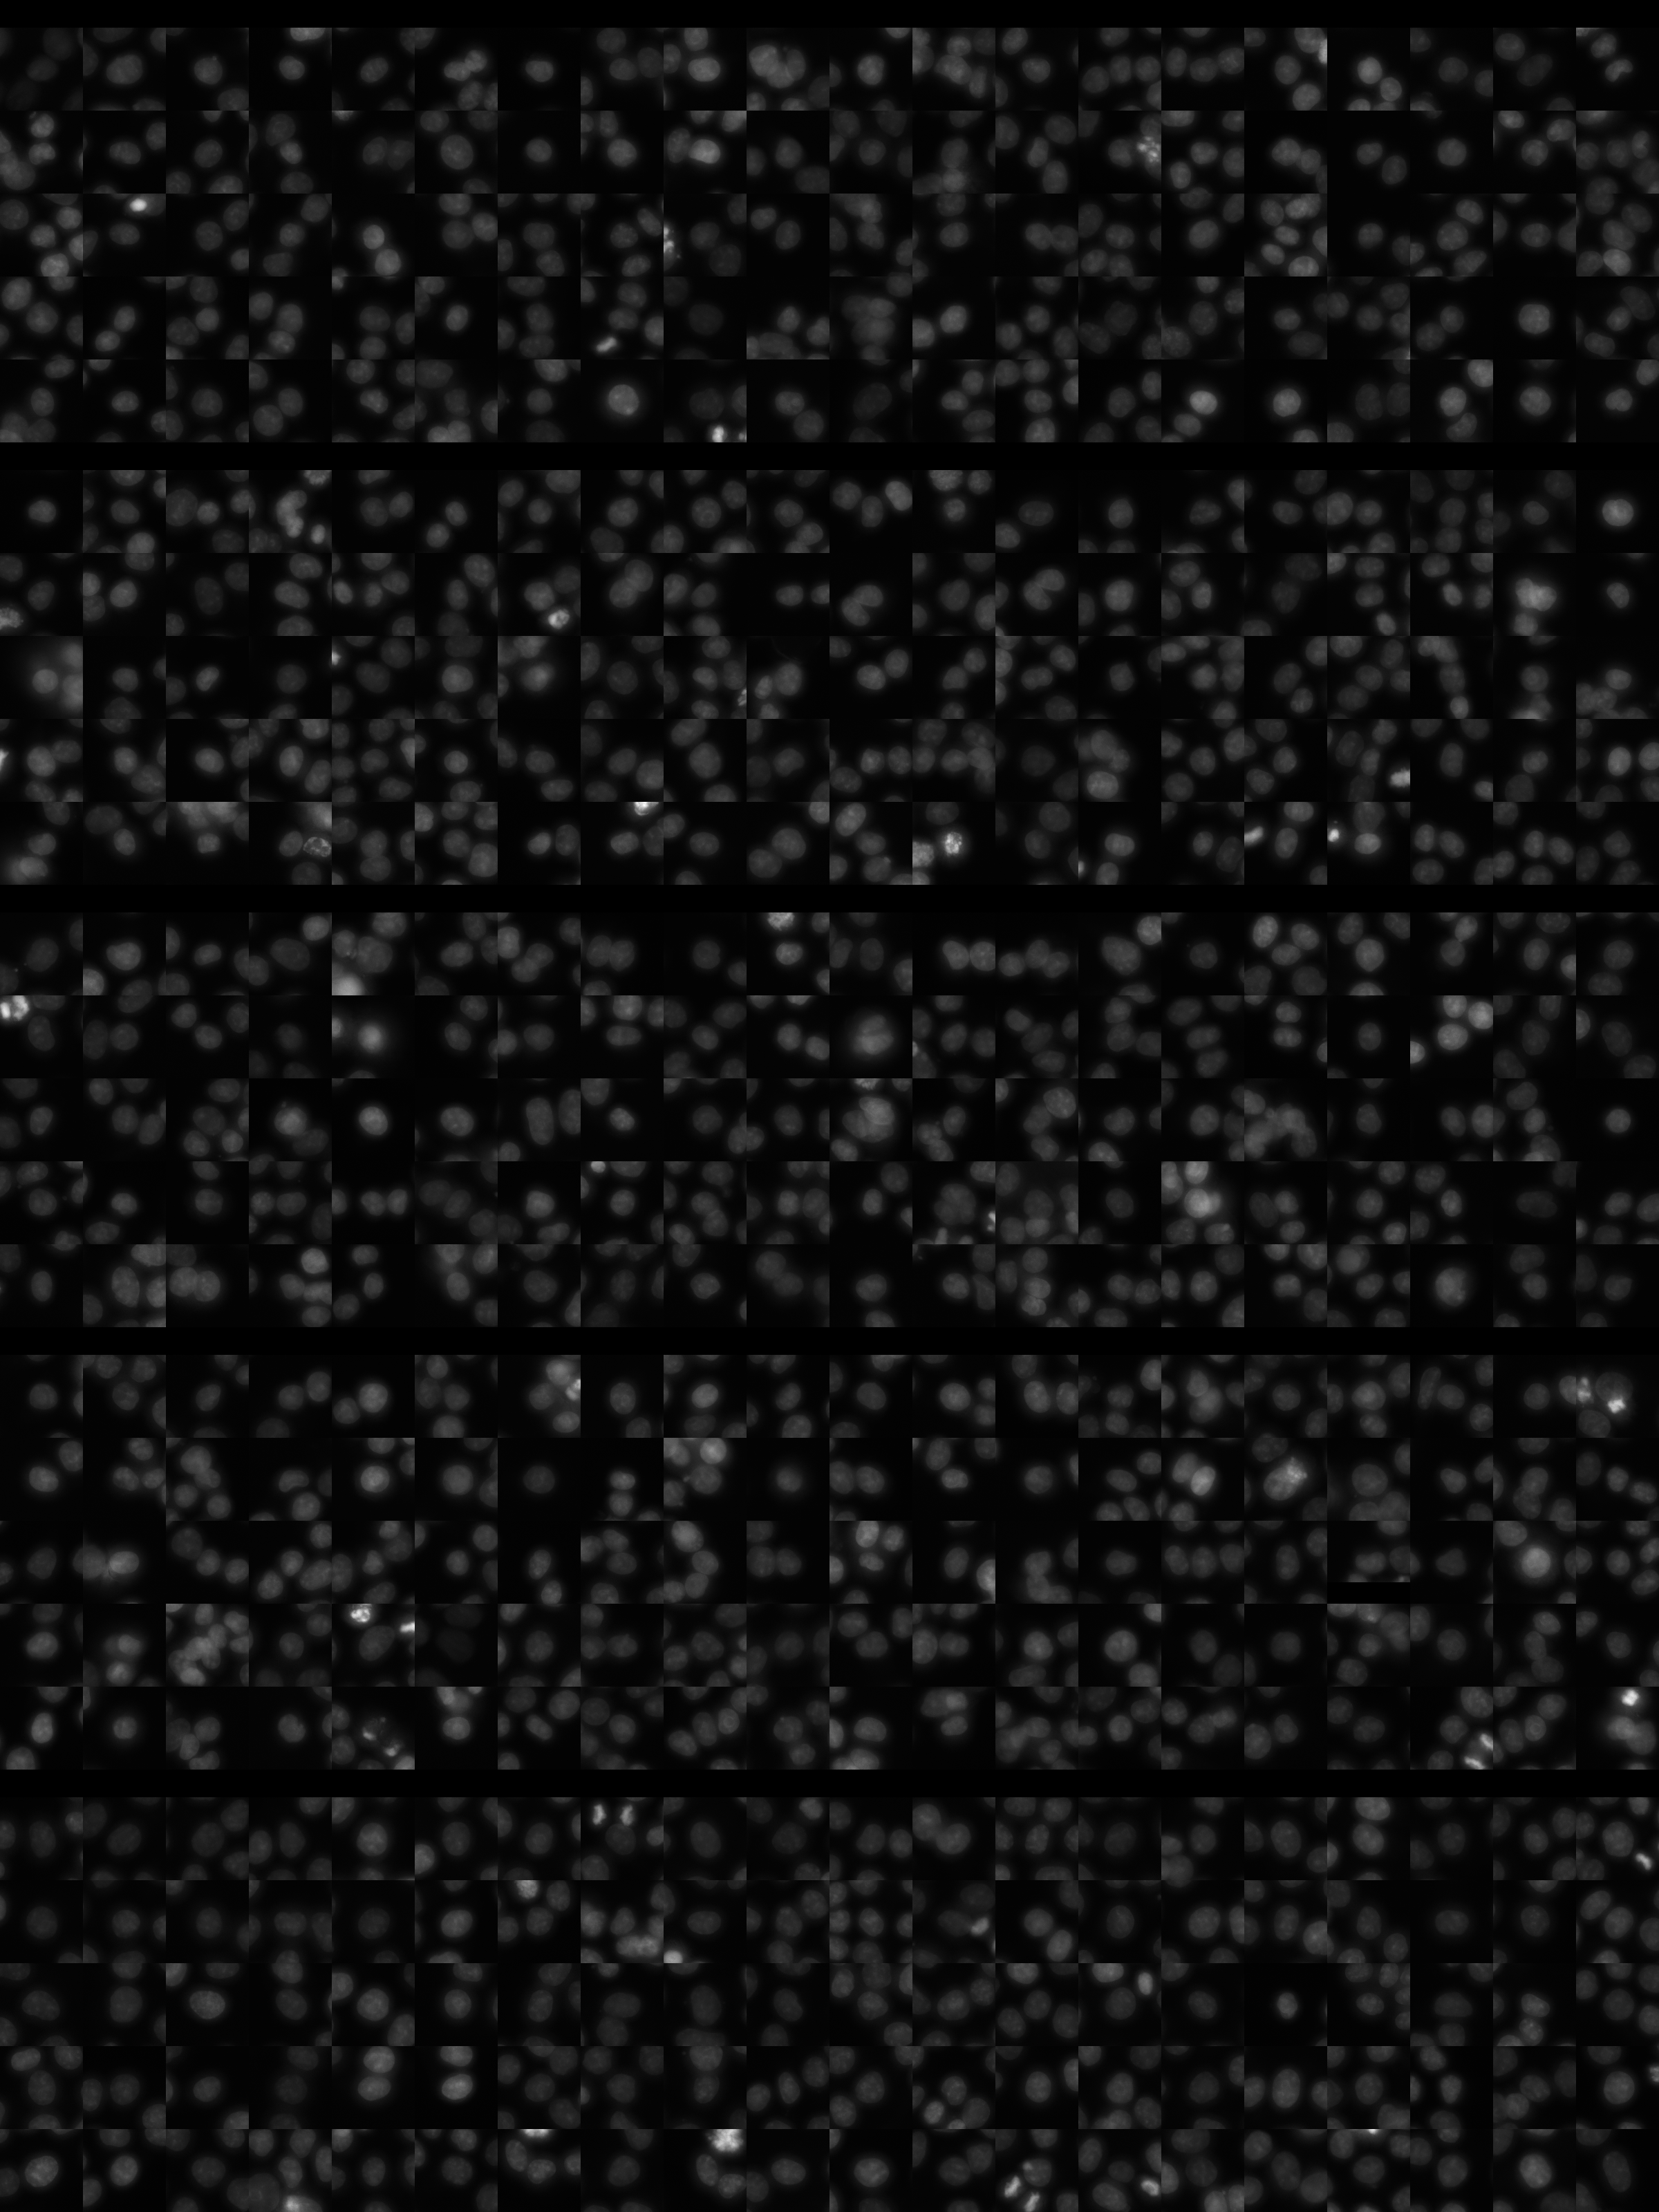
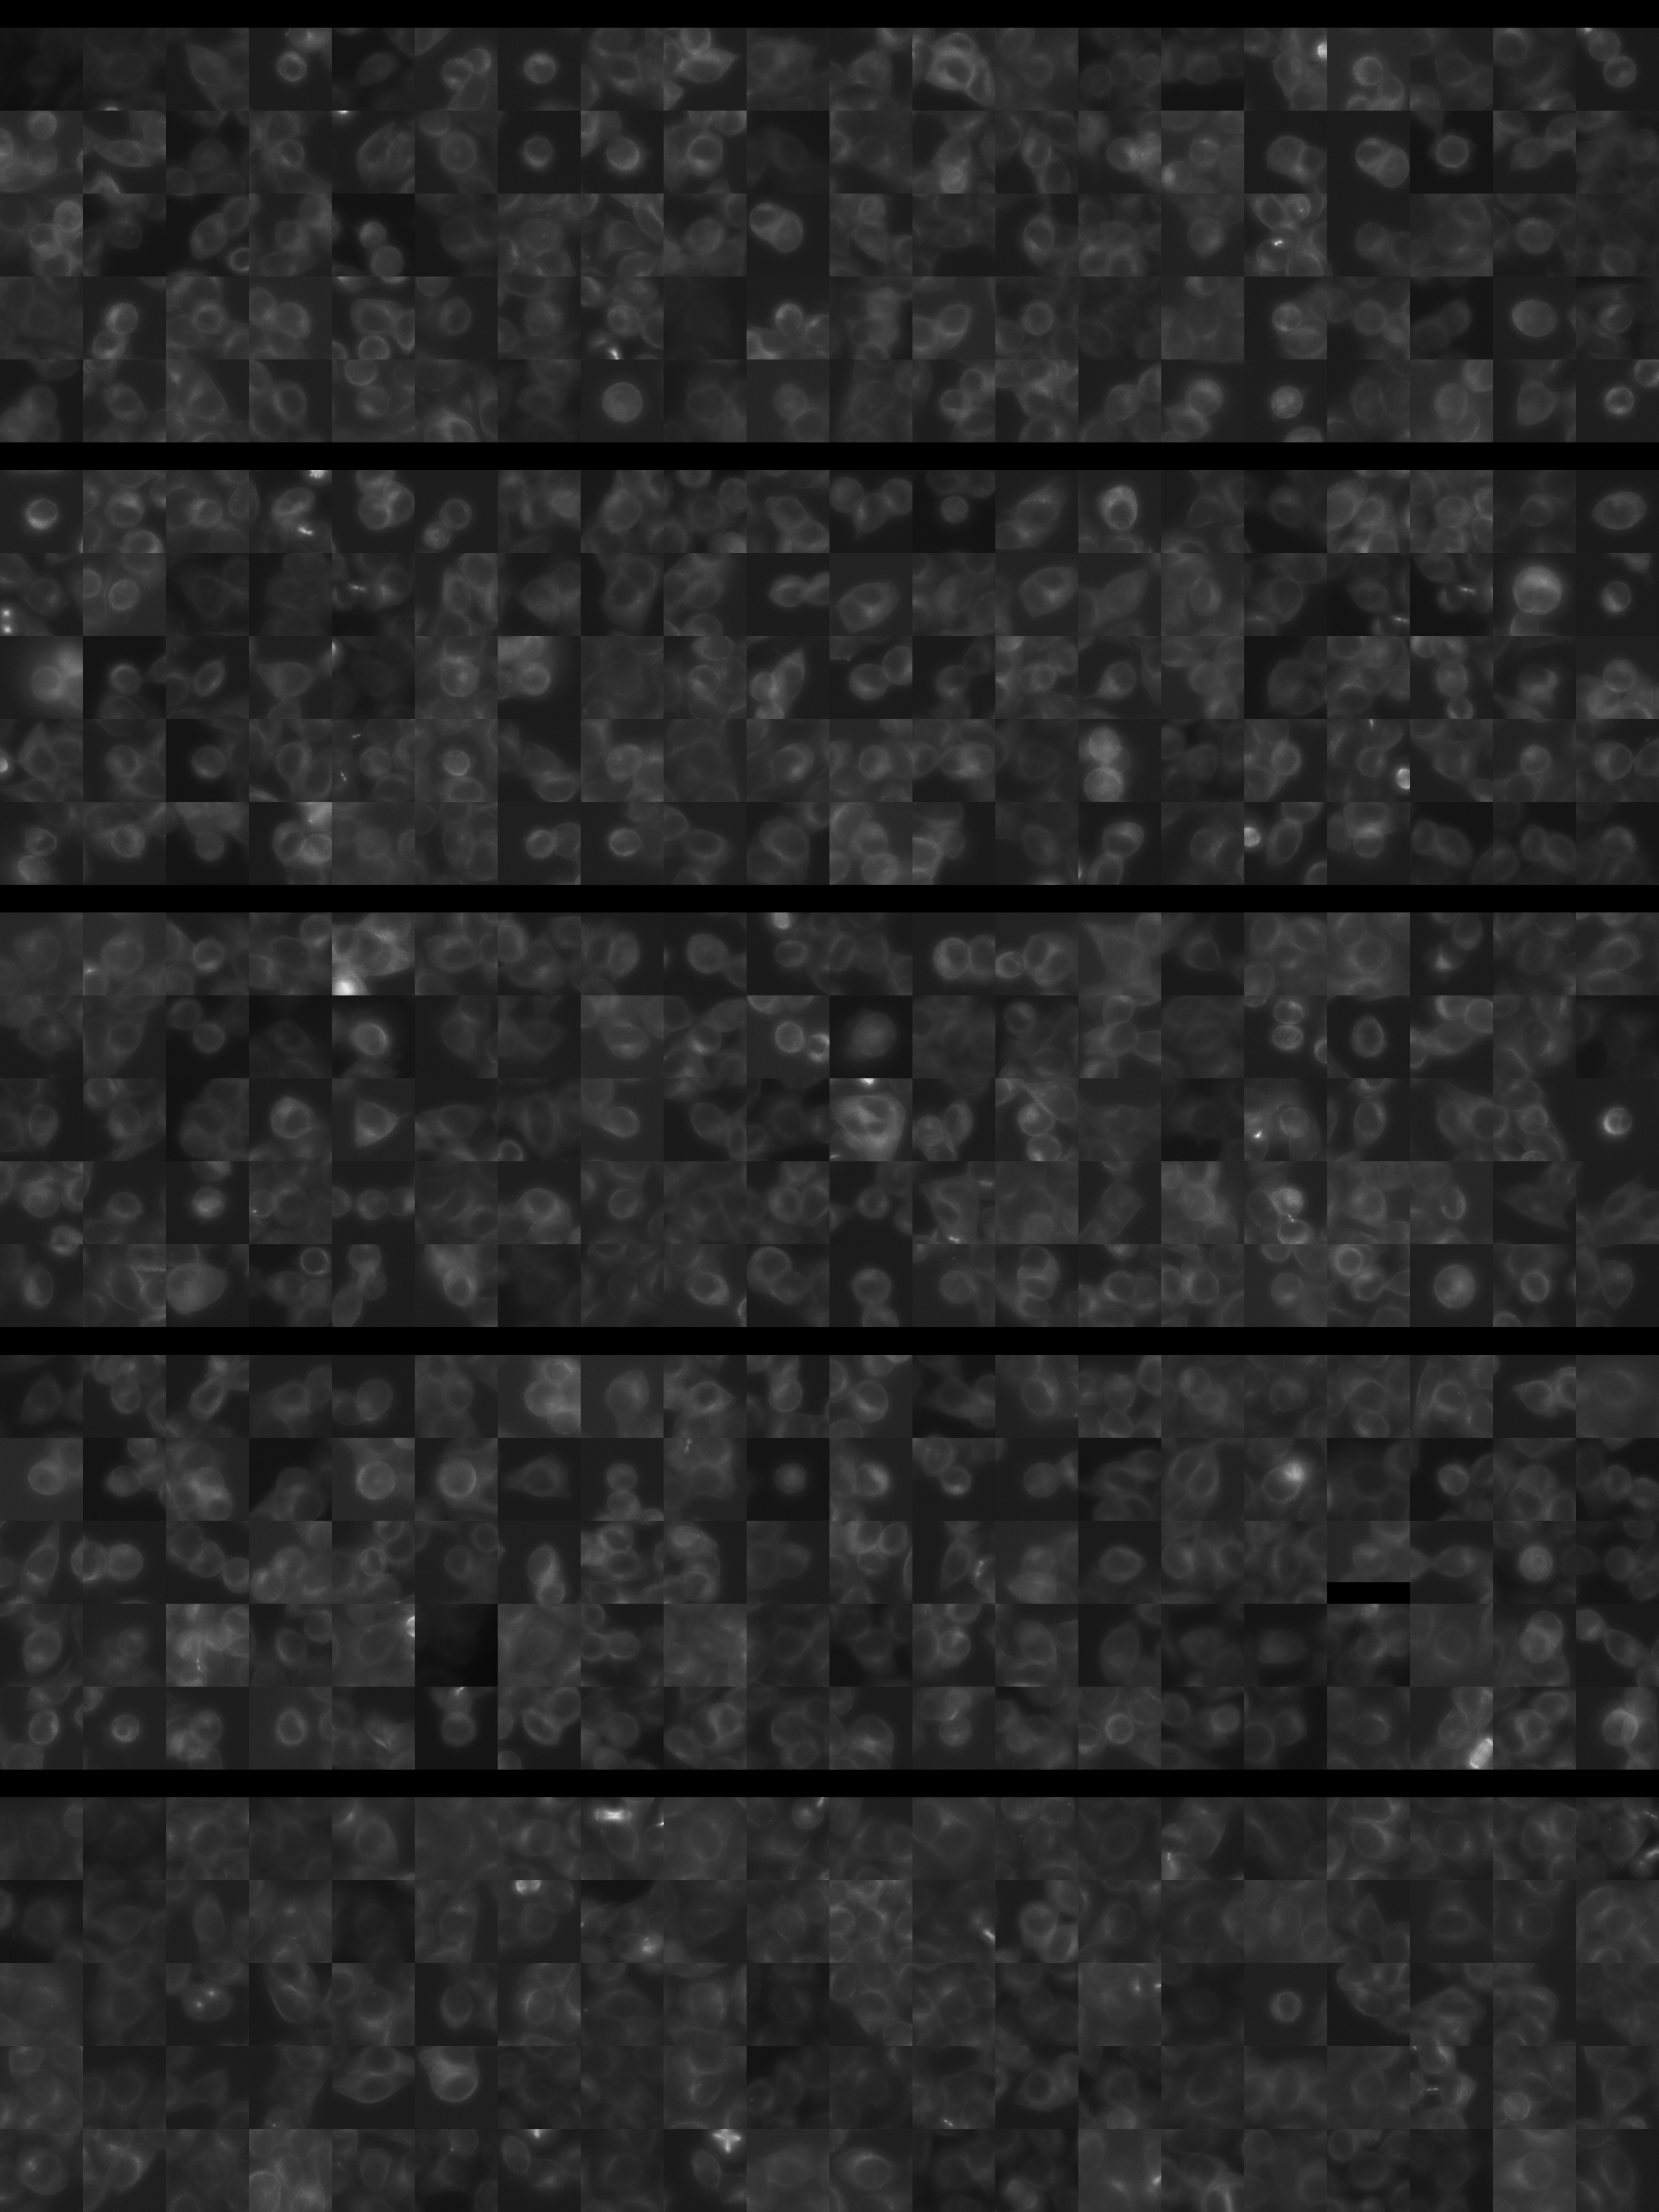
Each montage below shows randomly selected individual cell images for the same target gene separated by sgRNA, along with an example montage of cells expressing a non-targeting negative control sgRNA at the bottom. sgRNA labels in the montages correspond to the numbered sgRNA sequences in the gene info table above. The DNA (blue) and tubulin (green) channels are displayed by default, with gH2AX (grayscale) and actin (yellow) available using the check boxes. Channel brightness, contrast, and opacity are adjustable by clicking the arrow next to the channel name. When only one channel is selected, the display defaults to grayscale. Click the “Zoom” checkbox above the channel controls to enable image zooming (via scrolling) and panning (via click-and-drag).

The cell boxes displayed for this gene are square, 36.43 μm per side for the interphase montage and 30.36 μm per side for the mitotic montage.
Features

Interphase Score Rank FDR q-value
Nucleus DNA Integrated 0.311 100 of 5322 5.407e-04
Nucleus DNA Mean 1.011 22 of 5322 1.505e-04
Nucleus gH2AX Mean 1.034 19 of 5322 1.367e-04
Nucleus DNA - gH2AX Correlation 0.404 15 of 5322 1.021e-04
Nucleus Shape Area -6.662e-01 5294 of 5322 1.633e-04
Nucleus Shape Eccentricity -2.899e-01 5308 of 5322 4.529e-04
Nucleus Shape Form Factor -1.737e-02 1152 of 5322 0.754
Nucleus Shape Solidity -2.472e-01 5231 of 5322 1.903e-04
Cell DNA Mass Displacement 0.197 33 of 5322 0.001
Cell Tubulin Mean 1.132 1 of 5322 2.141e-04
Cell Tubulin Mass Displacement 0.429 5 of 5322 3.984e-04
Cell Actin Mean 1.125 14 of 5322 1.723e-04
Cell Tubulin - Actin Correlation 0.257 92 of 5322 2.896e-04
Cell DNA - Tubulin Correlation 0.620 15 of 5322 1.948e-04
Cell Shape Area -7.443e-01 5302 of 5322 1.651e-04
Cell Shape Eccentricity 0.086 103 of 5322 0.077
Mitotic Score Rank FDR q-value
Nucleus DNA Integrated -3.966e-02 4347 of 5322 0.989
Nucleus DNA Mean -8.466e-02 4115 of 5322 1.000
Nucleus DNA Mass Displacement 0.251 459 of 5322 0.999
Nucleus DNA Mean Frac 3 0.246 371 of 5322 1.000
Nucleus gH2AX Mean -3.744e-02 3467 of 5322 1.000
Nucleus gH2AX Mean Frac 0 -2.620e-01 5080 of 5322 1.000
Nucleus Tubulin Mean Frac 0 0.018 3227 of 5322 0.999
Nucleus Tubulin Mean Edge 0.023 2837 of 5322 0.999
Nucleus Tubulin Std Edge -2.476e-01 4817 of 5322 0.999
Nucleus Shape Area 0.261 1008 of 5322 0.852
Nucleus Shape Eccentricity -1.190e-01 3818 of 5322 1.000
Nucleus Shape Form Factor 0.019 1152 of 5322 0.998
Cell Tubulin Mean 0.130 1680 of 5322 0.997
Cell Tubulin Mean Frac 3 0.058 1076 of 5322 0.999
Cell Actin Mean 0.260 524 of 5322 0.997
Cell Shape Area -1.168e-01 4883 of 5322 0.998
( Reset Zoom )
Brightness
Contrast
Opacity
Brightness
Contrast
Opacity
Brightness
Contrast
Opacity
Brightness
Contrast
Opacity
Brightness
Contrast
Opacity

( Reset Zoom )
Brightness
Contrast
Opacity
Brightness
Contrast
Opacity
Brightness
Contrast
Opacity
Brightness
Contrast
Opacity
Brightness
Contrast
Opacity

MIT Central Accessability