INTS8

Gene symbol: INTS8
Gene: 55656
Uniprot Function: Component of the Integrator complex, a complex involved in the small nuclear RNAs (snRNA) U1 and U2 transcription and in their 3'-box-dependent processing. The Integrator complex is associated with the C-terminal domain (CTD) of RNA polymerase II largest subunit (POLR2A) and is recruited to the U1 and U2 snRNAs genes.
Mitotic Index 0.0176
Interphase Cluster: #217 (8 genes)
Mitotic Cluster: #103 (23 genes)
sgRNA 1: AACCAAAGAACTAATTGCAG (interphase cells: 2569, mitotic cells: 53)
sgRNA 2: AATGCACAGATTTACTCTAG (interphase cells: 2005, mitotic cells: 35)
sgRNA 3: CCAACTTACACACTTAACTG (interphase cells: 5624, mitotic cells: 98)
sgRNA 4: CTACTTATAAGGTCGGATGG (interphase cells: 1682, mitotic cells: 27)

Interphase Cluster

Mitotic Cluster

Overview

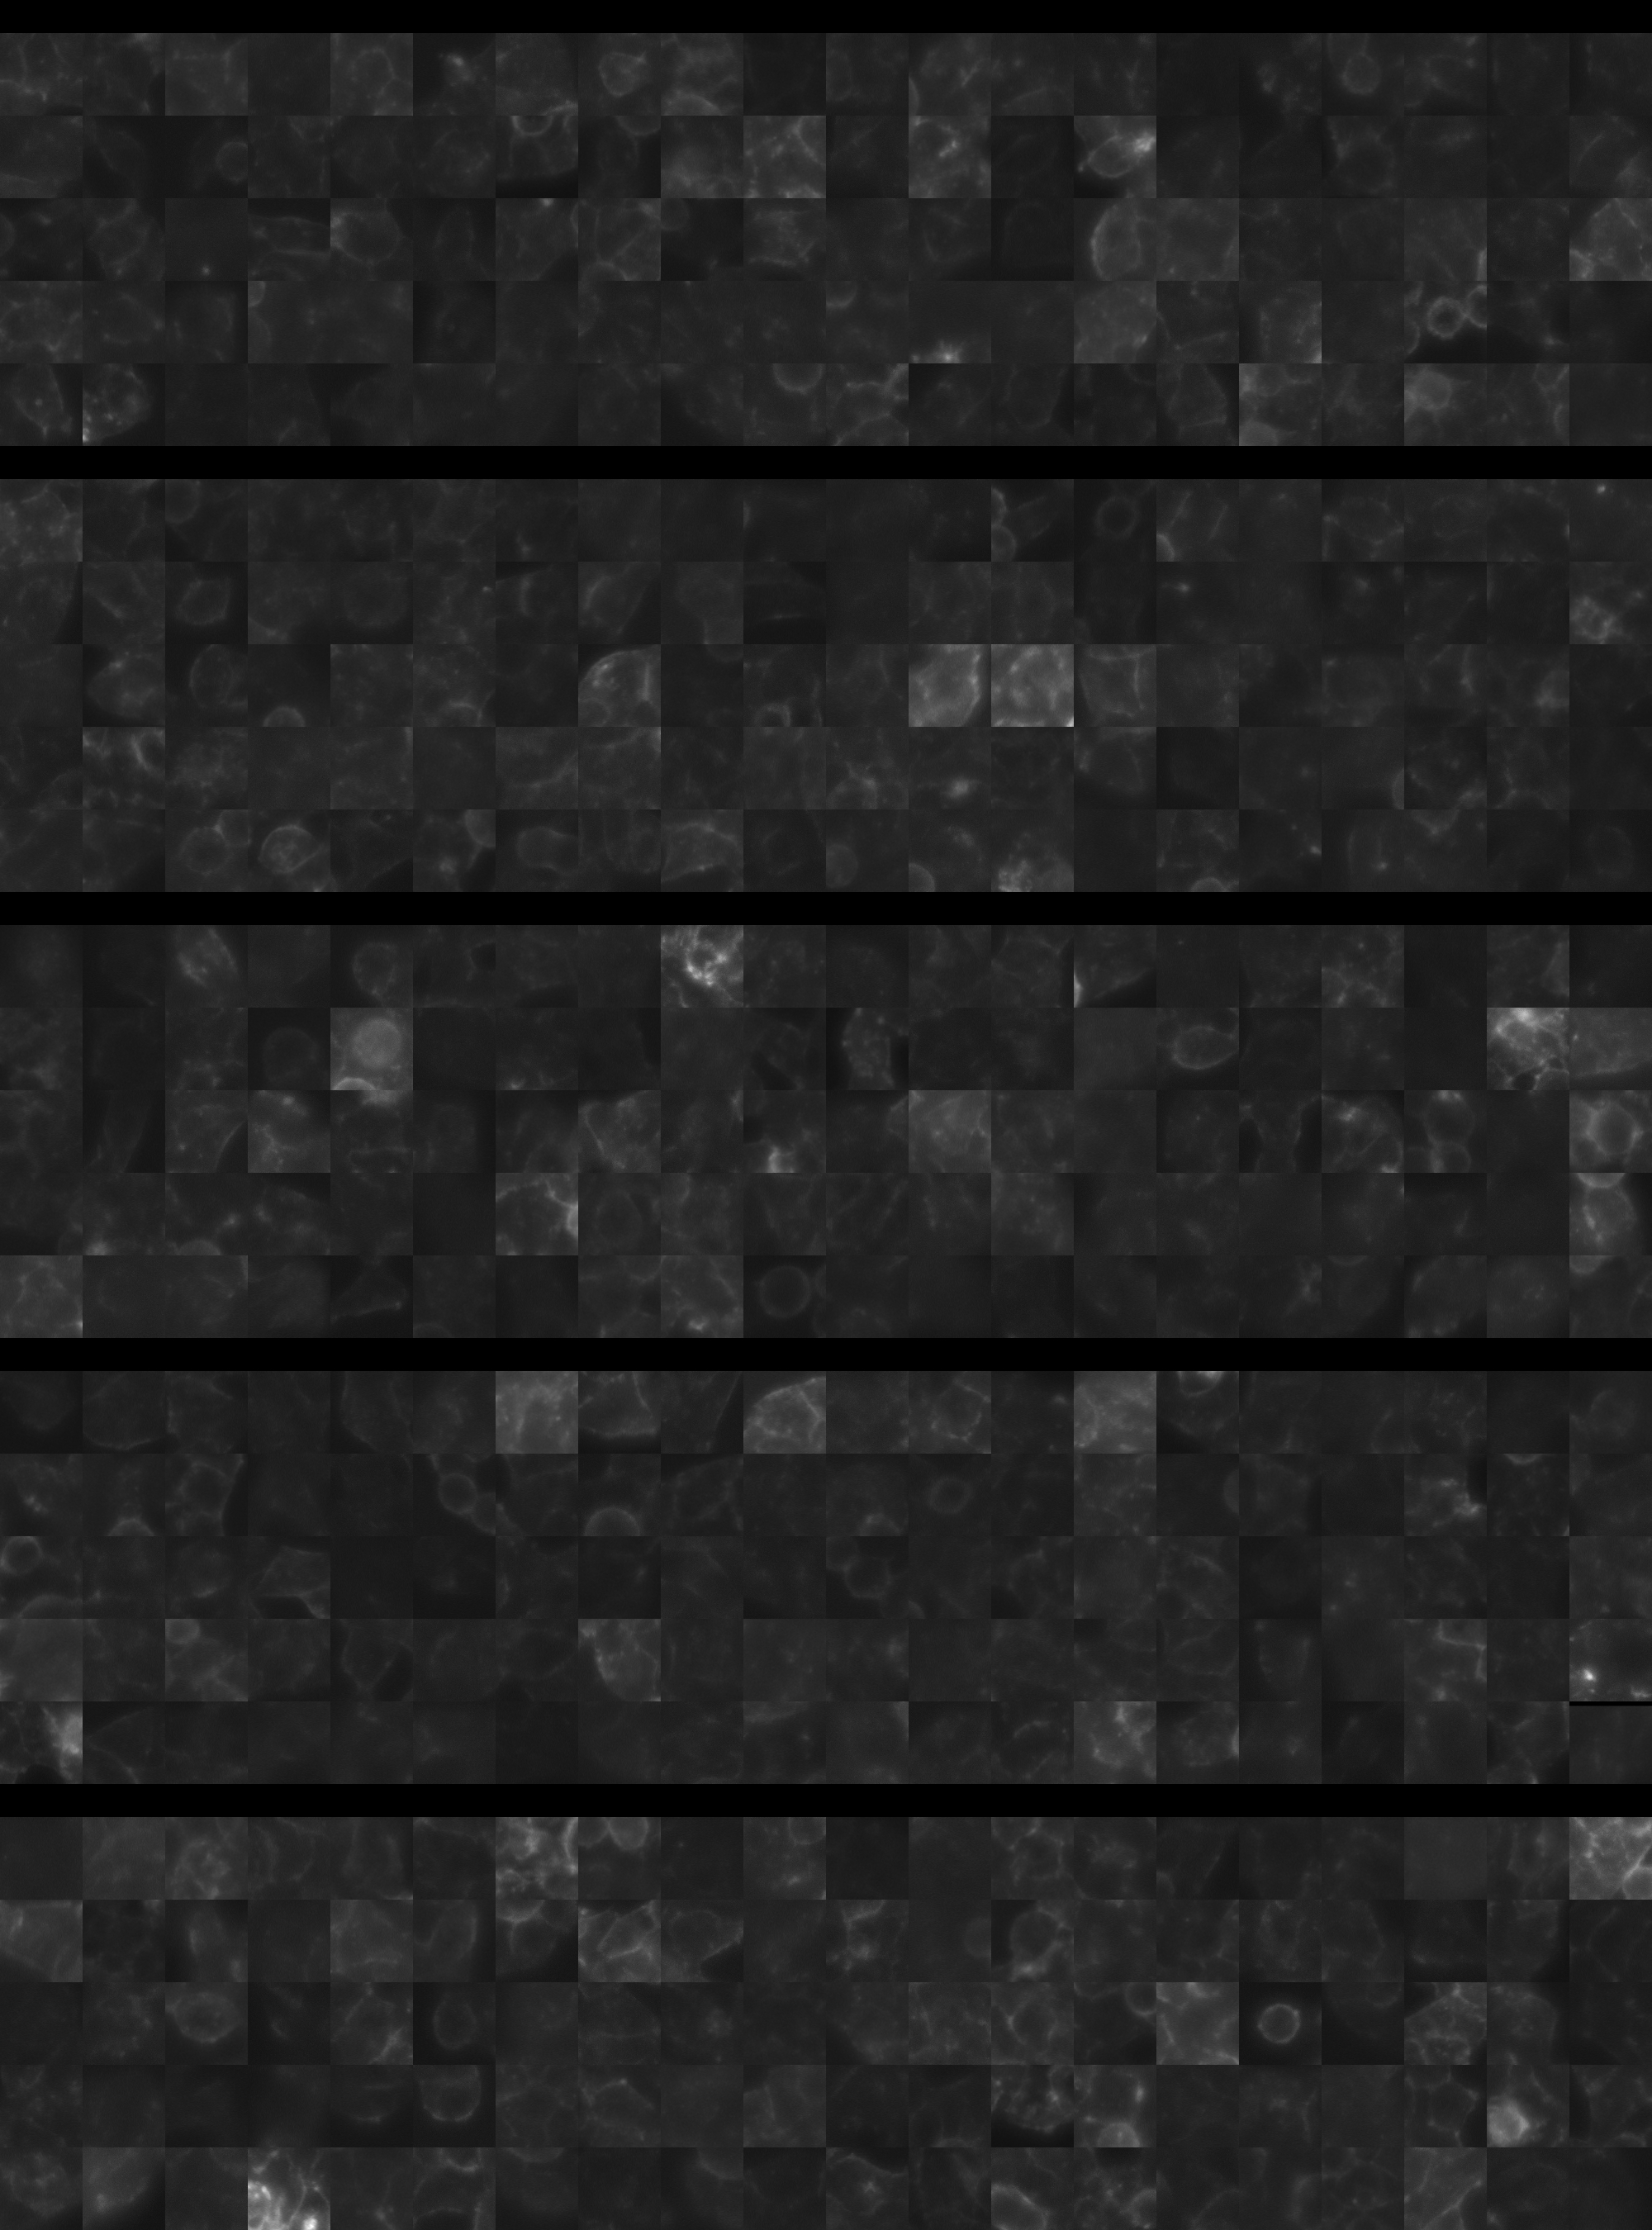
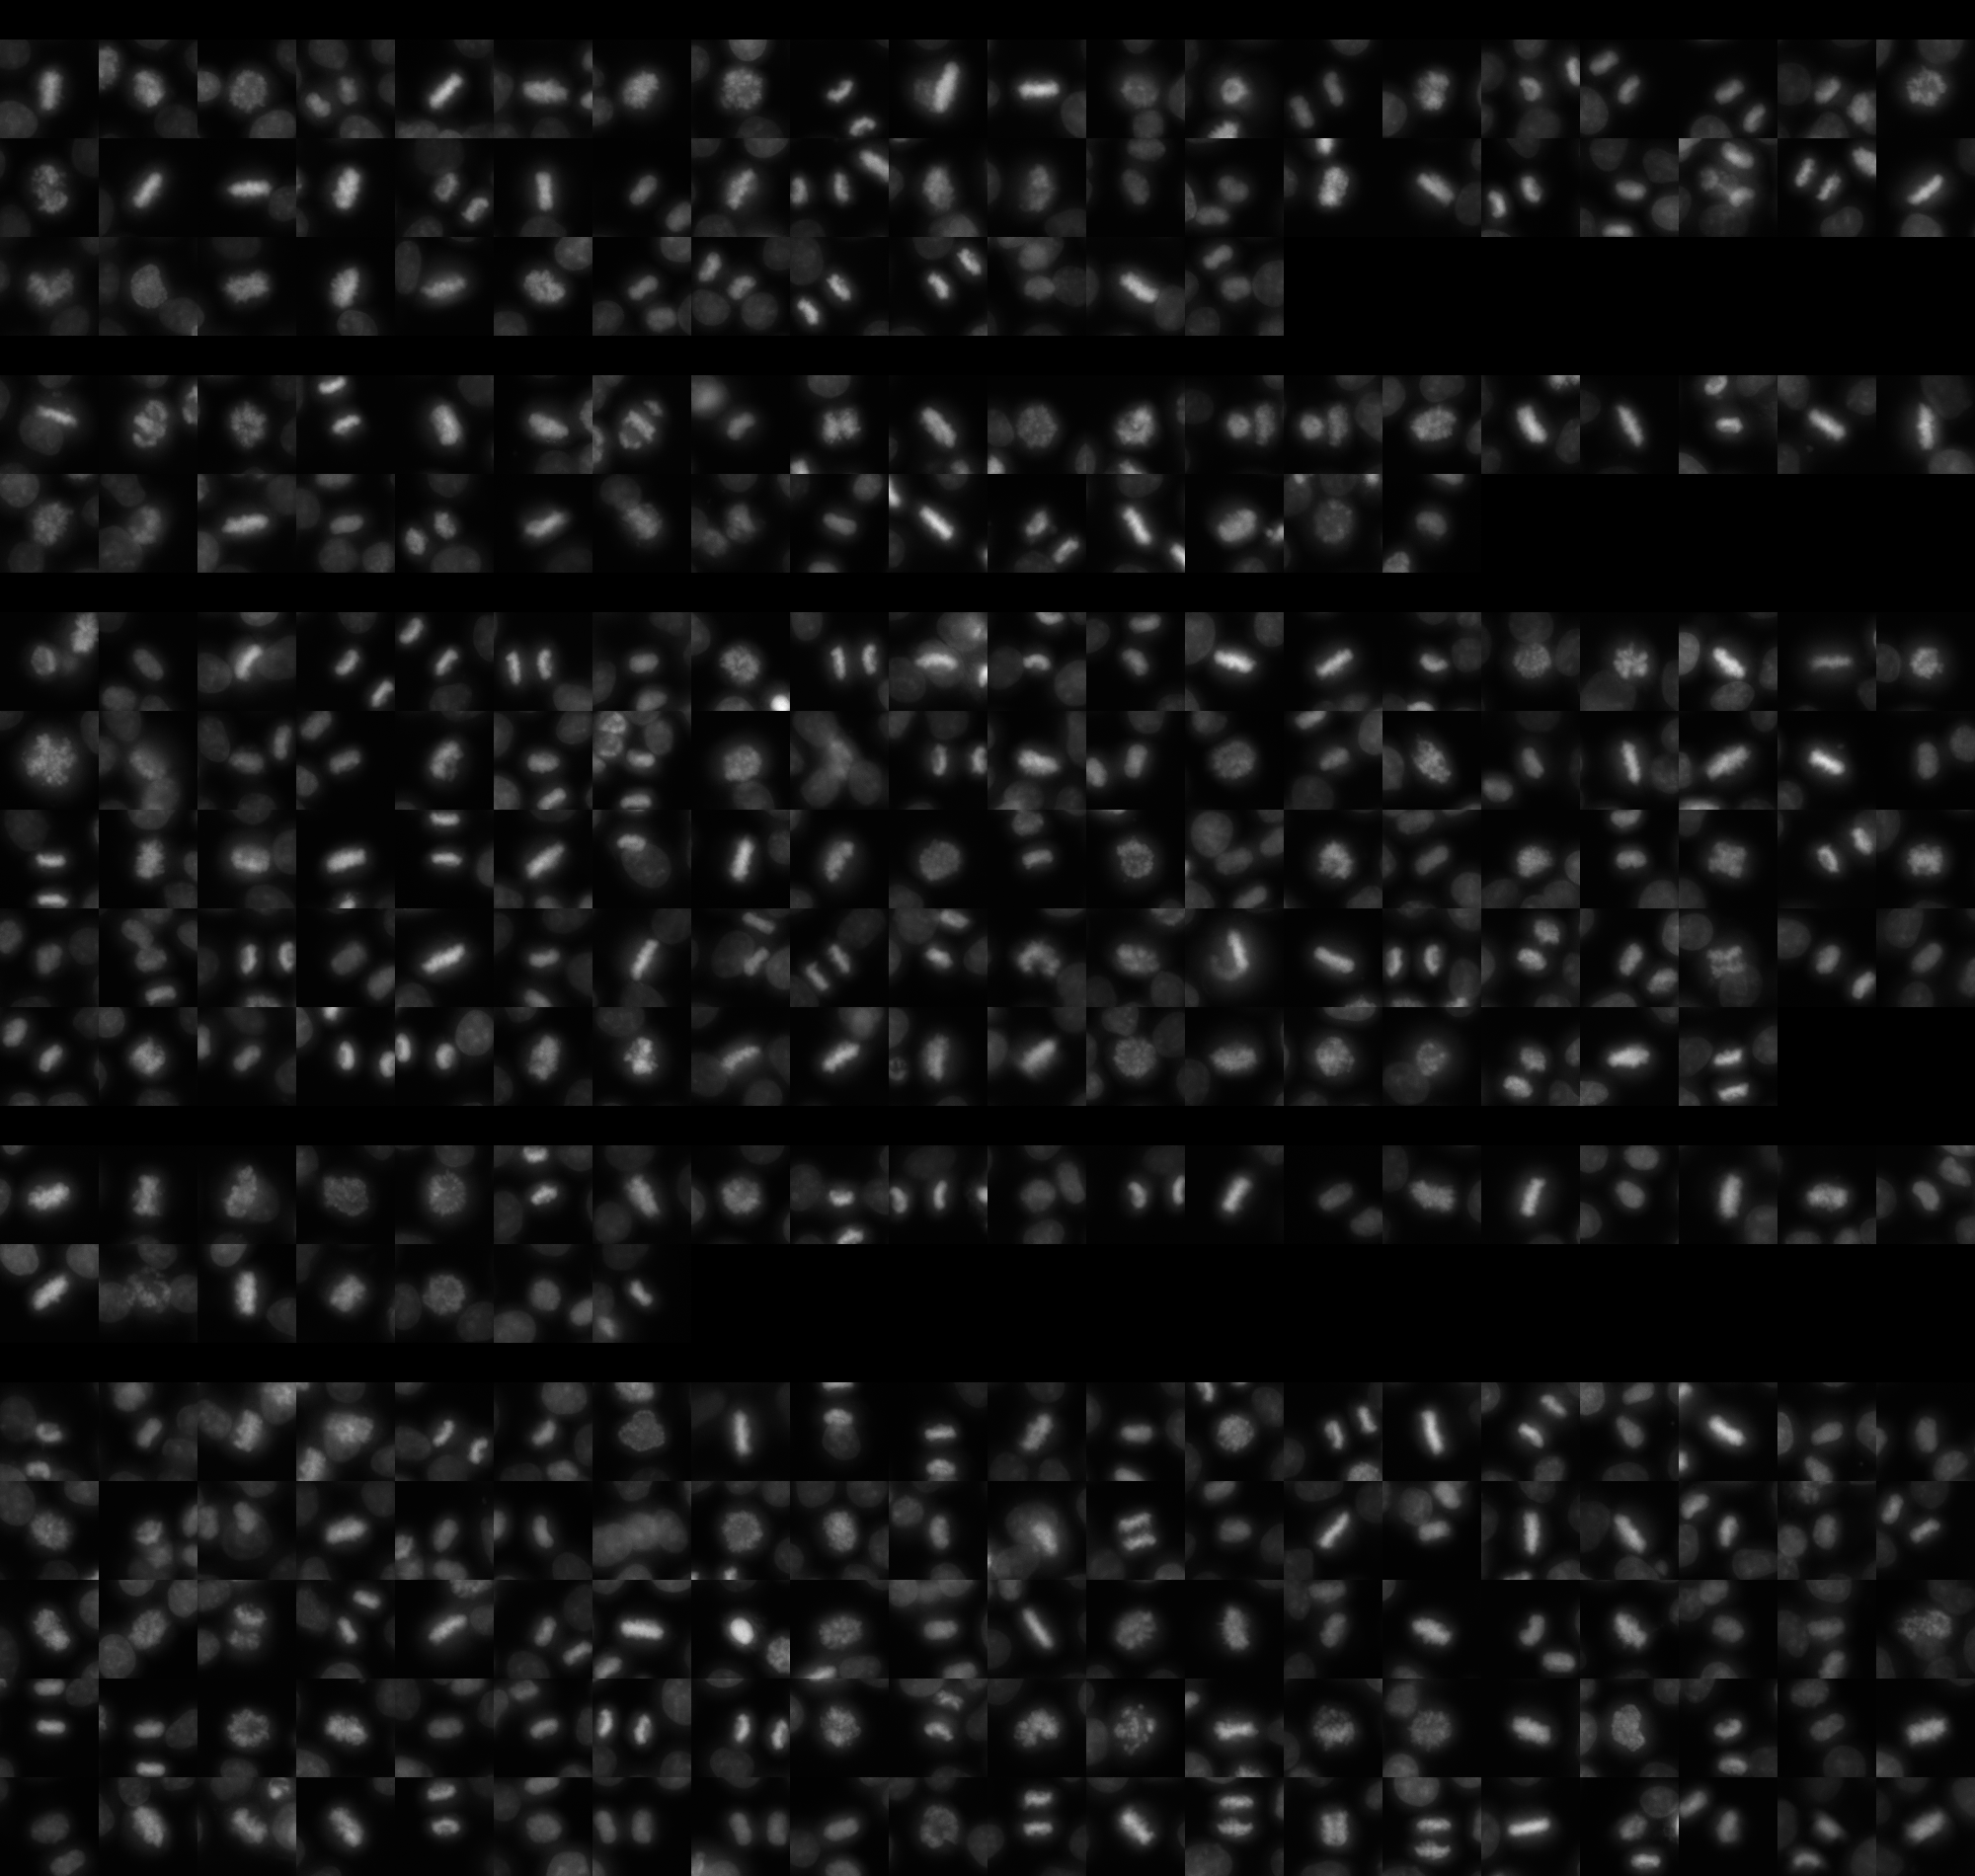
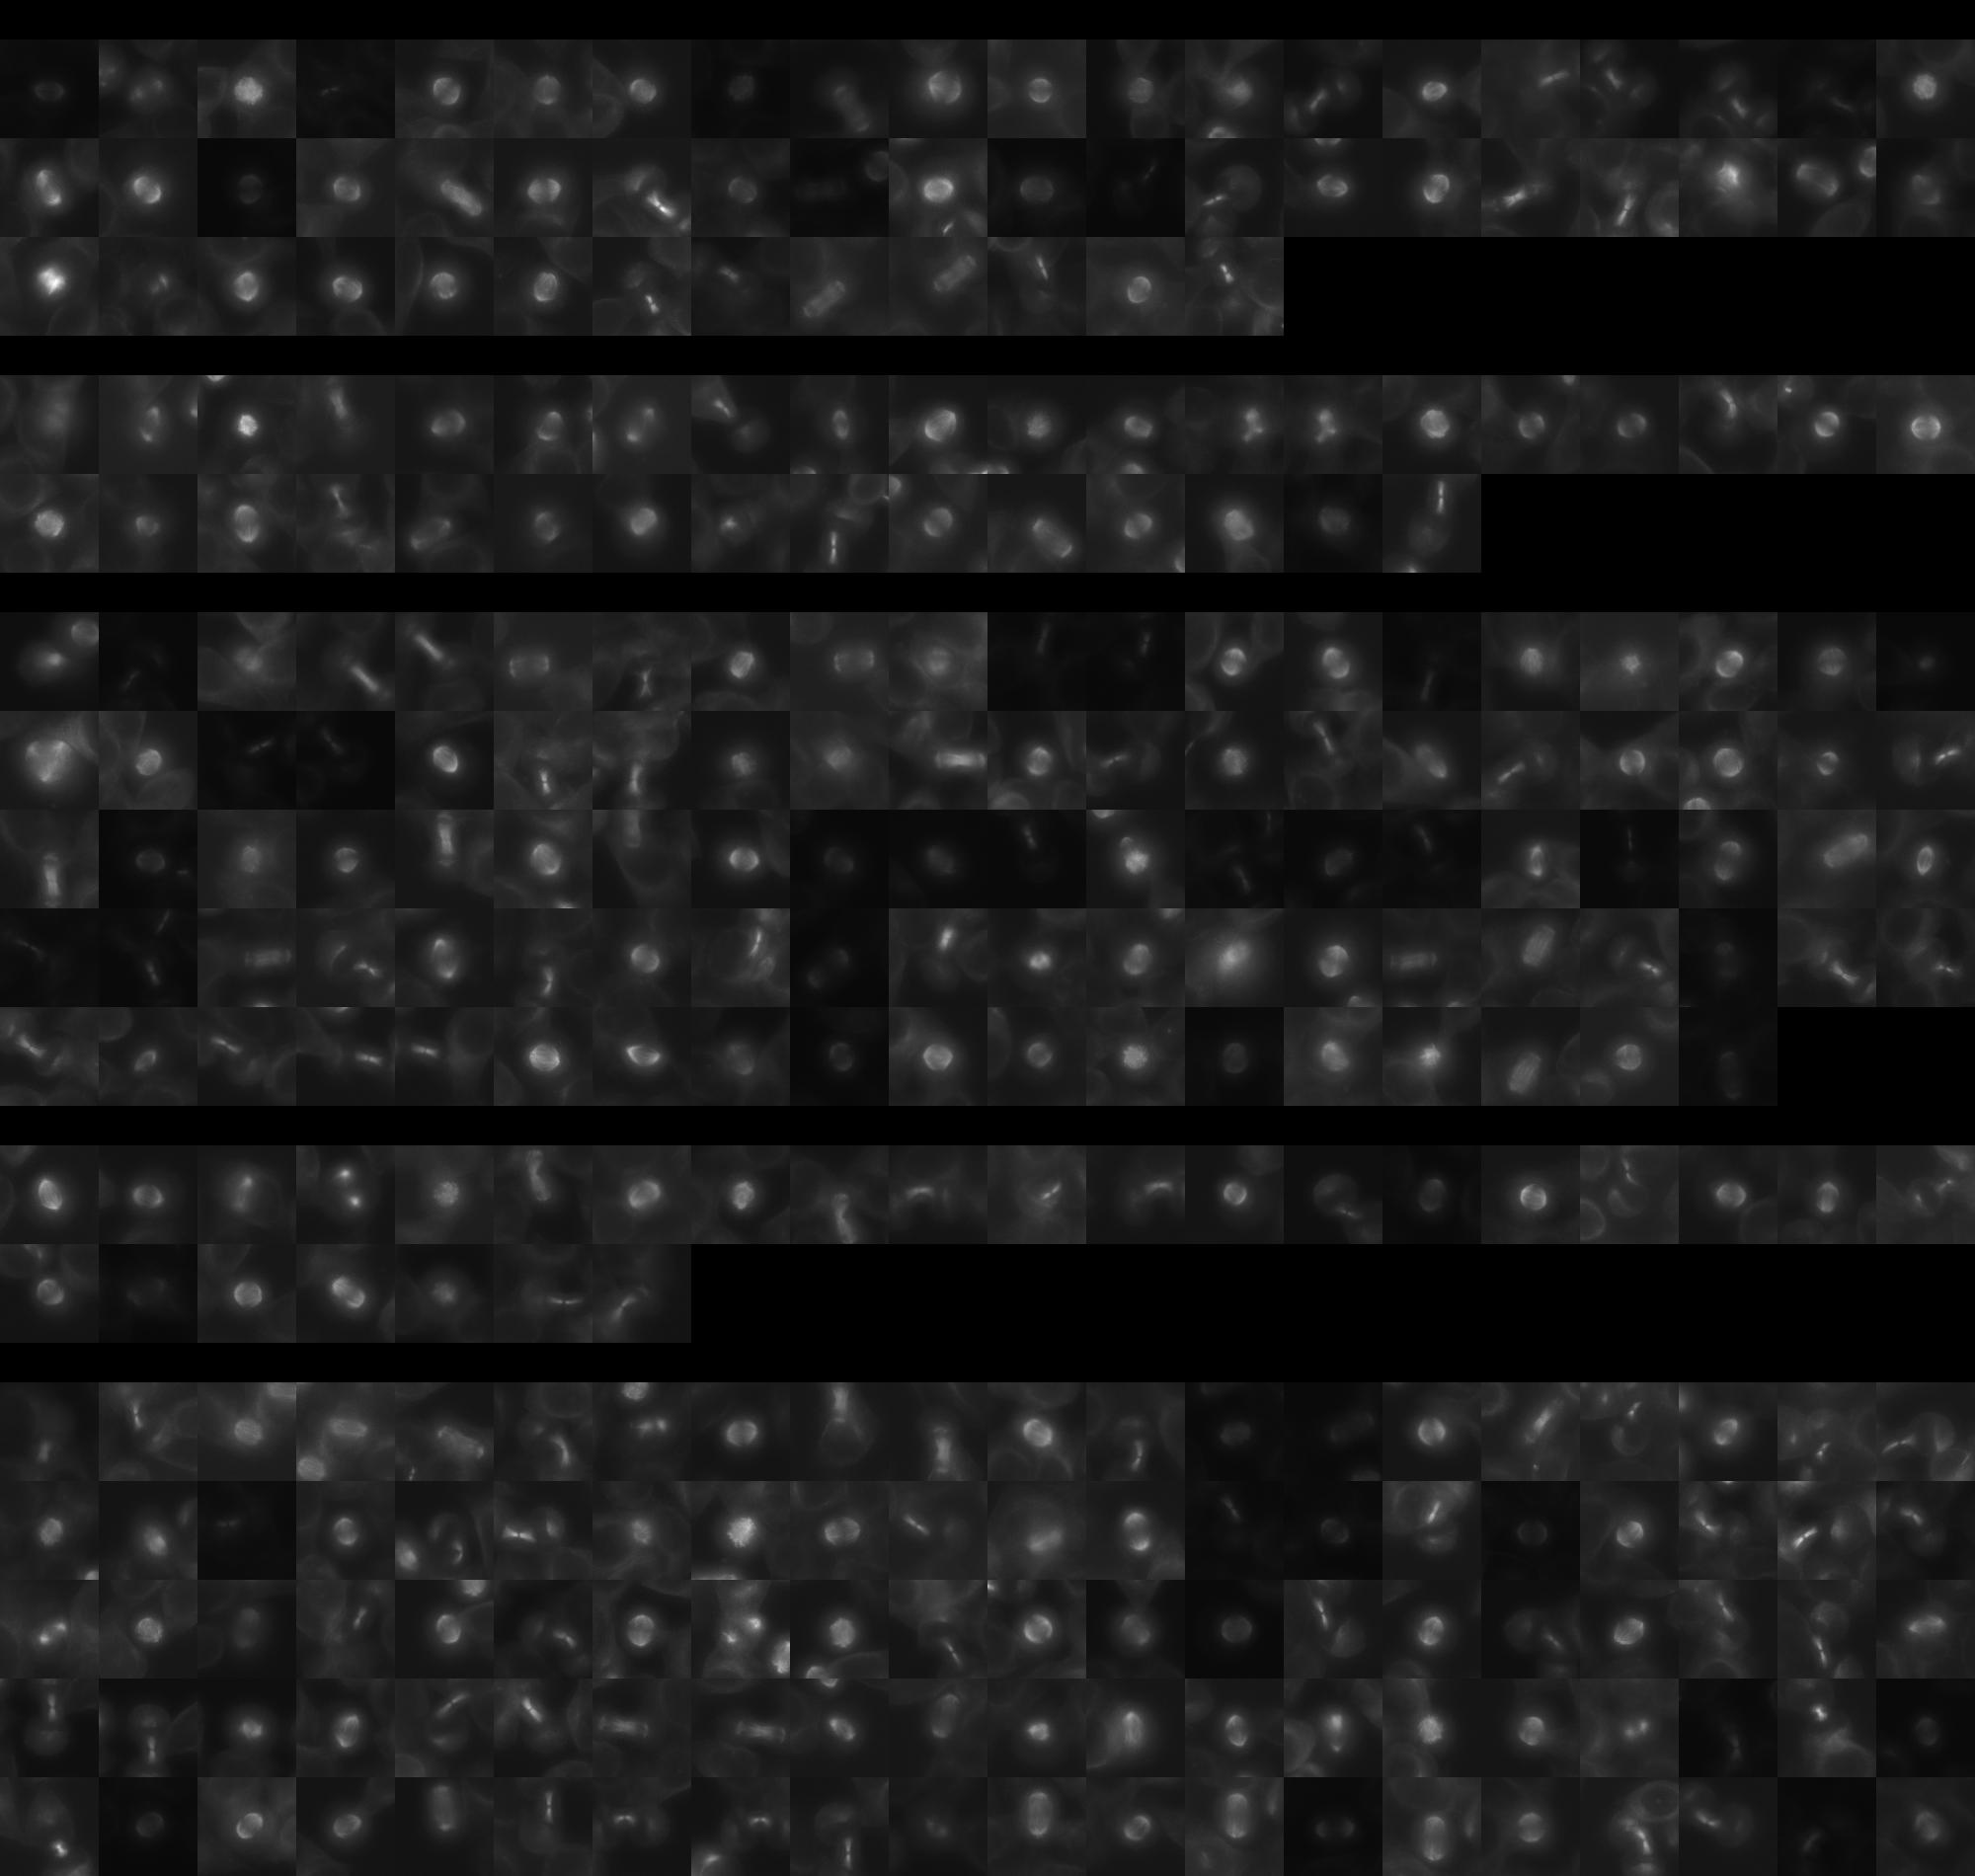
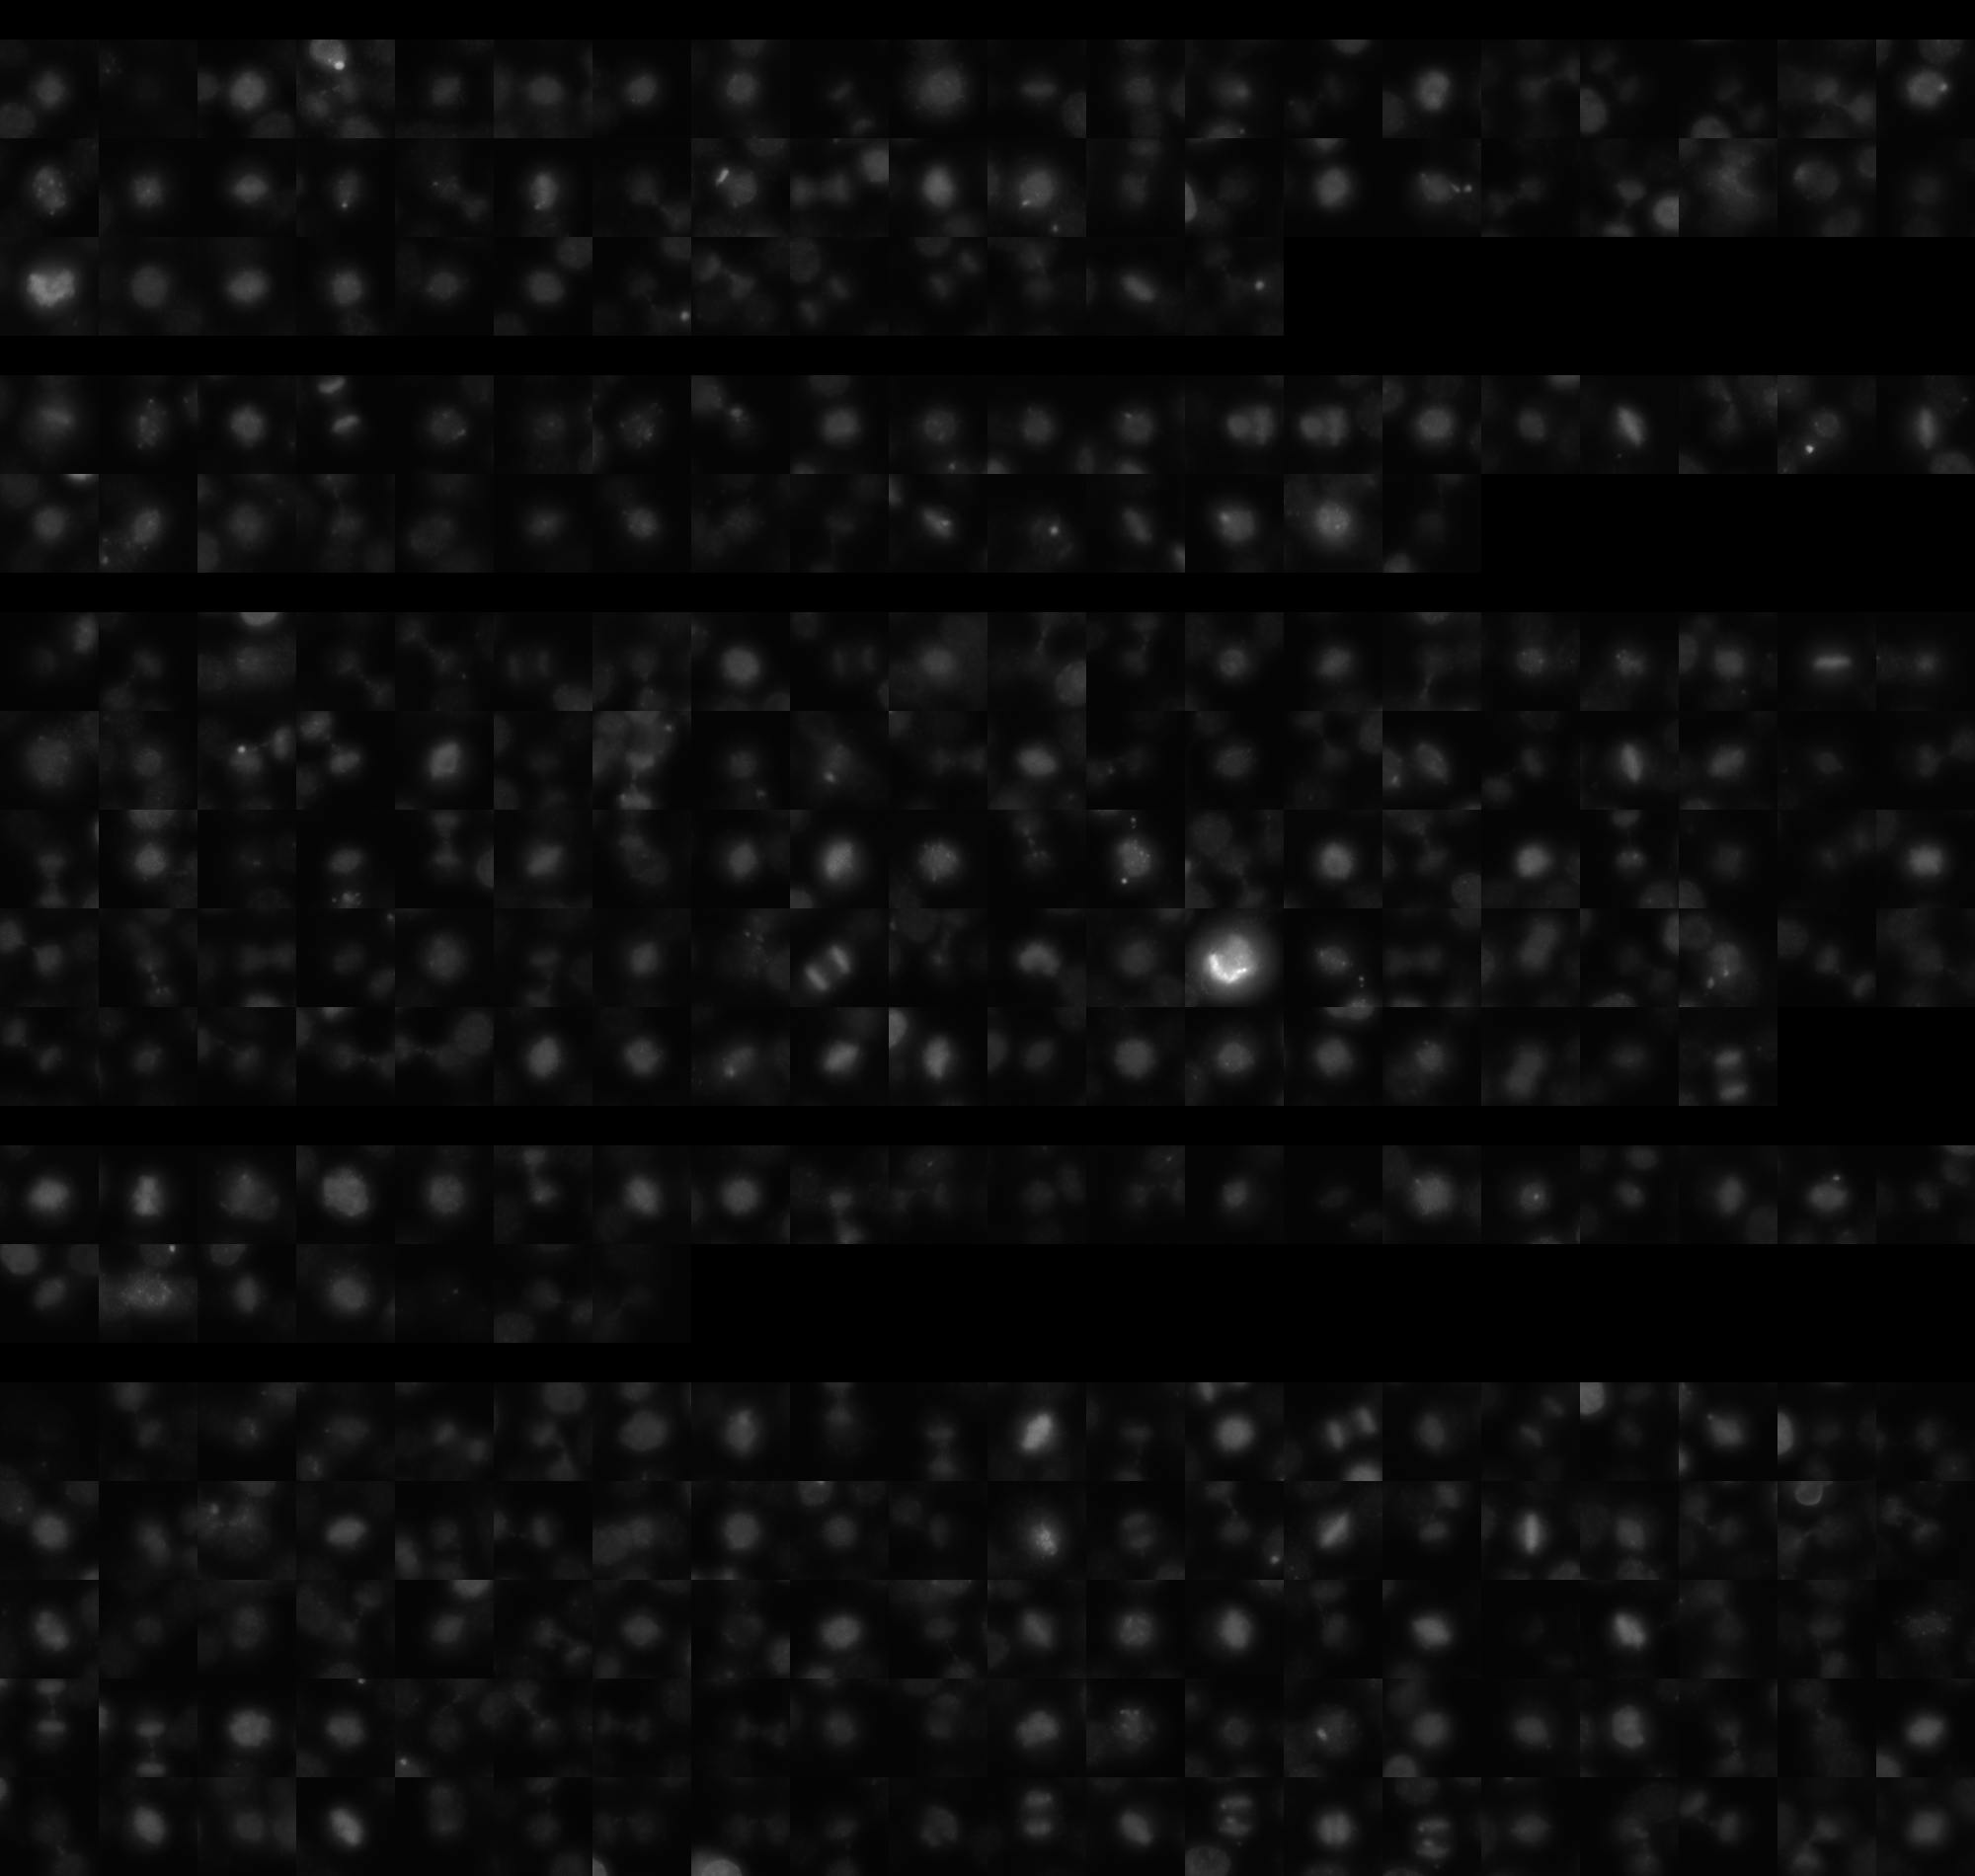
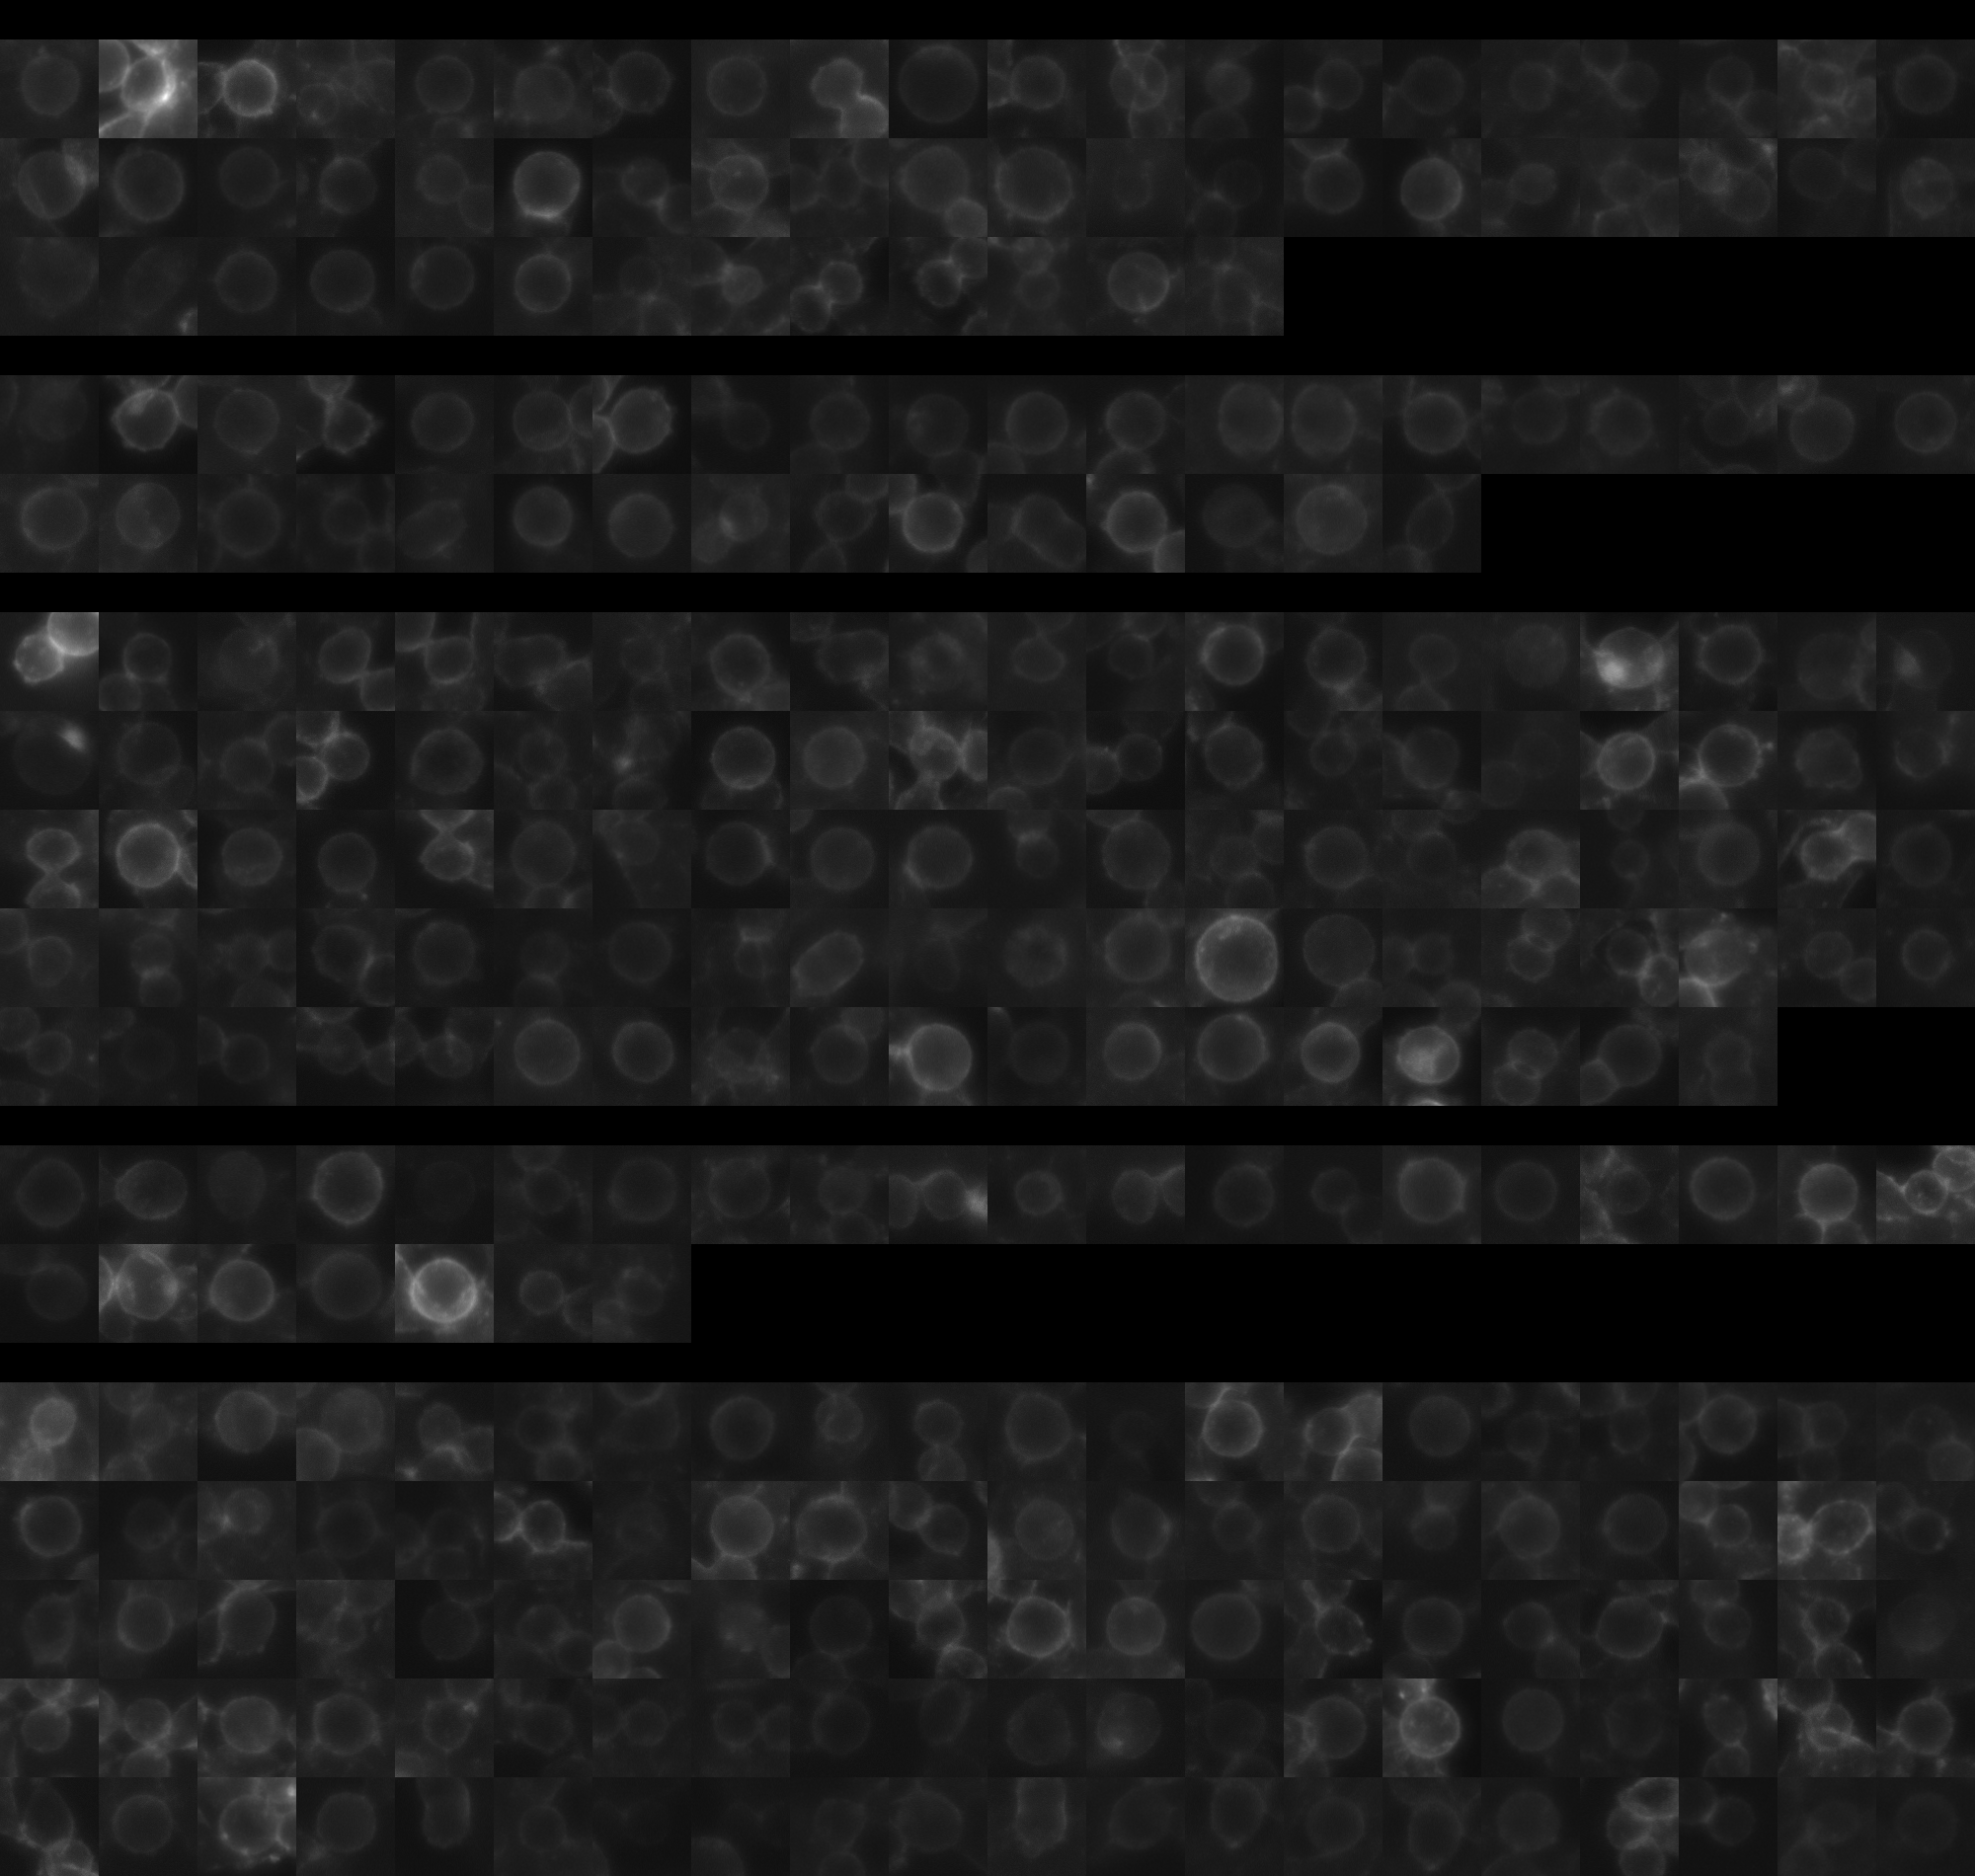
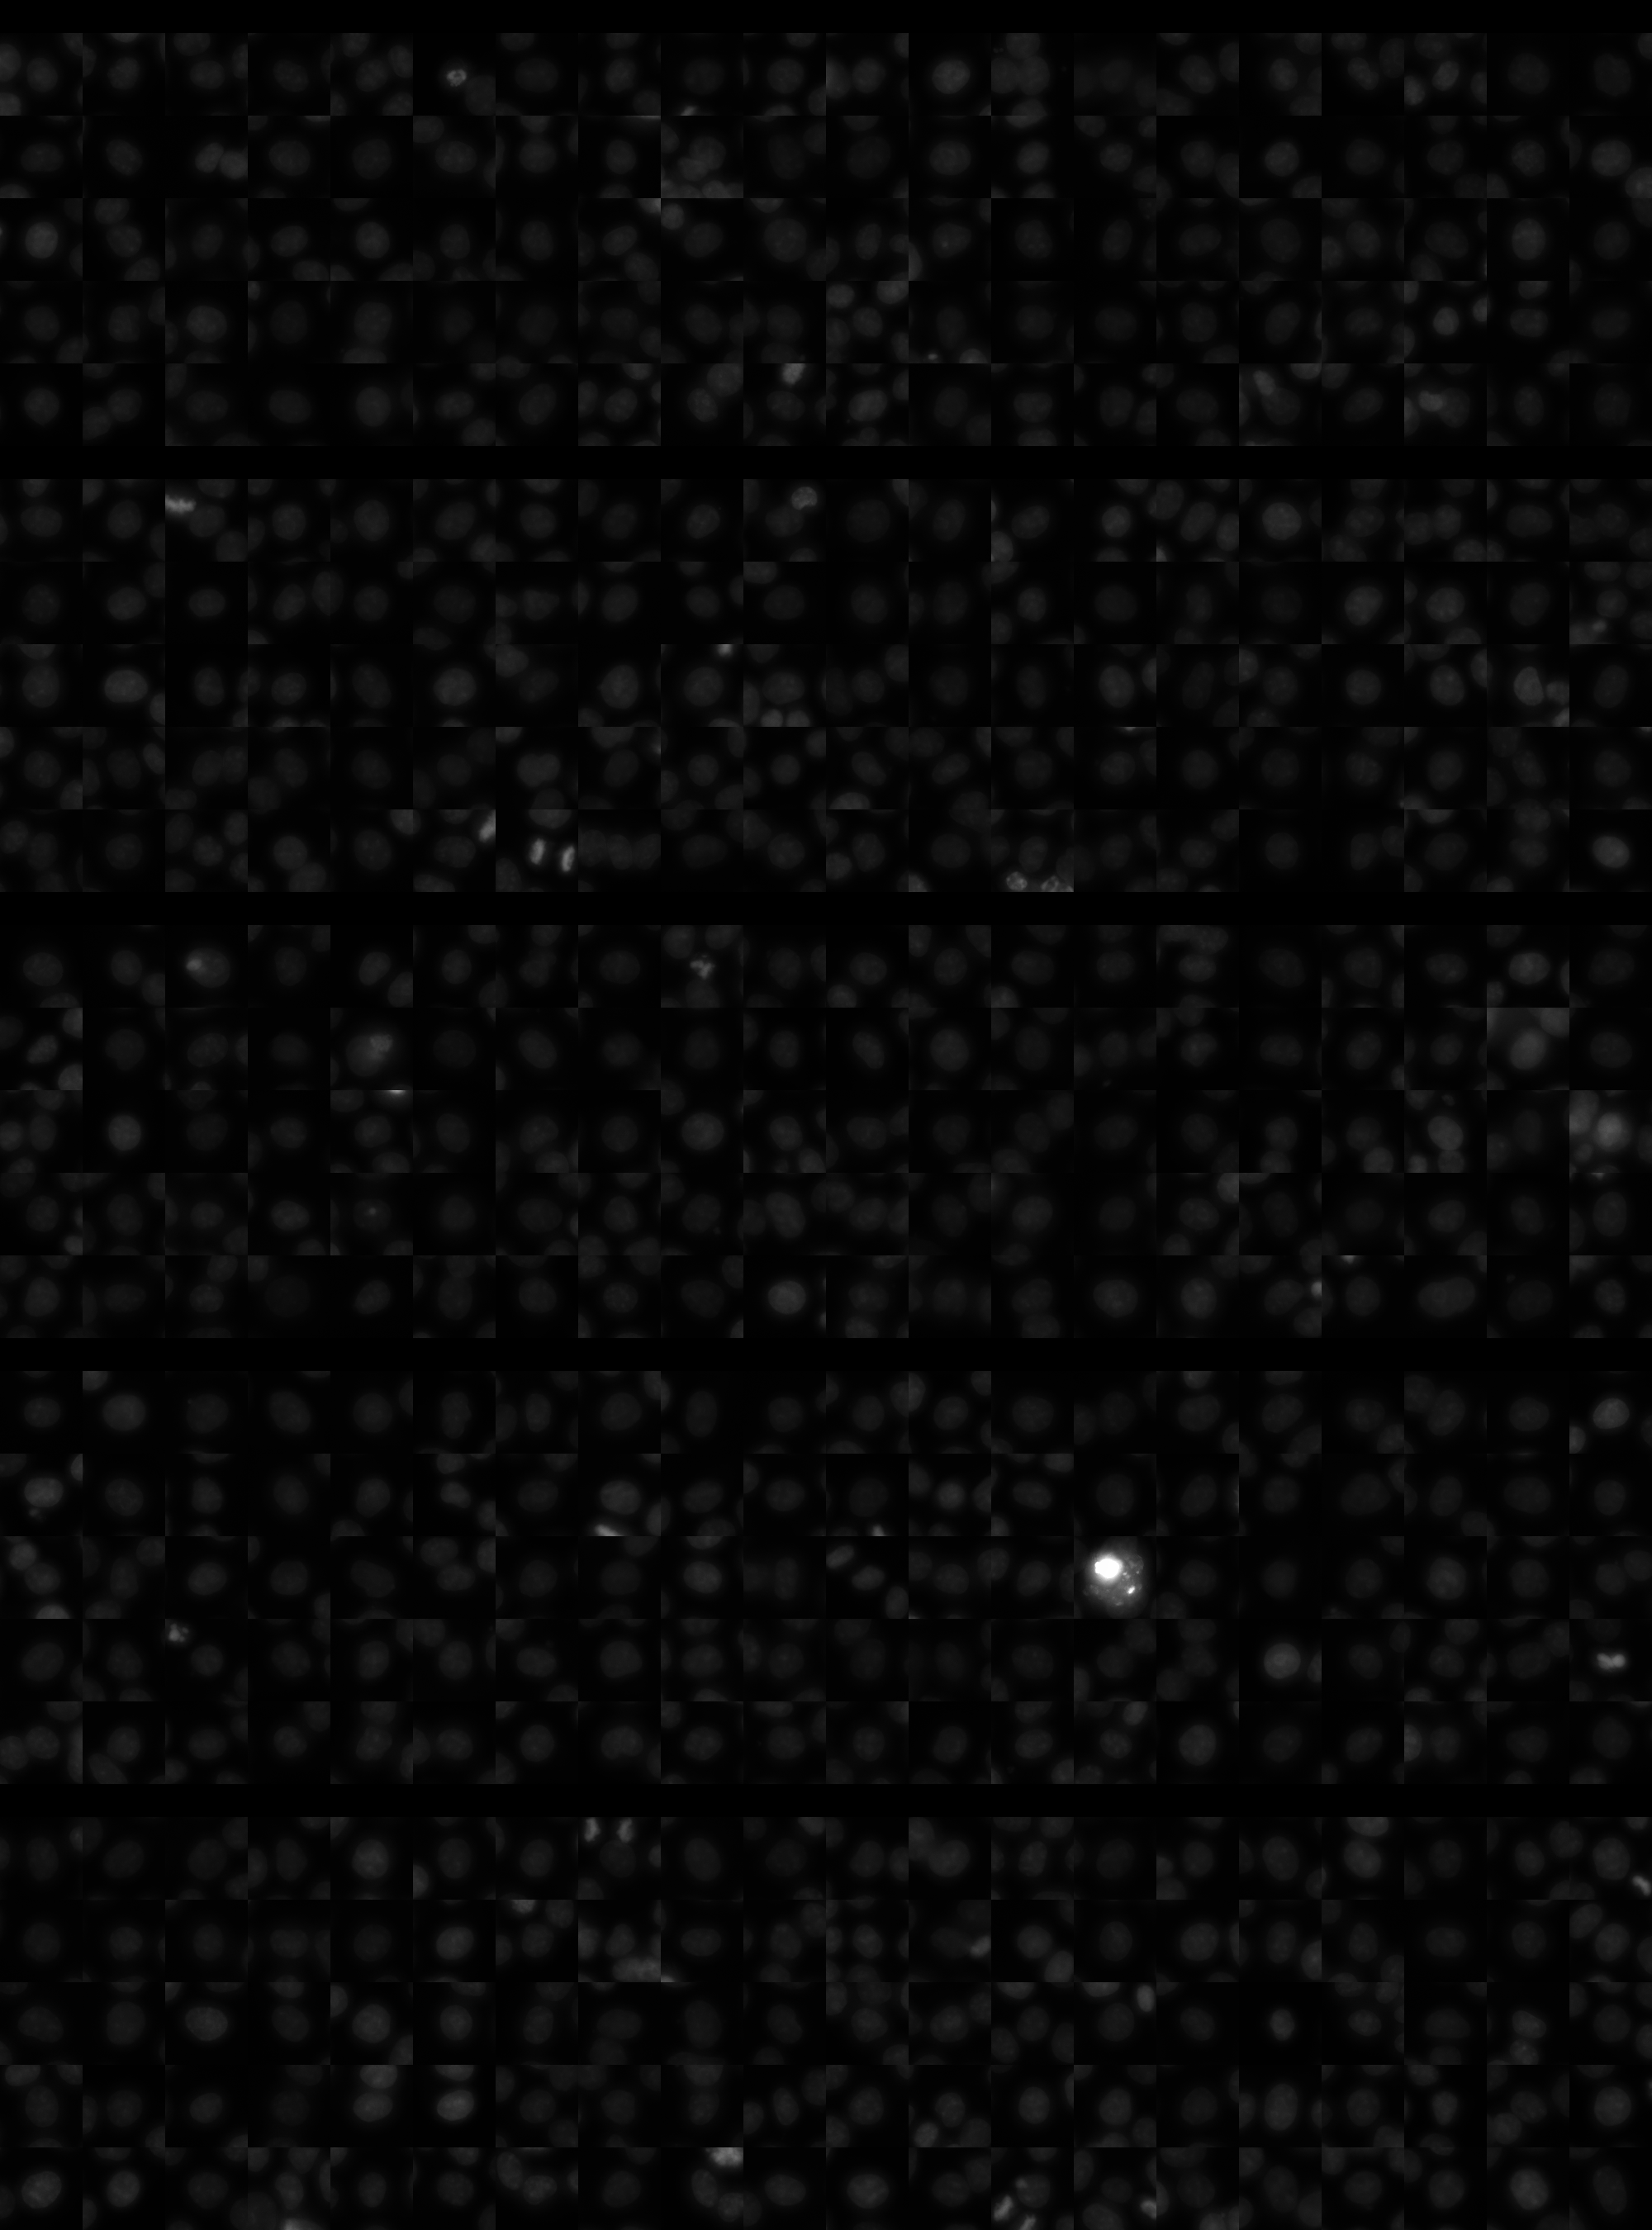
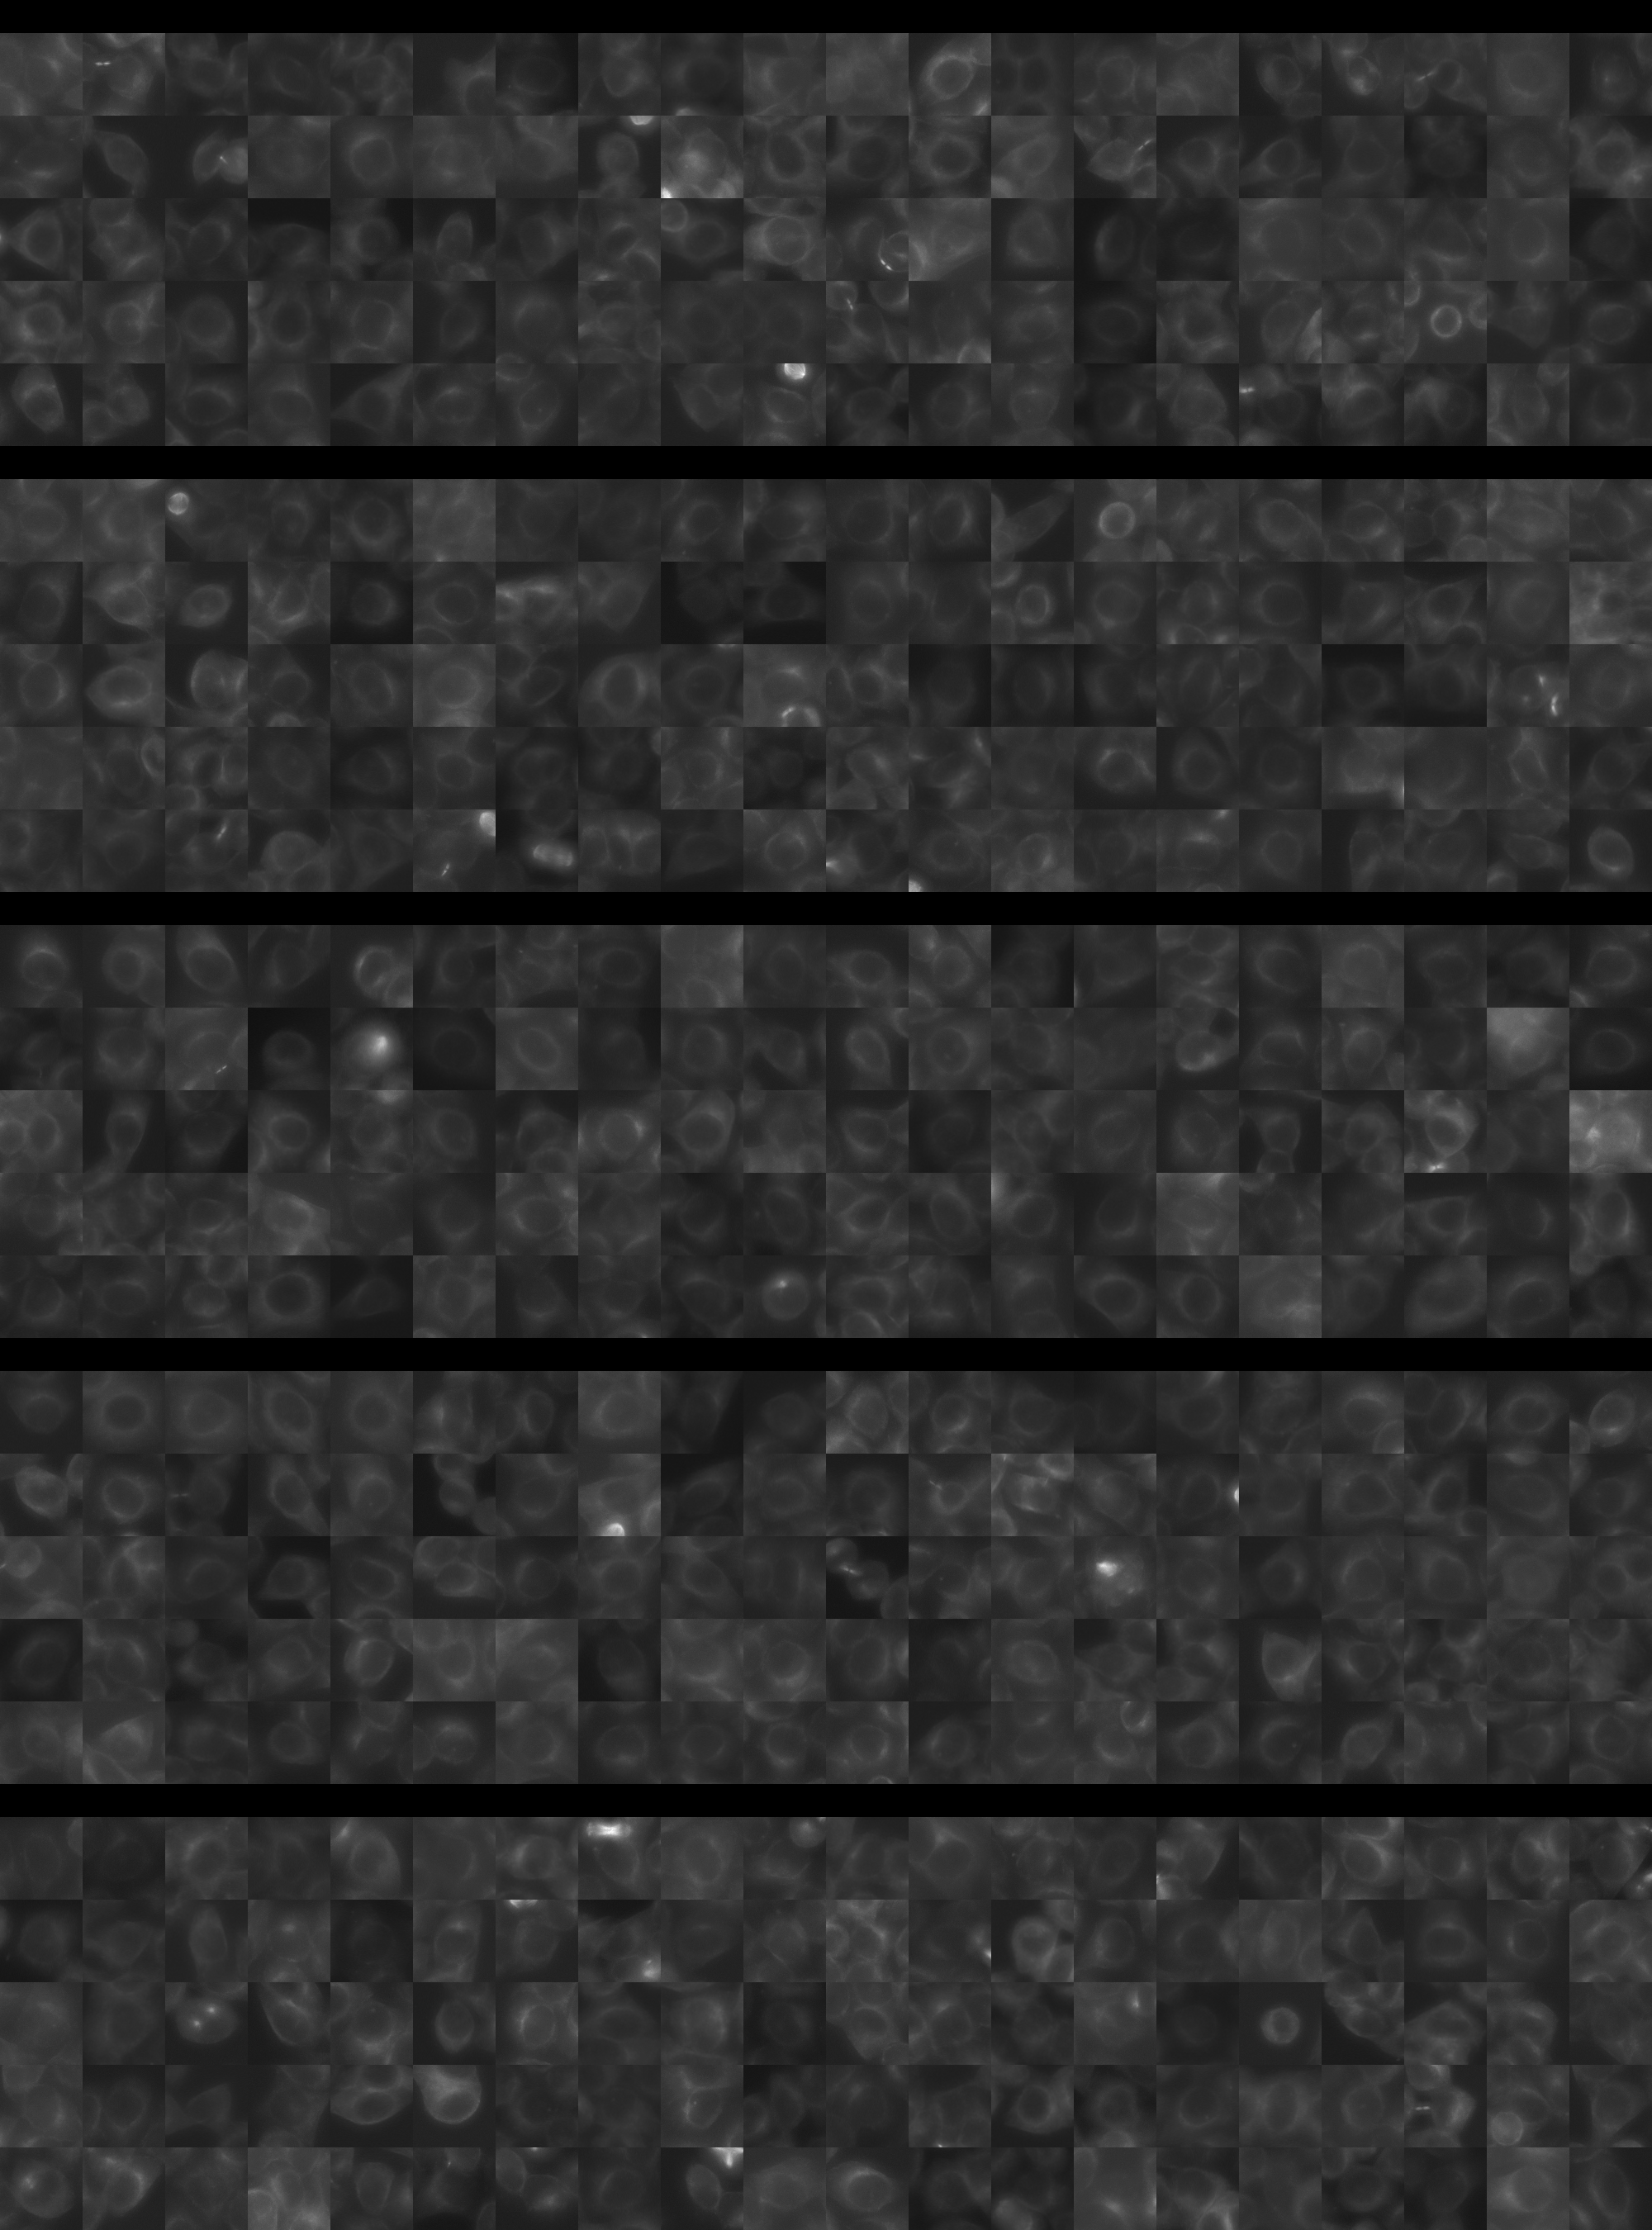
Each montage below shows randomly selected individual cell images for the same target gene separated by sgRNA, along with an example montage of cells expressing a non-targeting negative control sgRNA at the bottom. sgRNA labels in the montages correspond to the numbered sgRNA sequences in the gene info table above. The DNA (blue) and tubulin (green) channels are displayed by default, with gH2AX (grayscale) and actin (yellow) available using the check boxes. Channel brightness, contrast, and opacity are adjustable by clicking the arrow next to the channel name. When only one channel is selected, the display defaults to grayscale. Click the “Zoom” checkbox above the channel controls to enable image zooming (via scrolling) and panning (via click-and-drag).

The cell boxes displayed for this gene are square, 30.36 μm per side for the interphase montage and 30.36 μm per side for the mitotic montage.
Features

Interphase Score Rank FDR q-value
Nucleus DNA Integrated -1.060e-01 5264 of 5322 0.002
Nucleus DNA Mean -2.404e-01 5183 of 5322 1.505e-04
Nucleus gH2AX Mean 0.058 3265 of 5322 0.099
Nucleus DNA - gH2AX Correlation -6.991e-02 3101 of 5322 0.006
Nucleus Shape Area 0.069 1196 of 5322 0.164
Nucleus Shape Eccentricity 0.005 3064 of 5322 0.890
Nucleus Shape Form Factor -1.510e-01 4999 of 5322 2.872e-04
Nucleus Shape Solidity -1.620e-01 4957 of 5322 1.903e-04
Cell DNA Mass Displacement 0.046 1327 of 5322 0.310
Cell Tubulin Mean -2.744e-01 5243 of 5322 2.141e-04
Cell Tubulin Mass Displacement -1.528e-01 5244 of 5322 3.984e-04
Cell Actin Mean -1.618e-01 5149 of 5322 1.723e-04
Cell Tubulin - Actin Correlation -5.293e-02 5048 of 5322 0.121
Cell DNA - Tubulin Correlation -8.084e-02 5147 of 5322 0.006
Cell Shape Area 0.096 631 of 5322 0.044
Cell Shape Eccentricity 0.021 2028 of 5322 0.740
Mitotic Score Rank FDR q-value
Nucleus DNA Integrated 0.095 2553 of 5322 0.965
Nucleus DNA Mean -3.150e-02 3453 of 5322 1.000
Nucleus DNA Mass Displacement 0.073 2340 of 5322 0.999
Nucleus DNA Mean Frac 3 -3.593e-02 3665 of 5322 1.000
Nucleus gH2AX Mean -4.909e-02 3639 of 5322 1.000
Nucleus gH2AX Mean Frac 0 0.025 1894 of 5322 1.000
Nucleus Tubulin Mean Frac 0 0.153 1287 of 5322 0.999
Nucleus Tubulin Mean Edge -1.664e-01 4758 of 5322 0.996
Nucleus Tubulin Std Edge -6.518e-02 3469 of 5322 0.999
Nucleus Shape Area 0.216 1339 of 5322 0.852
Nucleus Shape Eccentricity 0.002 2082 of 5322 1.000
Nucleus Shape Form Factor -6.125e-02 2298 of 5322 0.998
Cell Tubulin Mean -1.793e-01 4997 of 5322 0.975
Cell Tubulin Mean Frac 3 -1.942e-02 1920 of 5322 0.999
Cell Actin Mean -6.600e-02 4048 of 5322 0.997
Cell Shape Area 0.173 1676 of 5322 0.994
( Reset Zoom )
Brightness
Contrast
Opacity
Brightness
Contrast
Opacity
Brightness
Contrast
Opacity
Brightness
Contrast
Opacity
Brightness
Contrast
Opacity

( Reset Zoom )
Brightness
Contrast
Opacity
Brightness
Contrast
Opacity
Brightness
Contrast
Opacity
Brightness
Contrast
Opacity
Brightness
Contrast
Opacity

MIT Central Accessability