HNRNPL

Gene symbol: HNRNPL
Gene: 3191
Uniprot Function: Splicing factor binding to exonic or intronic sites and acting as either an activator or repressor of exon inclusion. Exhibits a binding preference for CA-rich elements (PubMed:11809897, PubMed:22570490, PubMed:24164894, PubMed:25623890, PubMed:26051023). Component of the heterogeneous nuclear ribonucleoprotein (hnRNP) complexes and associated with most nascent transcripts (PubMed:2687284). Associates, together with APEX1, to the negative calcium responsive element (nCaRE) B2 of the APEX2 promoter (PubMed:11809897).
Mitotic Index 0.0256
Interphase Cluster: #16 (40 genes)
Mitotic Cluster: #18 (40 genes)
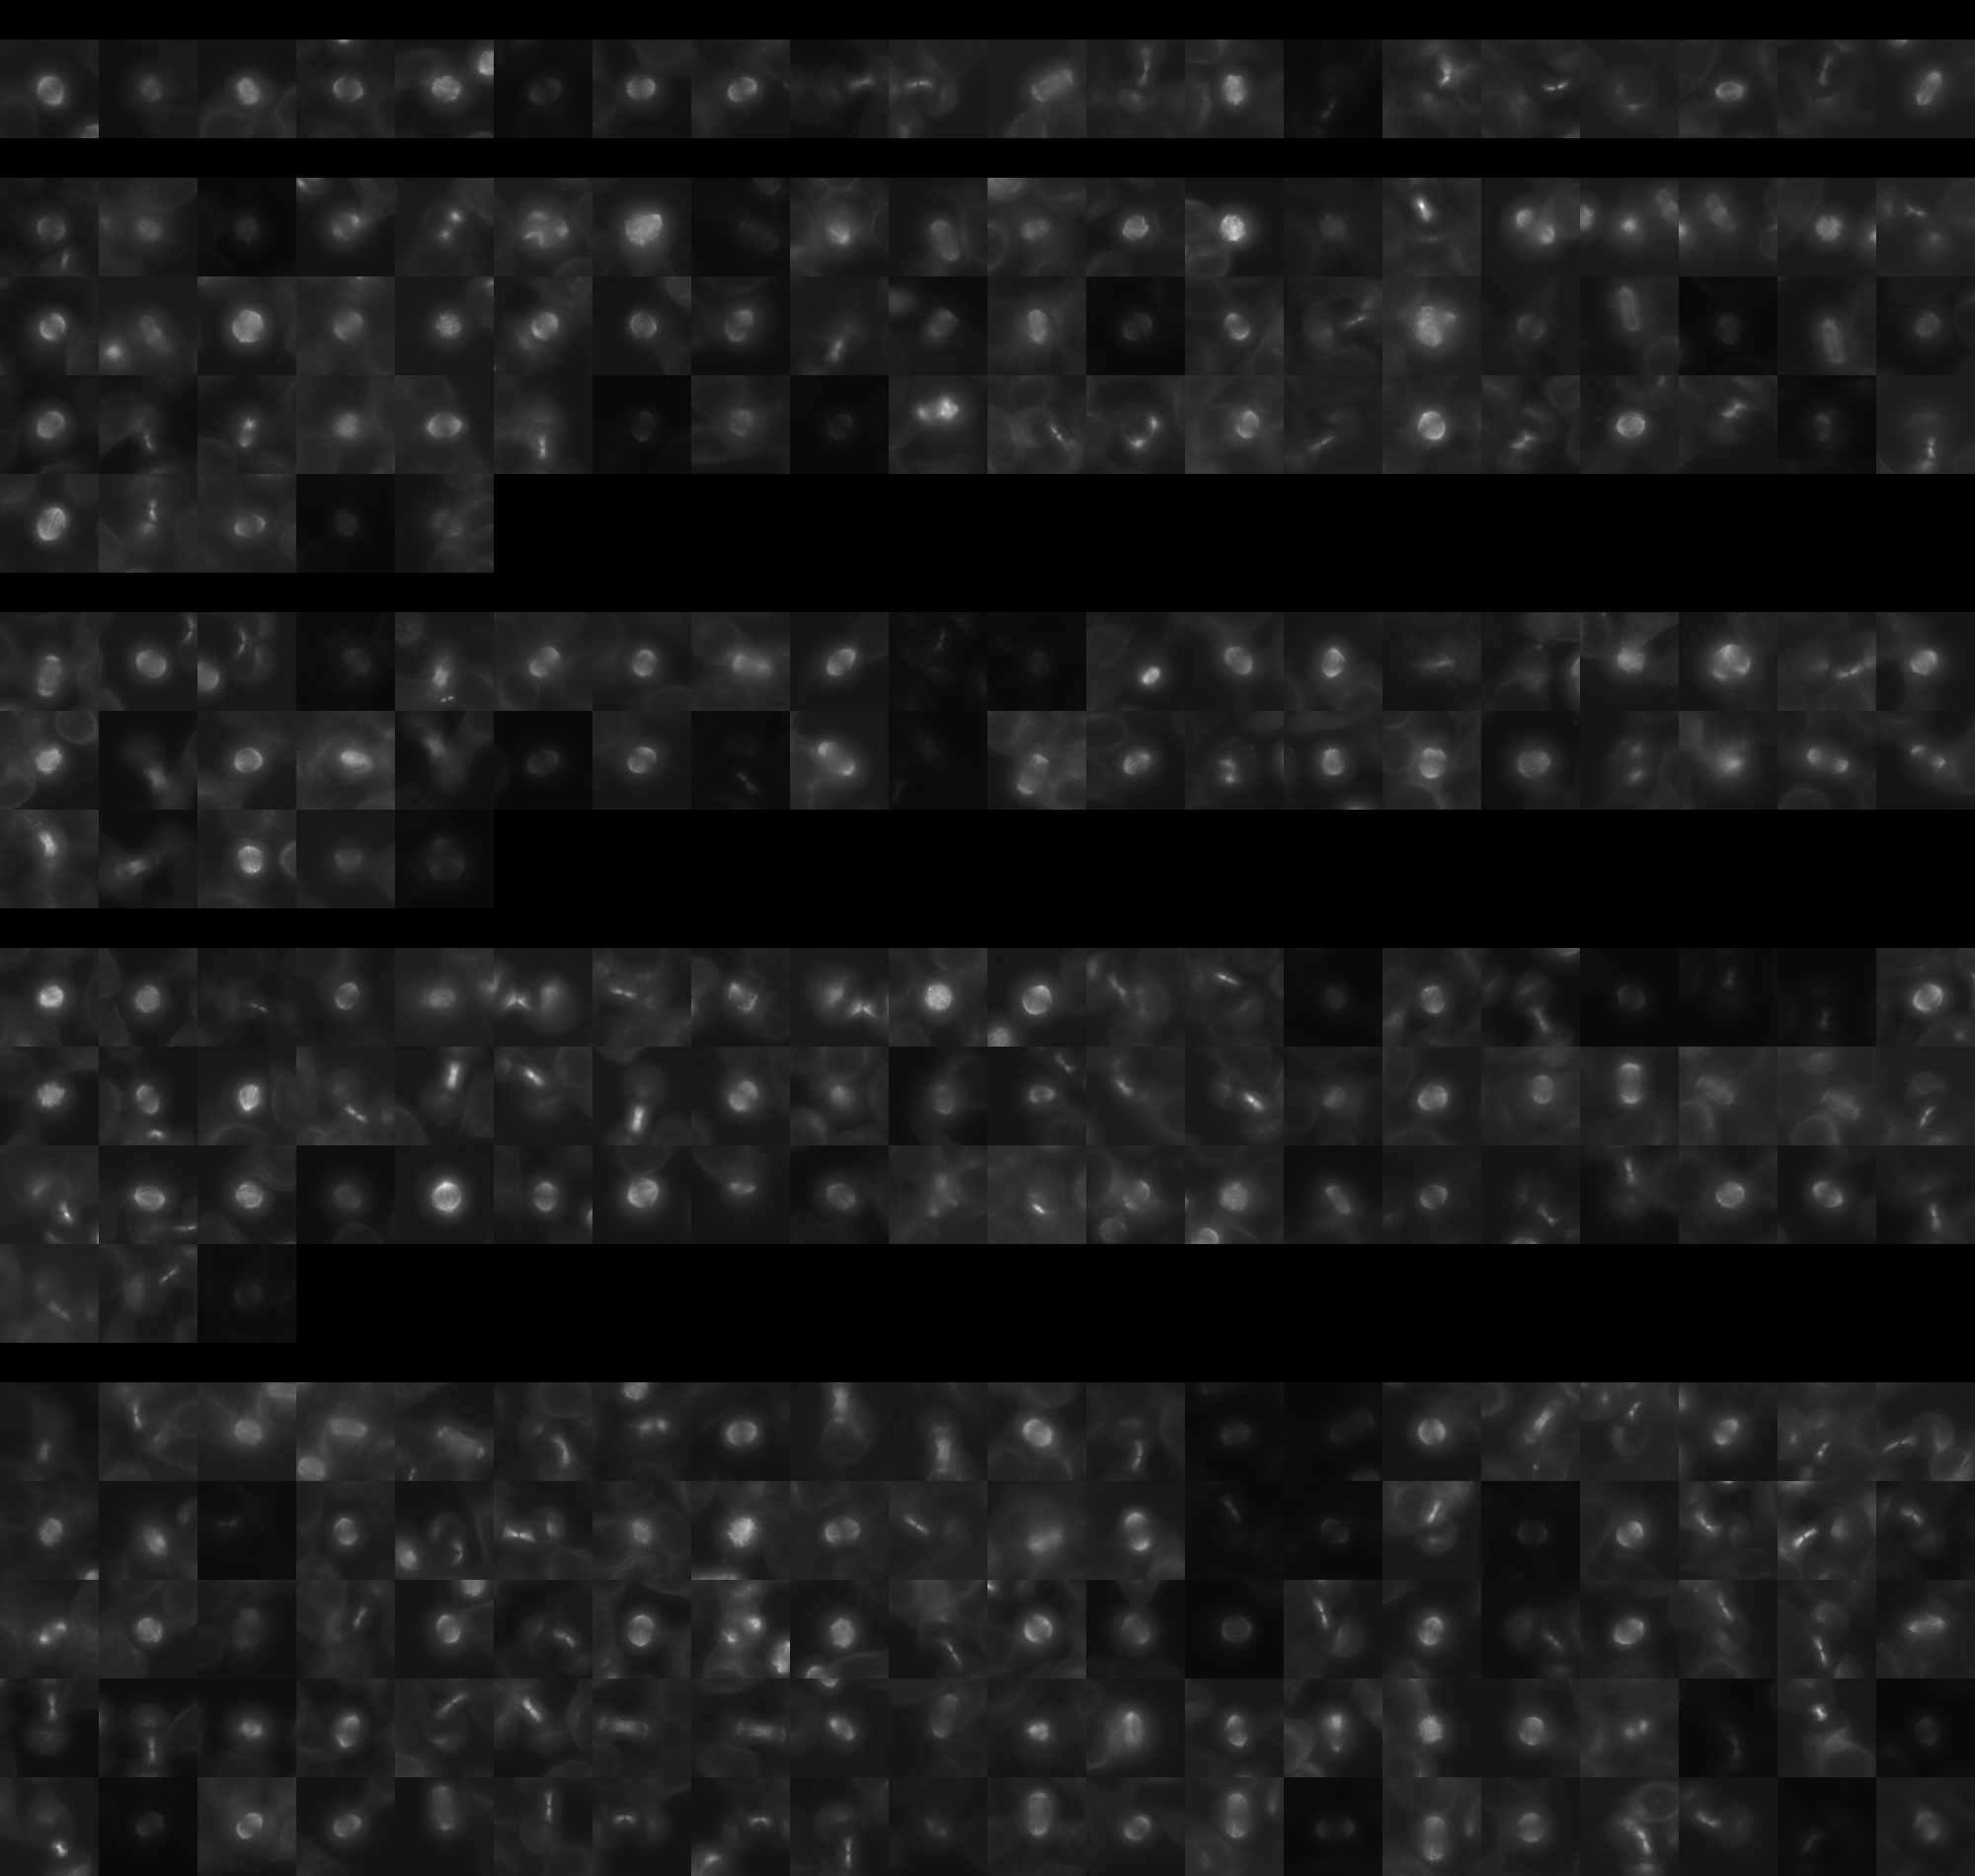
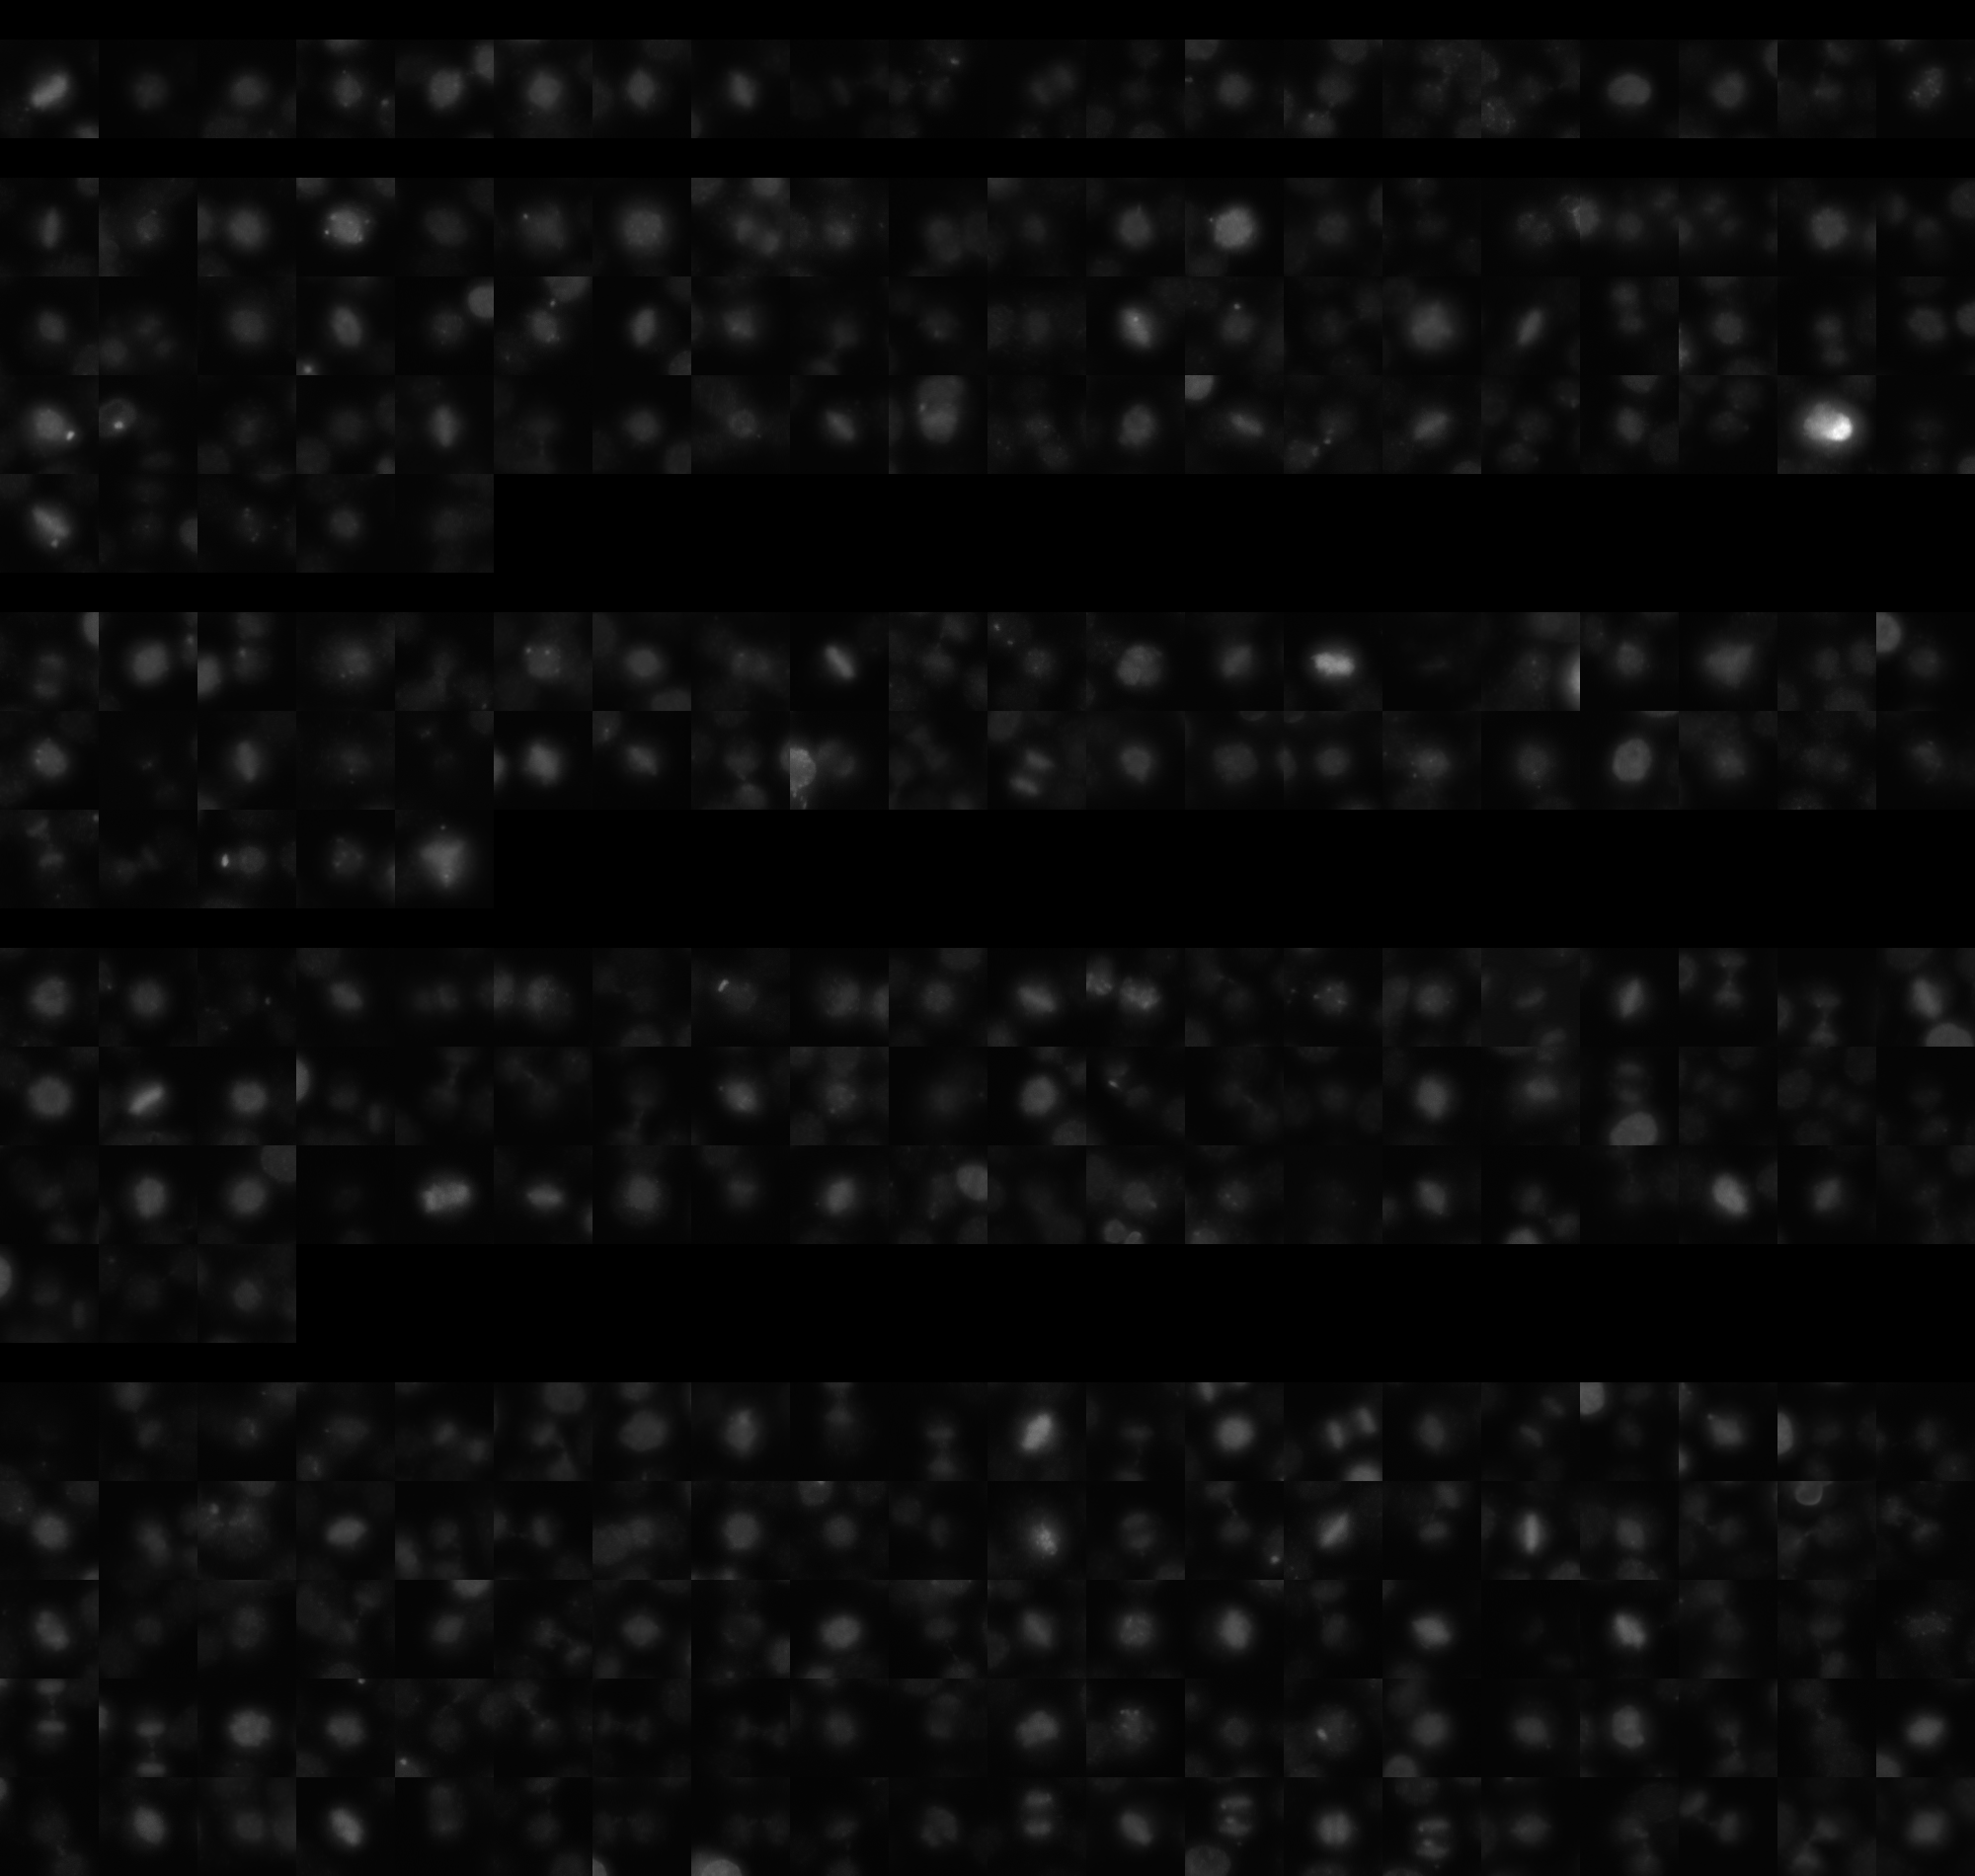
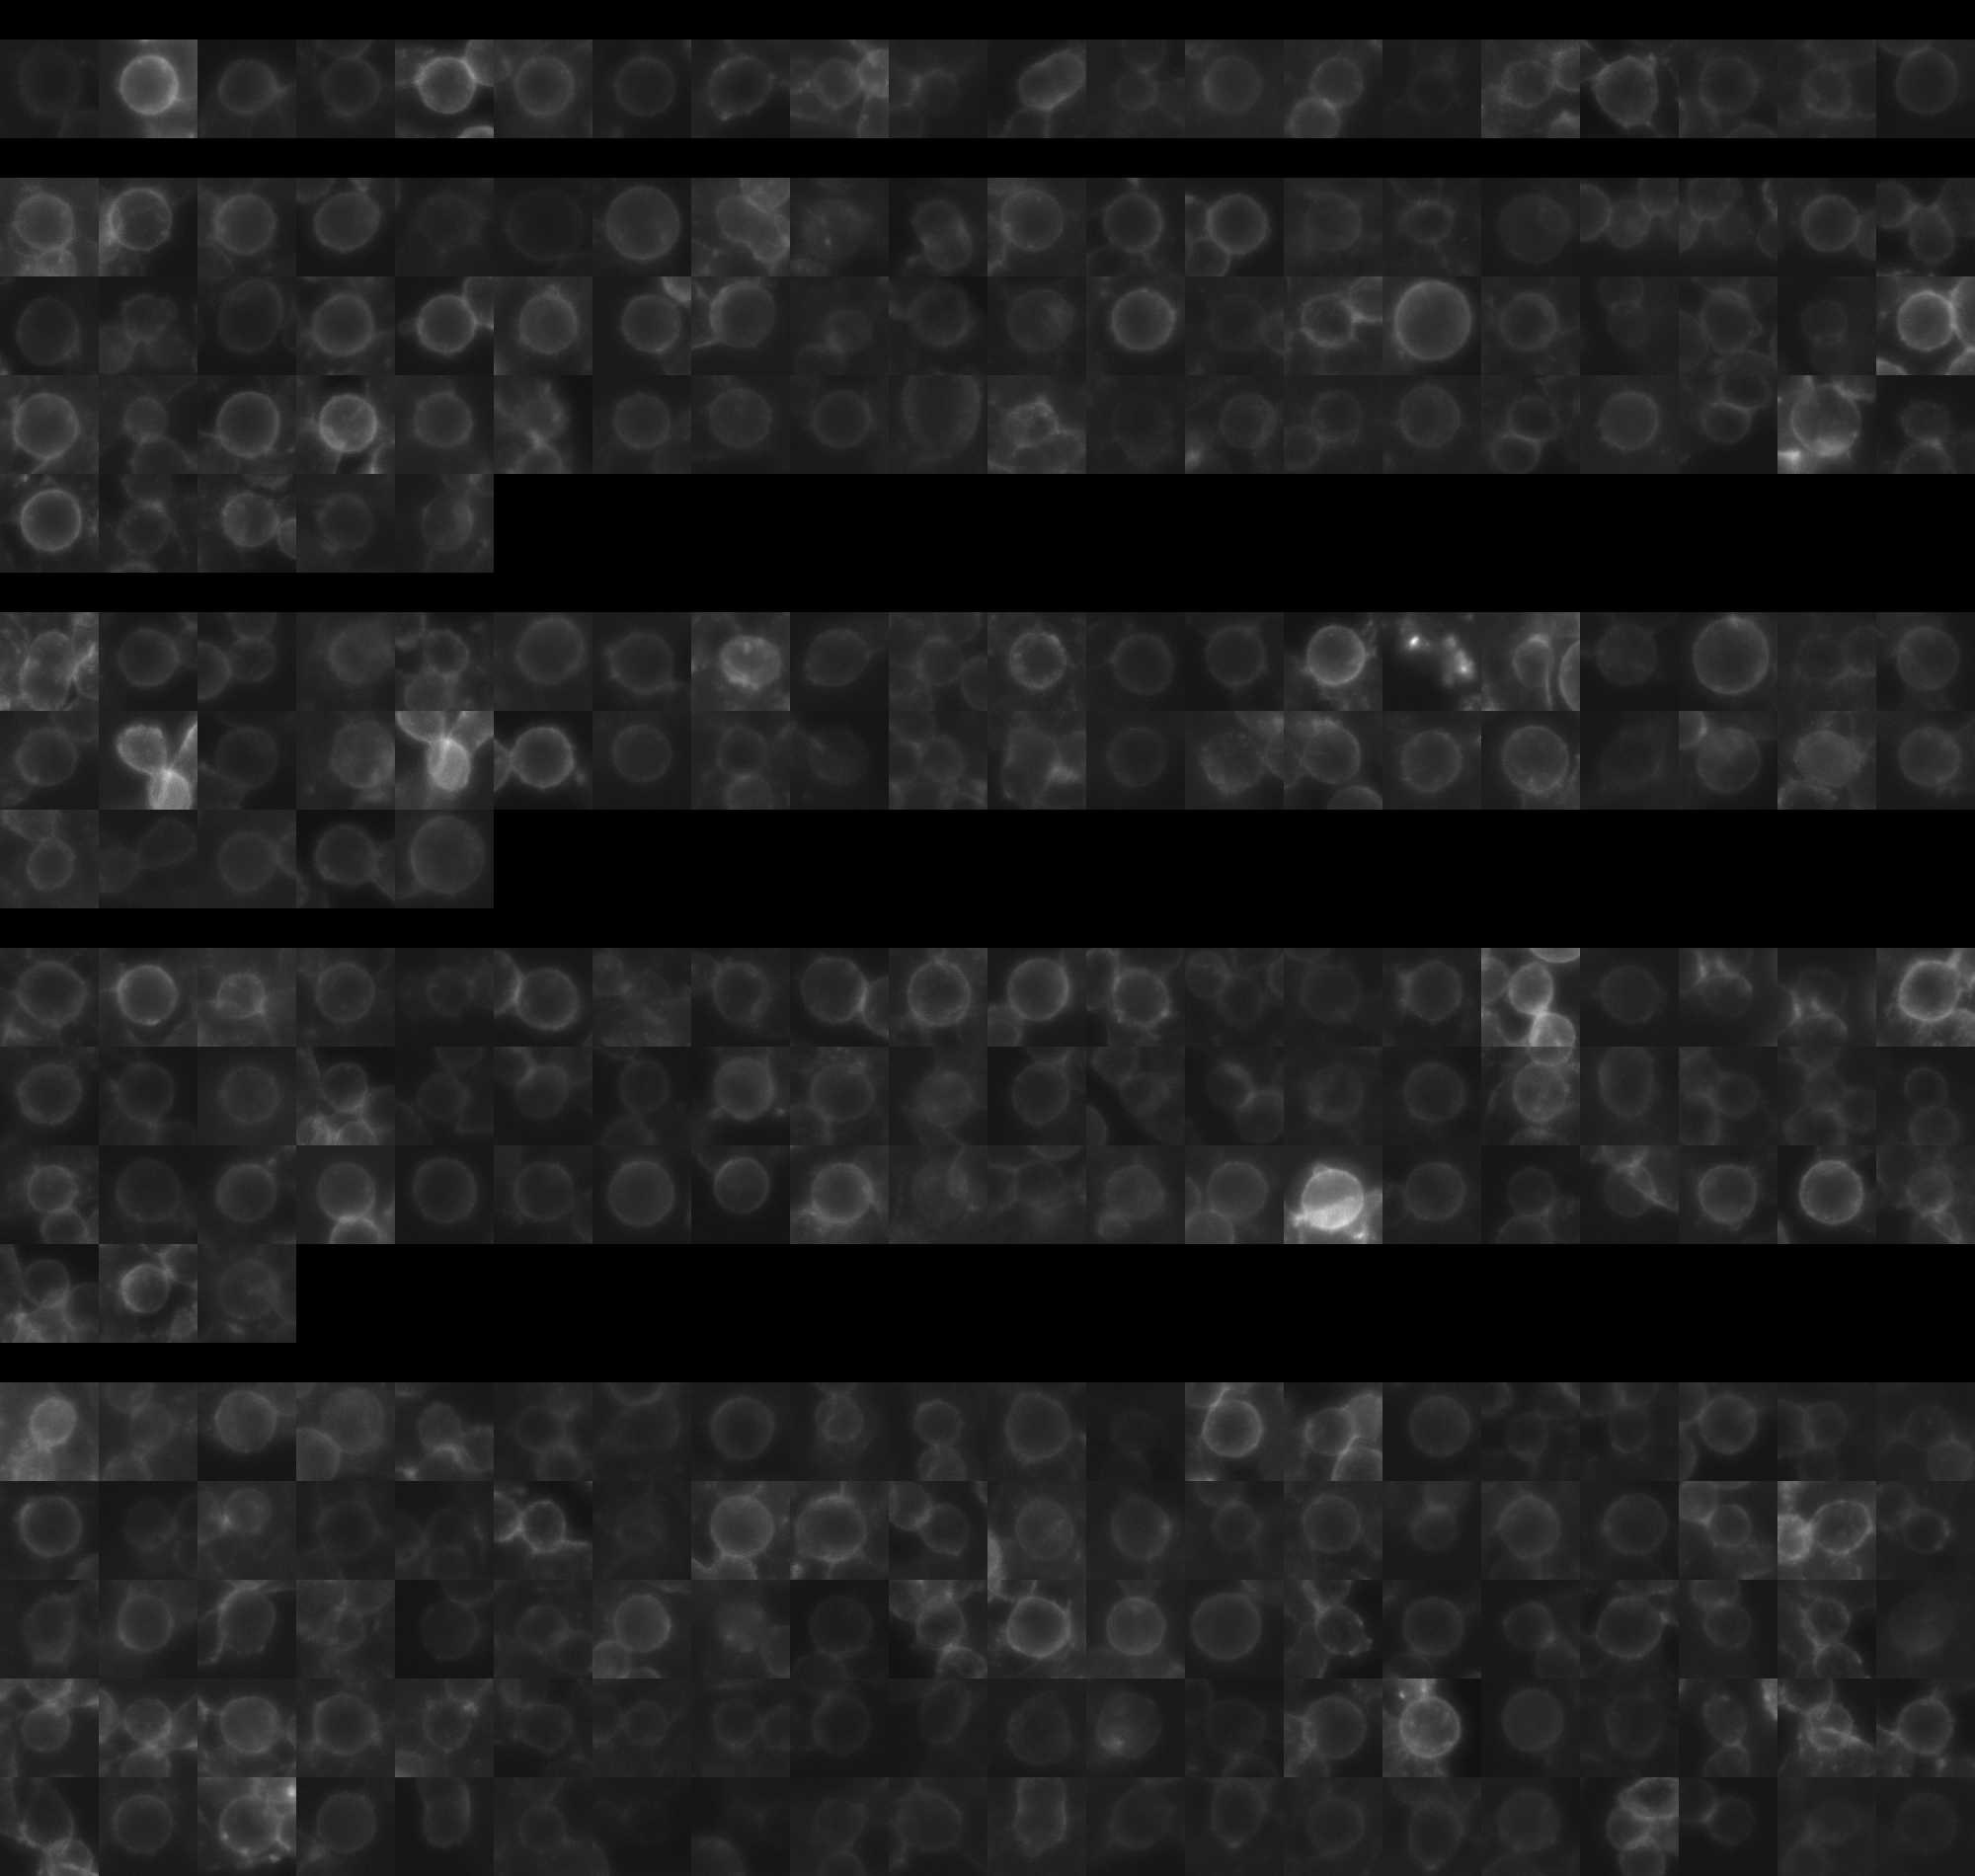
sgRNA 1: AACGCCGGCGACCAGCACGG (interphase cells: 778, mitotic cells: 20)
sgRNA 2: ACTCAGTTCAAAGTGCCCAG (interphase cells: 2002, mitotic cells: 65)
sgRNA 3: AGGATGGGTCCACCAGTGGG (interphase cells: 2051, mitotic cells: 45)
sgRNA 4: TGCCCTCACCATATTCTGCG (interphase cells: 2510, mitotic cells: 63)

Interphase Cluster

Mitotic Cluster

Overview

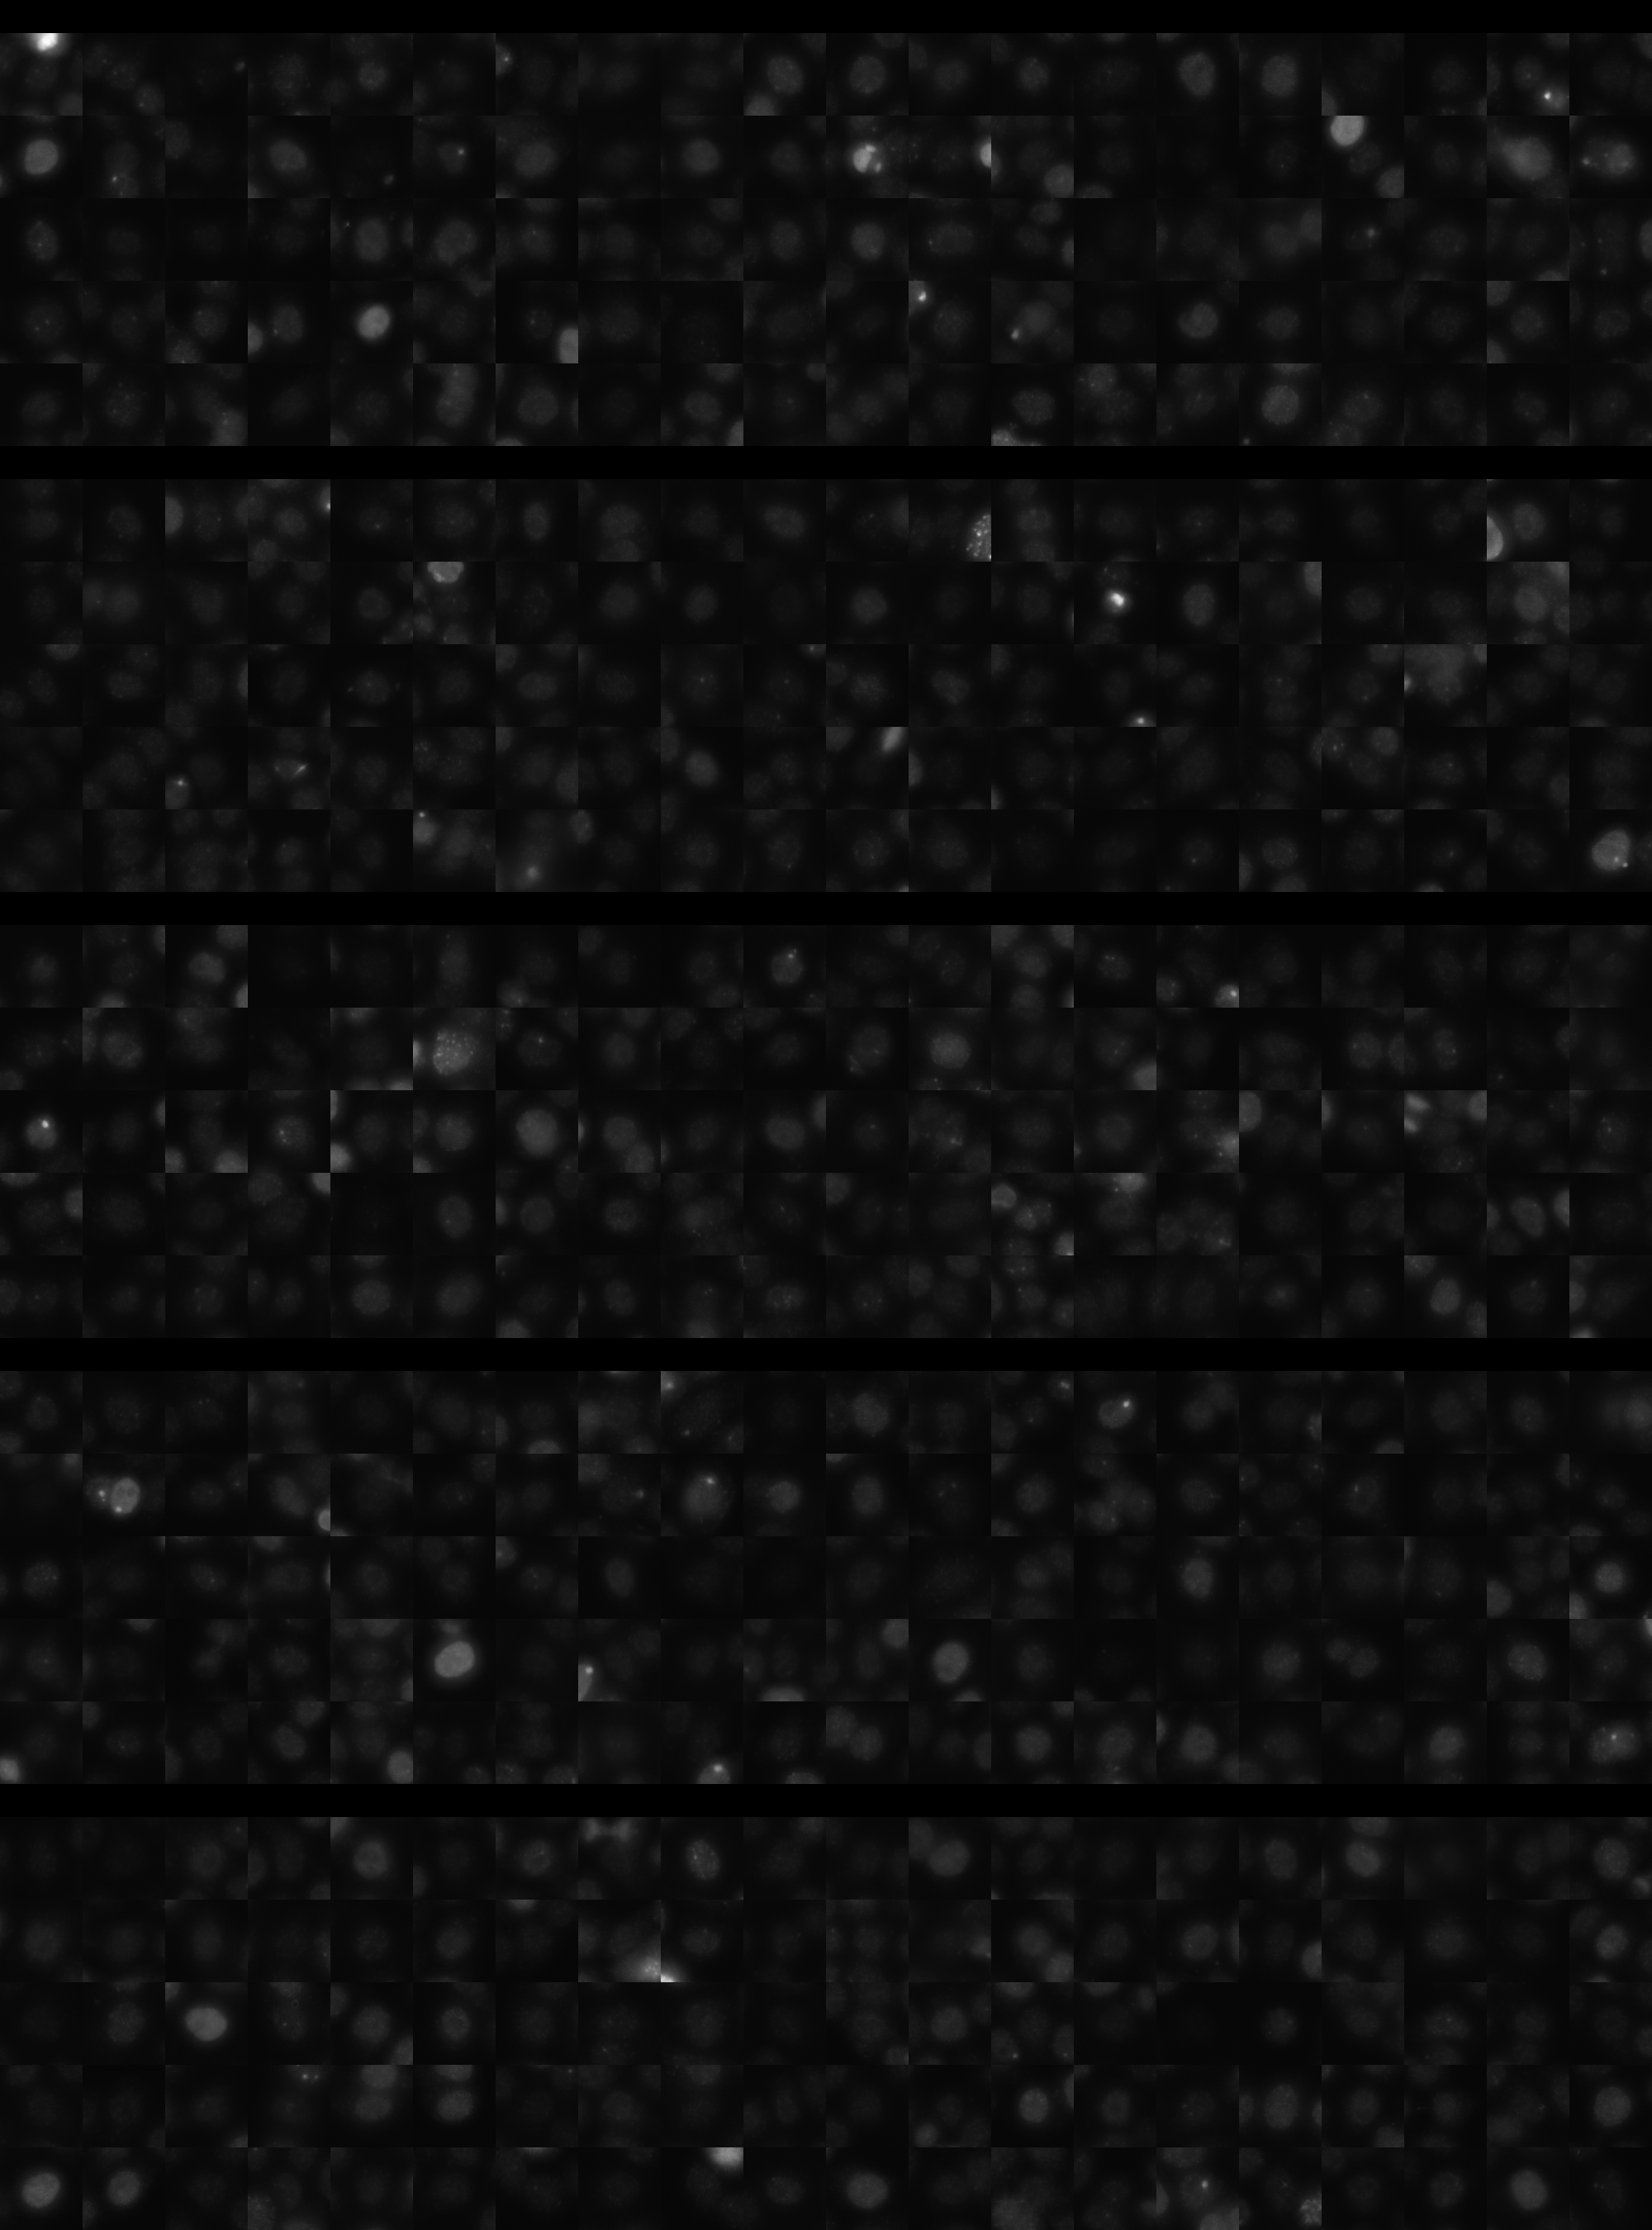
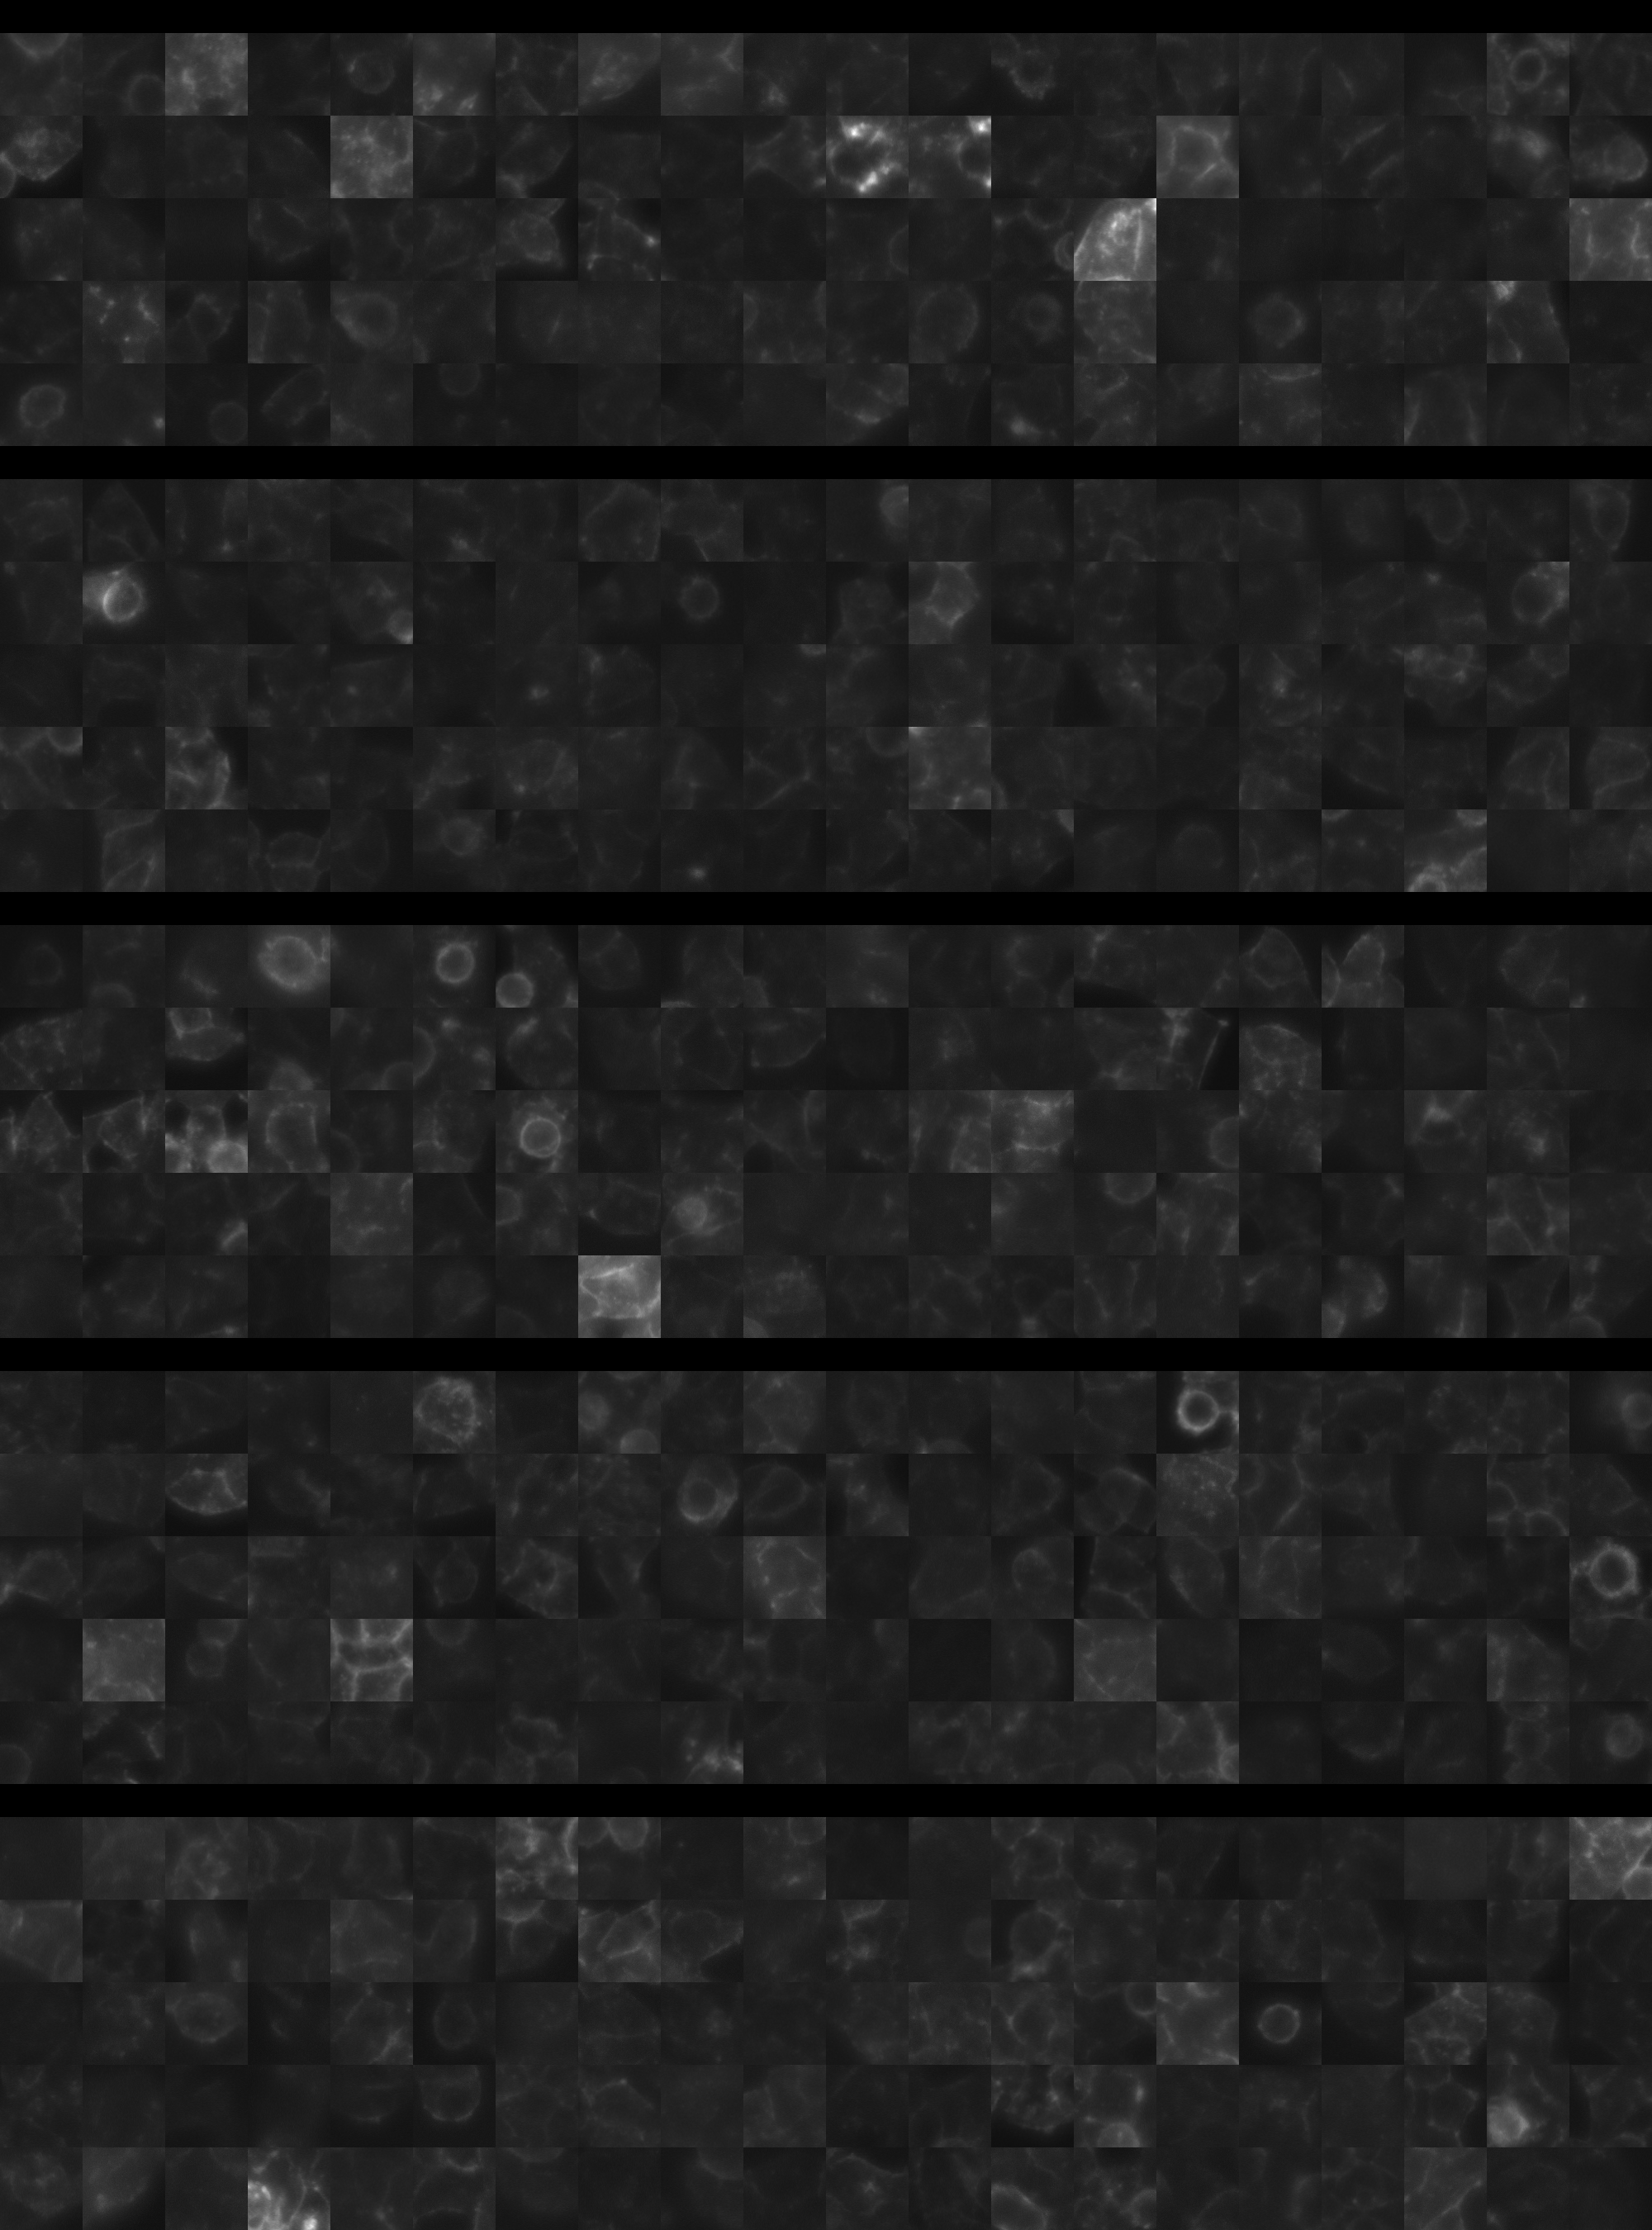
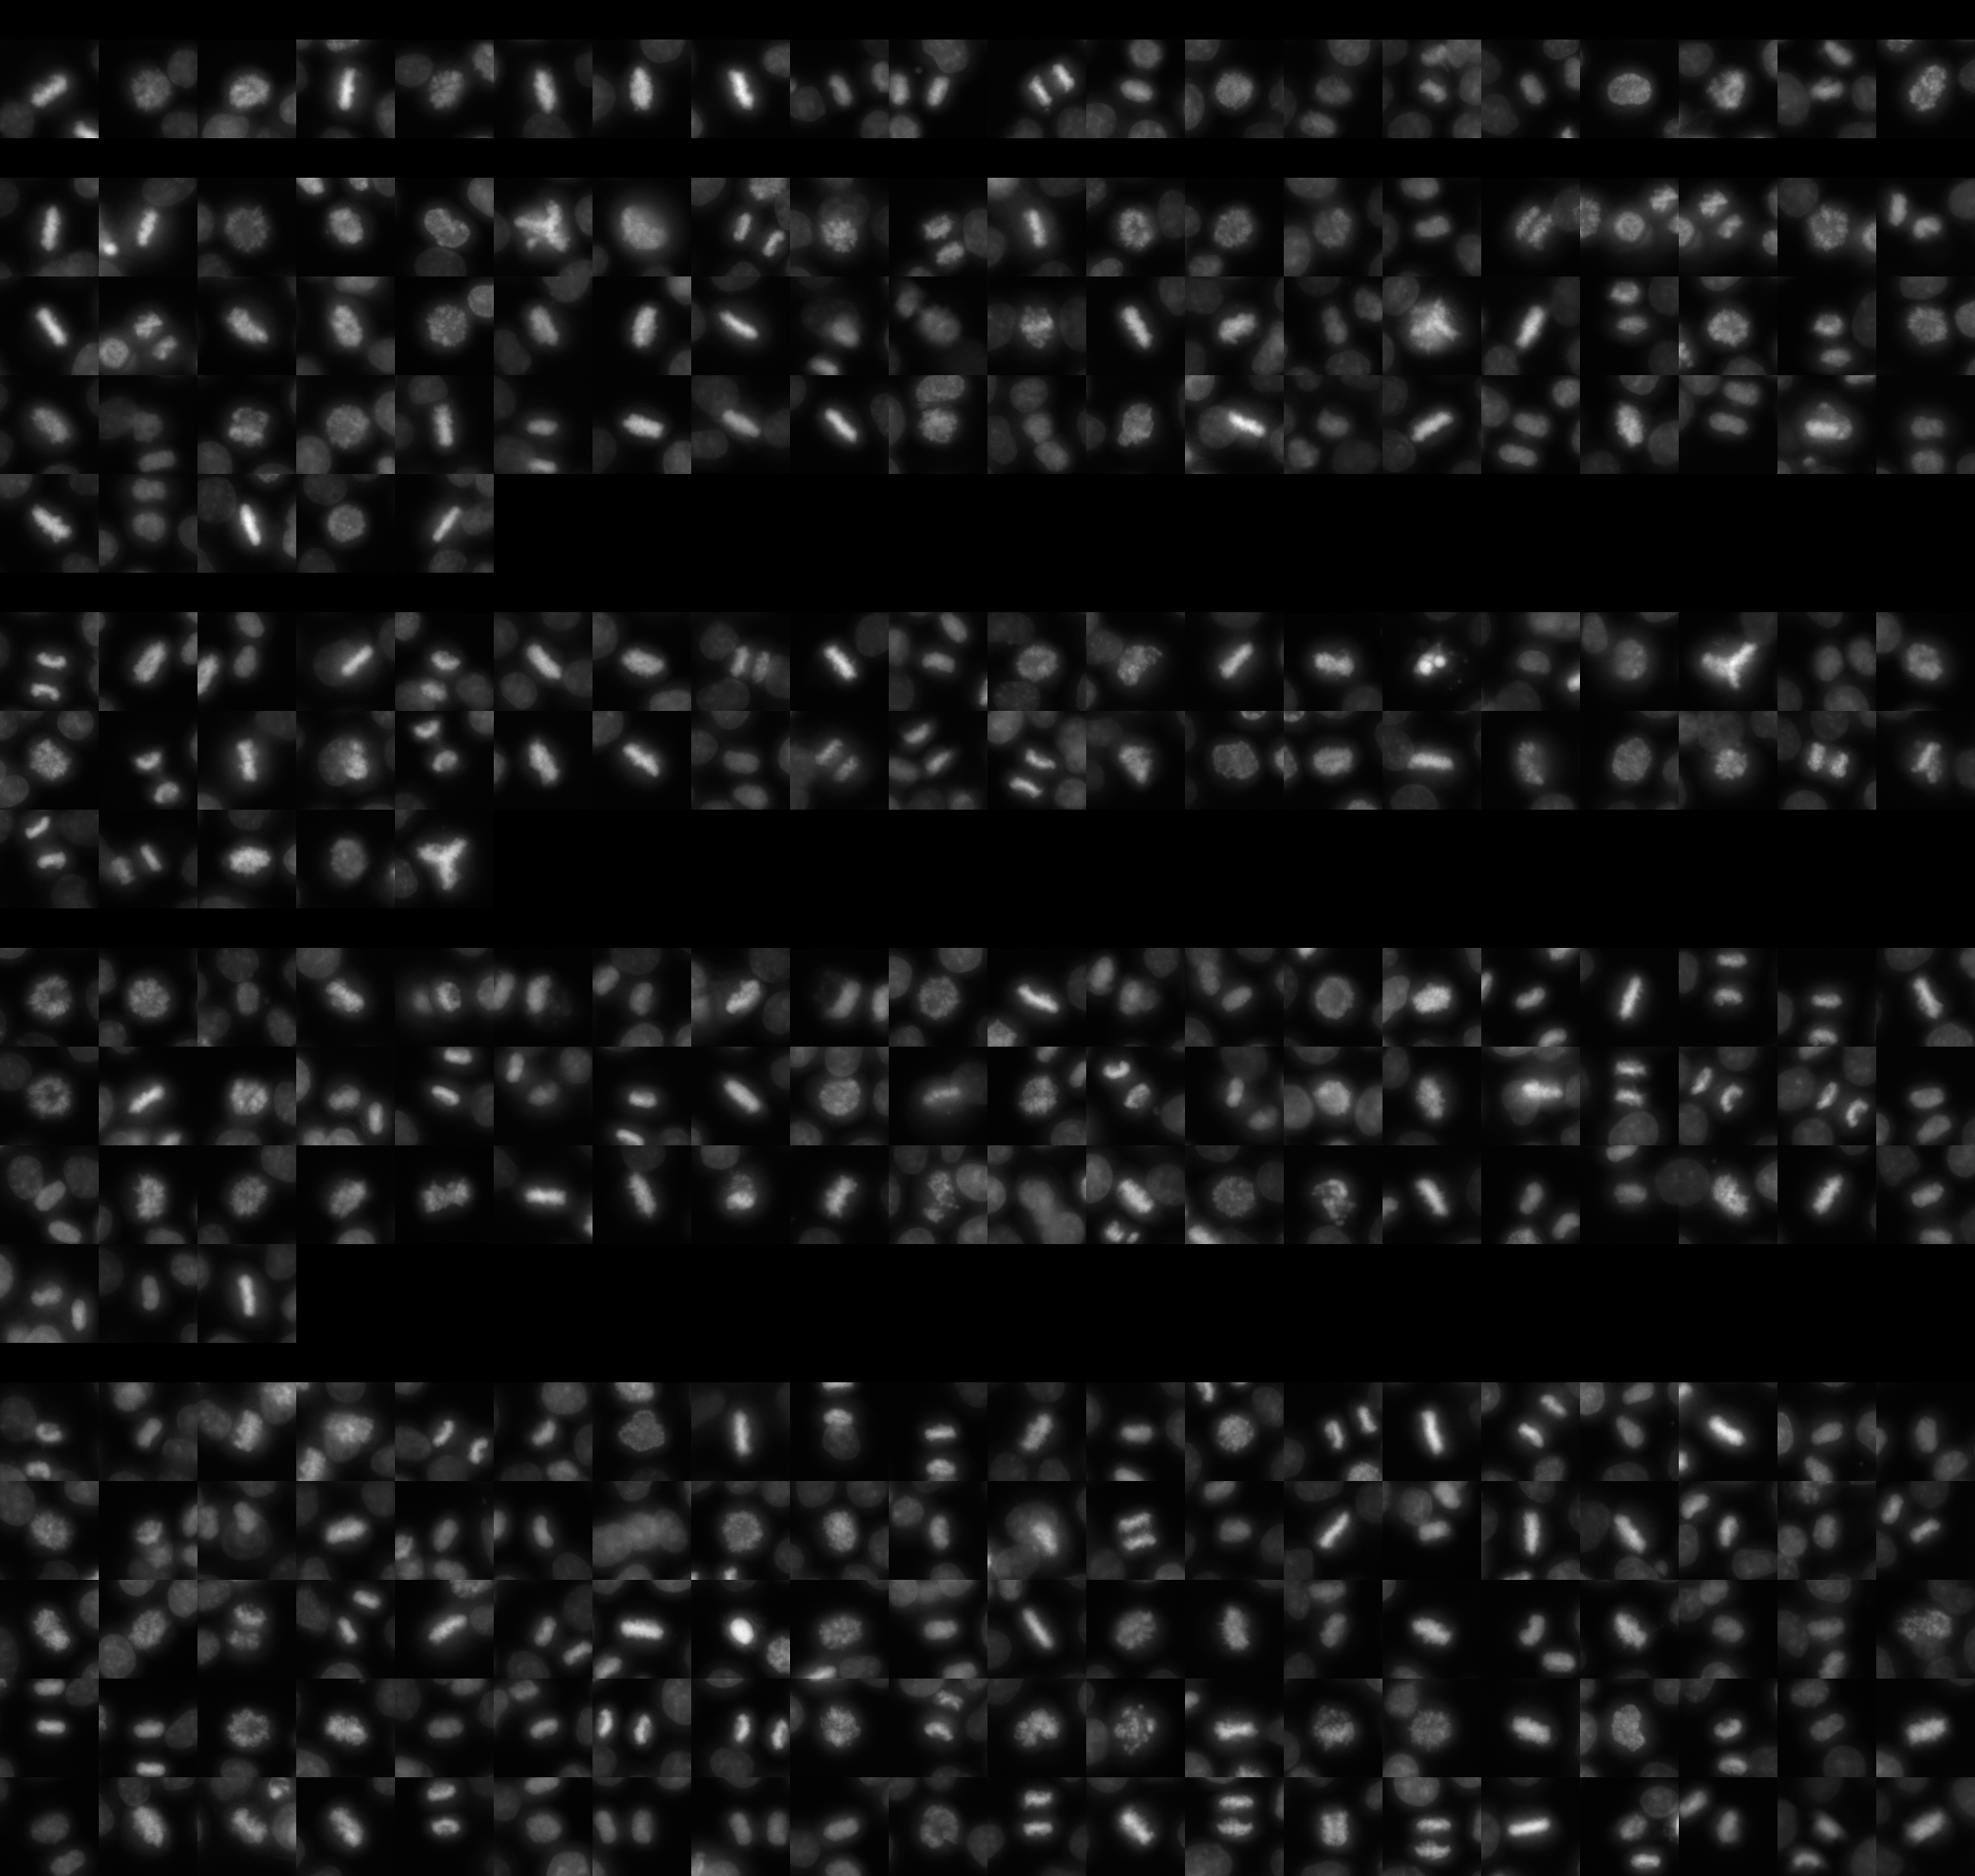
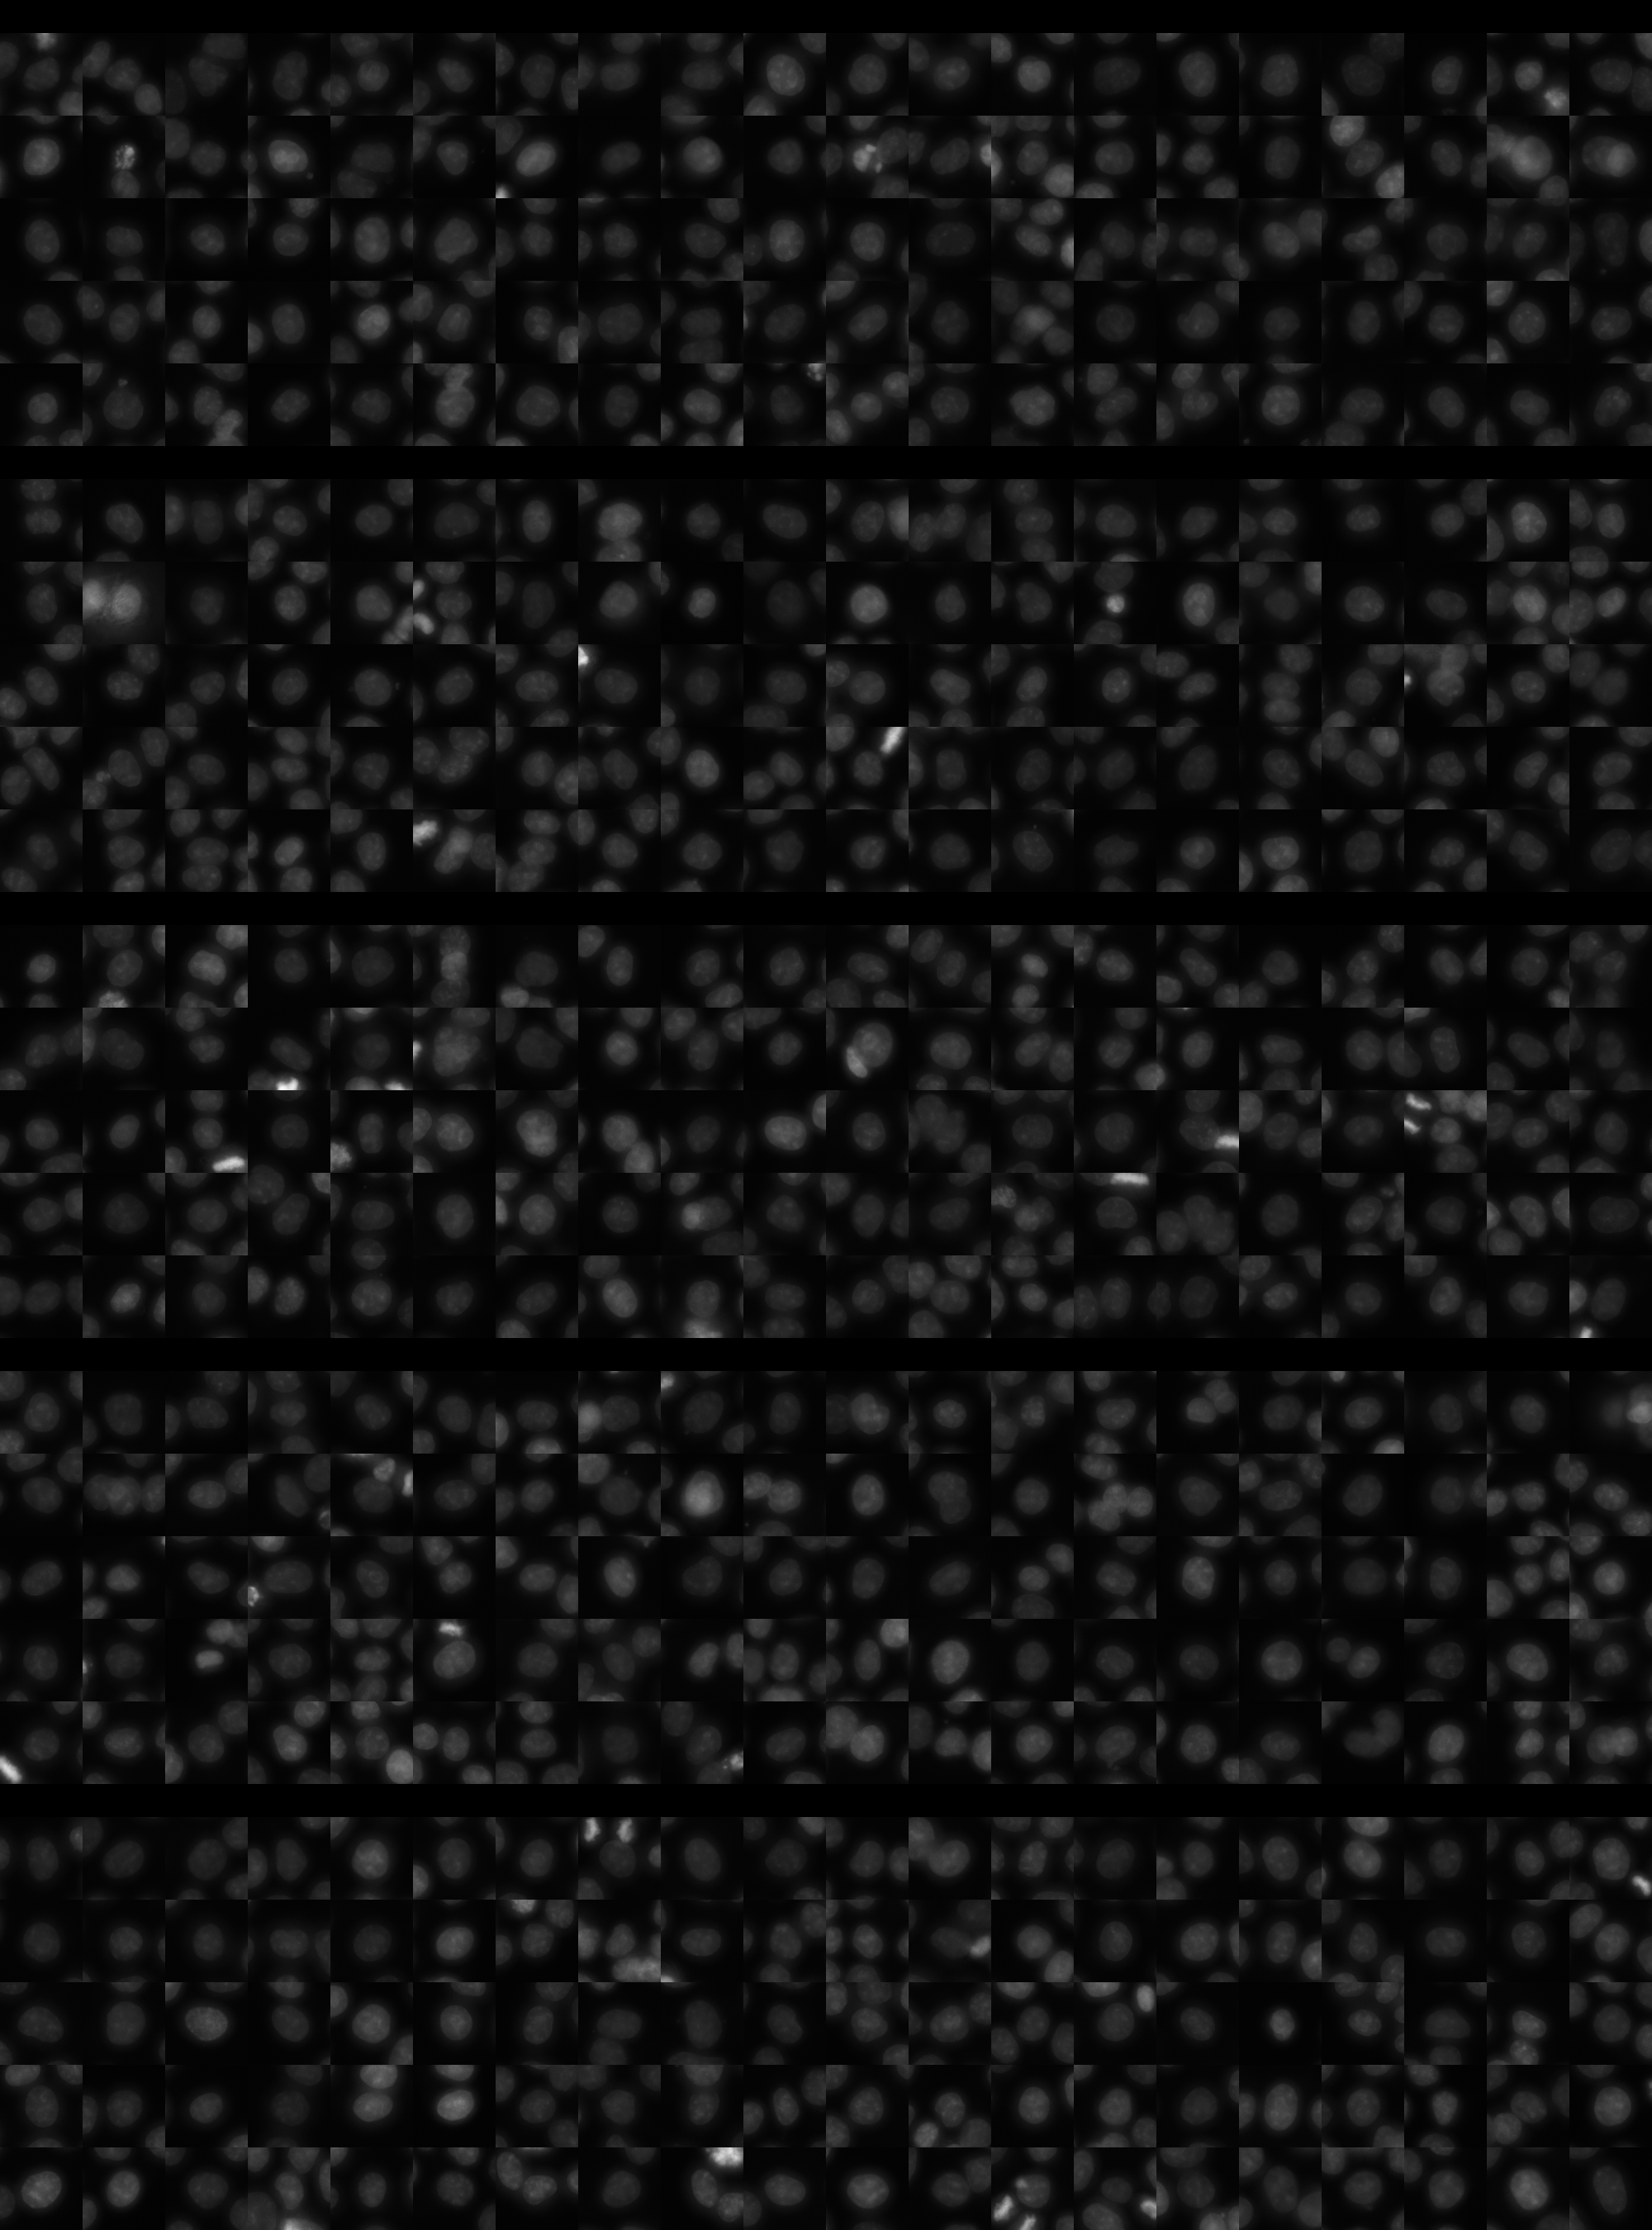
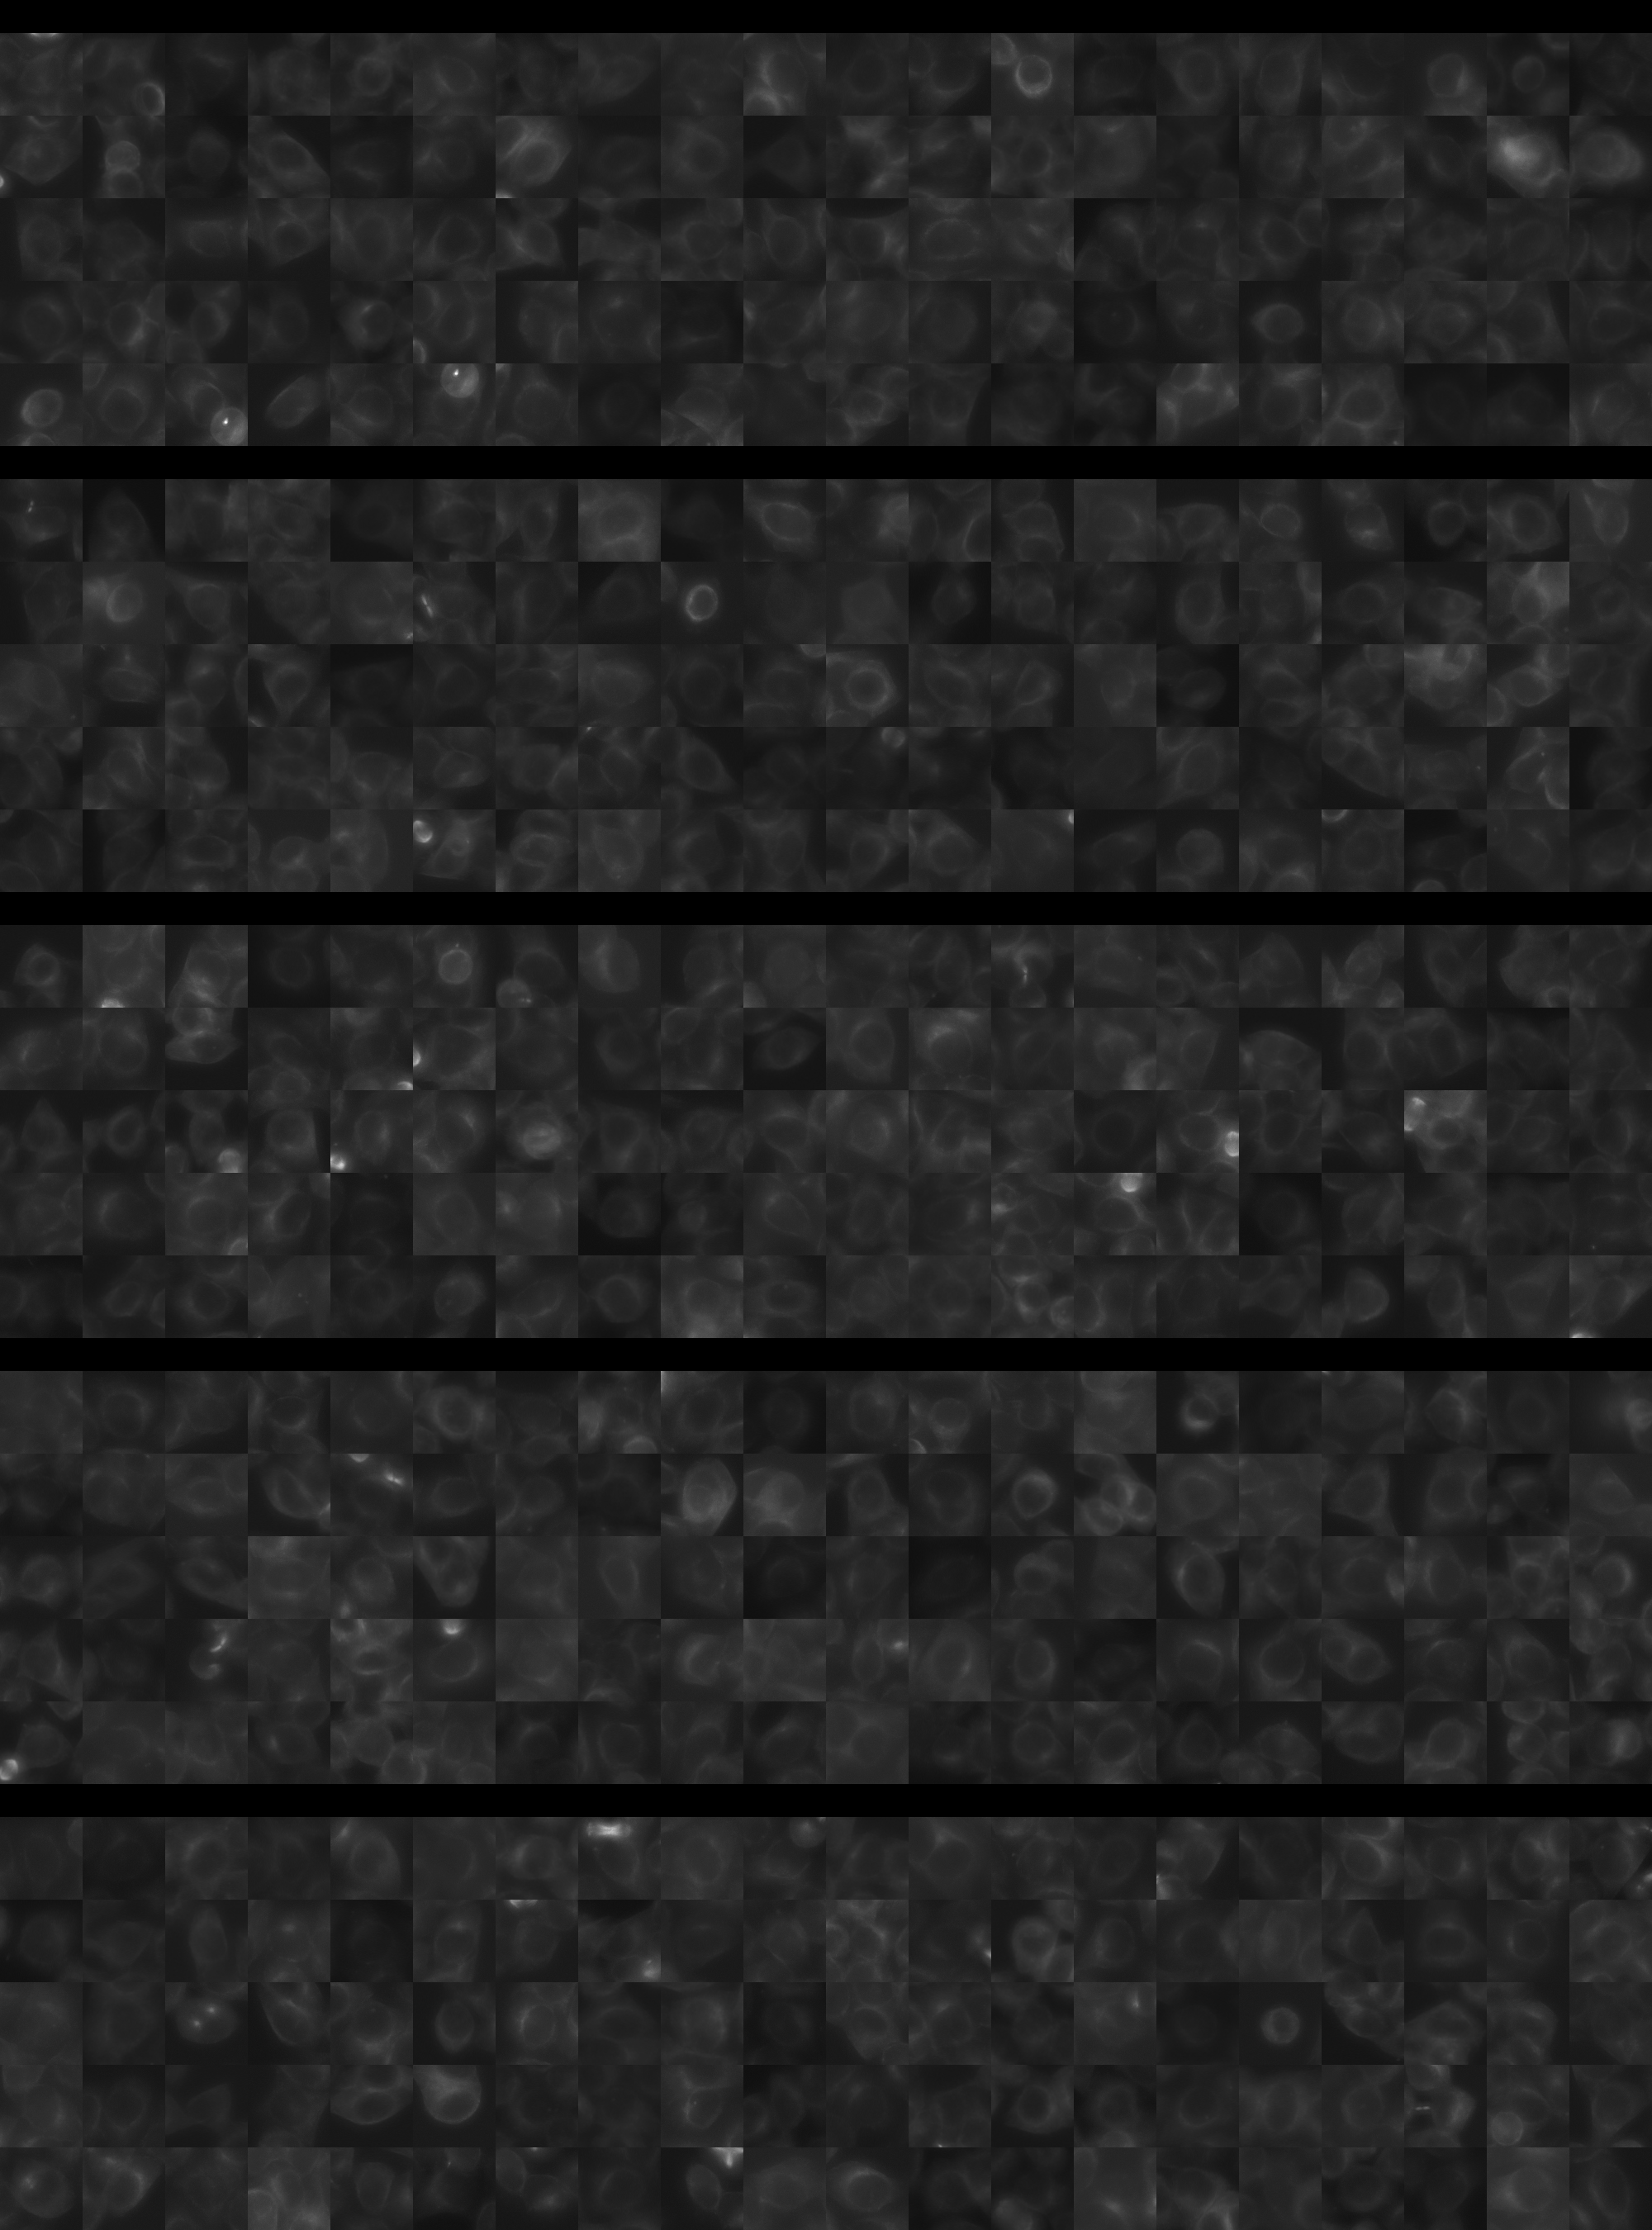
Each montage below shows randomly selected individual cell images for the same target gene separated by sgRNA, along with an example montage of cells expressing a non-targeting negative control sgRNA at the bottom. sgRNA labels in the montages correspond to the numbered sgRNA sequences in the gene info table above. The DNA (blue) and tubulin (green) channels are displayed by default, with gH2AX (grayscale) and actin (yellow) available using the check boxes. Channel brightness, contrast, and opacity are adjustable by clicking the arrow next to the channel name. When only one channel is selected, the display defaults to grayscale. Click the “Zoom” checkbox above the channel controls to enable image zooming (via scrolling) and panning (via click-and-drag).

The cell boxes displayed for this gene are square, 30.36 μm per side for the interphase montage and 30.36 μm per side for the mitotic montage.
Features

Interphase Score Rank FDR q-value
Nucleus DNA Integrated -5.664e-02 4968 of 5322 0.203
Nucleus DNA Mean -1.384e-01 4888 of 5322 0.001
Nucleus gH2AX Mean 0.087 2326 of 5322 0.027
Nucleus DNA - gH2AX Correlation -1.394e-01 4639 of 5322 1.021e-04
Nucleus Shape Area 0.022 2548 of 5322 0.814
Nucleus Shape Eccentricity 0.046 1041 of 5322 0.208
Nucleus Shape Form Factor -1.017e-01 4413 of 5322 0.009
Nucleus Shape Solidity -9.223e-02 4136 of 5322 0.006
Cell DNA Mass Displacement 0.070 558 of 5322 0.112
Cell Tubulin Mean -1.135e-02 3233 of 5322 0.888
Cell Tubulin Mass Displacement -2.953e-02 4358 of 5322 0.590
Cell Actin Mean -6.048e-02 4531 of 5322 0.205
Cell Tubulin - Actin Correlation 0.143 320 of 5322 2.896e-04
Cell DNA - Tubulin Correlation 0.163 454 of 5322 5.238e-04
Cell Shape Area -8.213e-02 4701 of 5322 0.032
Cell Shape Eccentricity 0.046 687 of 5322 0.383
Mitotic Score Rank FDR q-value
Nucleus DNA Integrated 0.151 1802 of 5322 0.924
Nucleus DNA Mean -5.251e-03 3047 of 5322 1.000
Nucleus DNA Mass Displacement -2.616e-02 3900 of 5322 0.999
Nucleus DNA Mean Frac 3 0.286 248 of 5322 1.000
Nucleus gH2AX Mean -6.540e-02 3845 of 5322 1.000
Nucleus gH2AX Mean Frac 0 -3.020e-01 5180 of 5322 1.000
Nucleus Tubulin Mean Frac 0 0.085 2180 of 5322 0.999
Nucleus Tubulin Mean Edge 0.062 2351 of 5322 0.999
Nucleus Tubulin Std Edge -1.364e-01 4225 of 5322 0.999
Nucleus Shape Area 0.289 843 of 5322 0.645
Nucleus Shape Eccentricity -2.482e-01 4779 of 5322 1.000
Nucleus Shape Form Factor -3.626e-01 5012 of 5322 0.675
Cell Tubulin Mean 0.177 1159 of 5322 0.997
Cell Tubulin Mean Frac 3 -4.895e-02 2292 of 5322 0.999
Cell Actin Mean 0.160 1203 of 5322 0.997
Cell Shape Area 0.122 2297 of 5322 0.998
( Reset Zoom )
Brightness
Contrast
Opacity
Brightness
Contrast
Opacity
Brightness
Contrast
Opacity
Brightness
Contrast
Opacity
Brightness
Contrast
Opacity

( Reset Zoom )
Brightness
Contrast
Opacity
Brightness
Contrast
Opacity
Brightness
Contrast
Opacity
Brightness
Contrast
Opacity
Brightness
Contrast
Opacity

MIT Central Accessability