HARS2

Gene symbol: HARS2
Gene: 23438
Uniprot Function: Mitochondrial aminoacyl-tRNA synthetase that catalyzes the ATP-dependent ligation of histidine to the 3'-end of its cognate tRNA, via the formation of an aminoacyl-adenylate intermediate (His-AMP).
Mitotic Index 0.0294
Interphase Cluster: #163 (17 genes)
Mitotic Cluster: #116 (23 genes)
sgRNA 1: AGGATACAGTAAGGTCATAG (interphase cells: 2387, mitotic cells: 73)
sgRNA 2: ATGACCGGCGGATTGTGGAT (interphase cells: 1148, mitotic cells: 33)
sgRNA 3: TCCCTCACAACCATATGCTG (interphase cells: 3007, mitotic cells: 95)
sgRNA 4: TGAGGTGGCTGATCGAATTG (interphase cells: 1350, mitotic cells: 38)

Interphase Cluster

Mitotic Cluster

Overview

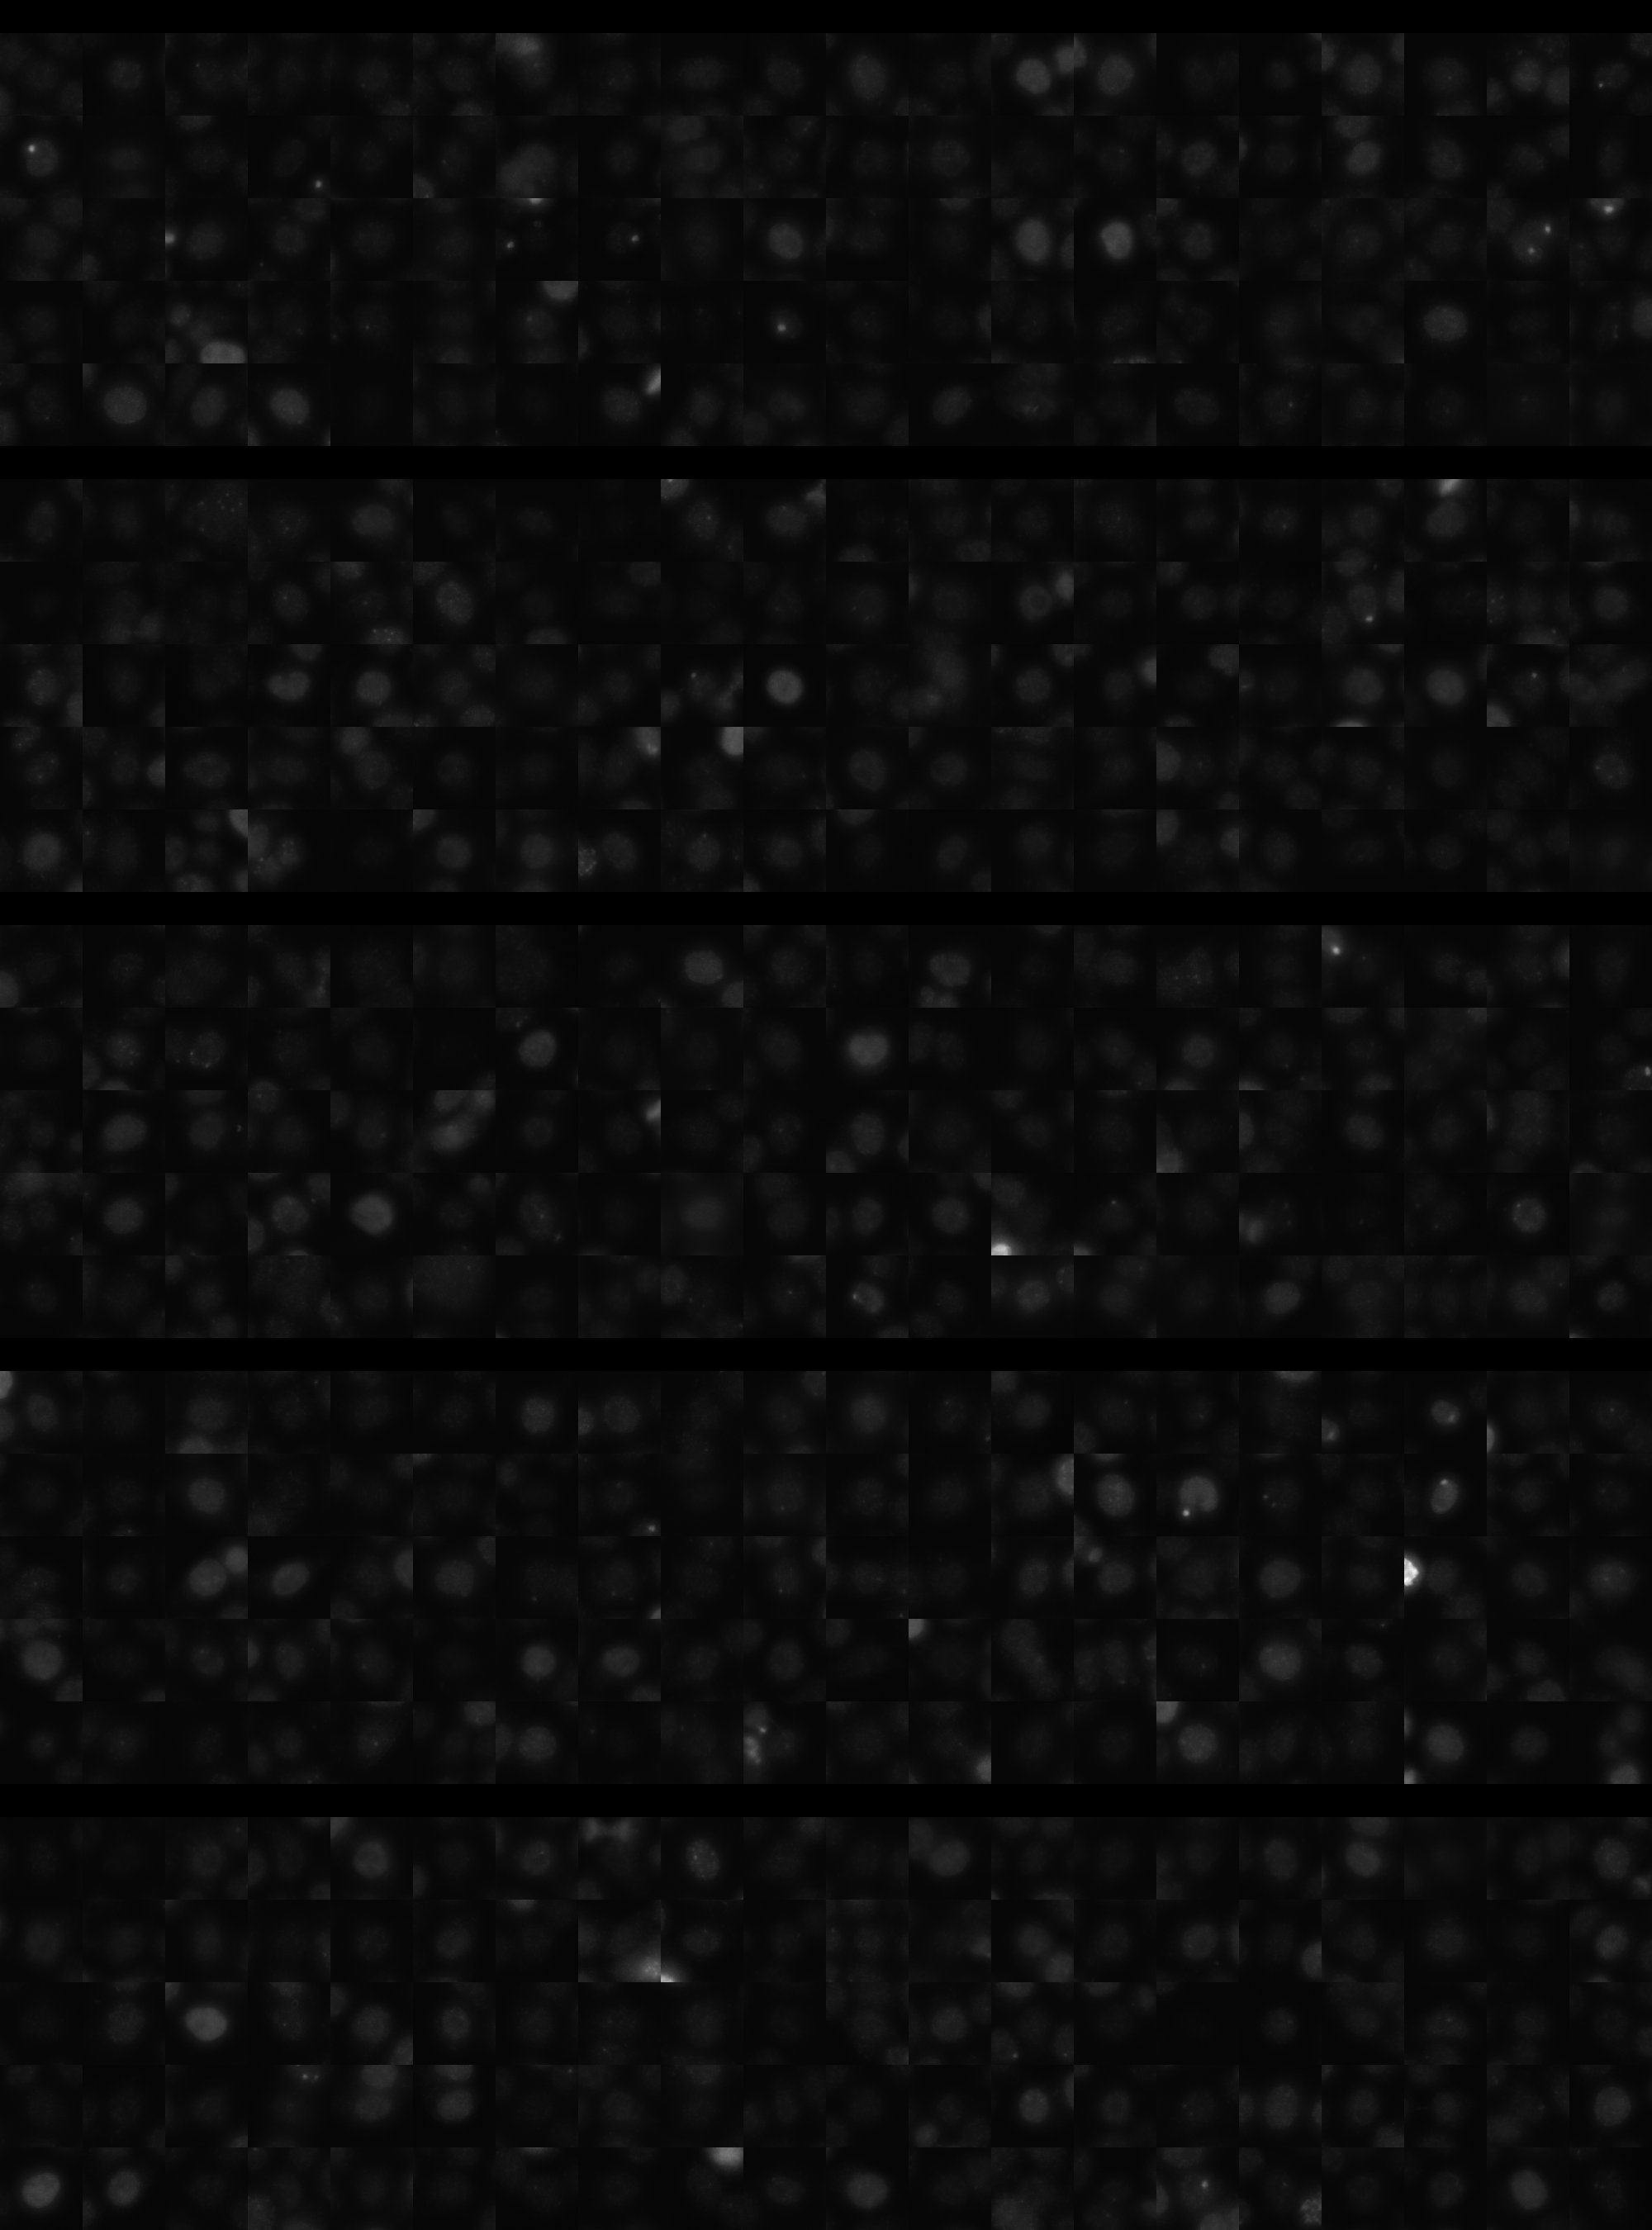
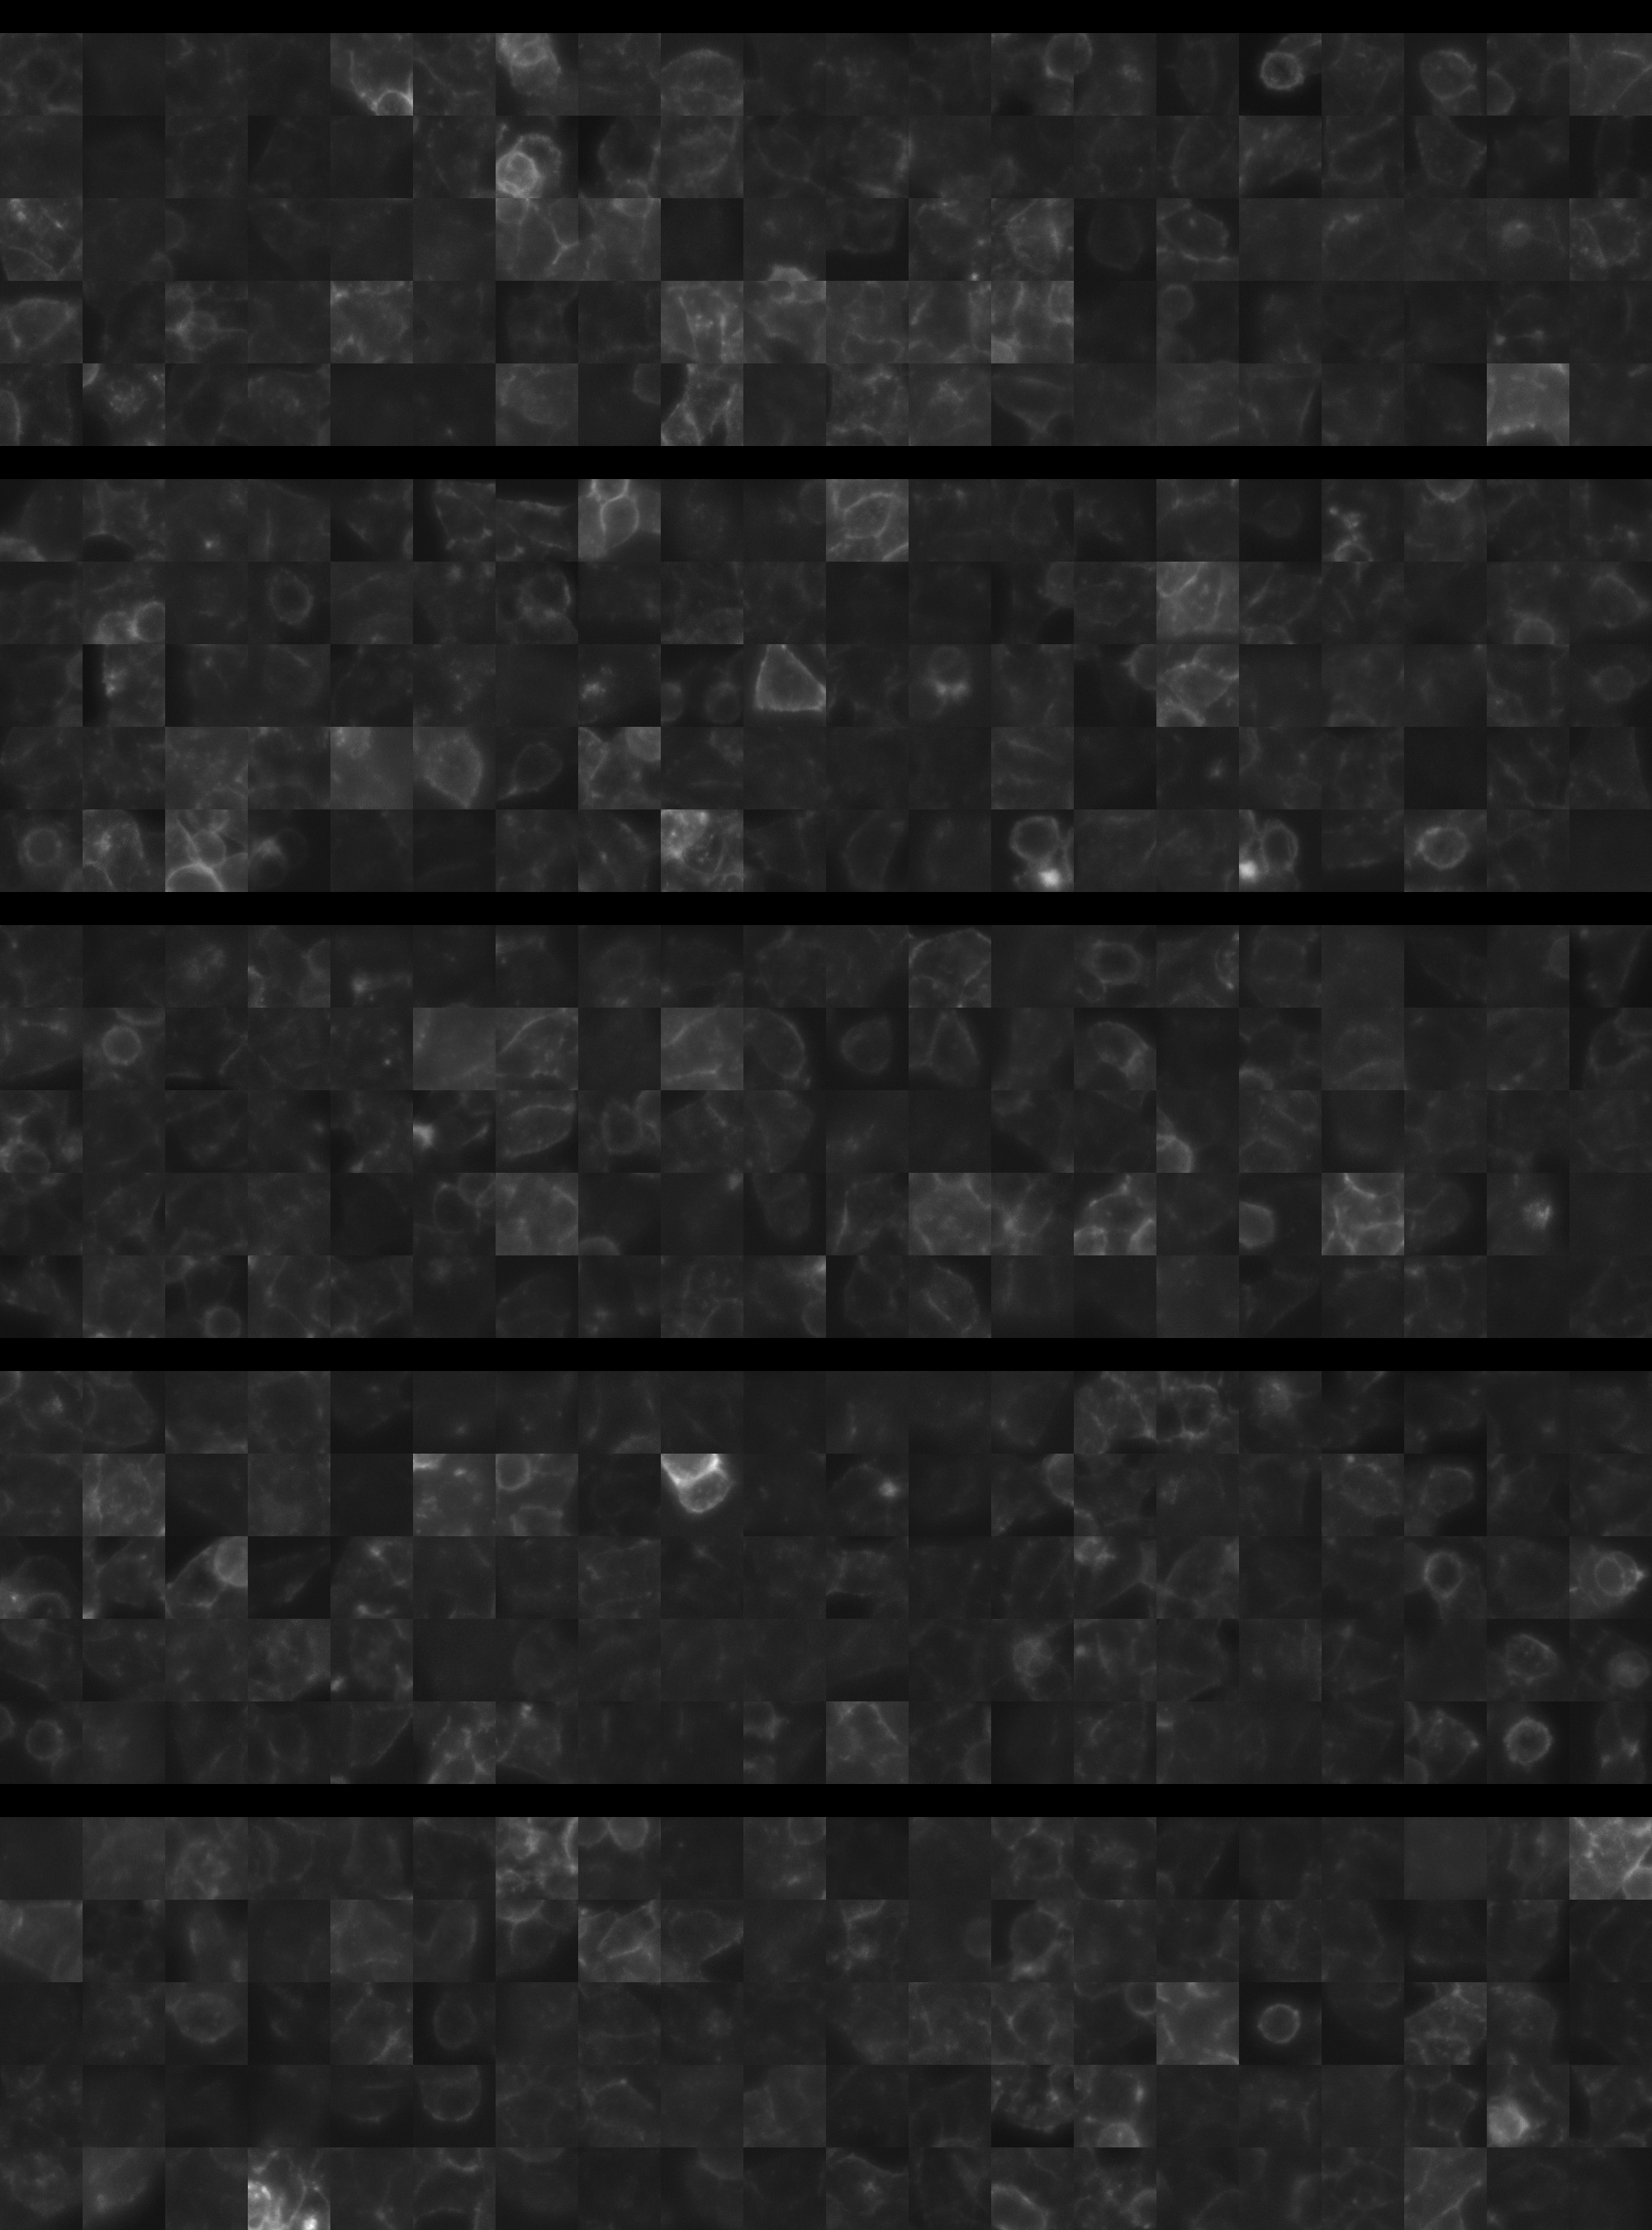
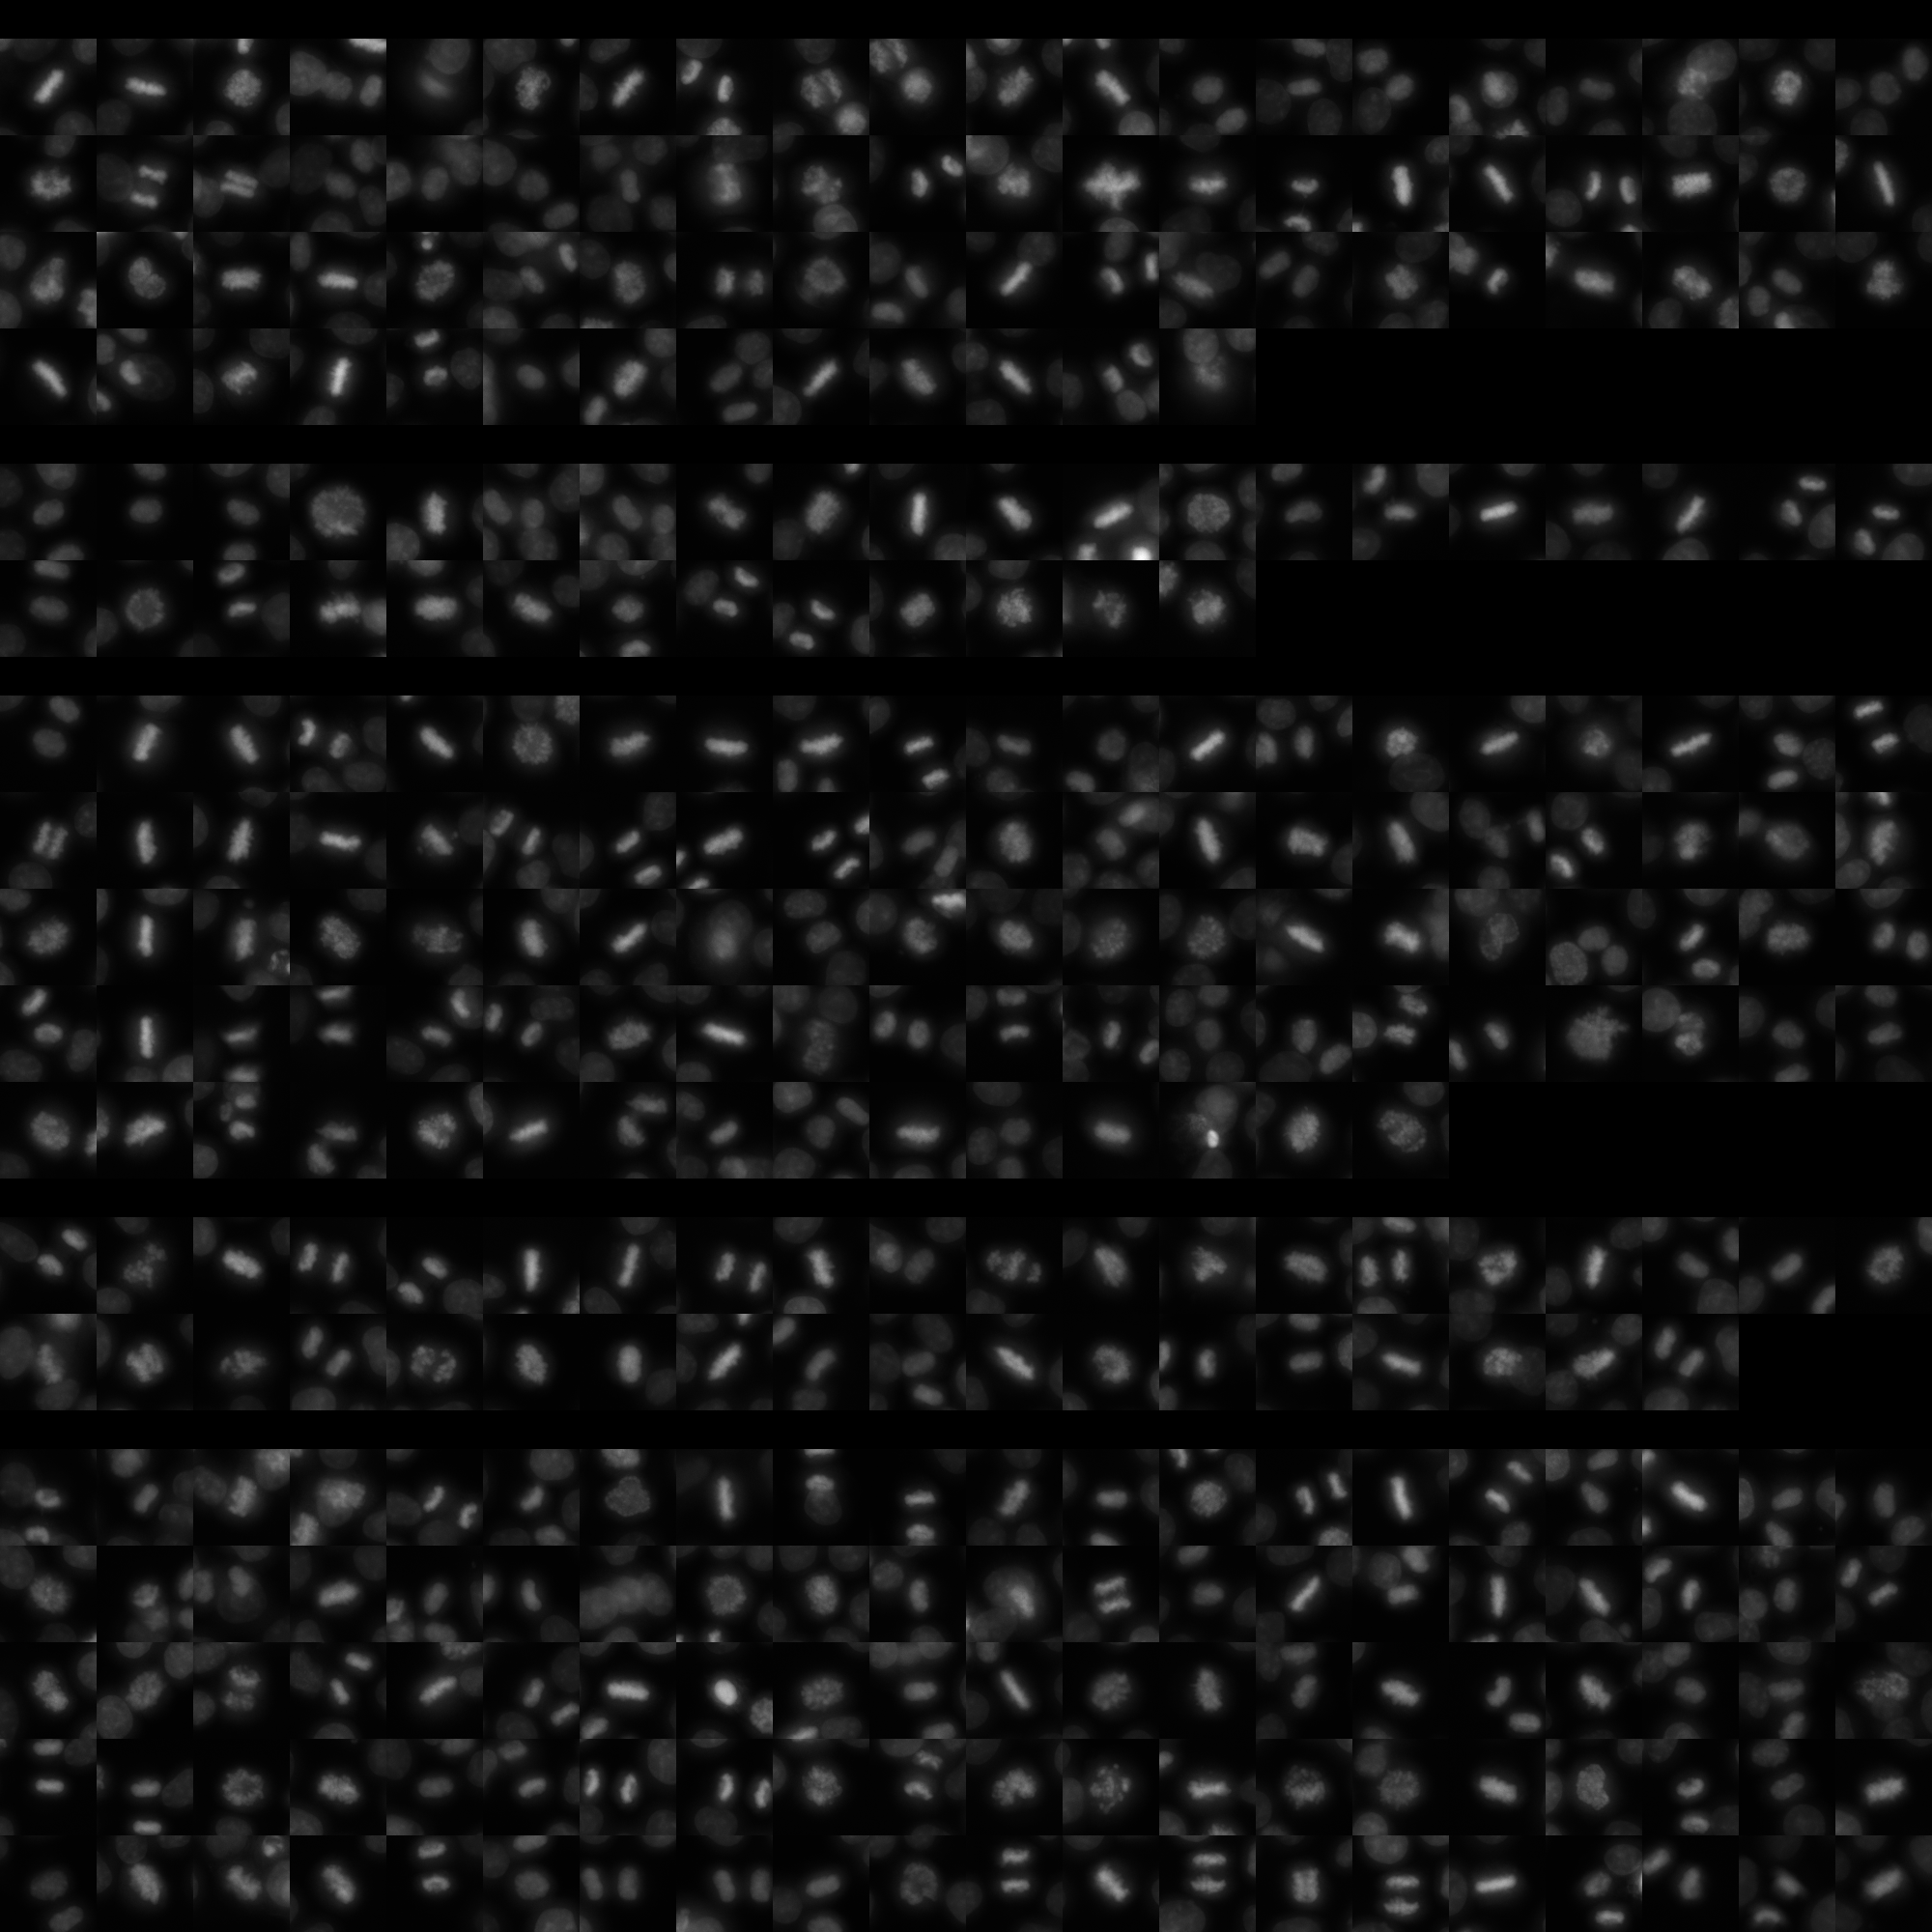
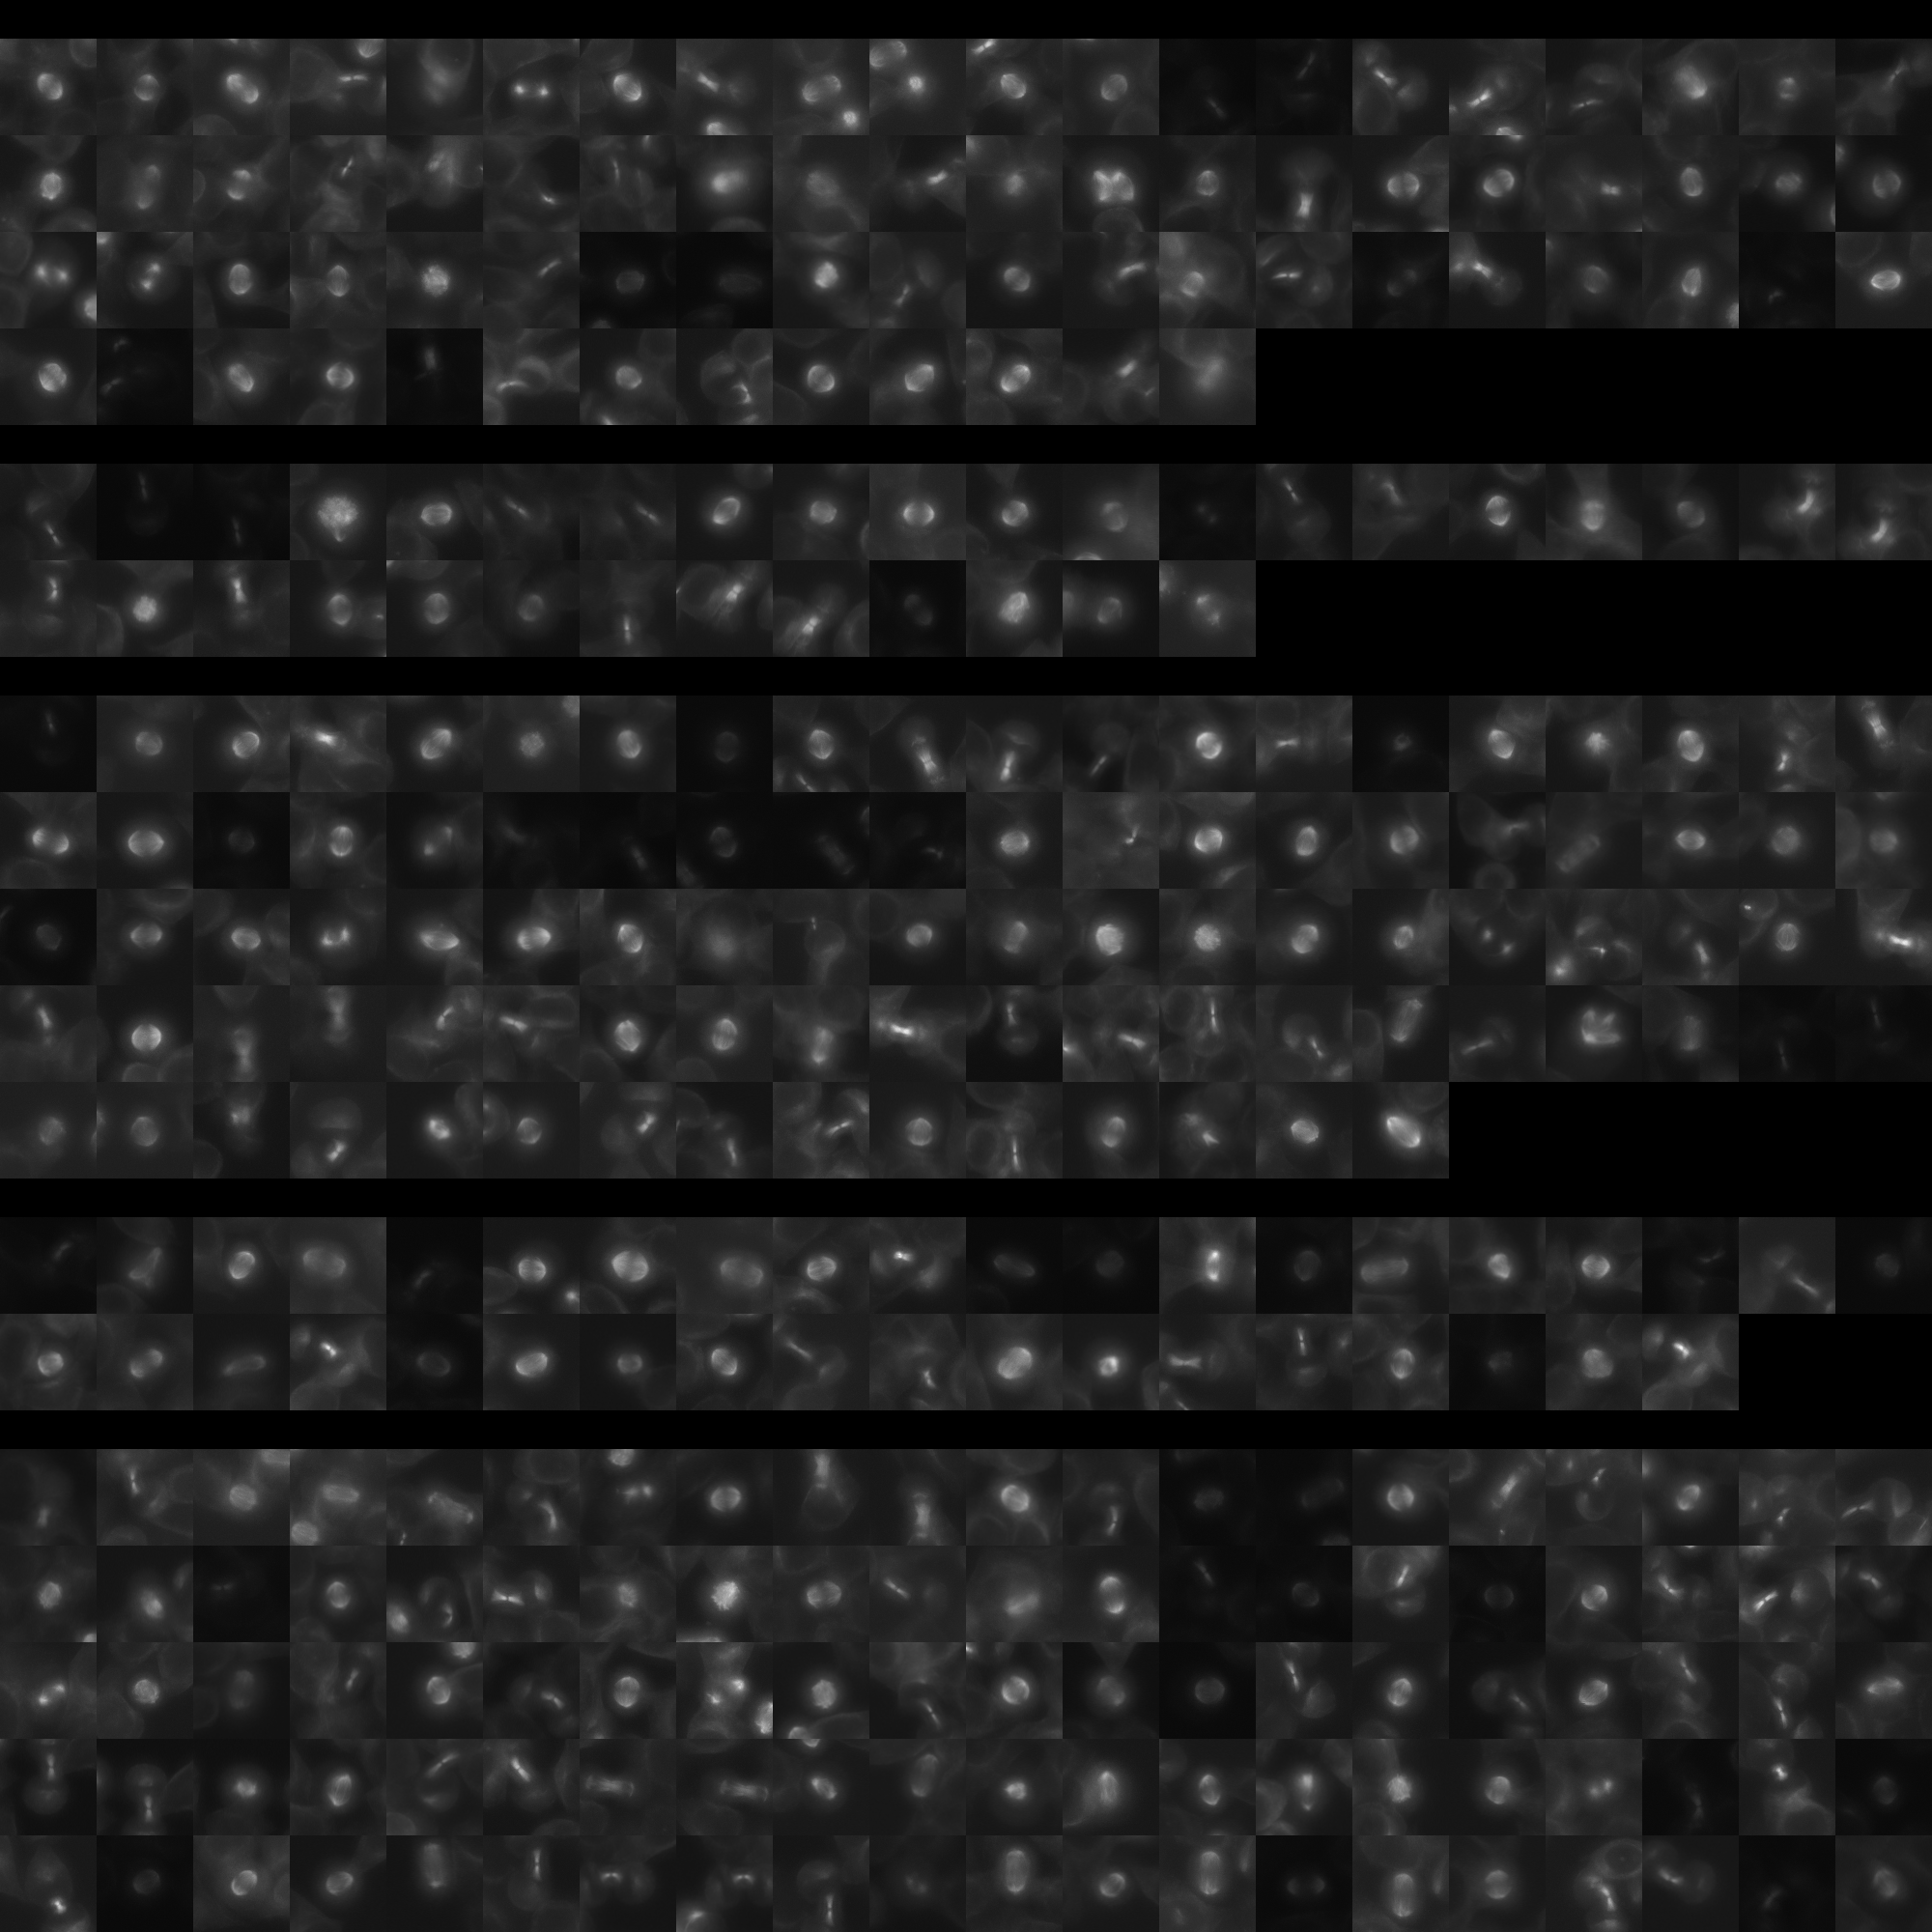
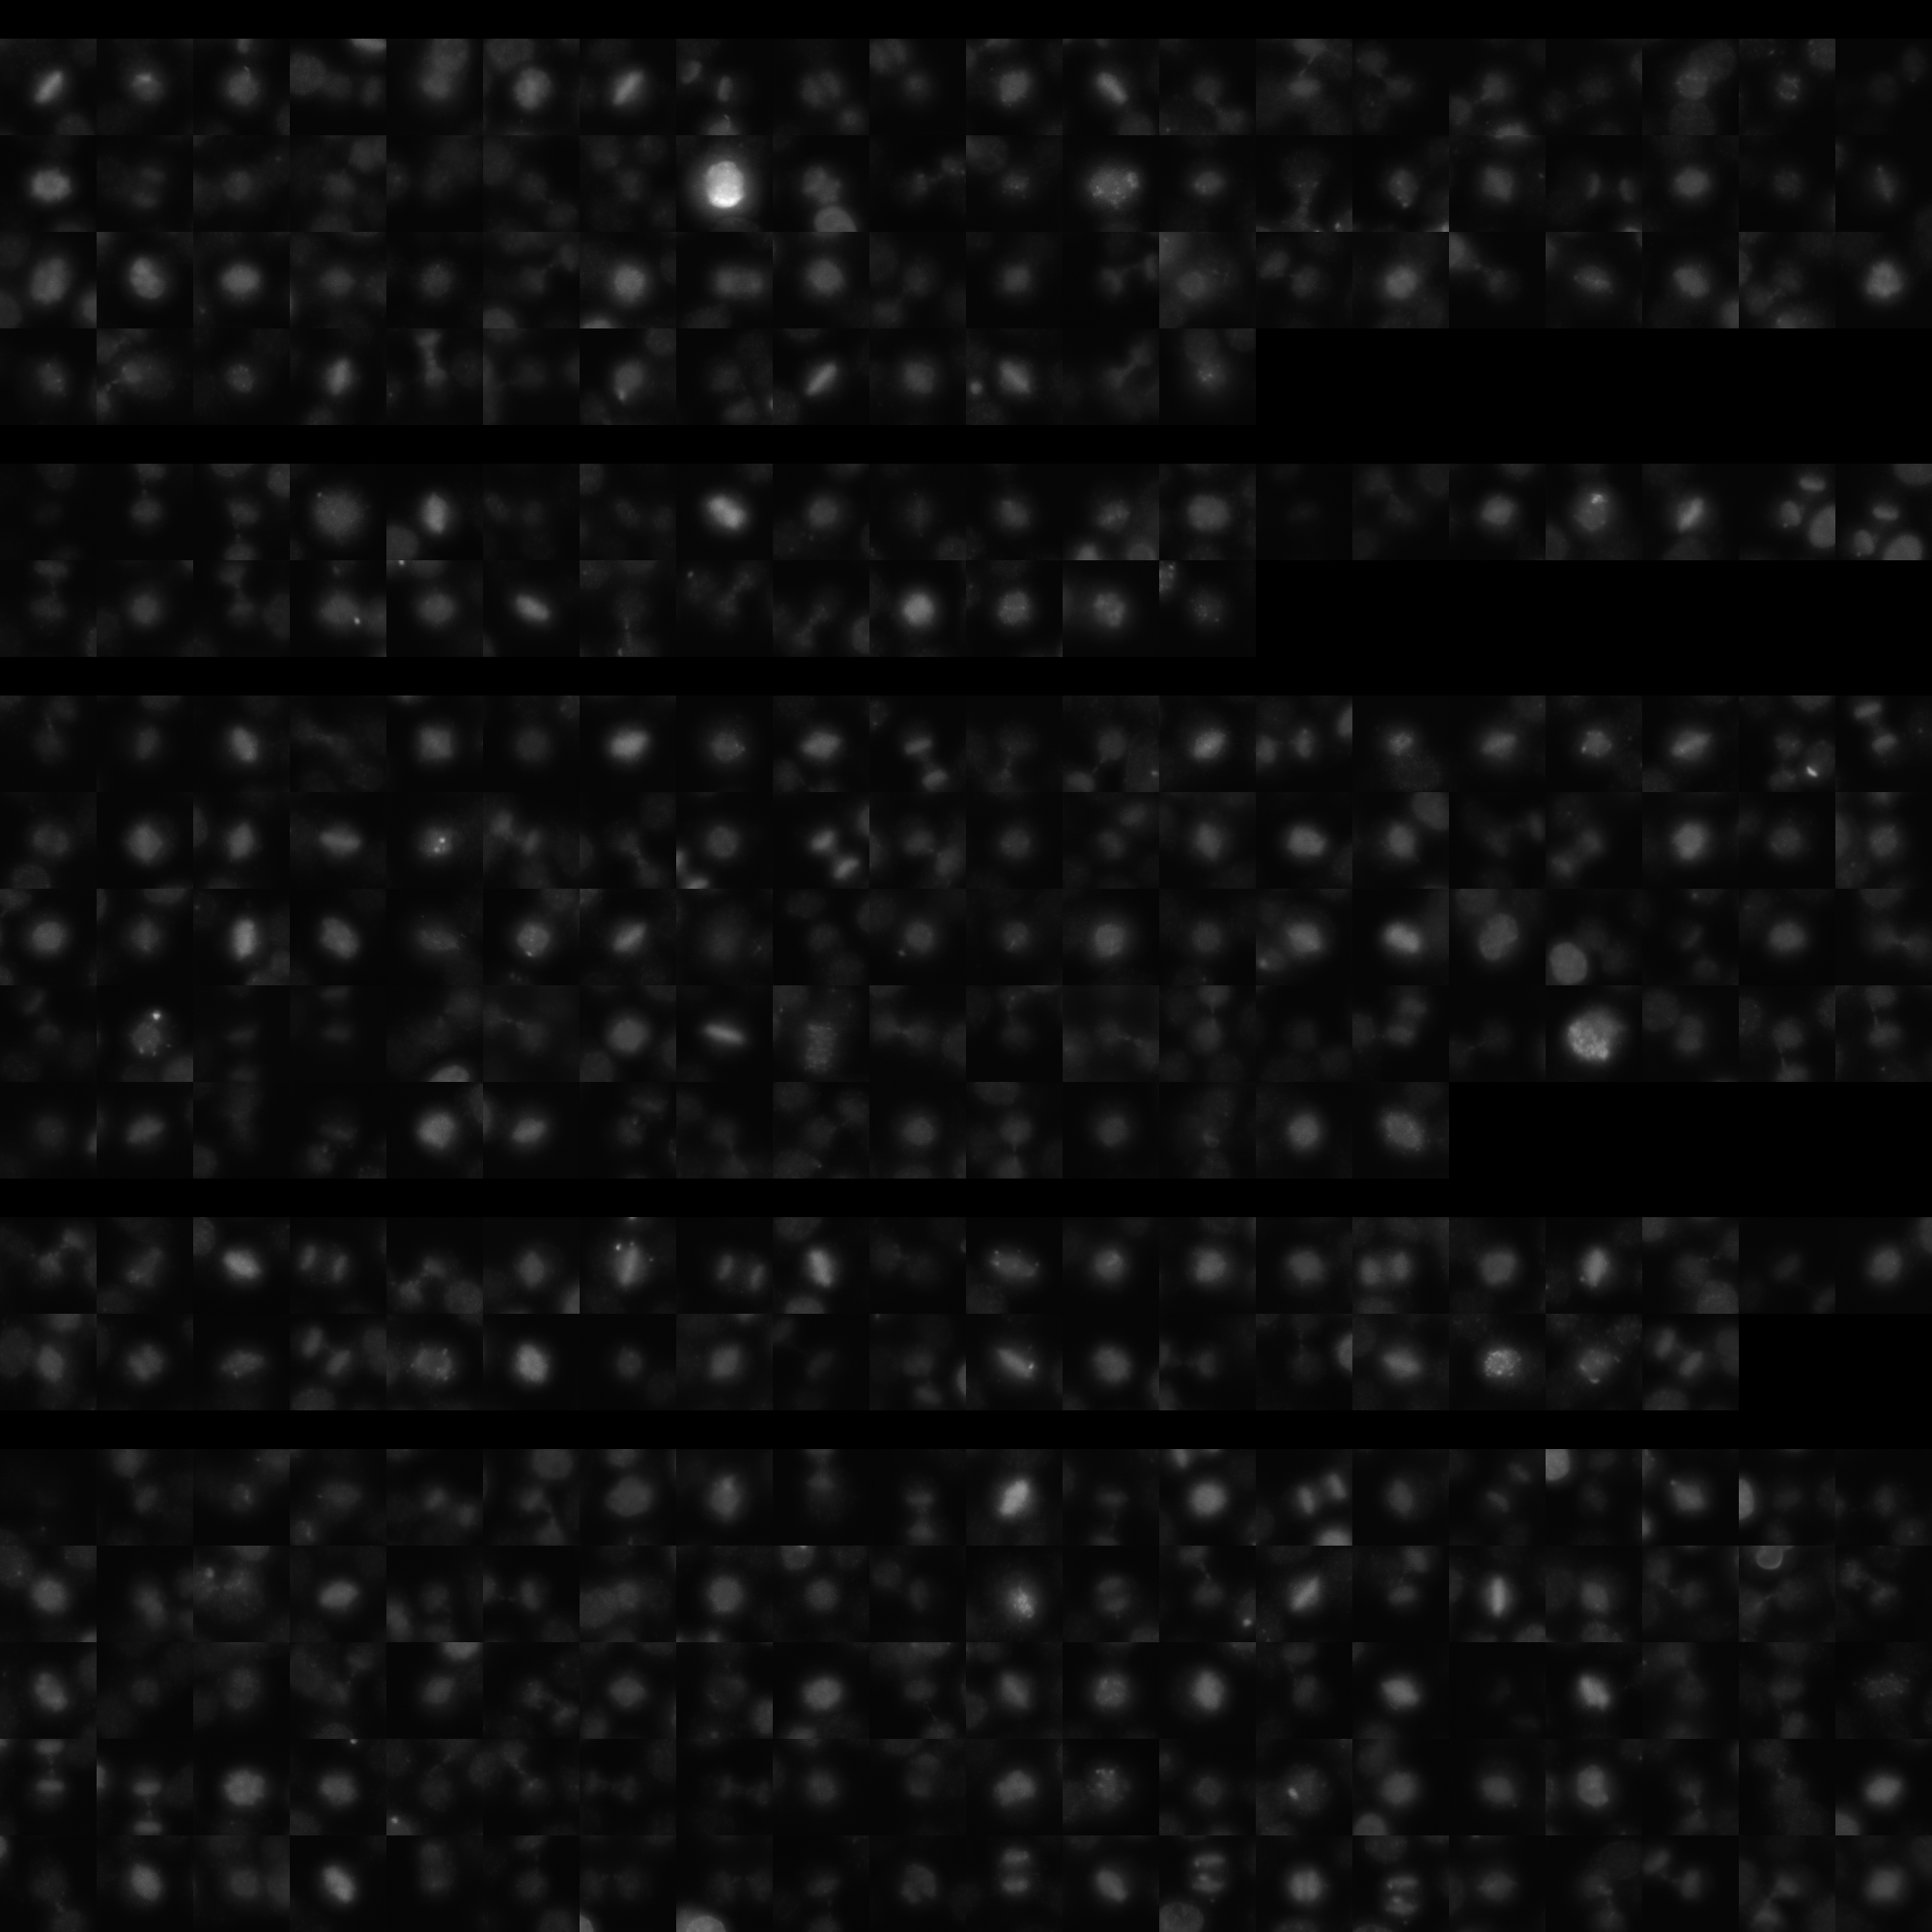
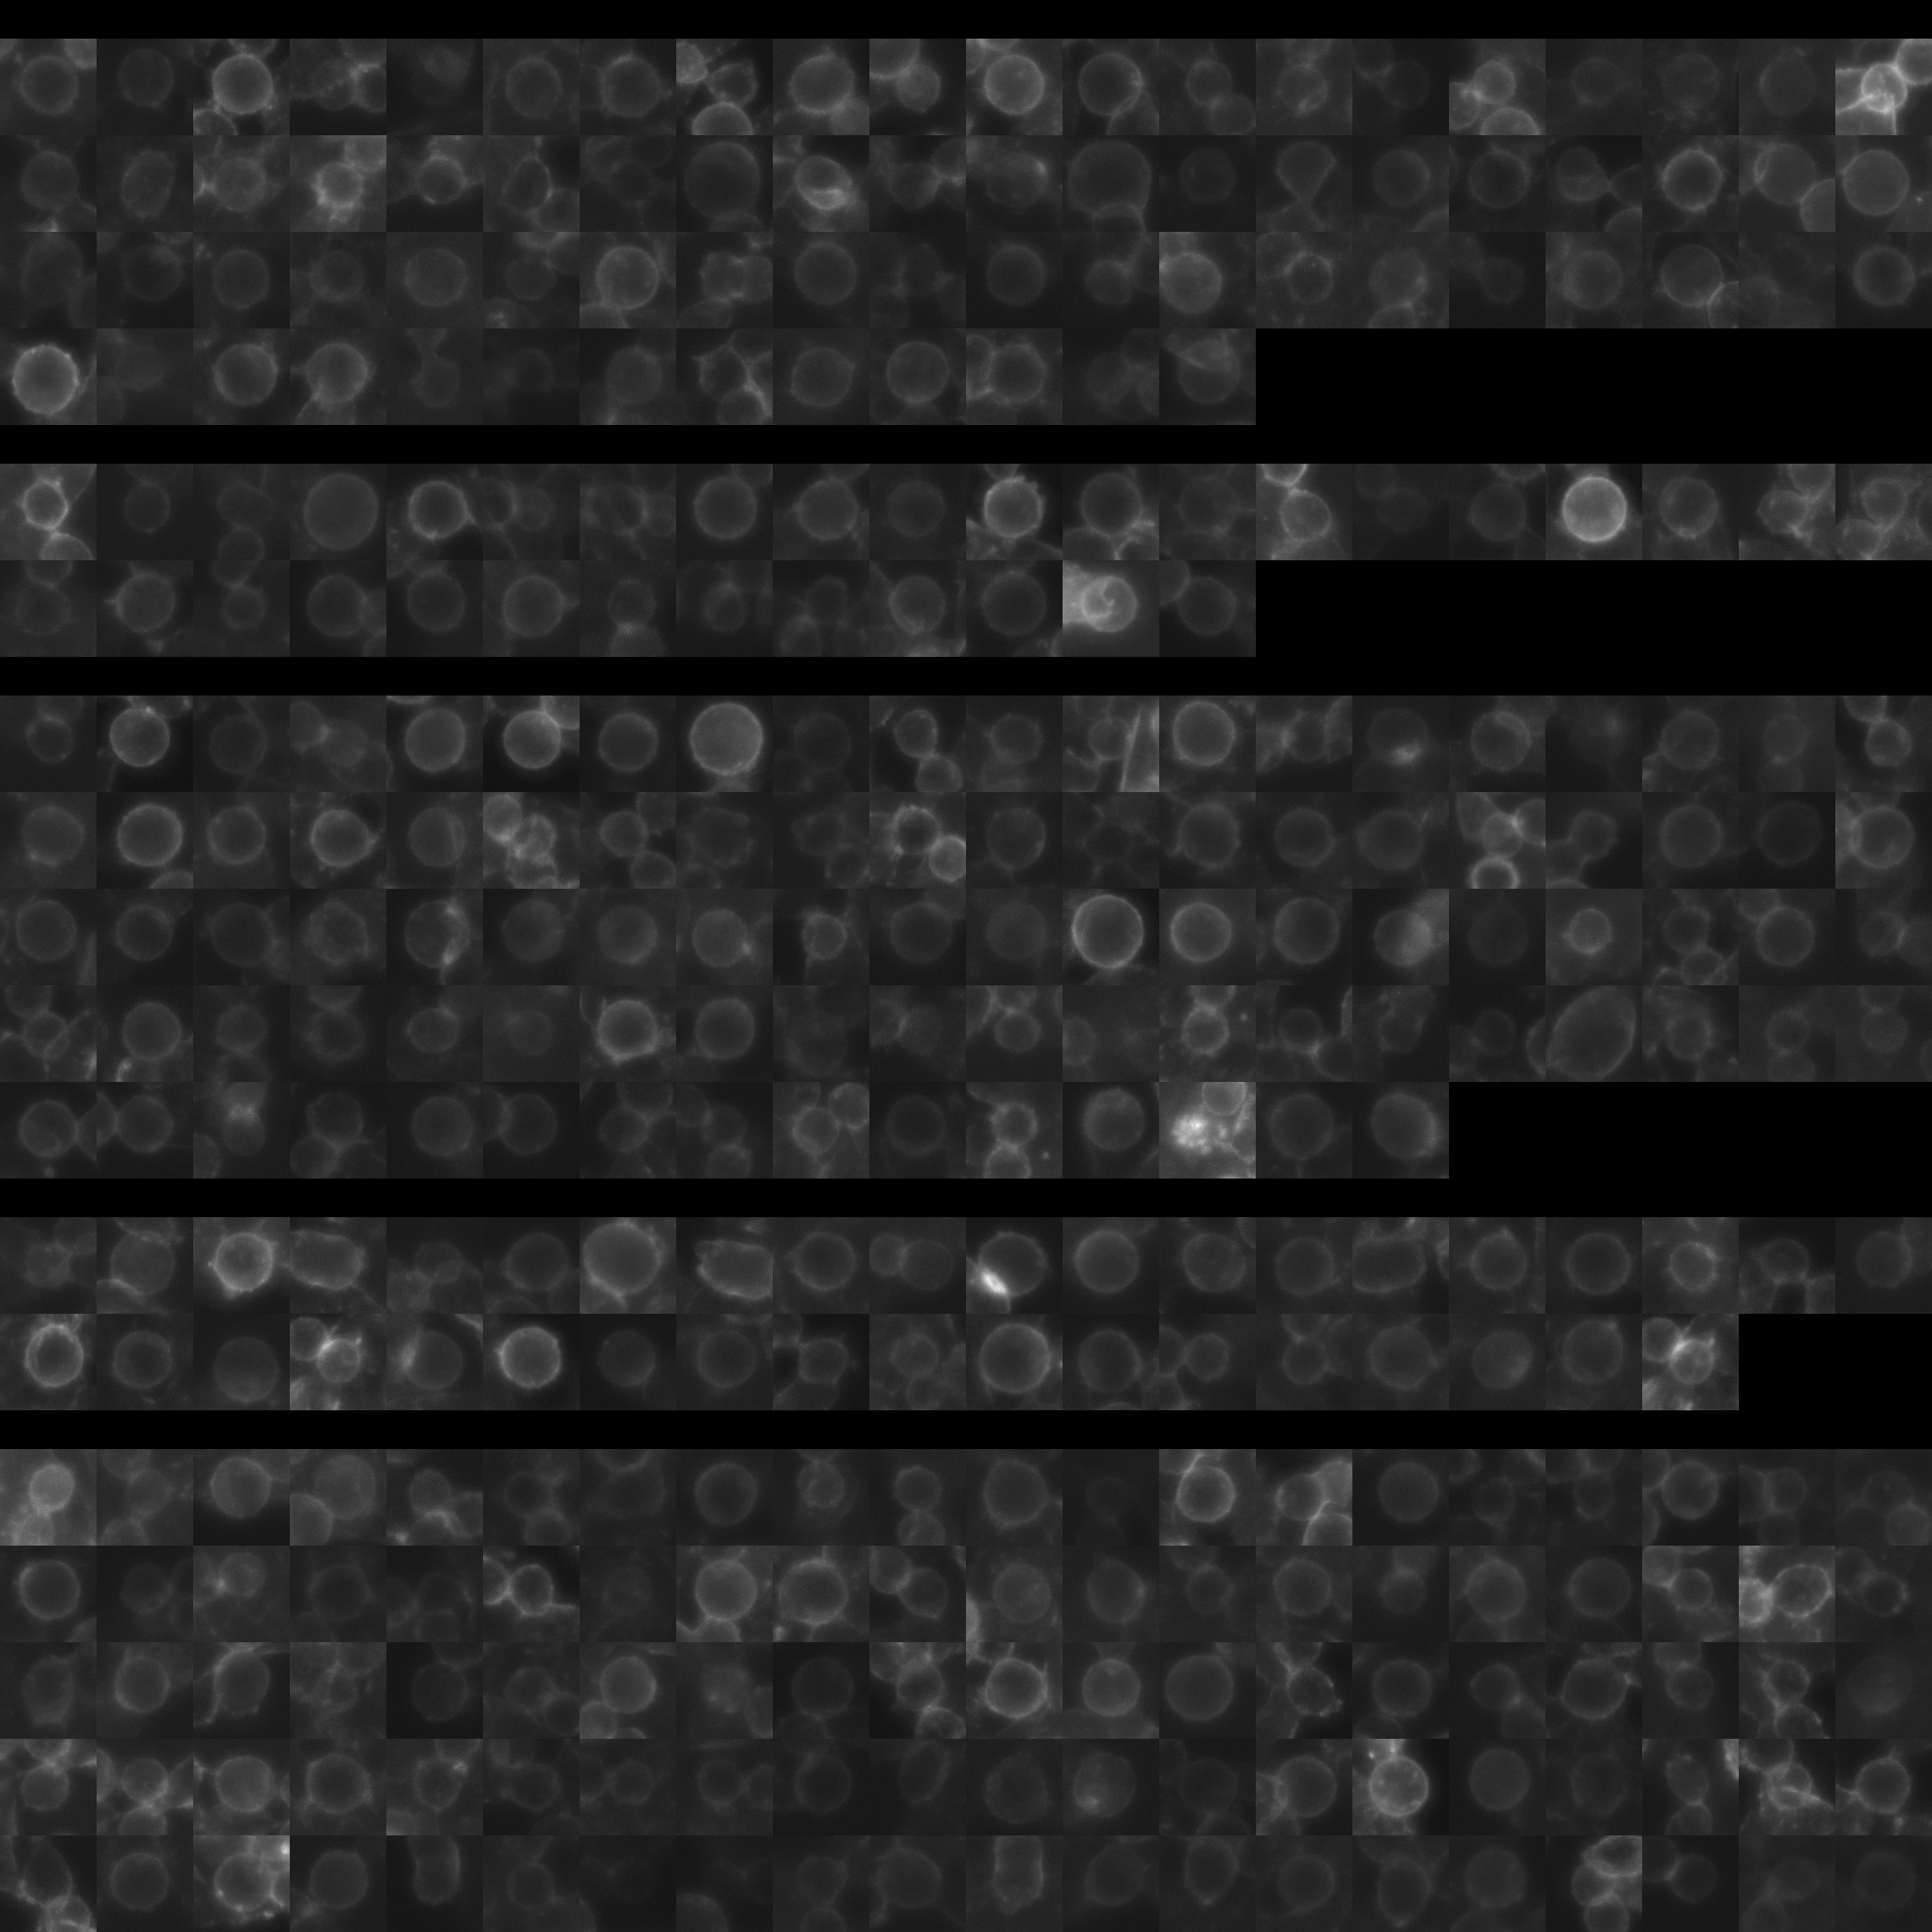
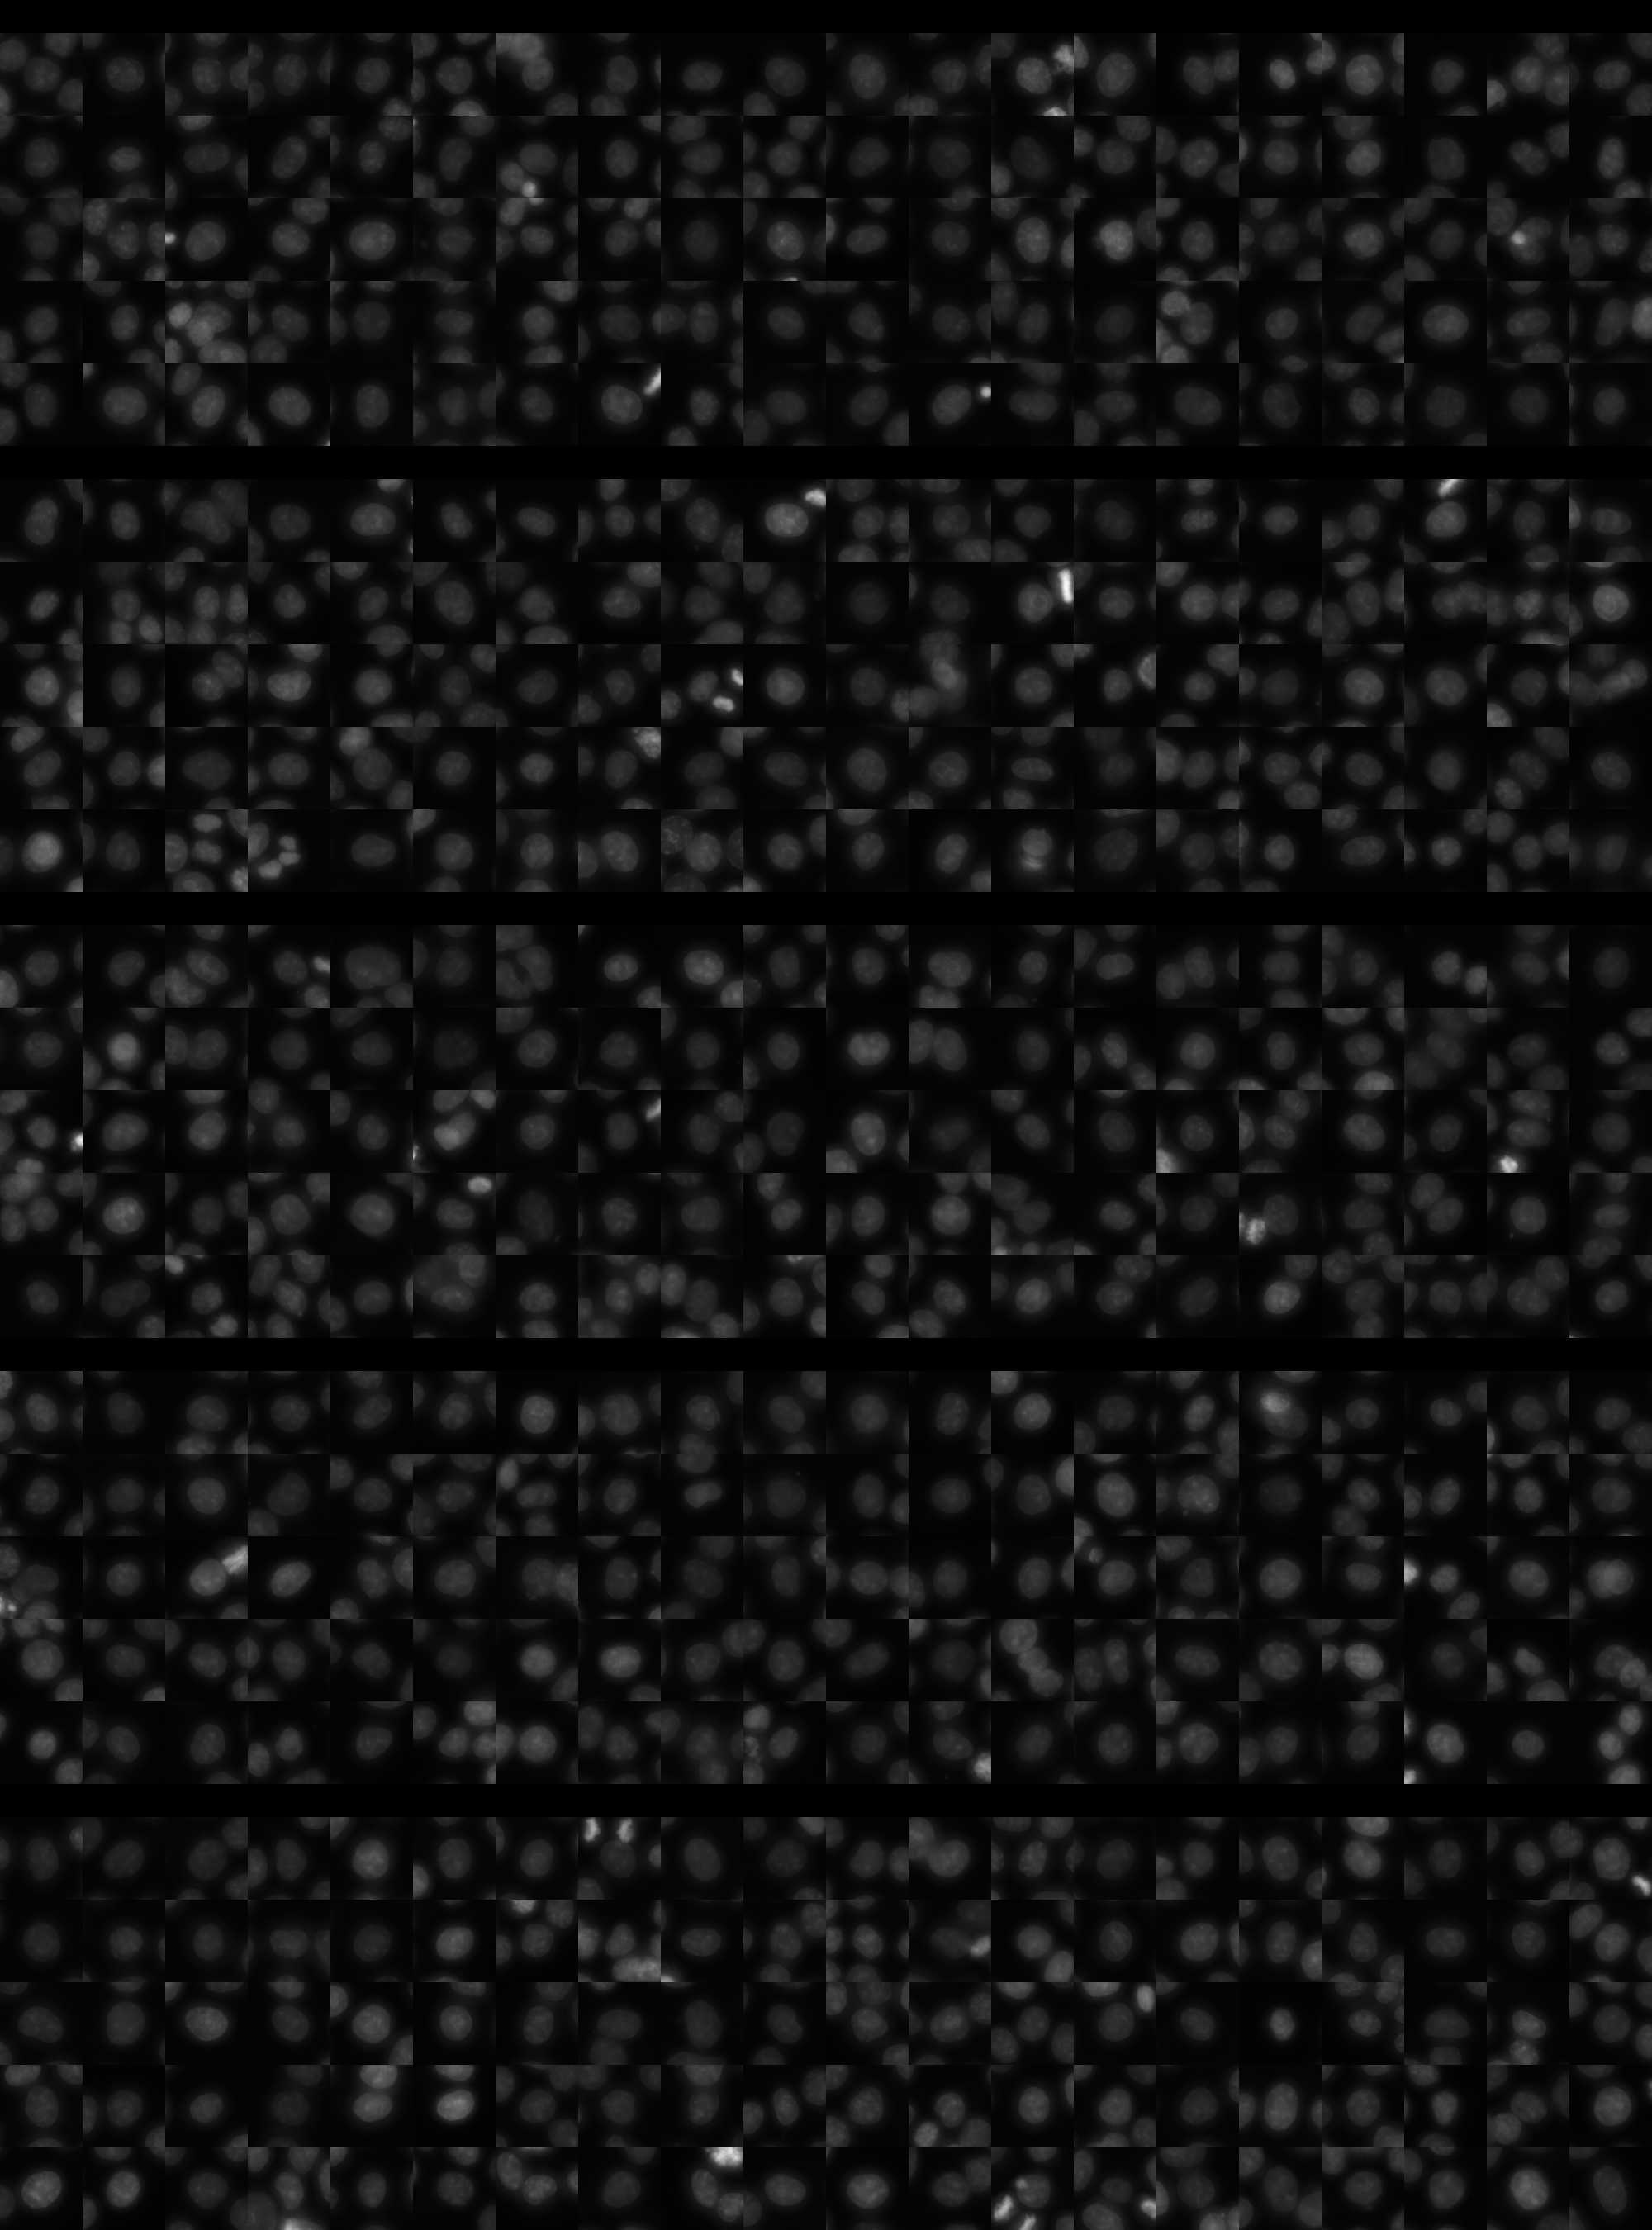
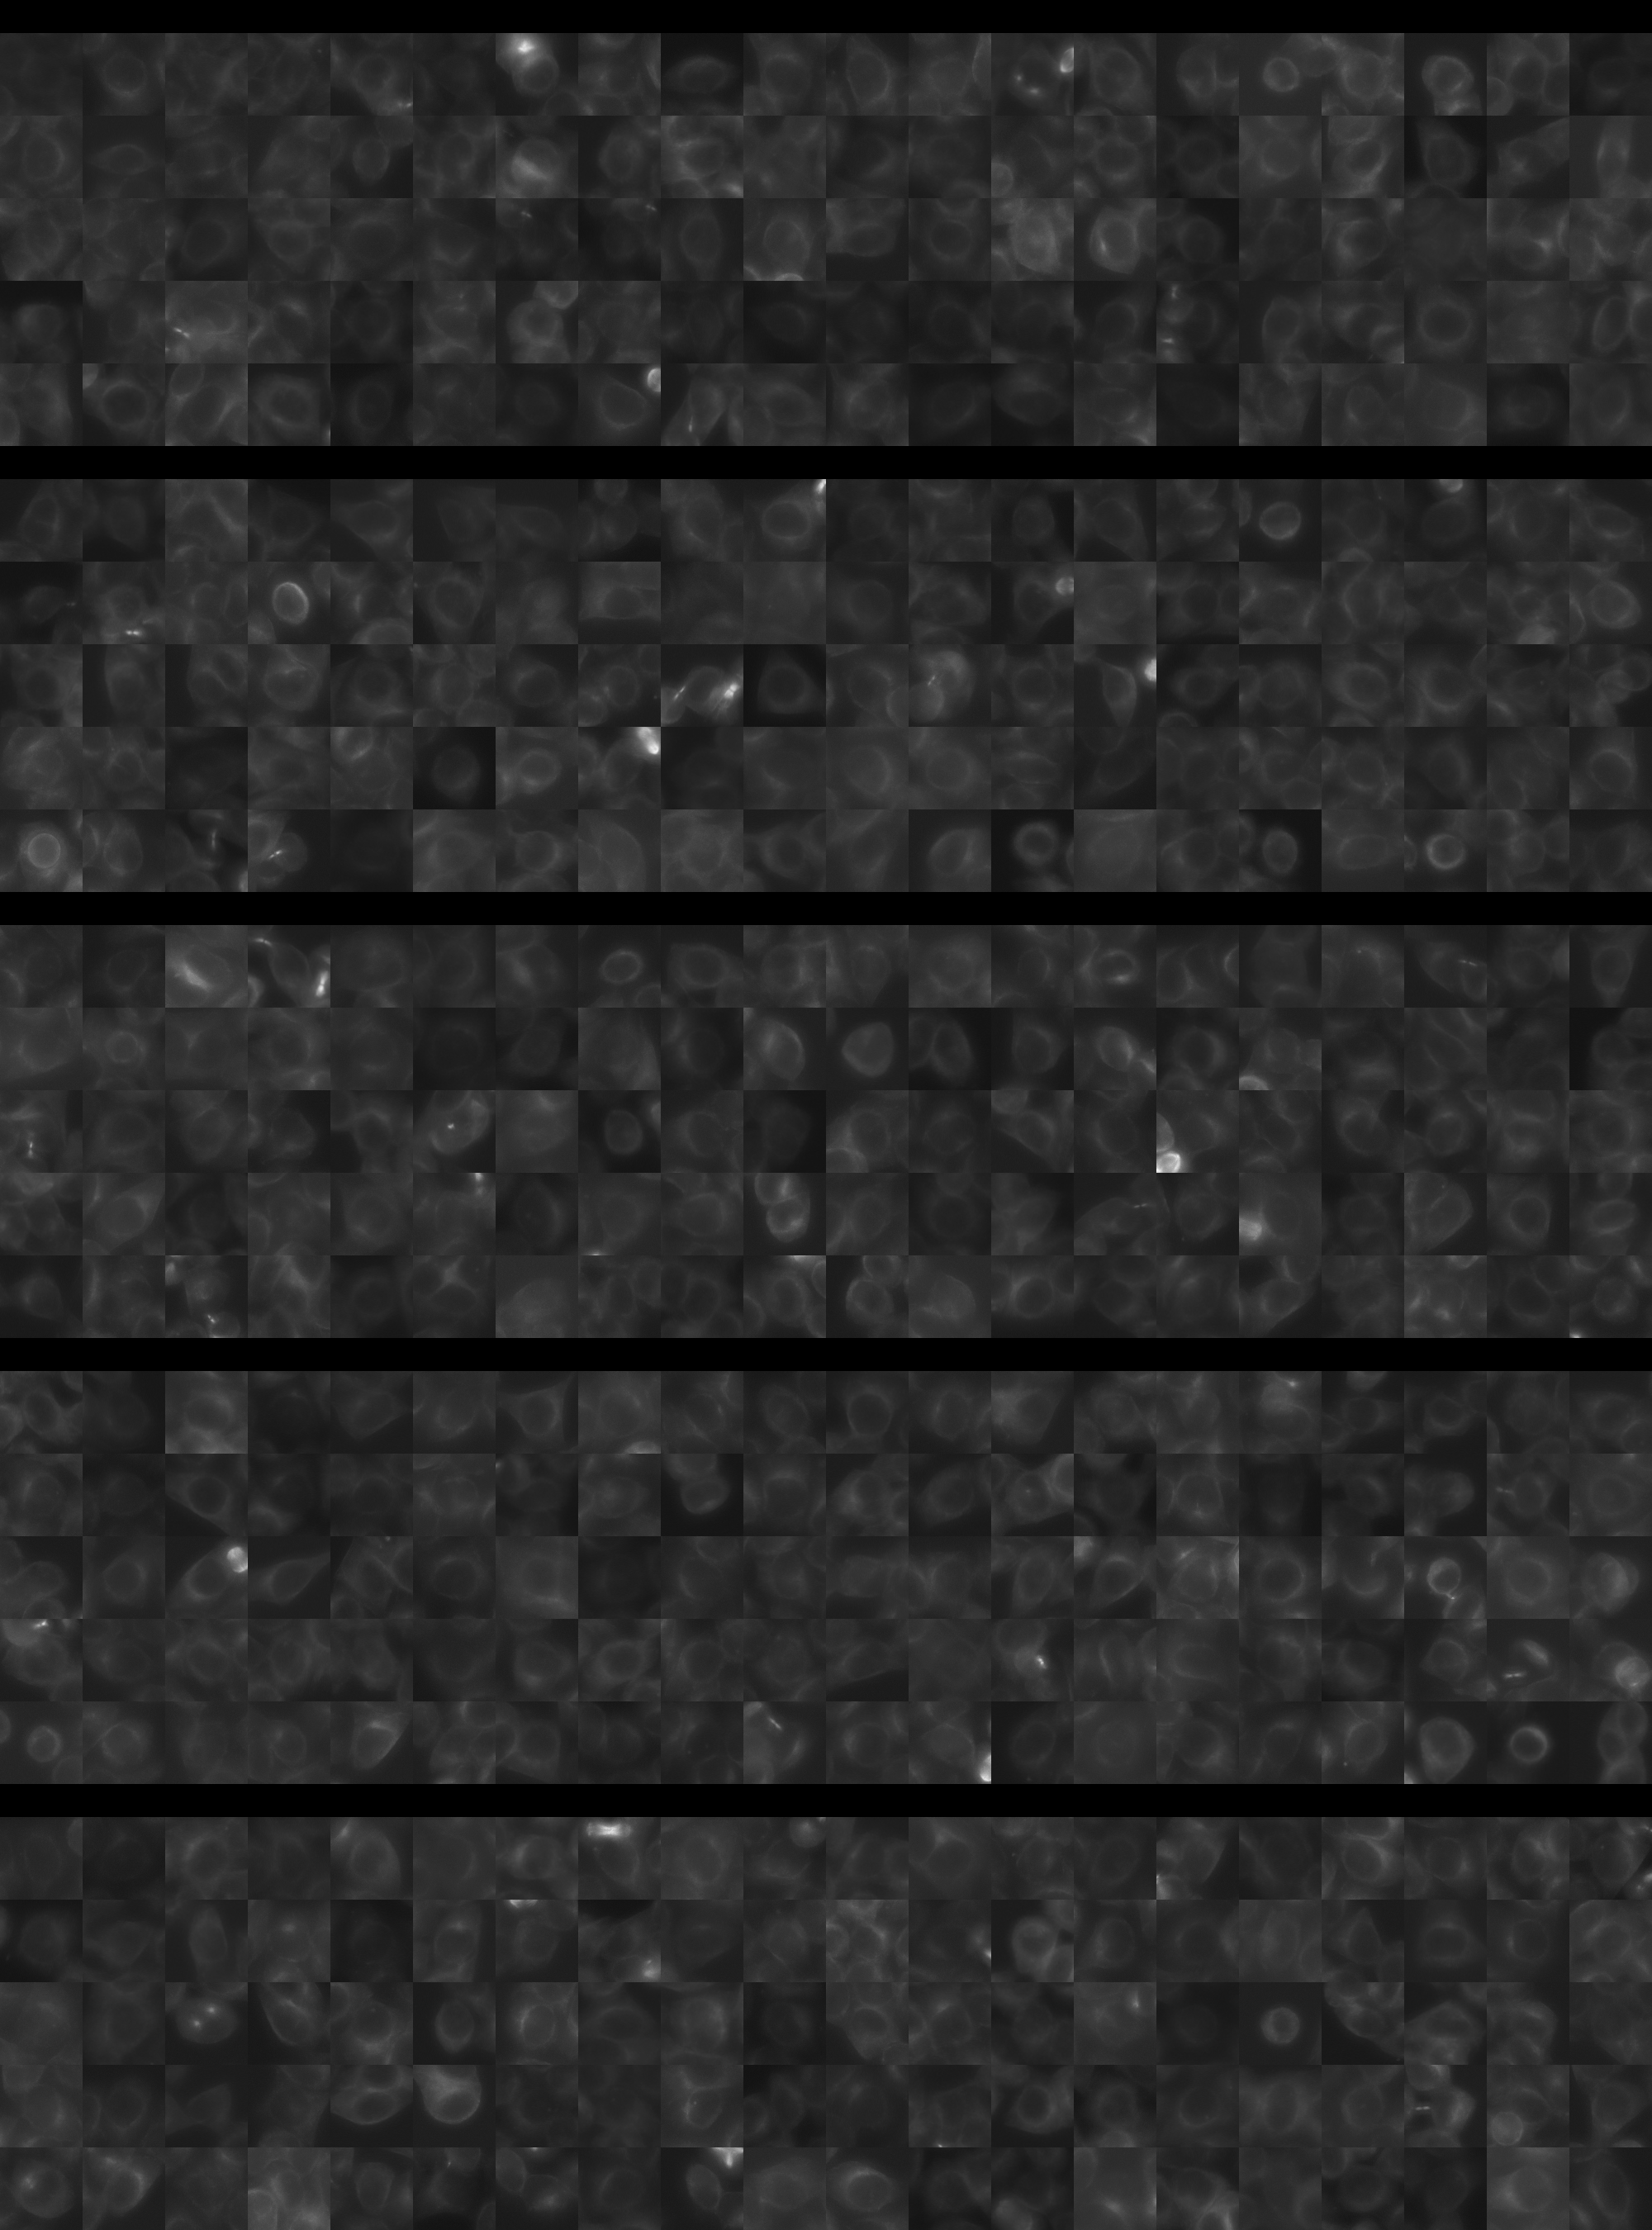
Each montage below shows randomly selected individual cell images for the same target gene separated by sgRNA, along with an example montage of cells expressing a non-targeting negative control sgRNA at the bottom. sgRNA labels in the montages correspond to the numbered sgRNA sequences in the gene info table above. The DNA (blue) and tubulin (green) channels are displayed by default, with gH2AX (grayscale) and actin (yellow) available using the check boxes. Channel brightness, contrast, and opacity are adjustable by clicking the arrow next to the channel name. When only one channel is selected, the display defaults to grayscale. Click the “Zoom” checkbox above the channel controls to enable image zooming (via scrolling) and panning (via click-and-drag).

The cell boxes displayed for this gene are square, 30.36 μm per side for the interphase montage and 30.36 μm per side for the mitotic montage.
Features

Interphase Score Rank FDR q-value
Nucleus DNA Integrated 0.040 1305 of 5322 0.541
Nucleus DNA Mean -1.180e-02 2361 of 5322 0.851
Nucleus gH2AX Mean 0.088 2284 of 5322 0.023
Nucleus DNA - gH2AX Correlation -2.591e-02 1590 of 5322 0.336
Nucleus Shape Area 0.066 1268 of 5322 0.218
Nucleus Shape Eccentricity 0.003 3178 of 5322 0.926
Nucleus Shape Form Factor -3.906e-02 2135 of 5322 0.317
Nucleus Shape Solidity -1.941e-02 1289 of 5322 0.582
Cell DNA Mass Displacement -1.243e-02 4883 of 5322 0.801
Cell Tubulin Mean 0.019 2029 of 5322 0.663
Cell Tubulin Mass Displacement 0.030 1281 of 5322 0.547
Cell Actin Mean 0.055 1458 of 5322 0.247
Cell Tubulin - Actin Correlation 0.036 1949 of 5322 0.381
Cell DNA - Tubulin Correlation 0.037 2358 of 5322 0.326
Cell Shape Area 0.035 2007 of 5322 0.679
Cell Shape Eccentricity 0.005 3296 of 5322 0.965
Mitotic Score Rank FDR q-value
Nucleus DNA Integrated 0.178 1485 of 5322 0.872
Nucleus DNA Mean 0.083 1682 of 5322 1.000
Nucleus DNA Mass Displacement -3.915e-02 4077 of 5322 0.999
Nucleus DNA Mean Frac 3 -1.640e-01 4876 of 5322 1.000
Nucleus gH2AX Mean 0.162 1020 of 5322 1.000
Nucleus gH2AX Mean Frac 0 0.128 729 of 5322 1.000
Nucleus Tubulin Mean Frac 0 -1.234e-01 4842 of 5322 0.999
Nucleus Tubulin Mean Edge 0.207 760 of 5322 0.979
Nucleus Tubulin Std Edge 0.277 208 of 5322 0.747
Nucleus Shape Area 0.093 2769 of 5322 0.989
Nucleus Shape Eccentricity 0.151 452 of 5322 1.000
Nucleus Shape Form Factor -7.655e-02 2514 of 5322 0.998
Cell Tubulin Mean 0.118 1824 of 5322 0.997
Cell Tubulin Mean Frac 3 -1.779e-01 3844 of 5322 0.999
Cell Actin Mean 0.045 2590 of 5322 0.997
Cell Shape Area 0.221 1191 of 5322 0.976
( Reset Zoom )
Brightness
Contrast
Opacity
Brightness
Contrast
Opacity
Brightness
Contrast
Opacity
Brightness
Contrast
Opacity
Brightness
Contrast
Opacity

( Reset Zoom )
Brightness
Contrast
Opacity
Brightness
Contrast
Opacity
Brightness
Contrast
Opacity
Brightness
Contrast
Opacity
Brightness
Contrast
Opacity

MIT Central Accessability