GPR132

Gene symbol: GPR132
Gene: 29933
Uniprot Function: May be a receptor for oxidized free fatty acids derived from linoleic and arachidonic acids such as 9-hydroxyoctadecadienoic acid (9-HODE). Activates a G alpha protein, most likely G alpha(q). May be involved in apoptosis. Functions at the G2/M checkpoint to delay mitosis. May function as a sensor that monitors the oxidative states and mediates appropriate cellular responses such as secretion of paracrine signals and attenuation of proliferation. May mediate ths accumulation of intracellular inositol phosphates at acidic pH through proton-sensing activity.
Mitotic Index 0.0229
Interphase Cluster: #89 (25 genes)
Mitotic Cluster: #141 (20 genes)
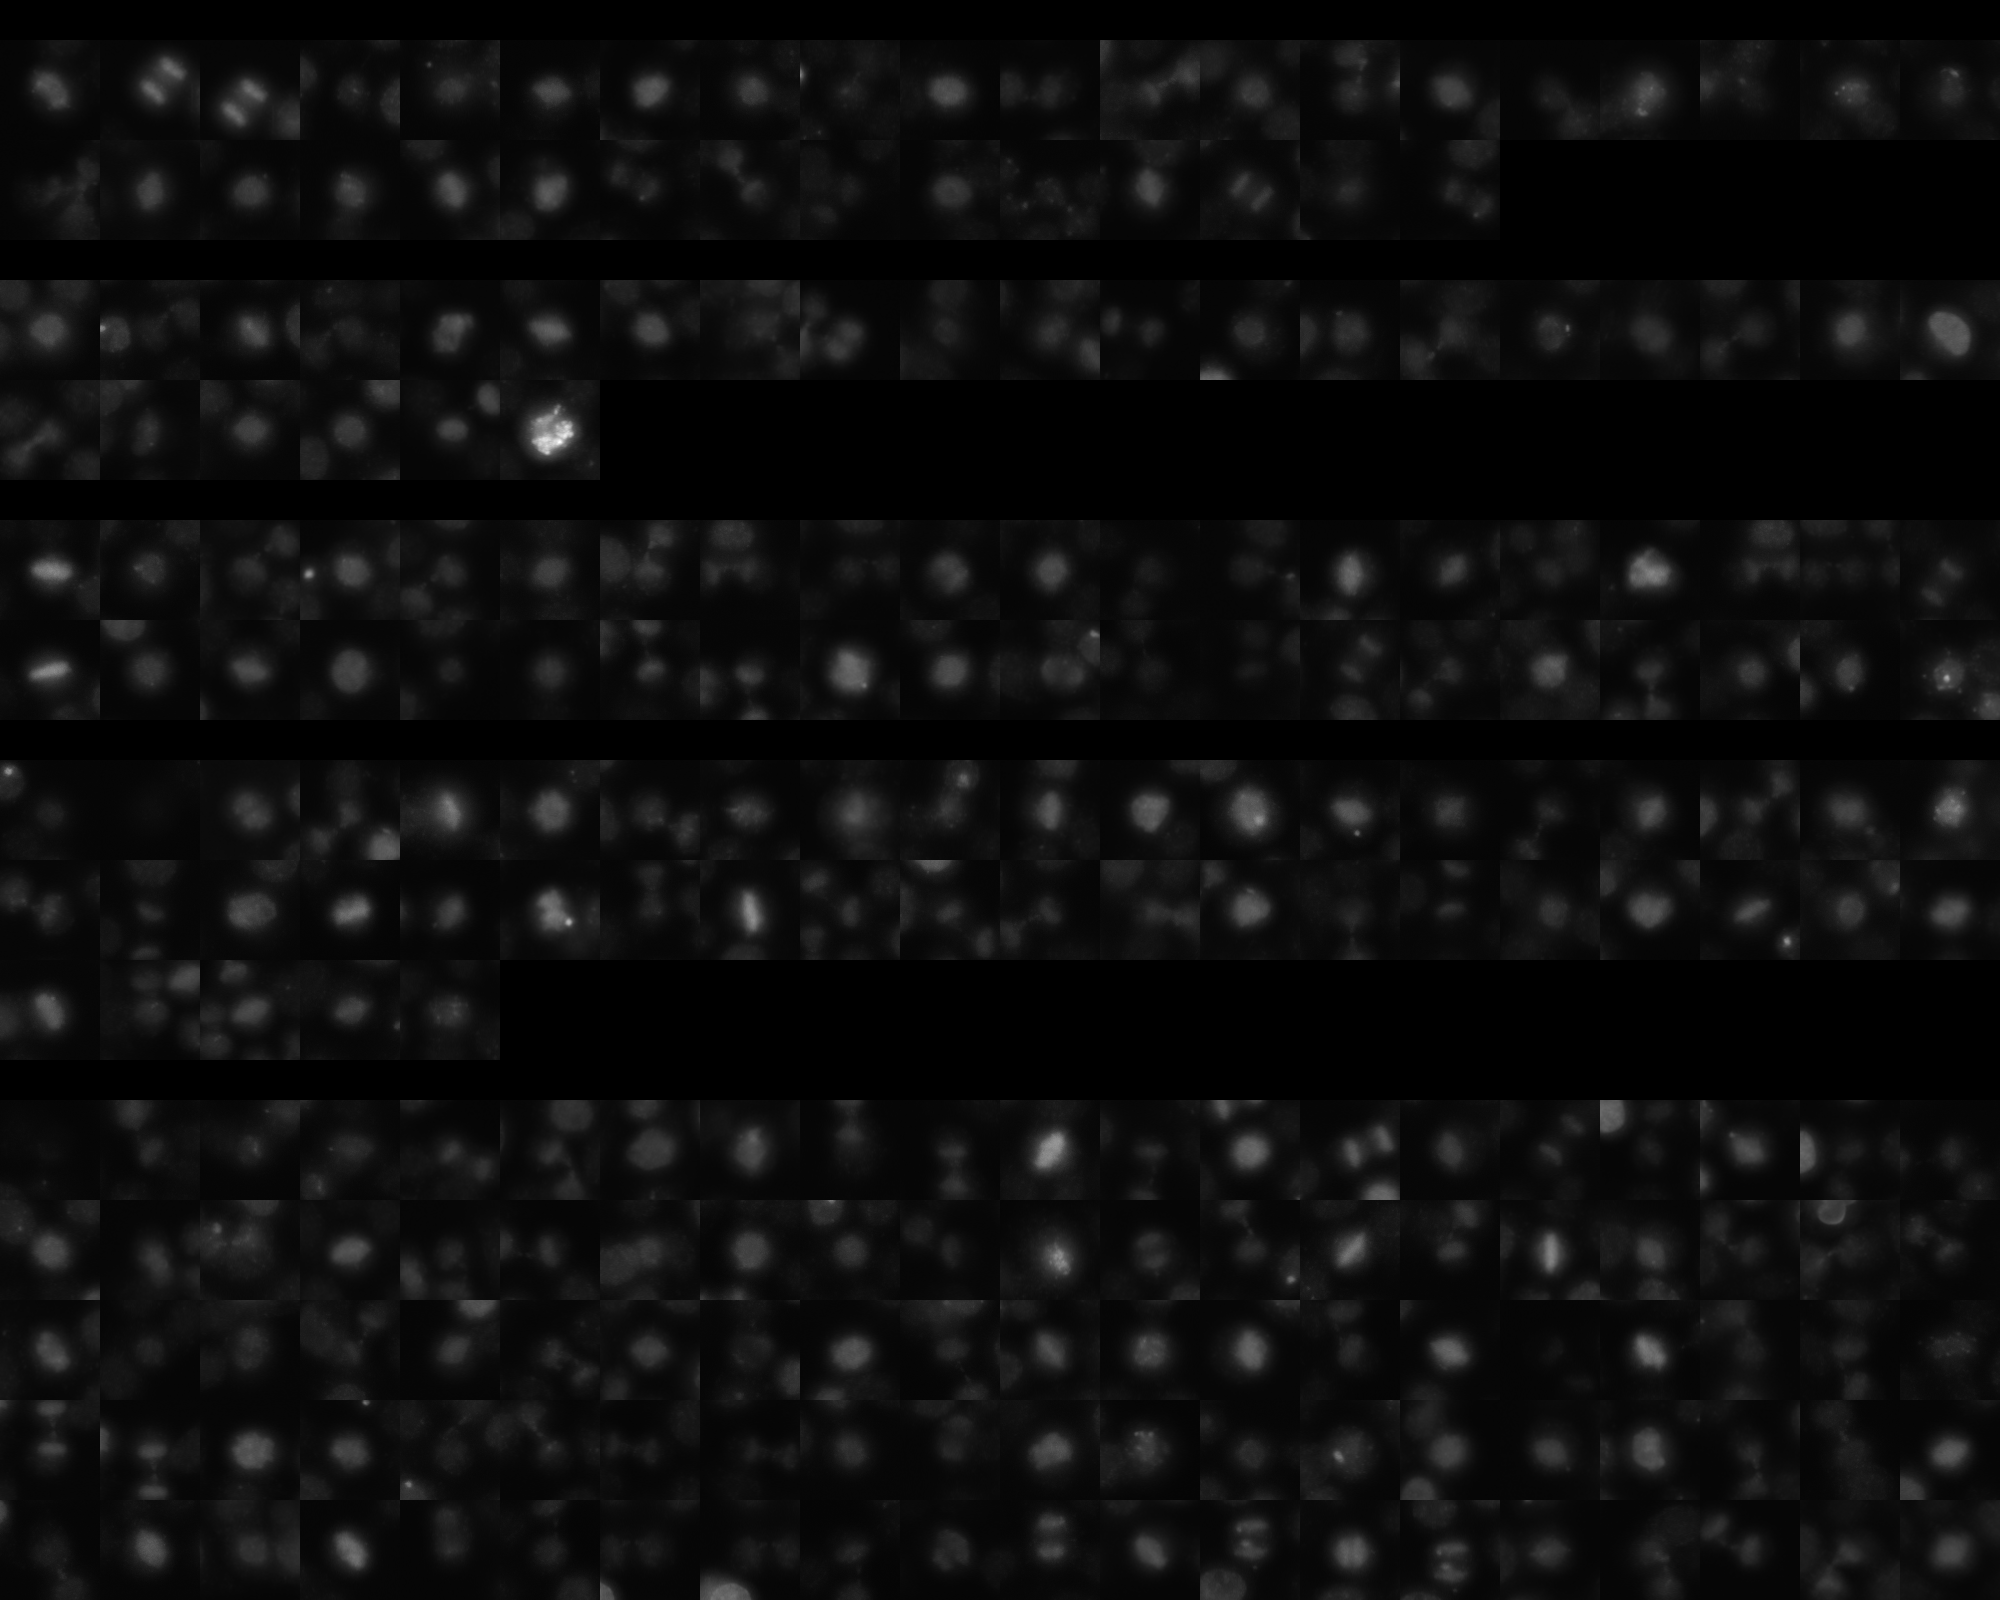
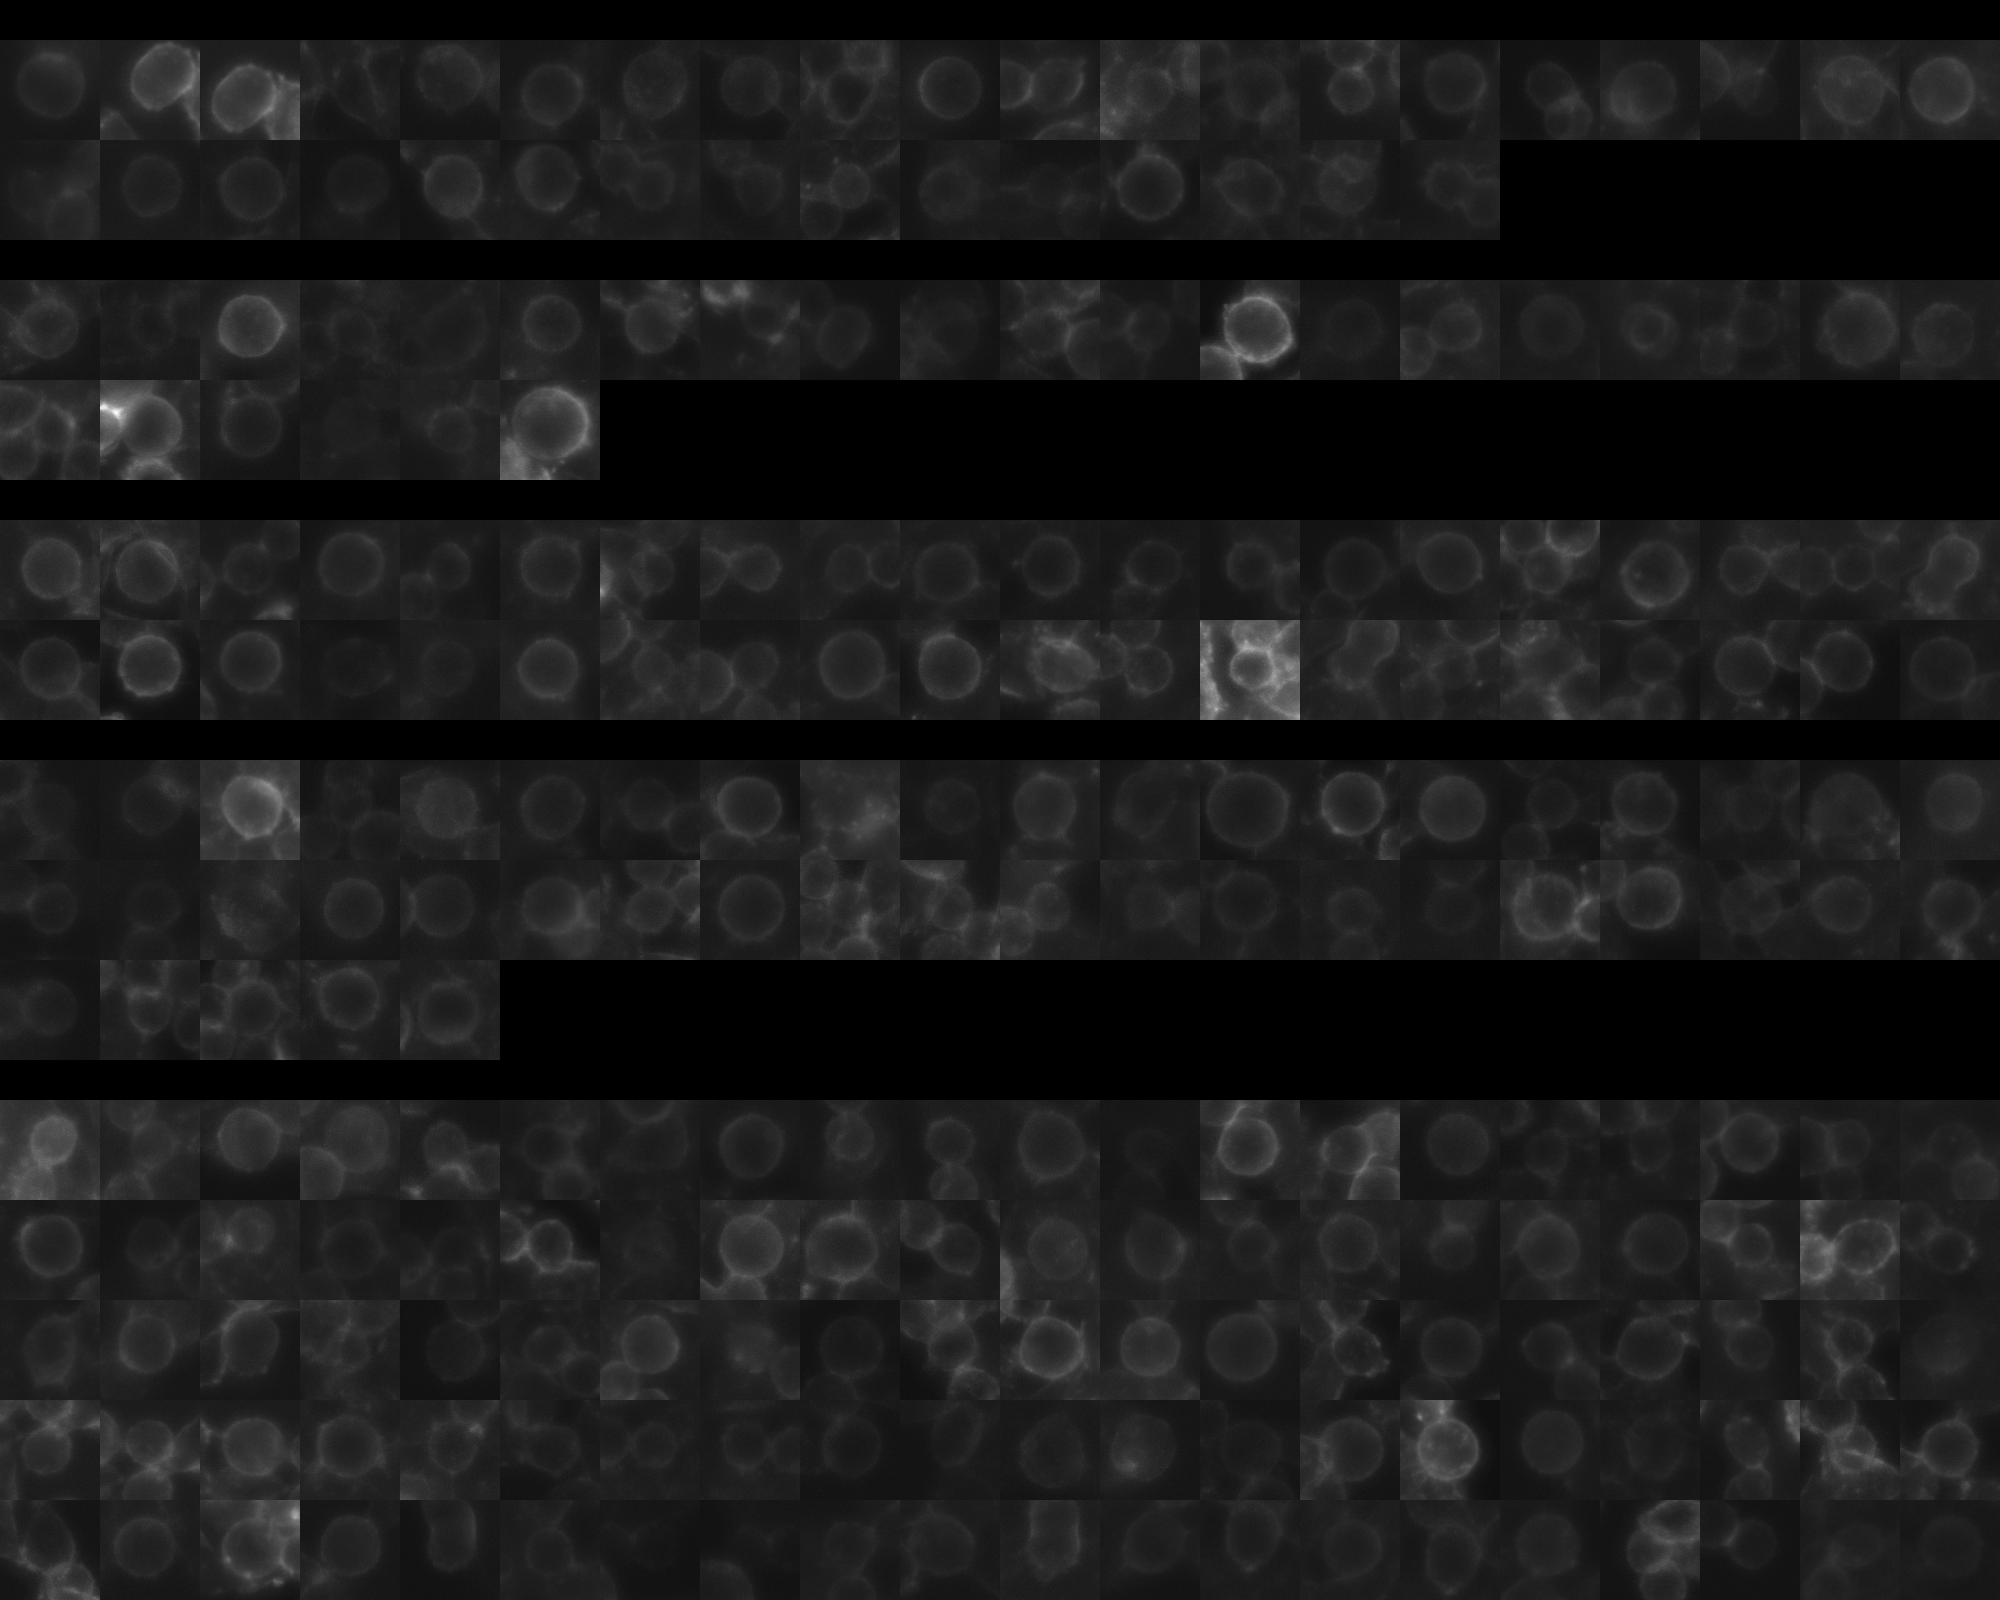
sgRNA 1: GCTCCTGAAAATCCGGTGGT (interphase cells: 1343, mitotic cells: 35)
sgRNA 2: GGTAGTGAACGATCCCGACG (interphase cells: 1155, mitotic cells: 26)
sgRNA 3: GGTGAAGCACTCGGCCATCG (interphase cells: 2073, mitotic cells: 40)
sgRNA 4: GTGTACGCGCTGGAGAGTCG (interphase cells: 1665, mitotic cells: 45)

Interphase Cluster

Mitotic Cluster

Overview

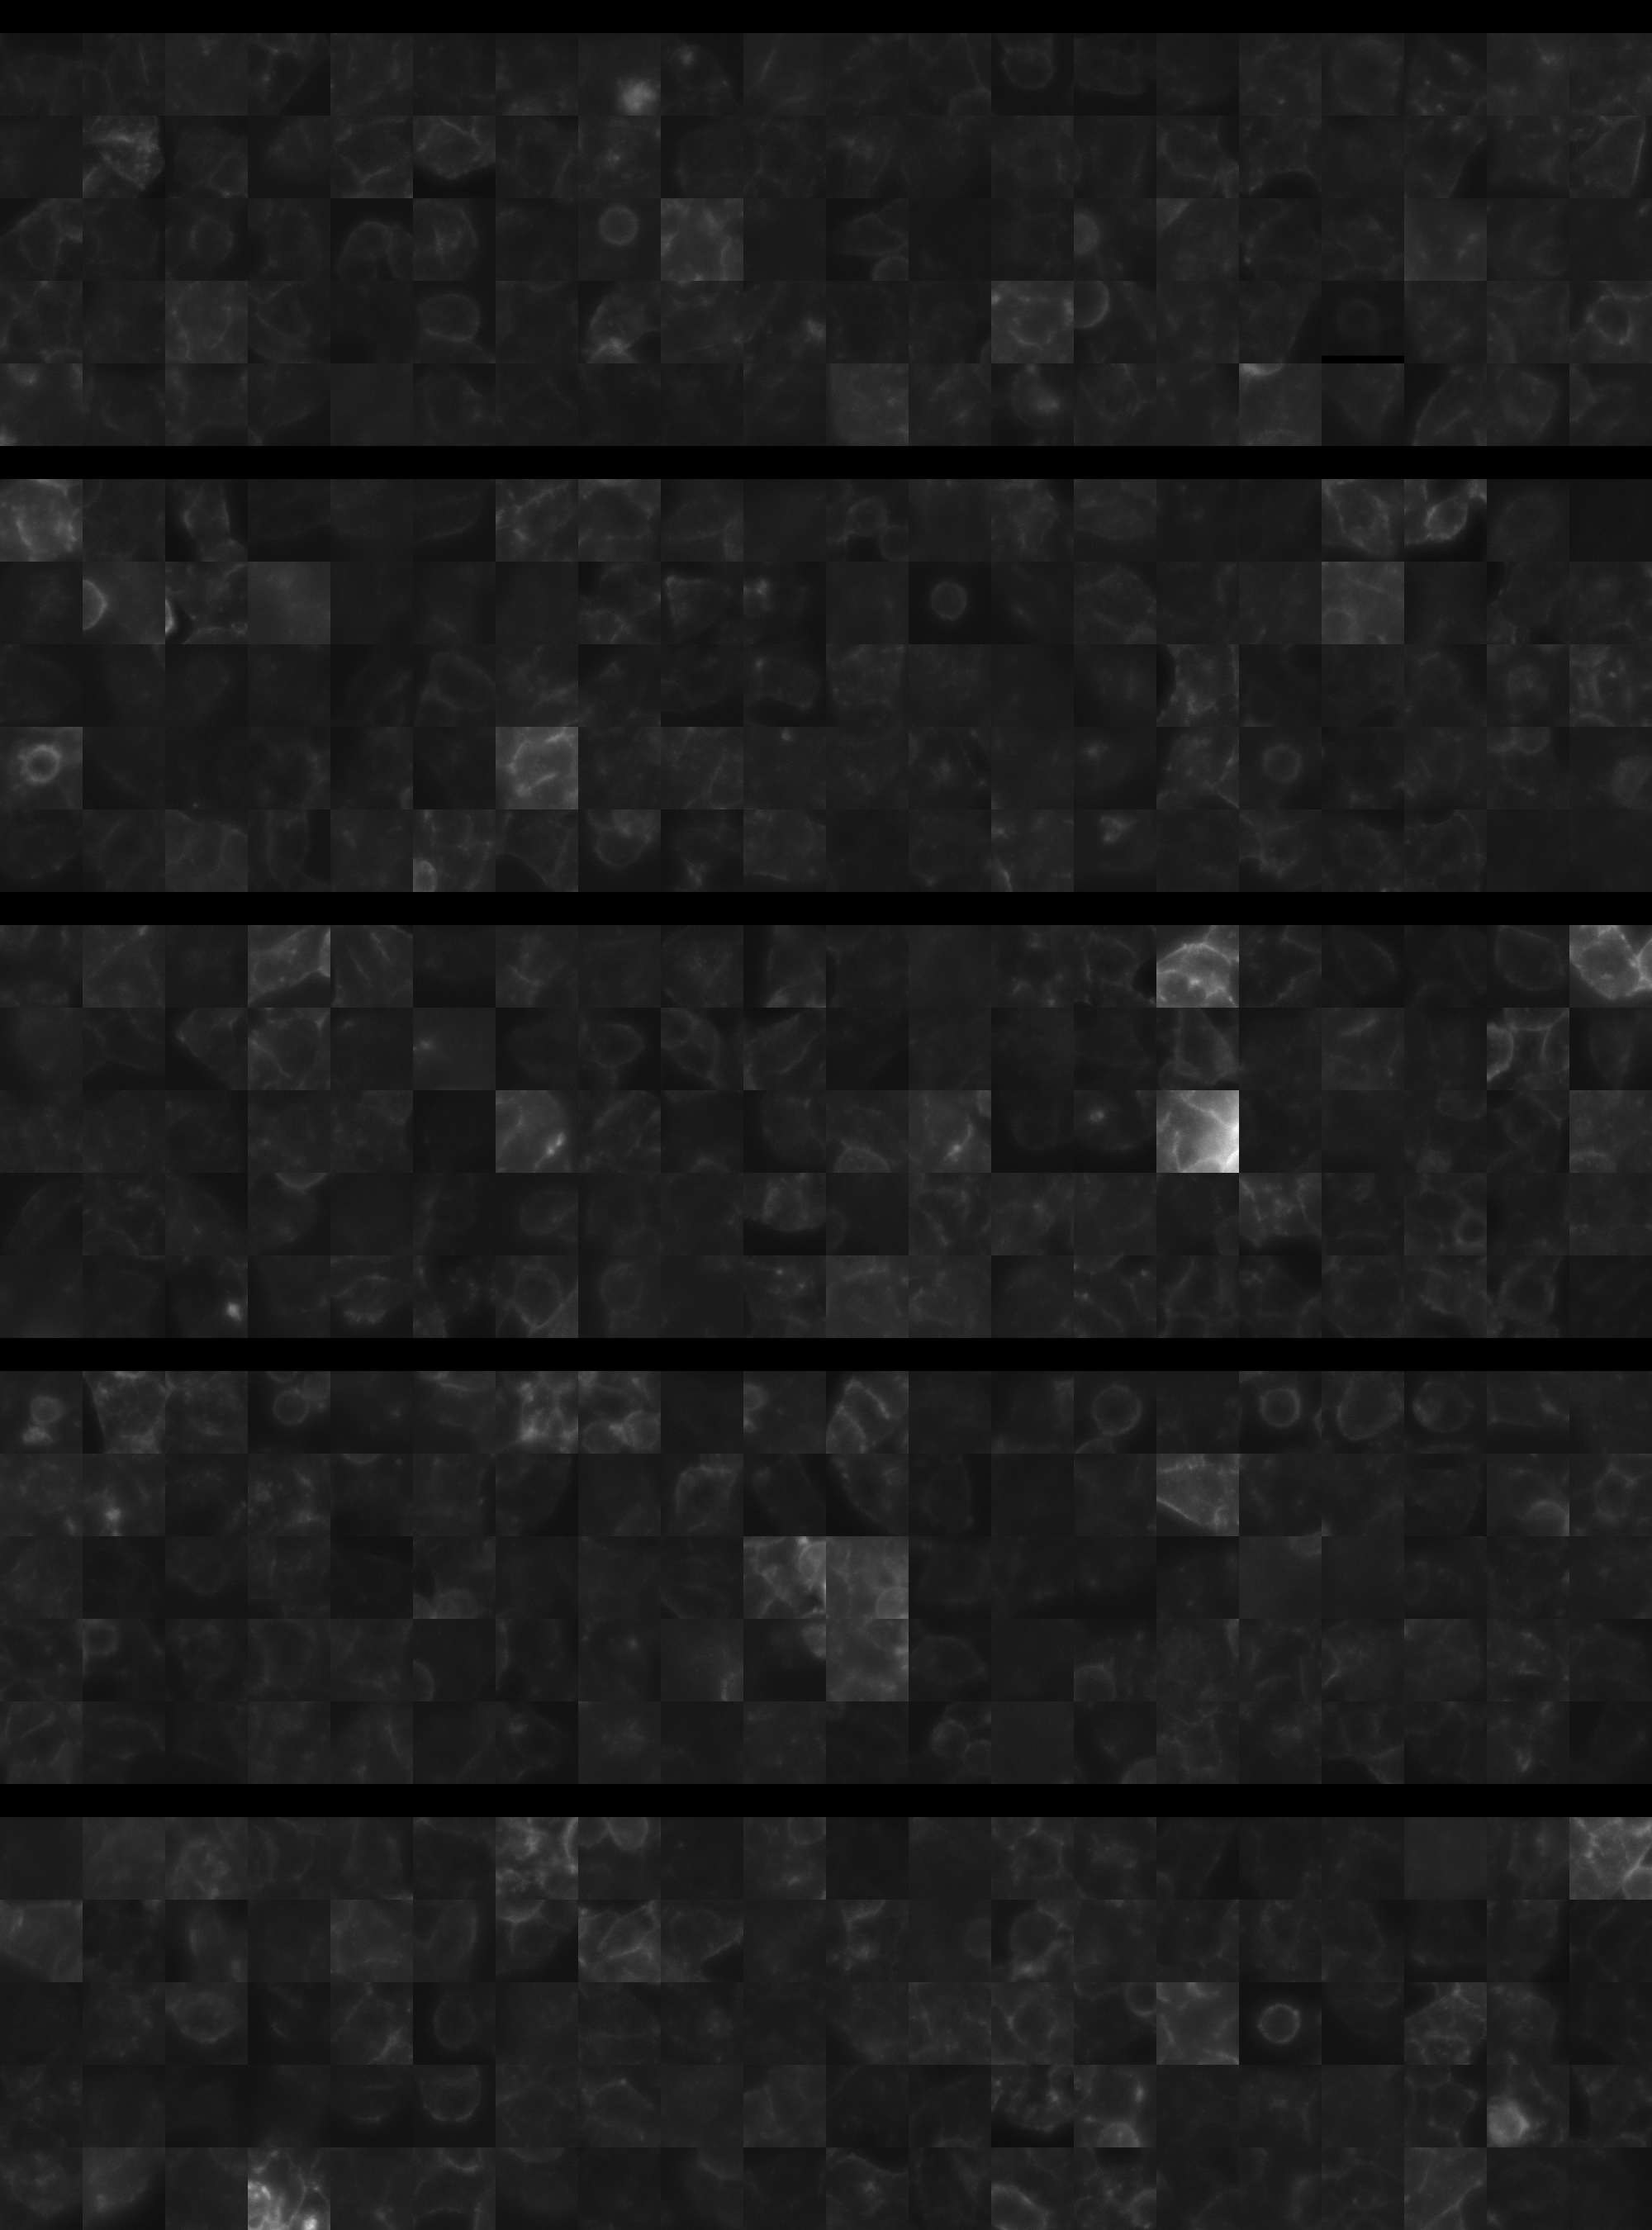
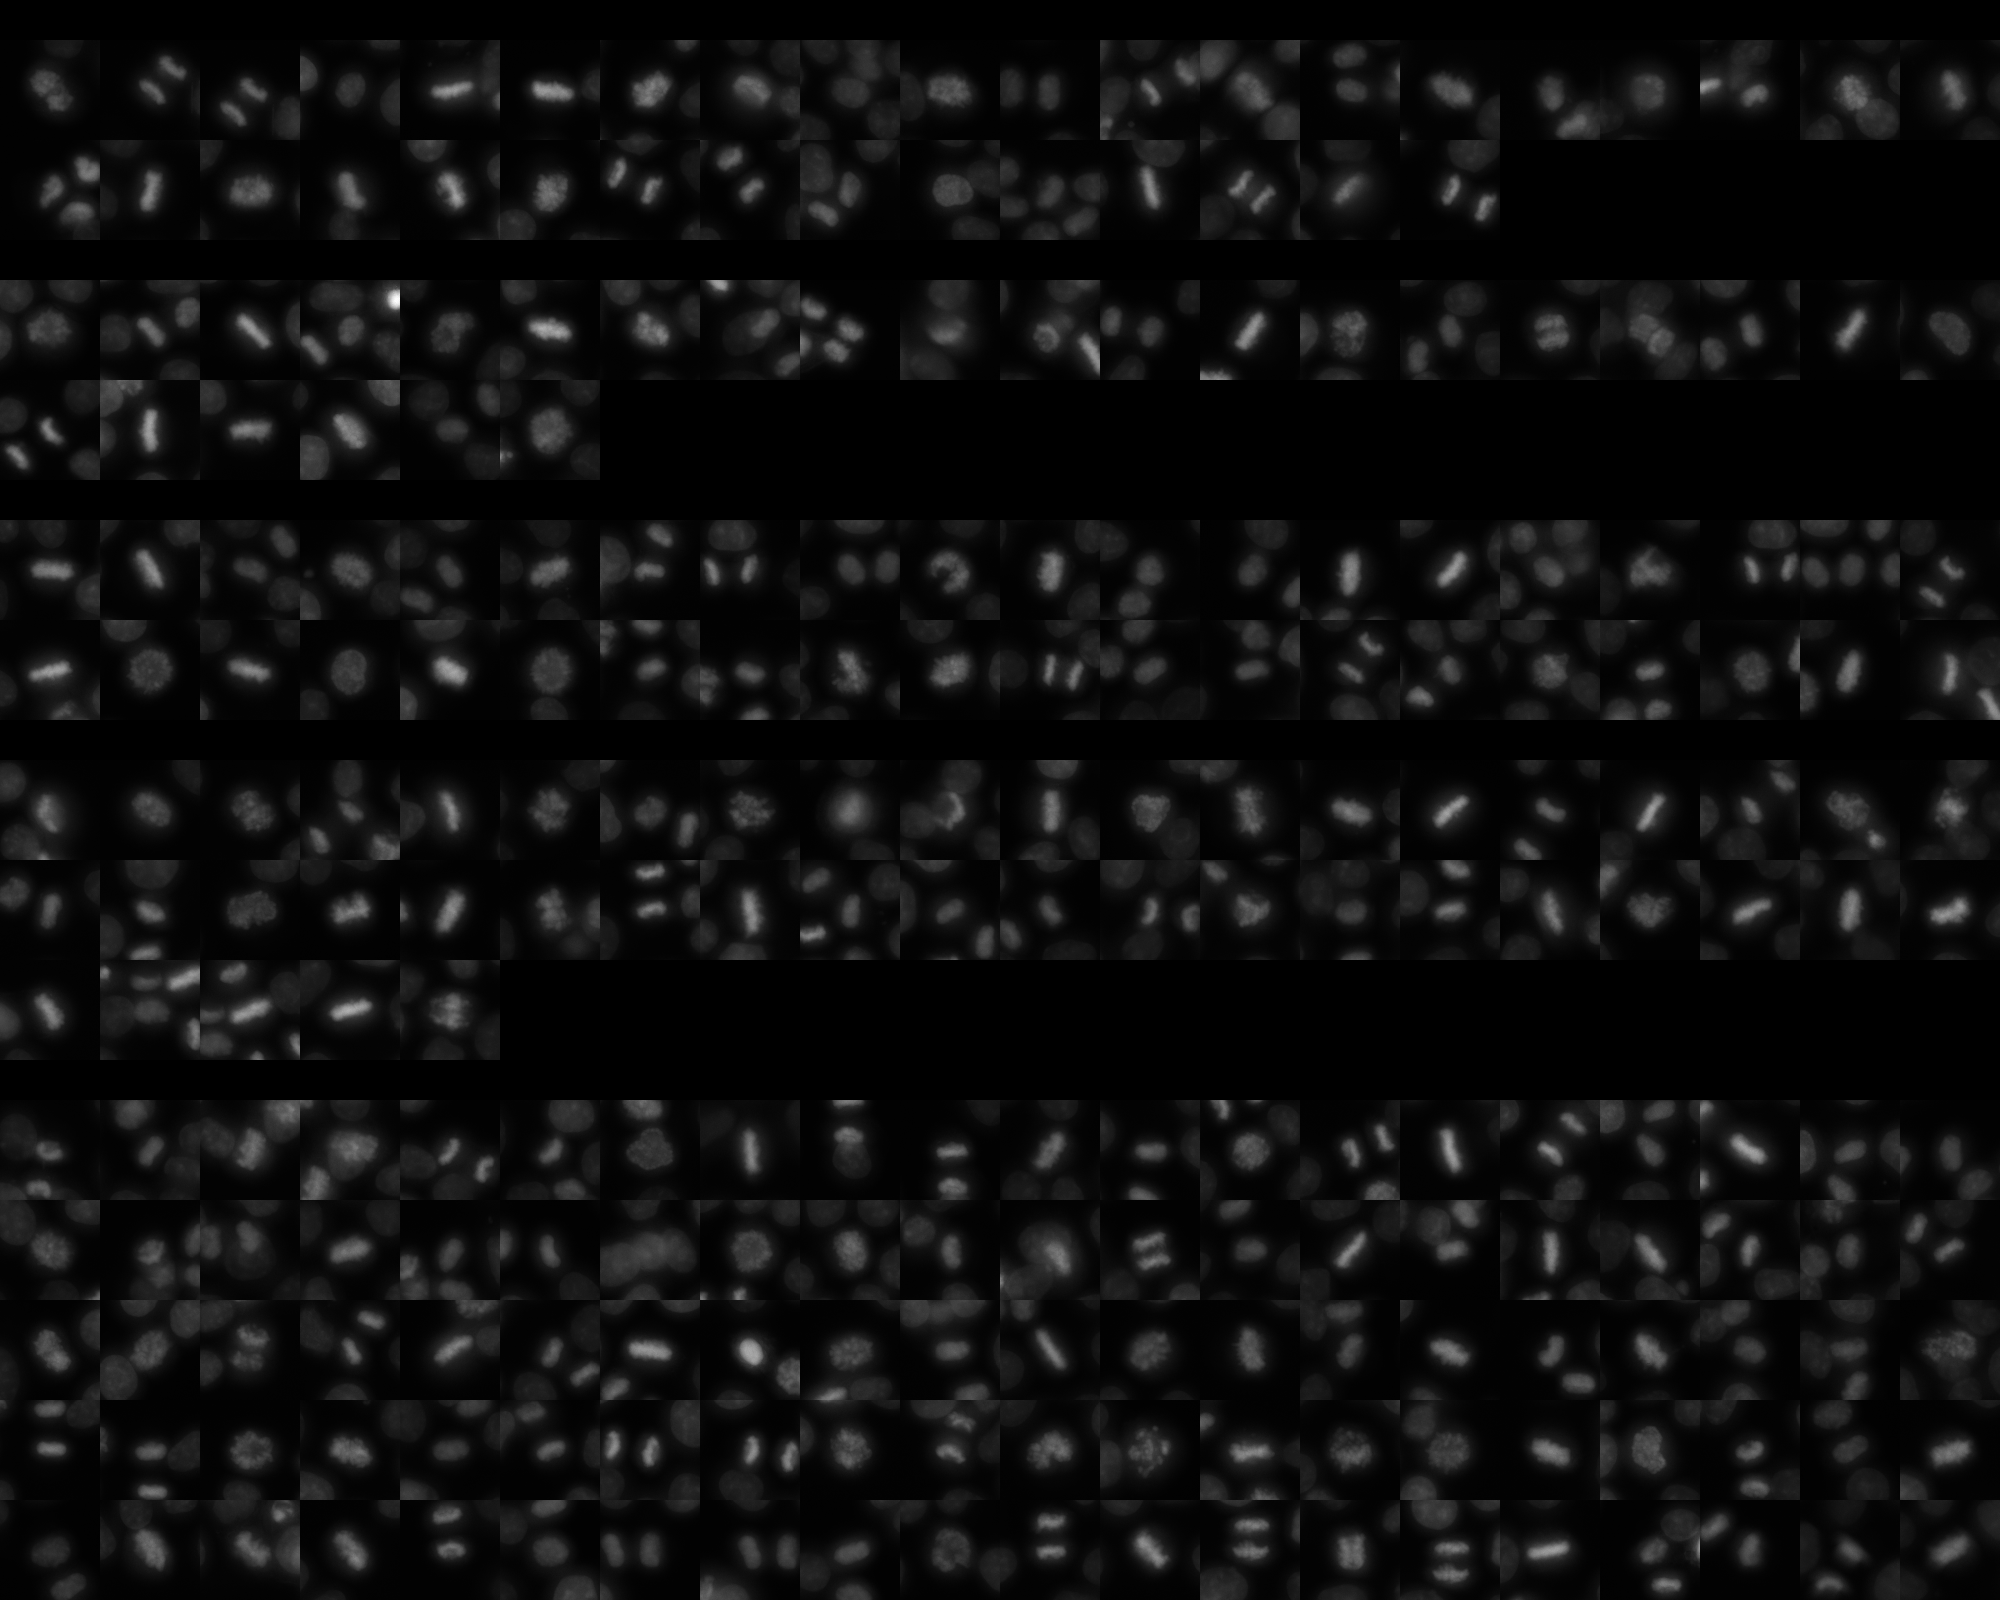
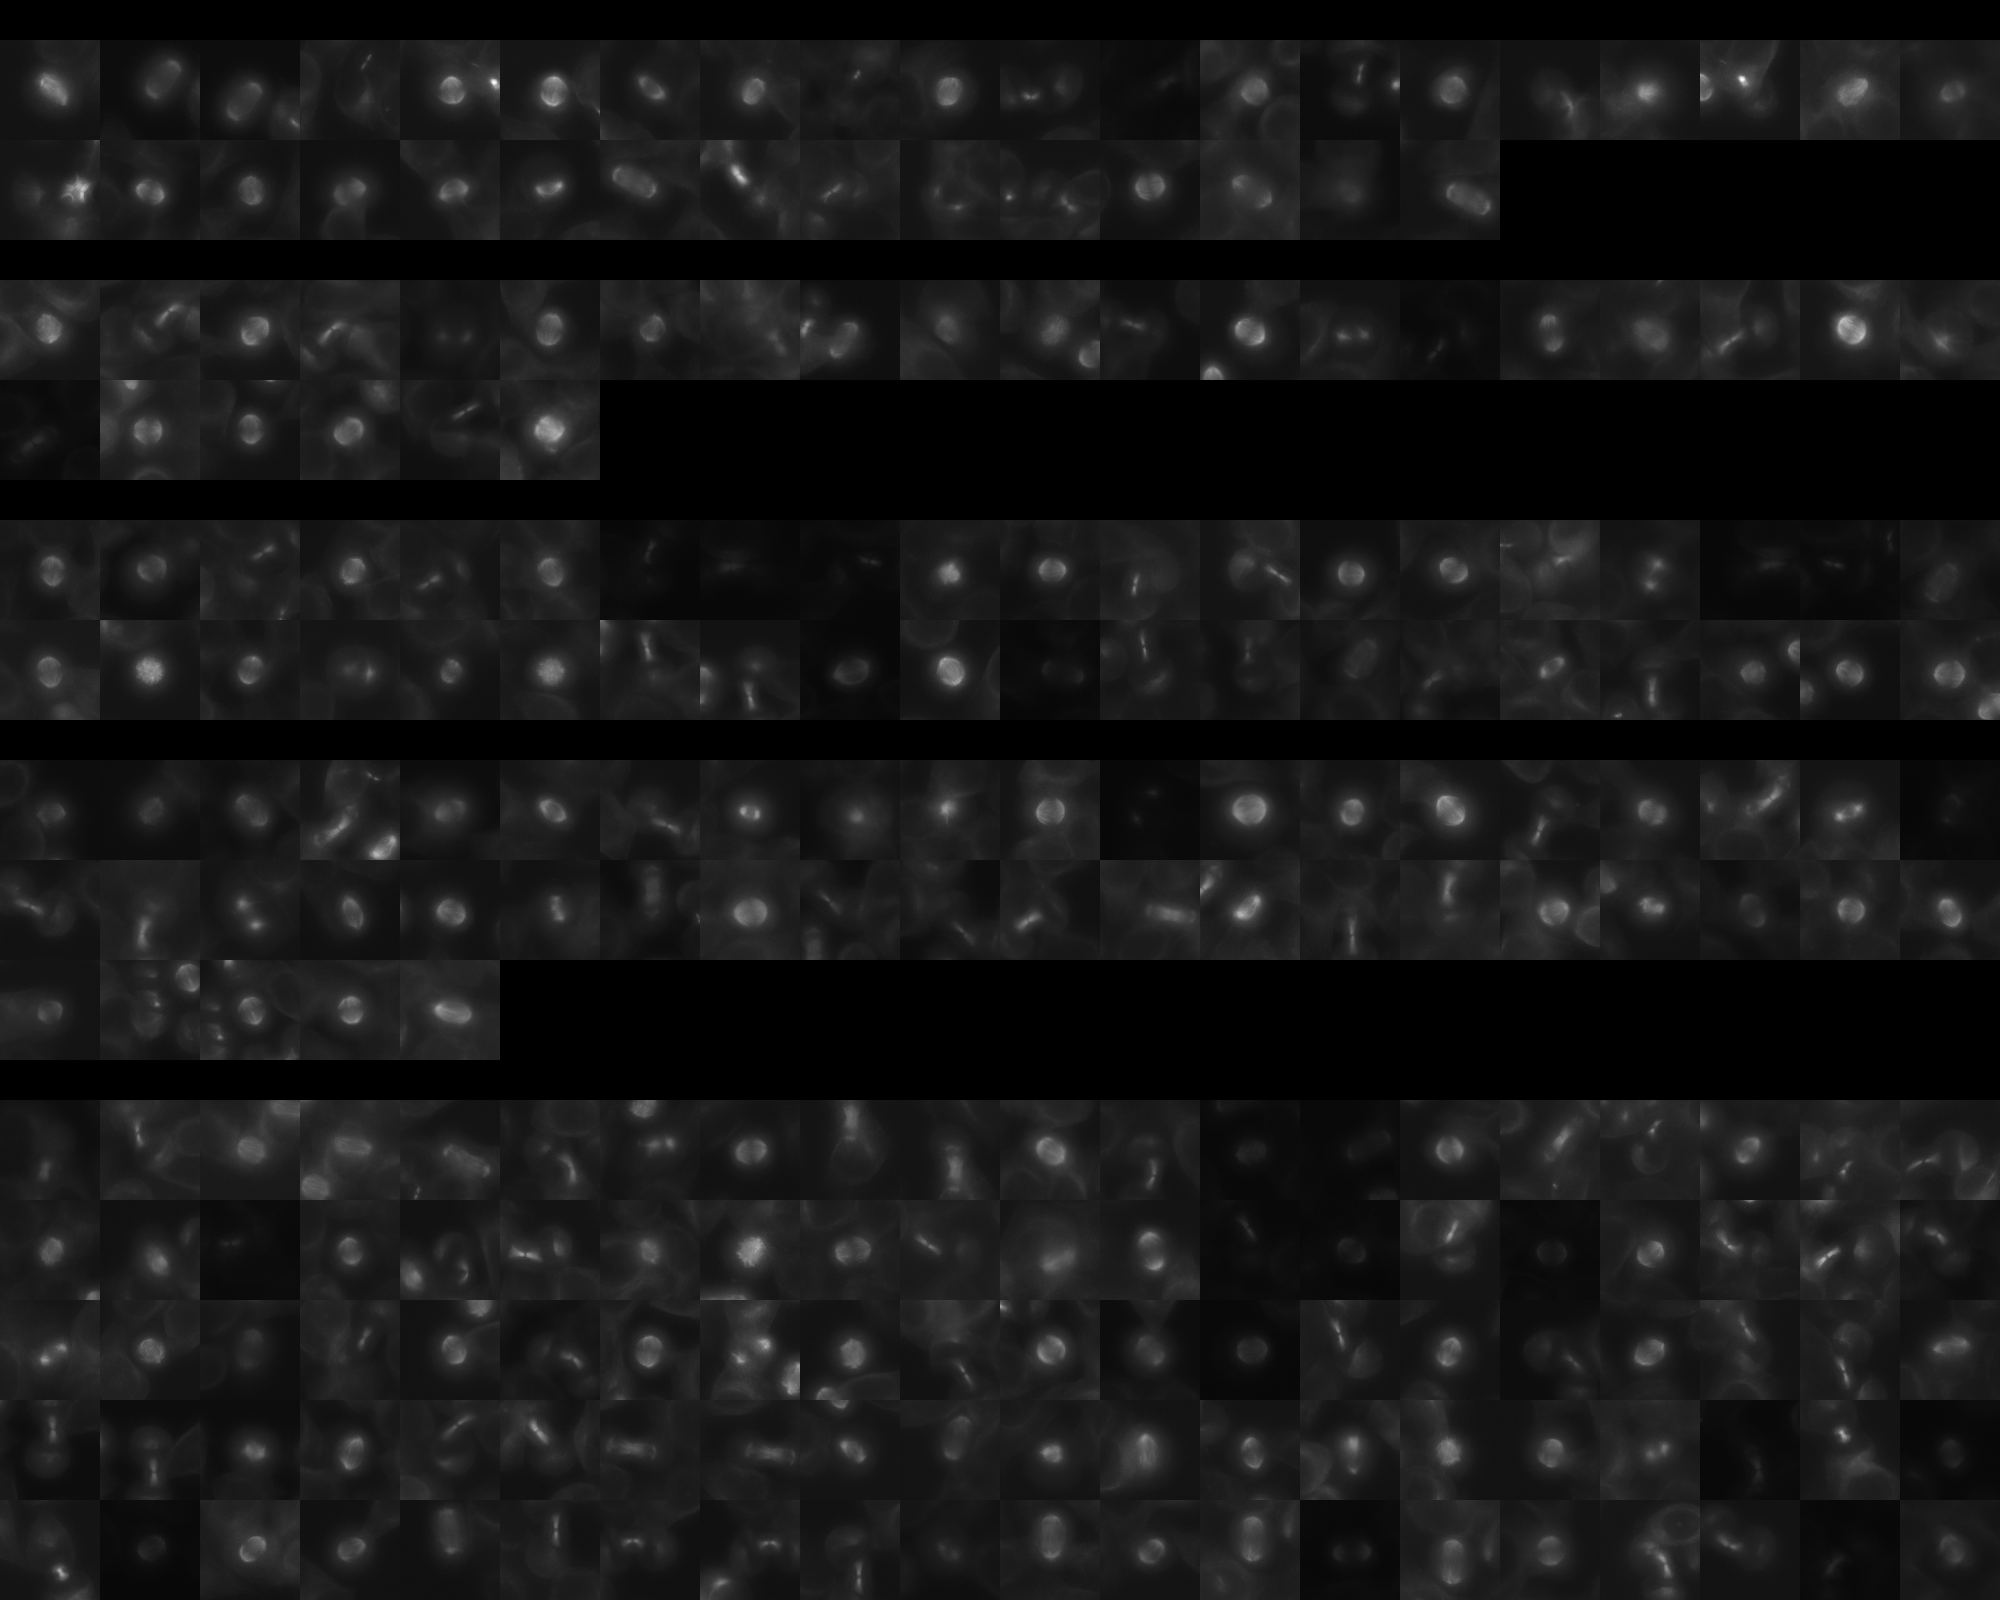
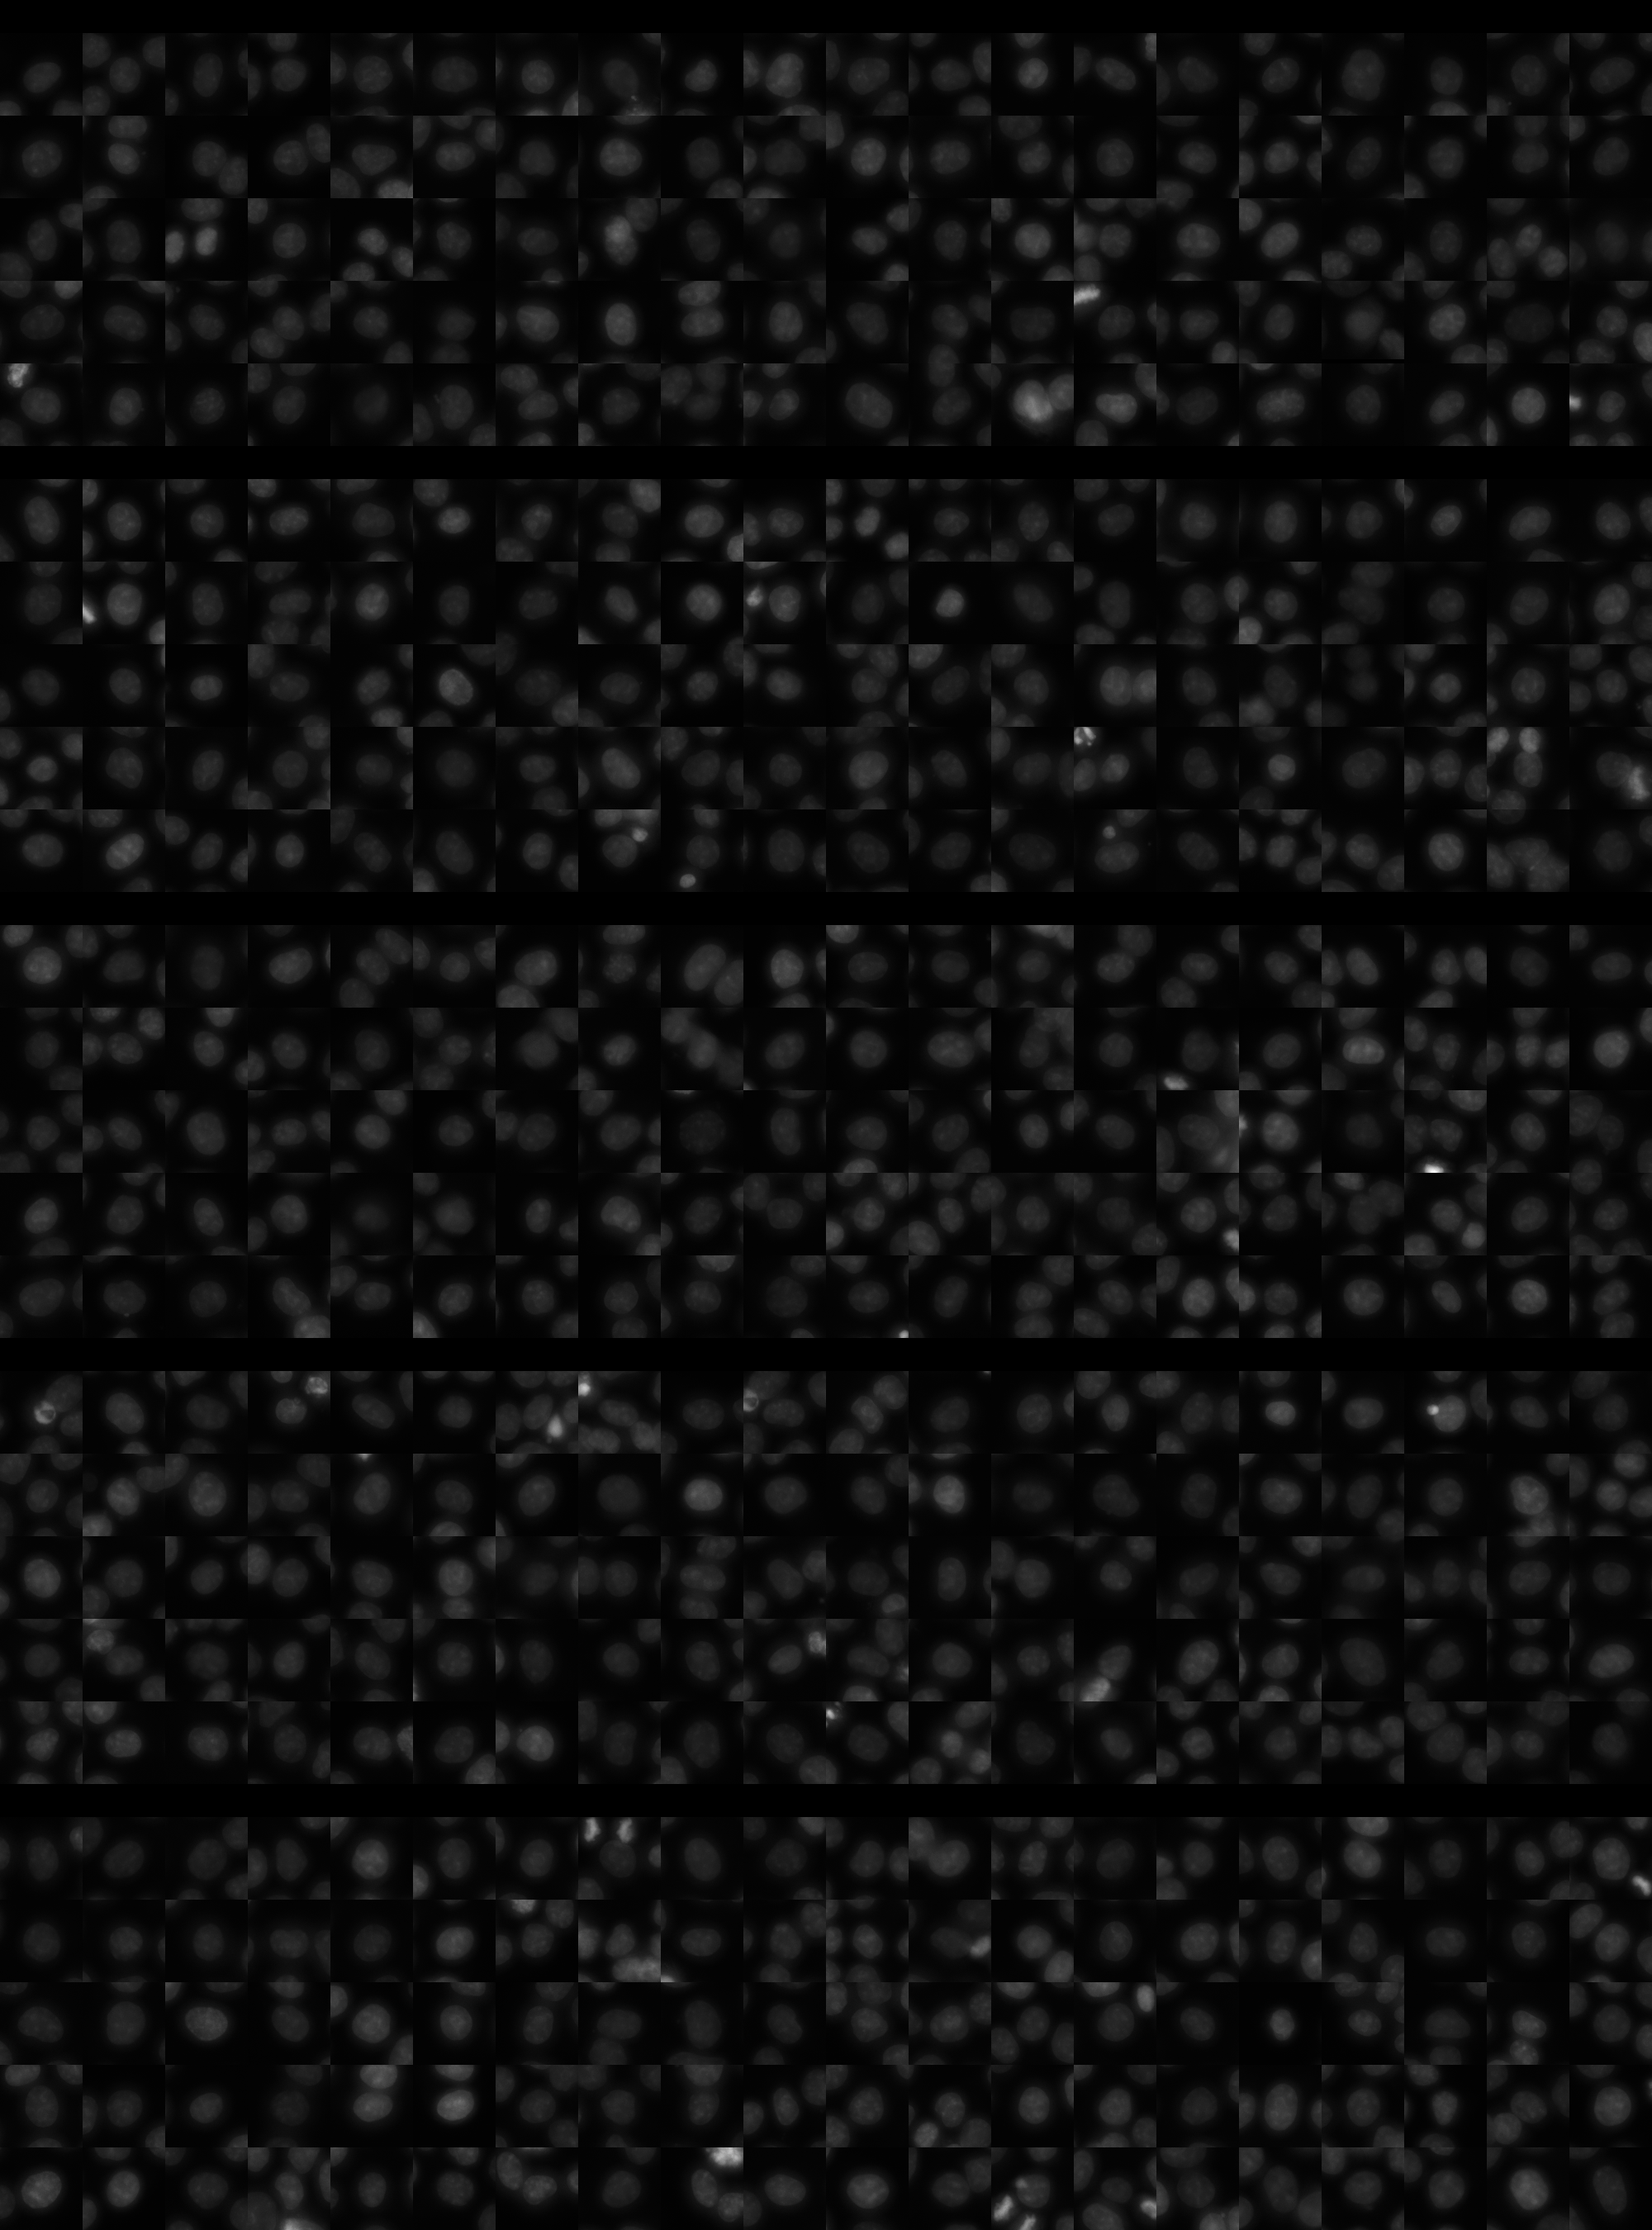
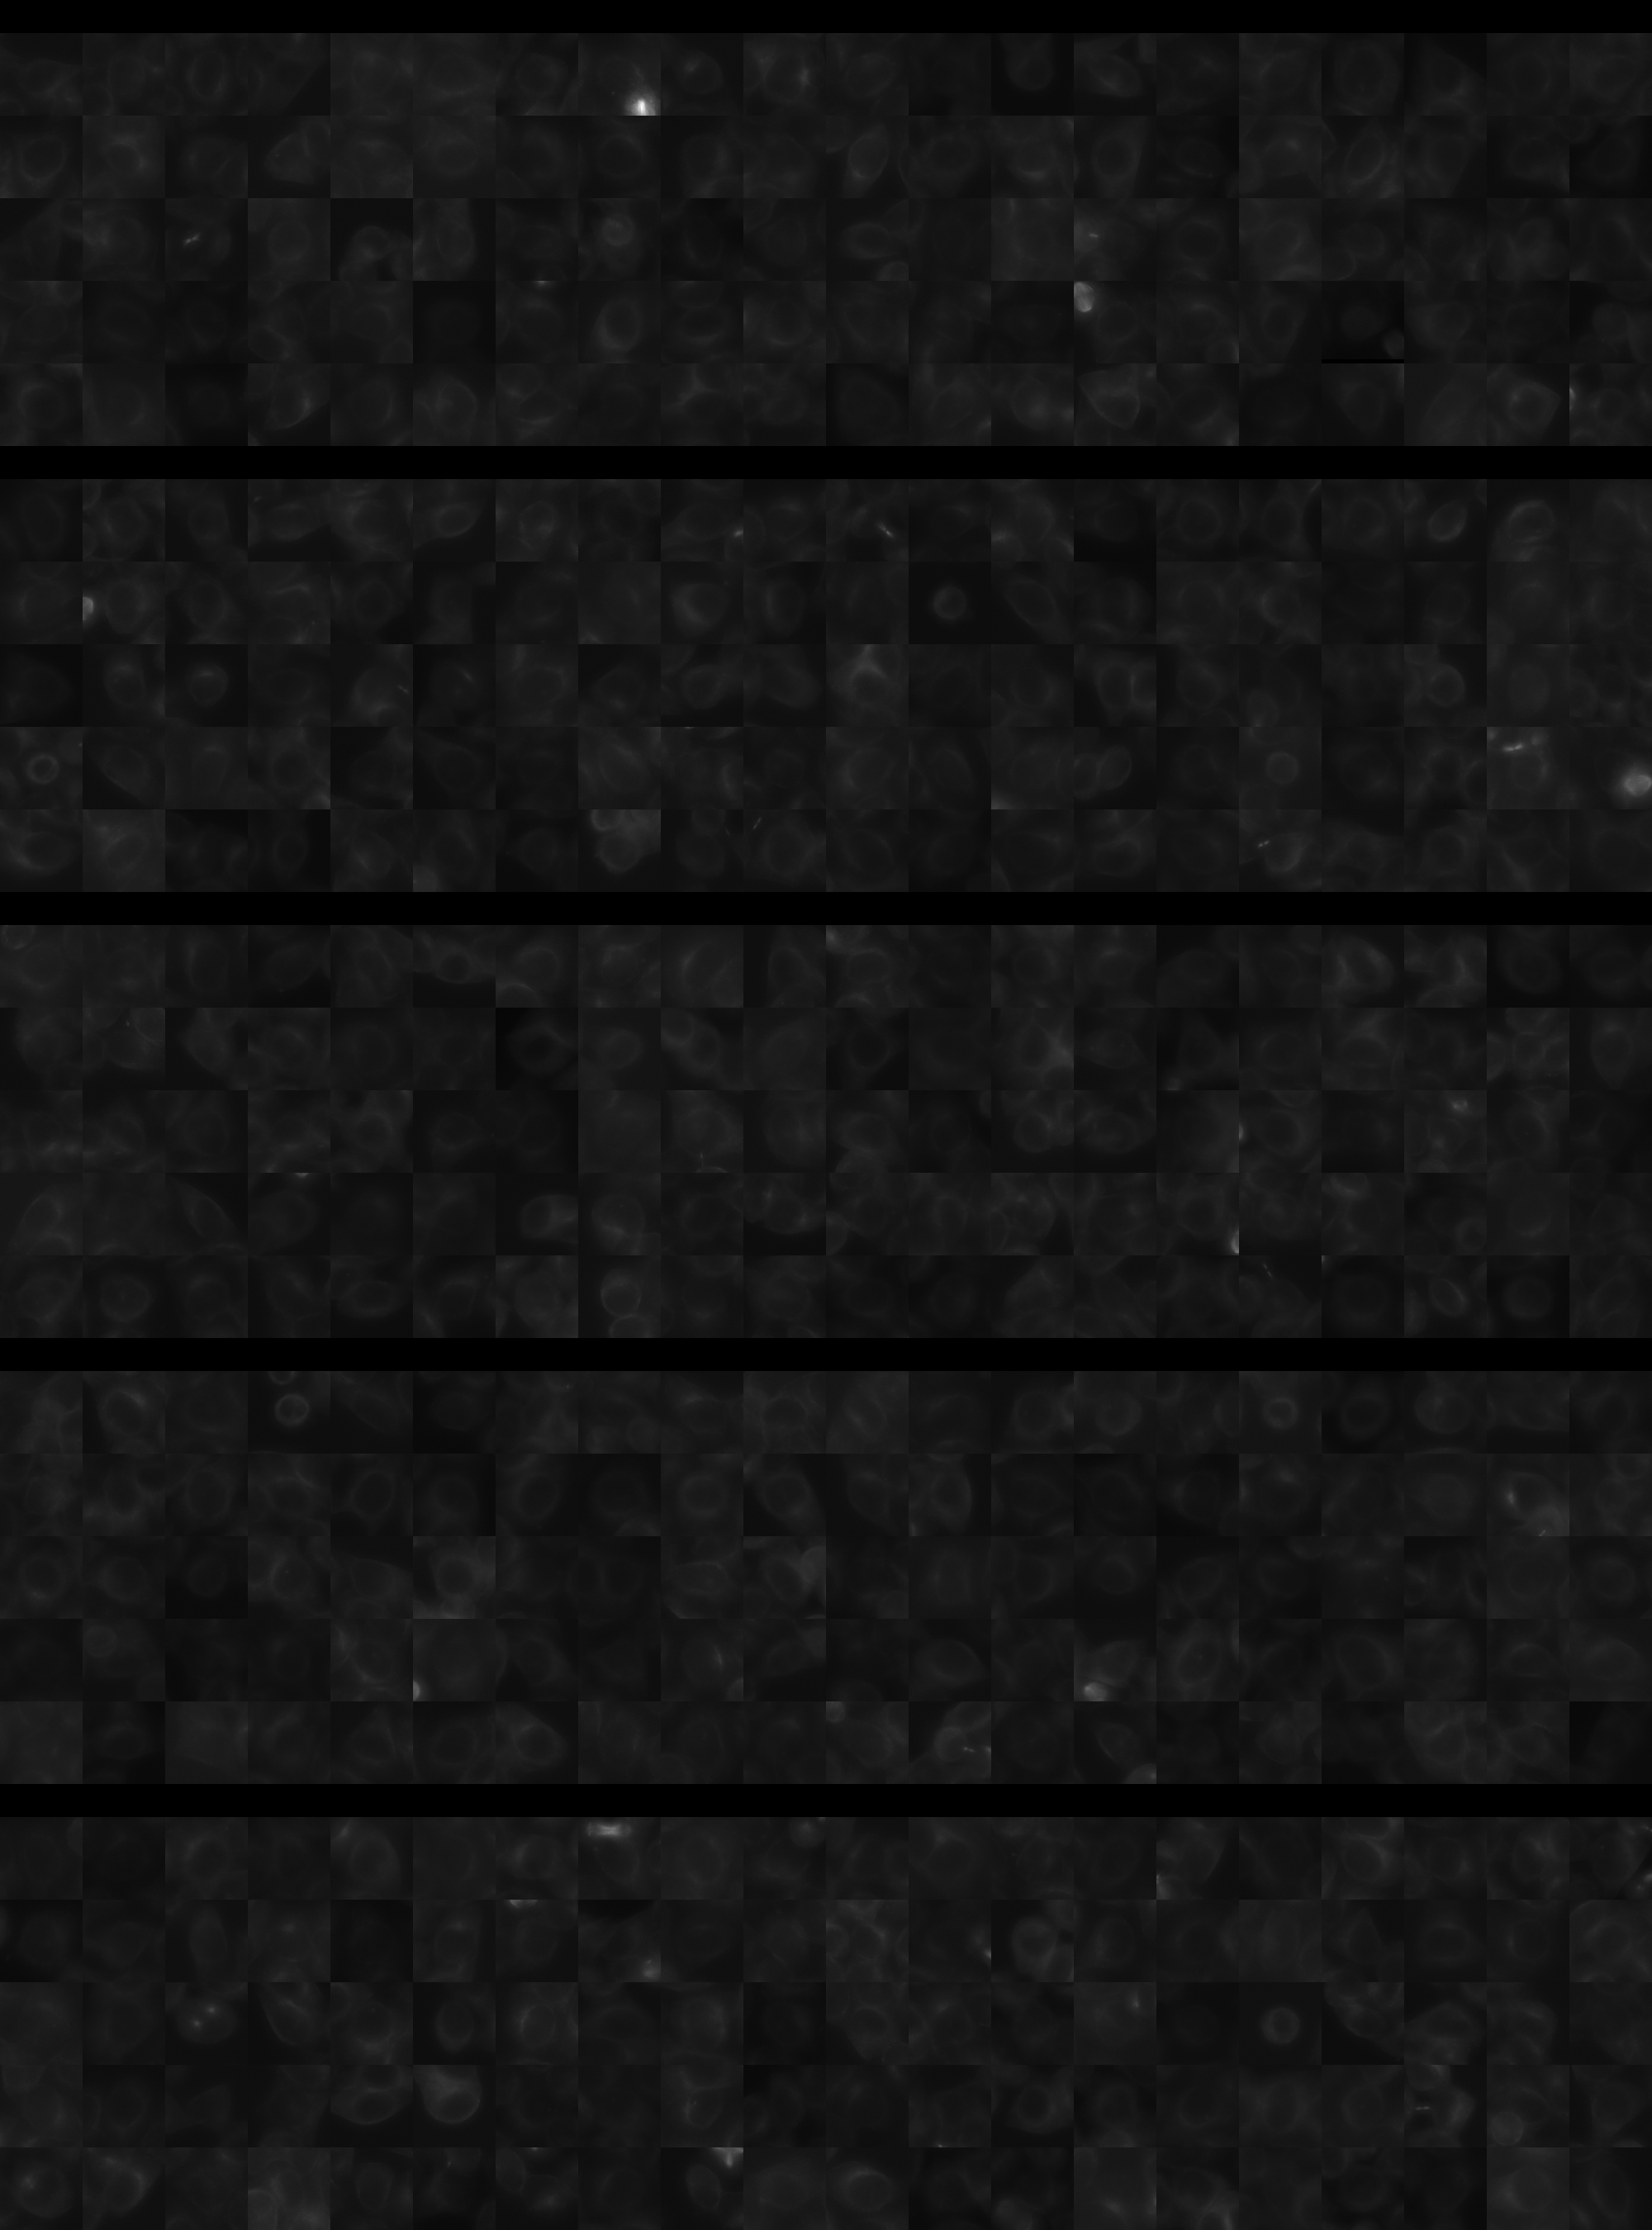
Each montage below shows randomly selected individual cell images for the same target gene separated by sgRNA, along with an example montage of cells expressing a non-targeting negative control sgRNA at the bottom. sgRNA labels in the montages correspond to the numbered sgRNA sequences in the gene info table above. The DNA (blue) and tubulin (green) channels are displayed by default, with gH2AX (grayscale) and actin (yellow) available using the check boxes. Channel brightness, contrast, and opacity are adjustable by clicking the arrow next to the channel name. When only one channel is selected, the display defaults to grayscale. Click the “Zoom” checkbox above the channel controls to enable image zooming (via scrolling) and panning (via click-and-drag).

The cell boxes displayed for this gene are square, 30.36 μm per side for the interphase montage and 30.36 μm per side for the mitotic montage.
Features

Interphase Score Rank FDR q-value
Nucleus DNA Integrated 0.017 2264 of 5322 0.858
Nucleus DNA Mean -1.137e-02 2342 of 5322 0.859
Nucleus gH2AX Mean 0.109 1731 of 5322 0.009
Nucleus DNA - gH2AX Correlation -4.746e-02 2319 of 5322 0.095
Nucleus Shape Area 0.032 2223 of 5322 0.661
Nucleus Shape Eccentricity 0.060 696 of 5322 0.092
Nucleus Shape Form Factor -3.753e-02 2061 of 5322 0.352
Nucleus Shape Solidity -2.026e-02 1323 of 5322 0.583
Cell DNA Mass Displacement 0.002 4233 of 5322 0.998
Cell Tubulin Mean 0.009 2431 of 5322 0.842
Cell Tubulin Mass Displacement 0.019 1863 of 5322 0.780
Cell Actin Mean 0.009 2694 of 5322 0.871
Cell Tubulin - Actin Correlation 0.013 3058 of 5322 0.803
Cell DNA - Tubulin Correlation 0.048 1960 of 5322 0.193
Cell Shape Area 0.013 2761 of 5322 0.973
Cell Shape Eccentricity 0.009 2976 of 5322 0.928
Mitotic Score Rank FDR q-value
Nucleus DNA Integrated 0.019 3688 of 5322 0.996
Nucleus DNA Mean 0.079 1737 of 5322 1.000
Nucleus DNA Mass Displacement 0.042 2833 of 5322 0.999
Nucleus DNA Mean Frac 3 0.088 1746 of 5322 1.000
Nucleus gH2AX Mean 0.130 1302 of 5322 1.000
Nucleus gH2AX Mean Frac 0 0.039 1704 of 5322 1.000
Nucleus Tubulin Mean Frac 0 0.159 1227 of 5322 0.999
Nucleus Tubulin Mean Edge -4.173e-02 3714 of 5322 0.999
Nucleus Tubulin Std Edge -4.091e-02 3131 of 5322 0.999
Nucleus Shape Area 0.114 2457 of 5322 0.989
Nucleus Shape Eccentricity -7.399e-03 2232 of 5322 1.000
Nucleus Shape Form Factor 0.104 391 of 5322 0.998
Cell Tubulin Mean -7.242e-02 4349 of 5322 0.997
Cell Tubulin Mean Frac 3 0.016 1508 of 5322 0.999
Cell Actin Mean 0.014 3014 of 5322 1.000
Cell Shape Area 0.123 2287 of 5322 0.998
( Reset Zoom )
Brightness
Contrast
Opacity
Brightness
Contrast
Opacity
Brightness
Contrast
Opacity
Brightness
Contrast
Opacity
Brightness
Contrast
Opacity

( Reset Zoom )
Brightness
Contrast
Opacity
Brightness
Contrast
Opacity
Brightness
Contrast
Opacity
Brightness
Contrast
Opacity
Brightness
Contrast
Opacity

MIT Central Accessability