GNG13

Gene symbol: GNG13
Gene: 51764
Uniprot Function: Guanine nucleotide-binding proteins (G proteins) are involved as a modulator or transducer in various transmembrane signaling systems. The beta and gamma chains are required for the GTPase activity, for replacement of GDP by GTP, and for G protein-effector interaction.
Mitotic Index 0.0274
Interphase Cluster: #89 (25 genes)
Mitotic Cluster: #60 (28 genes)
sgRNA 1: CAGGCTGCTGAAGTGGATCG (interphase cells: 2065, mitotic cells: 71)
sgRNA 2: CGTGCCACAGATGAAGAAAG (interphase cells: 2445, mitotic cells: 72)
sgRNA 3: GATCGAGGACGGGATCCCCA (interphase cells: 1275, mitotic cells: 28)
sgRNA 4: TCTTGGACGCCATCTCCCGC (interphase cells: 1023, mitotic cells: 21)

Interphase Cluster

Mitotic Cluster

Overview

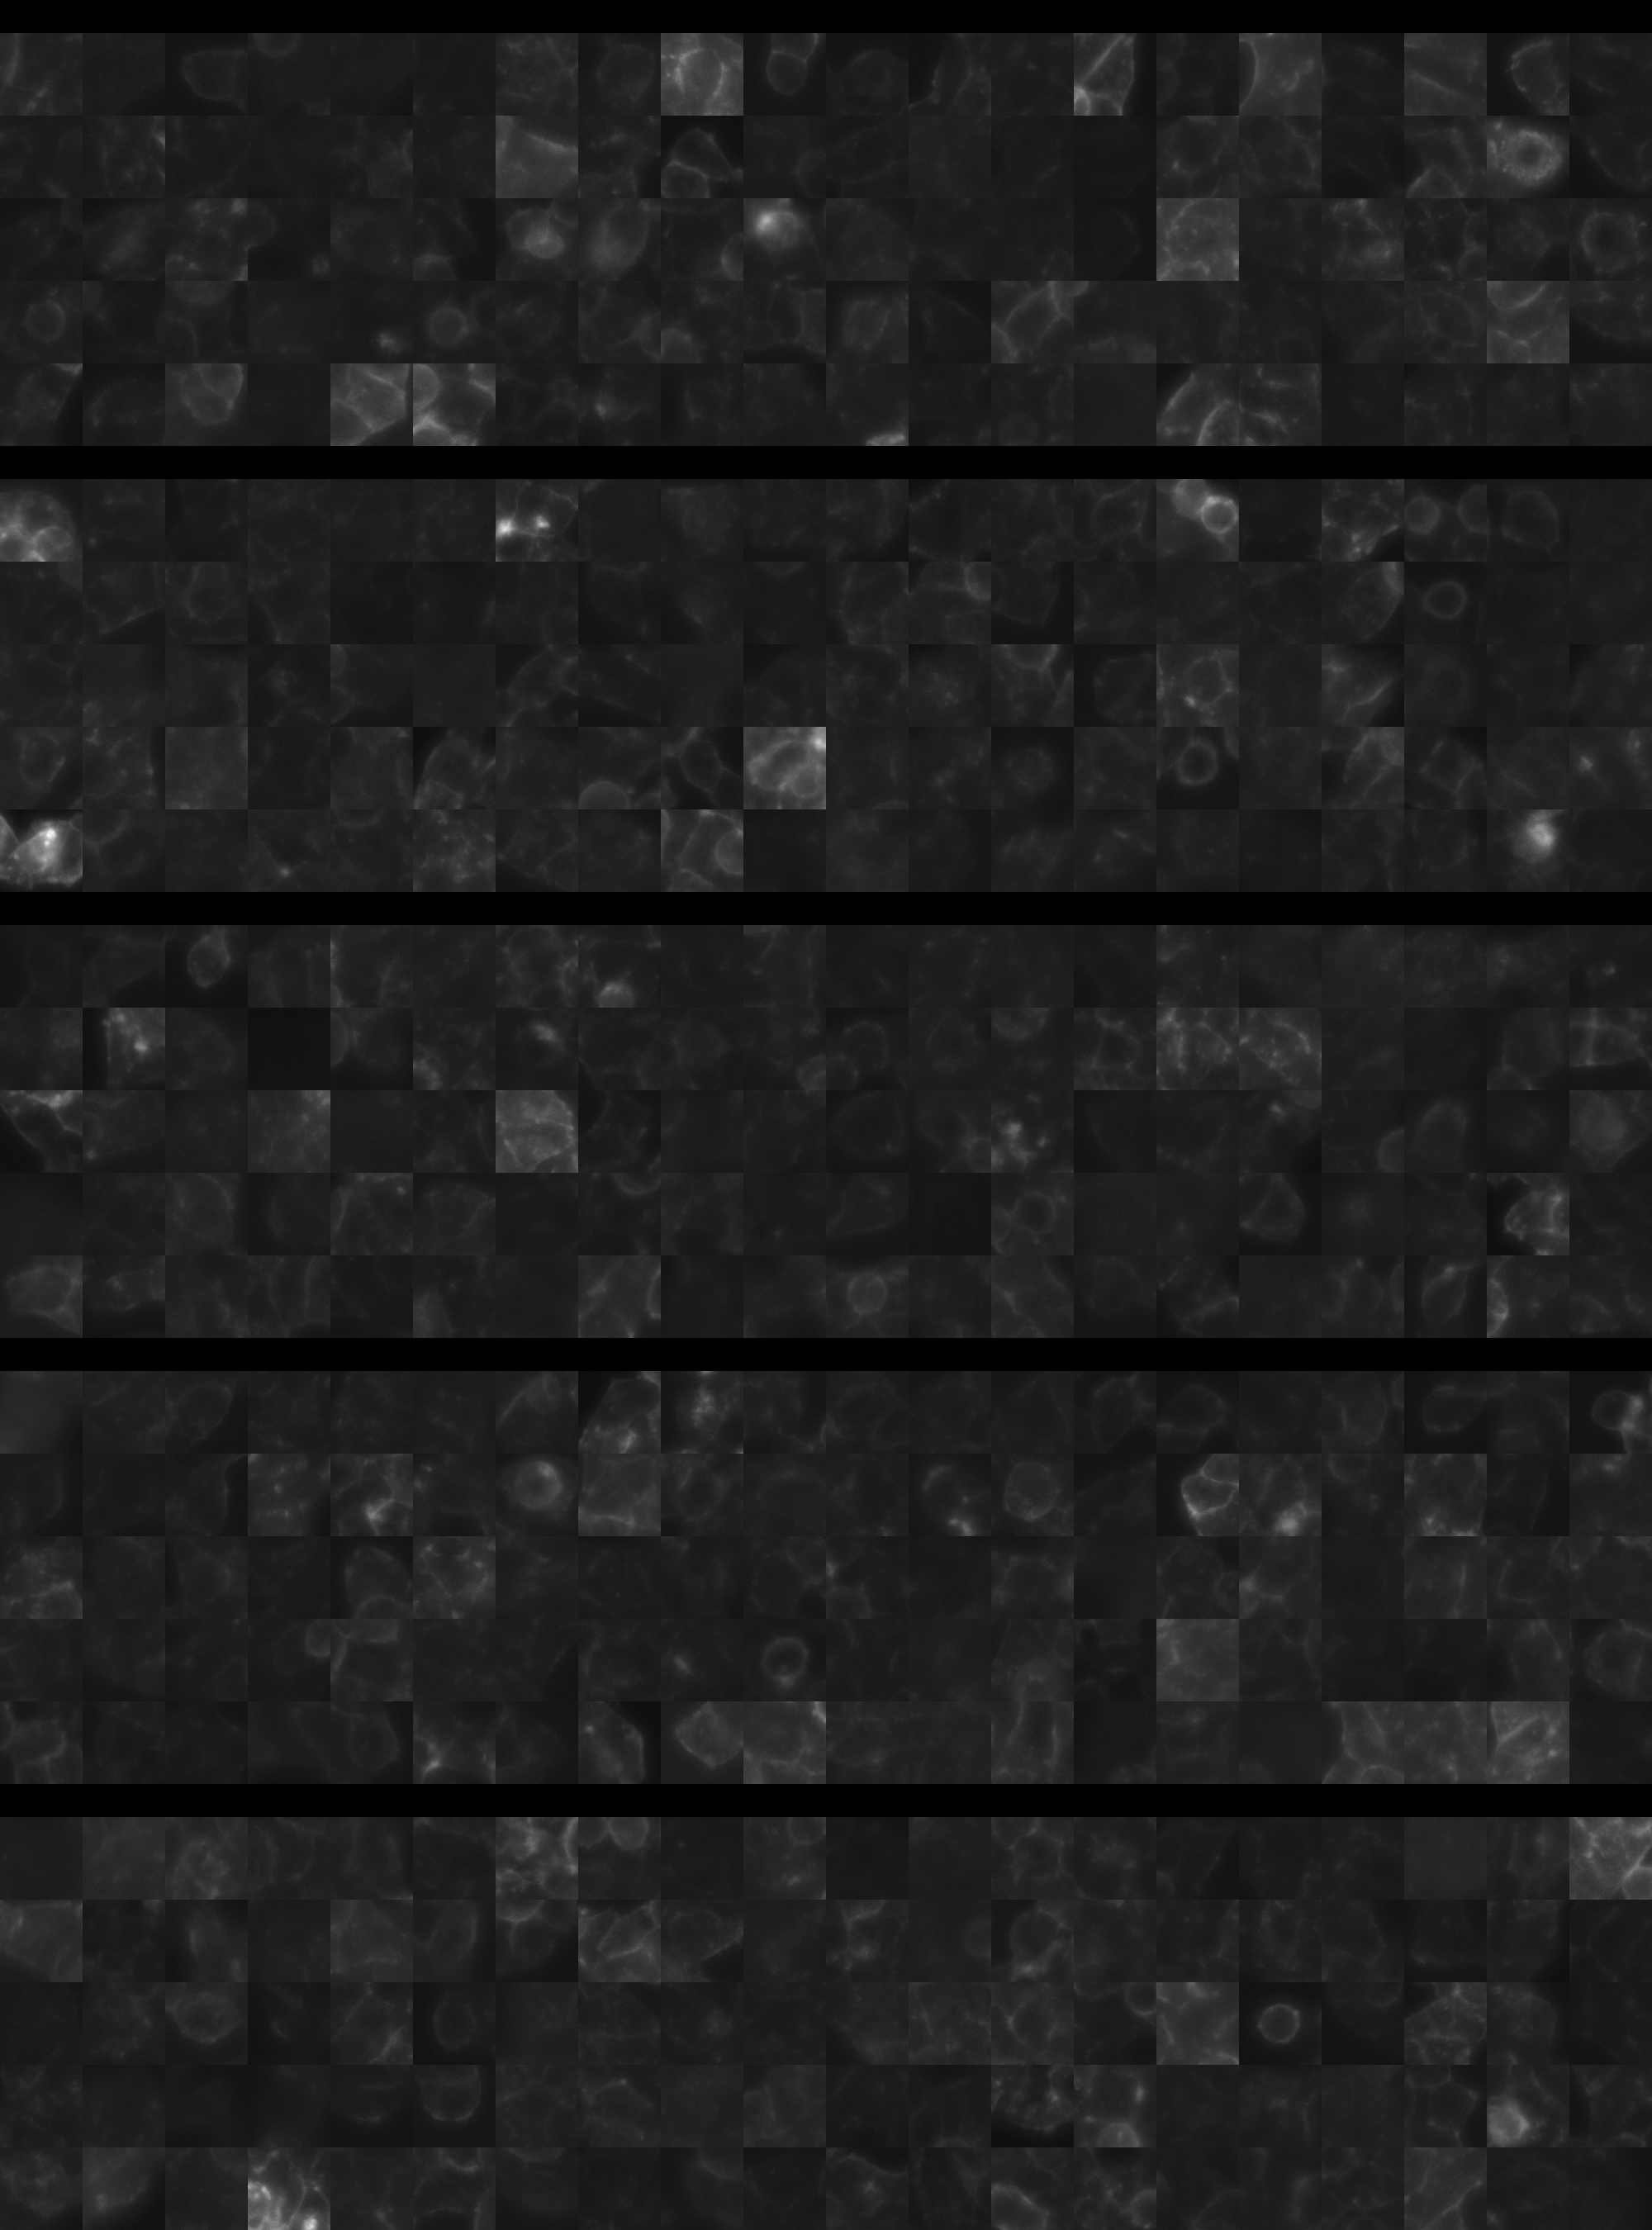
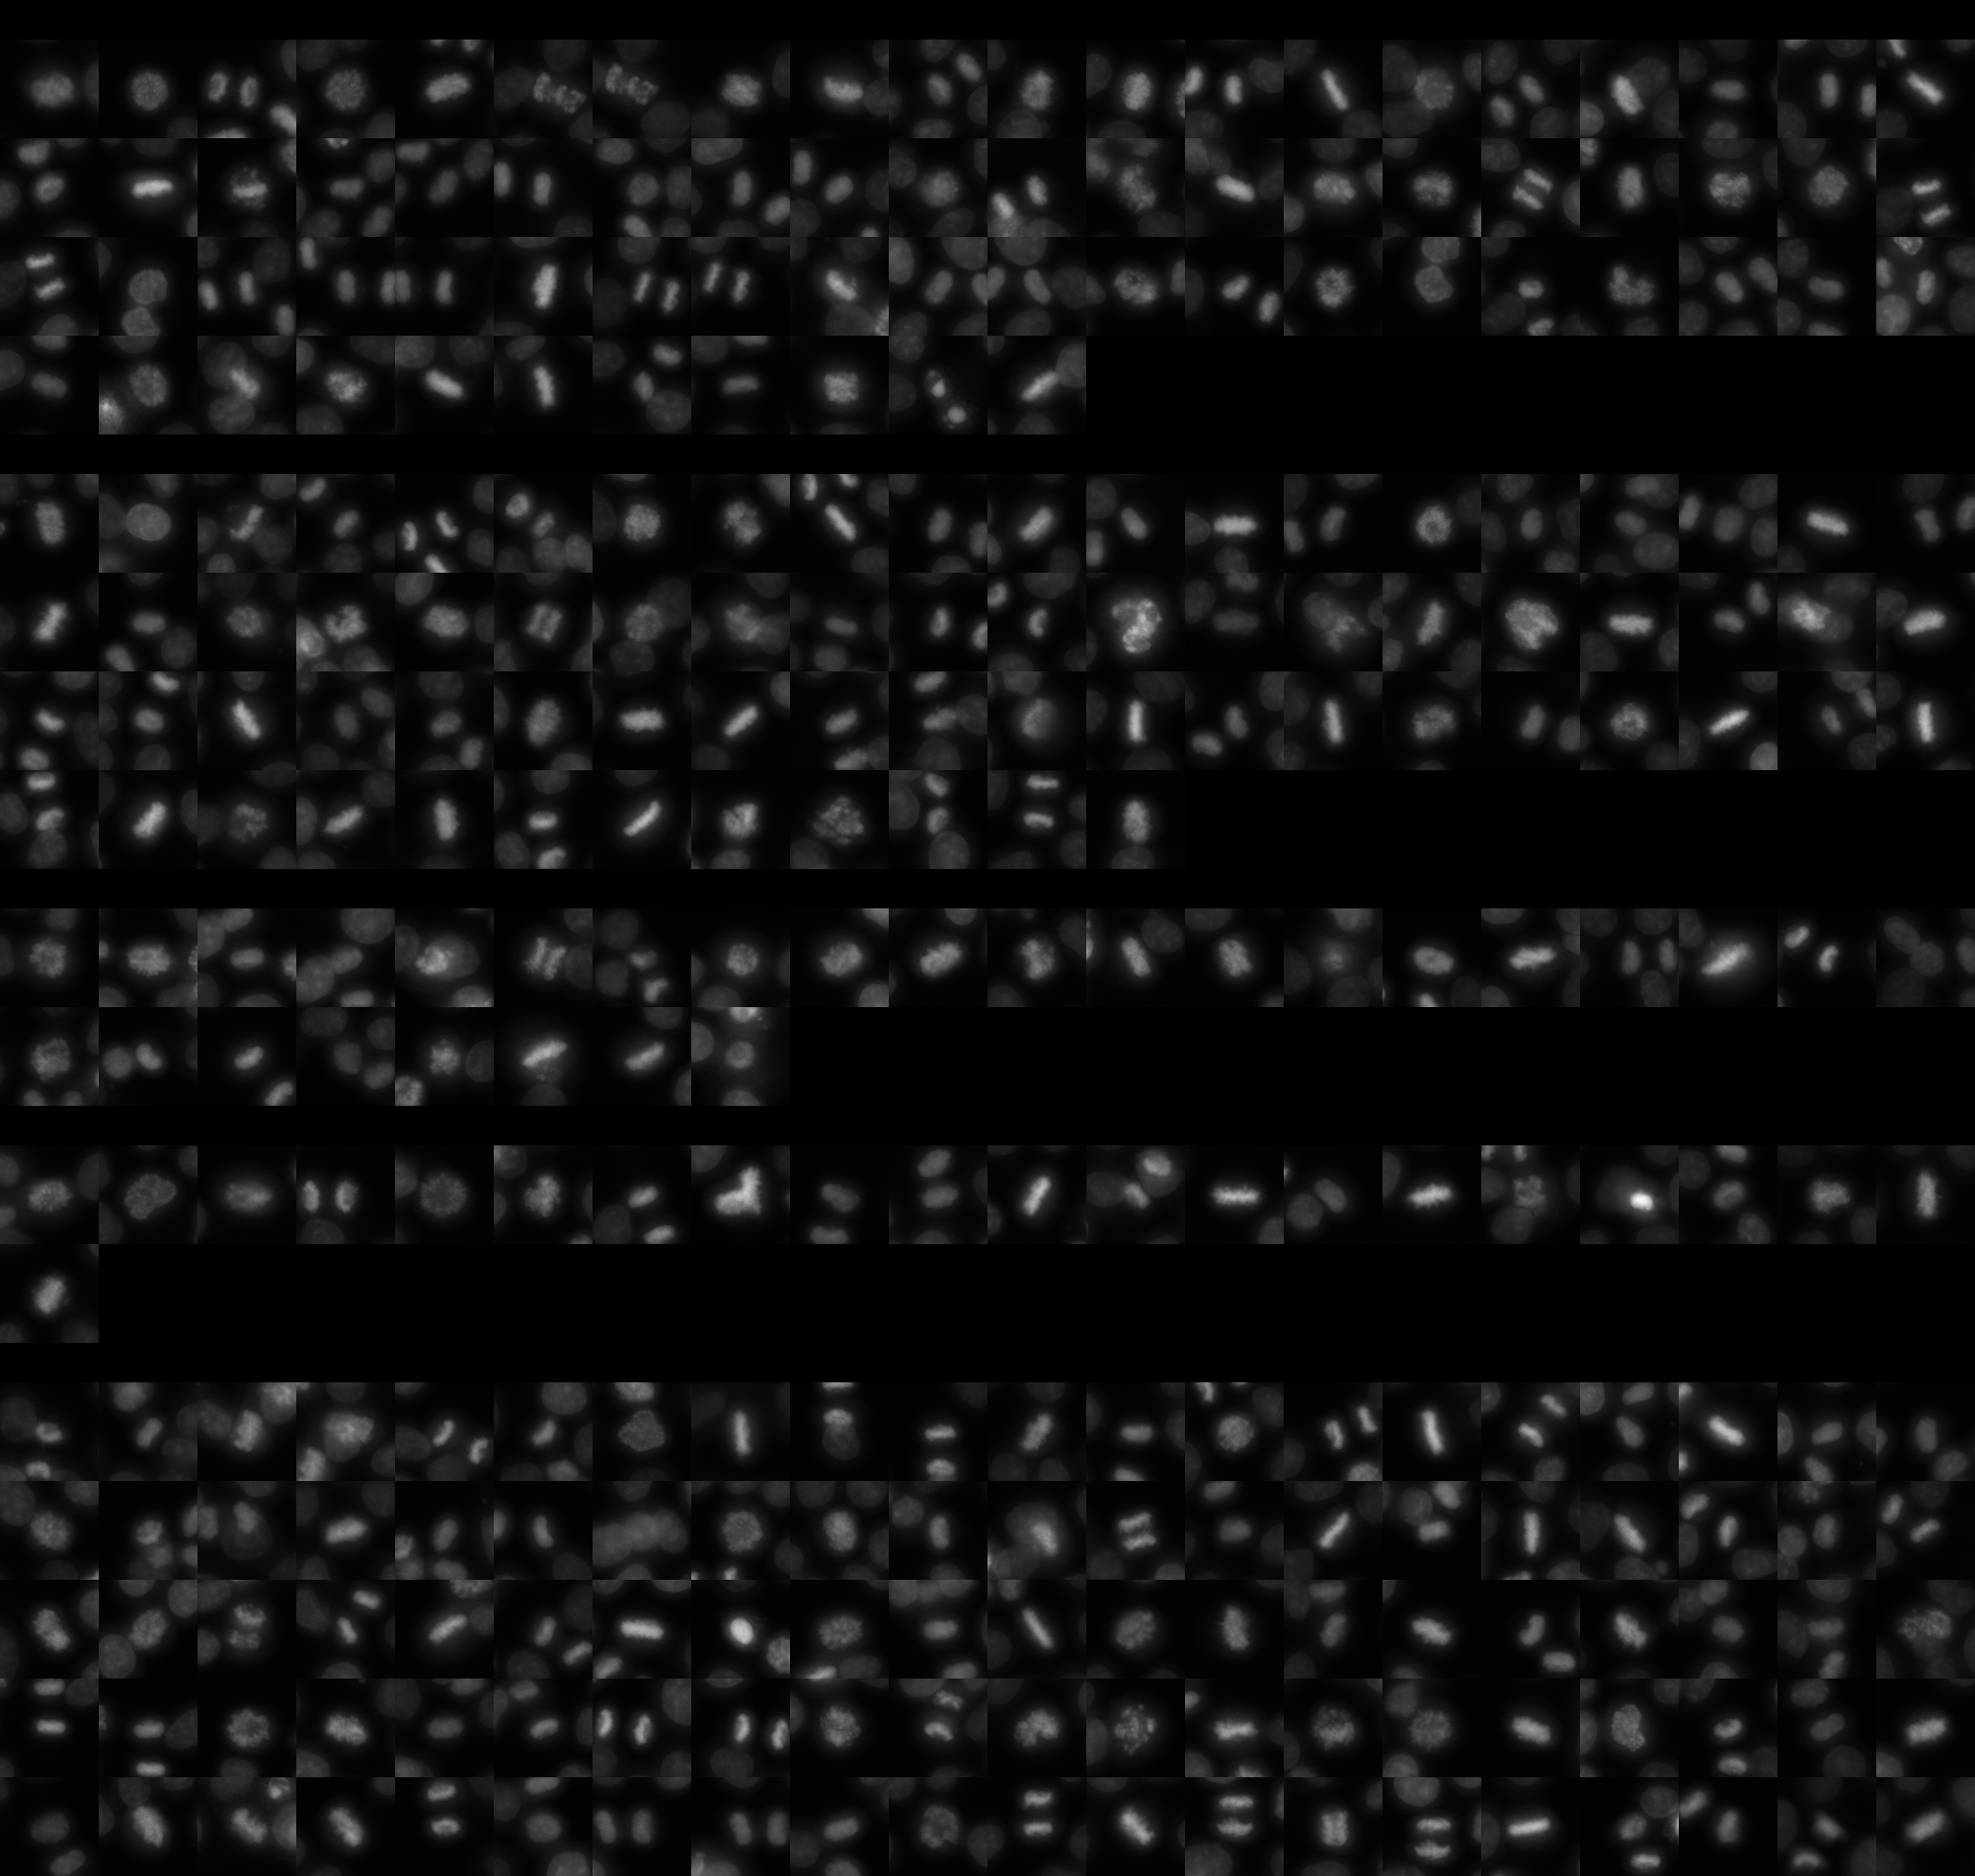
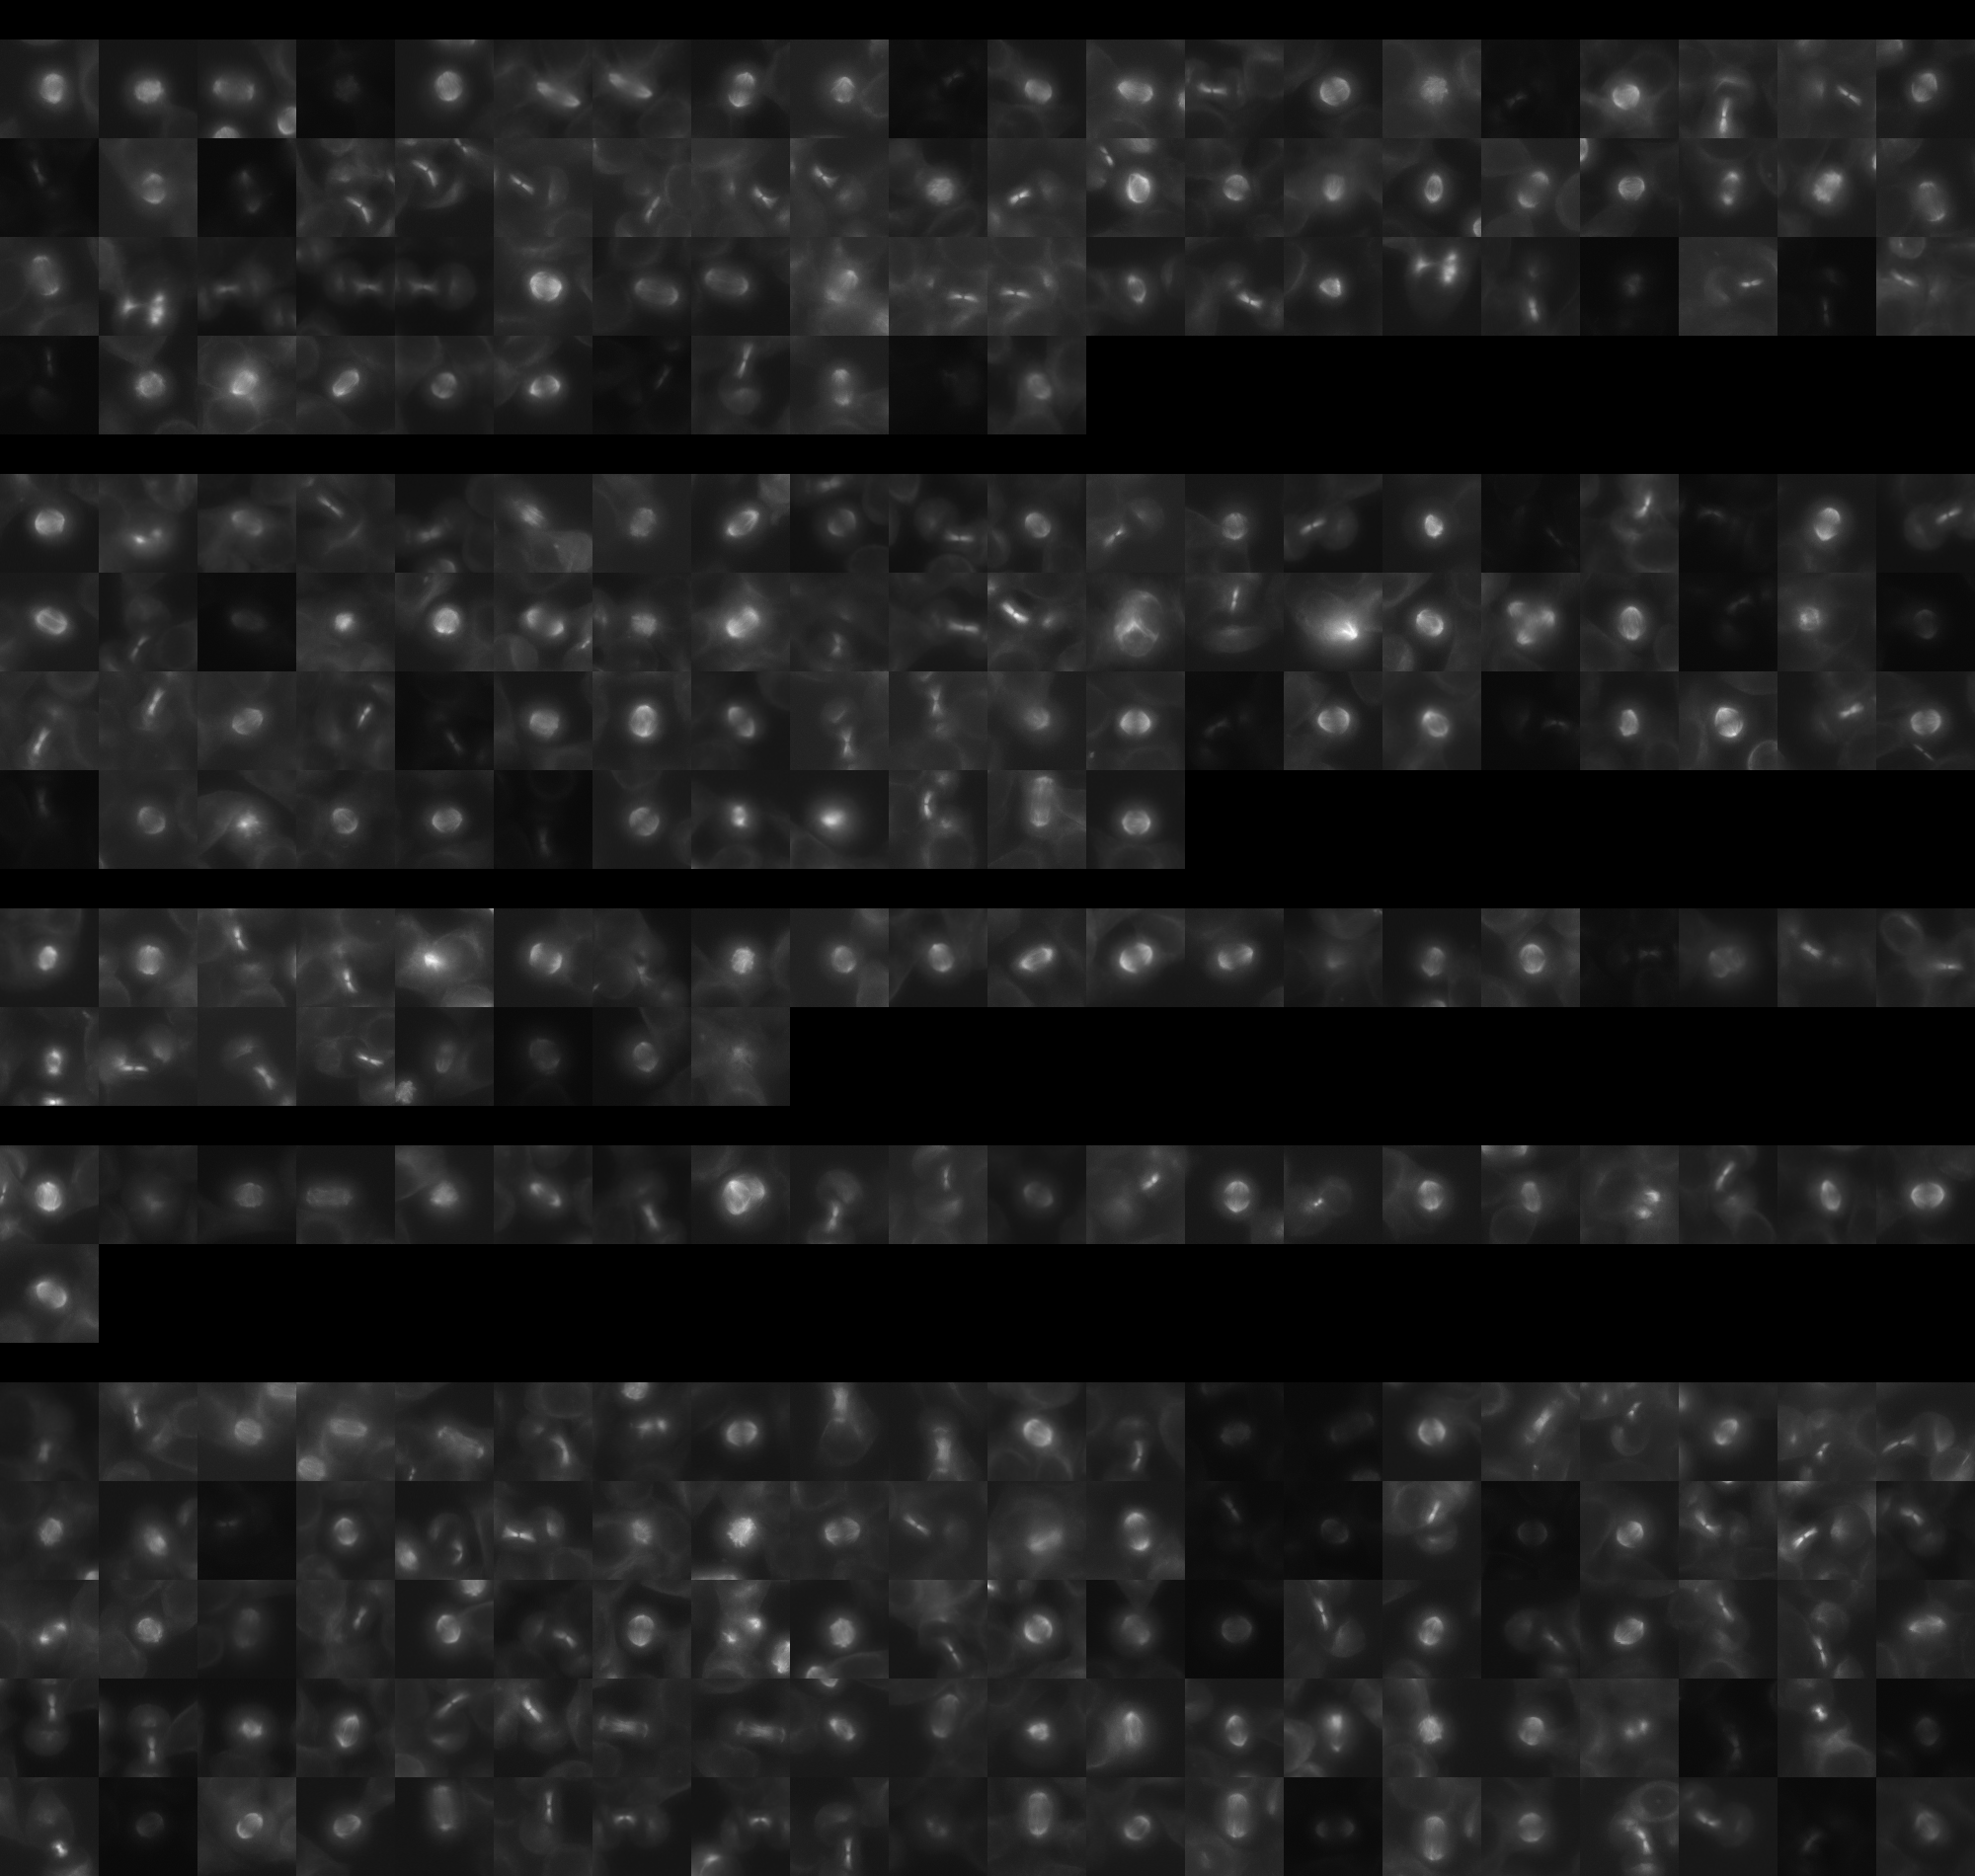
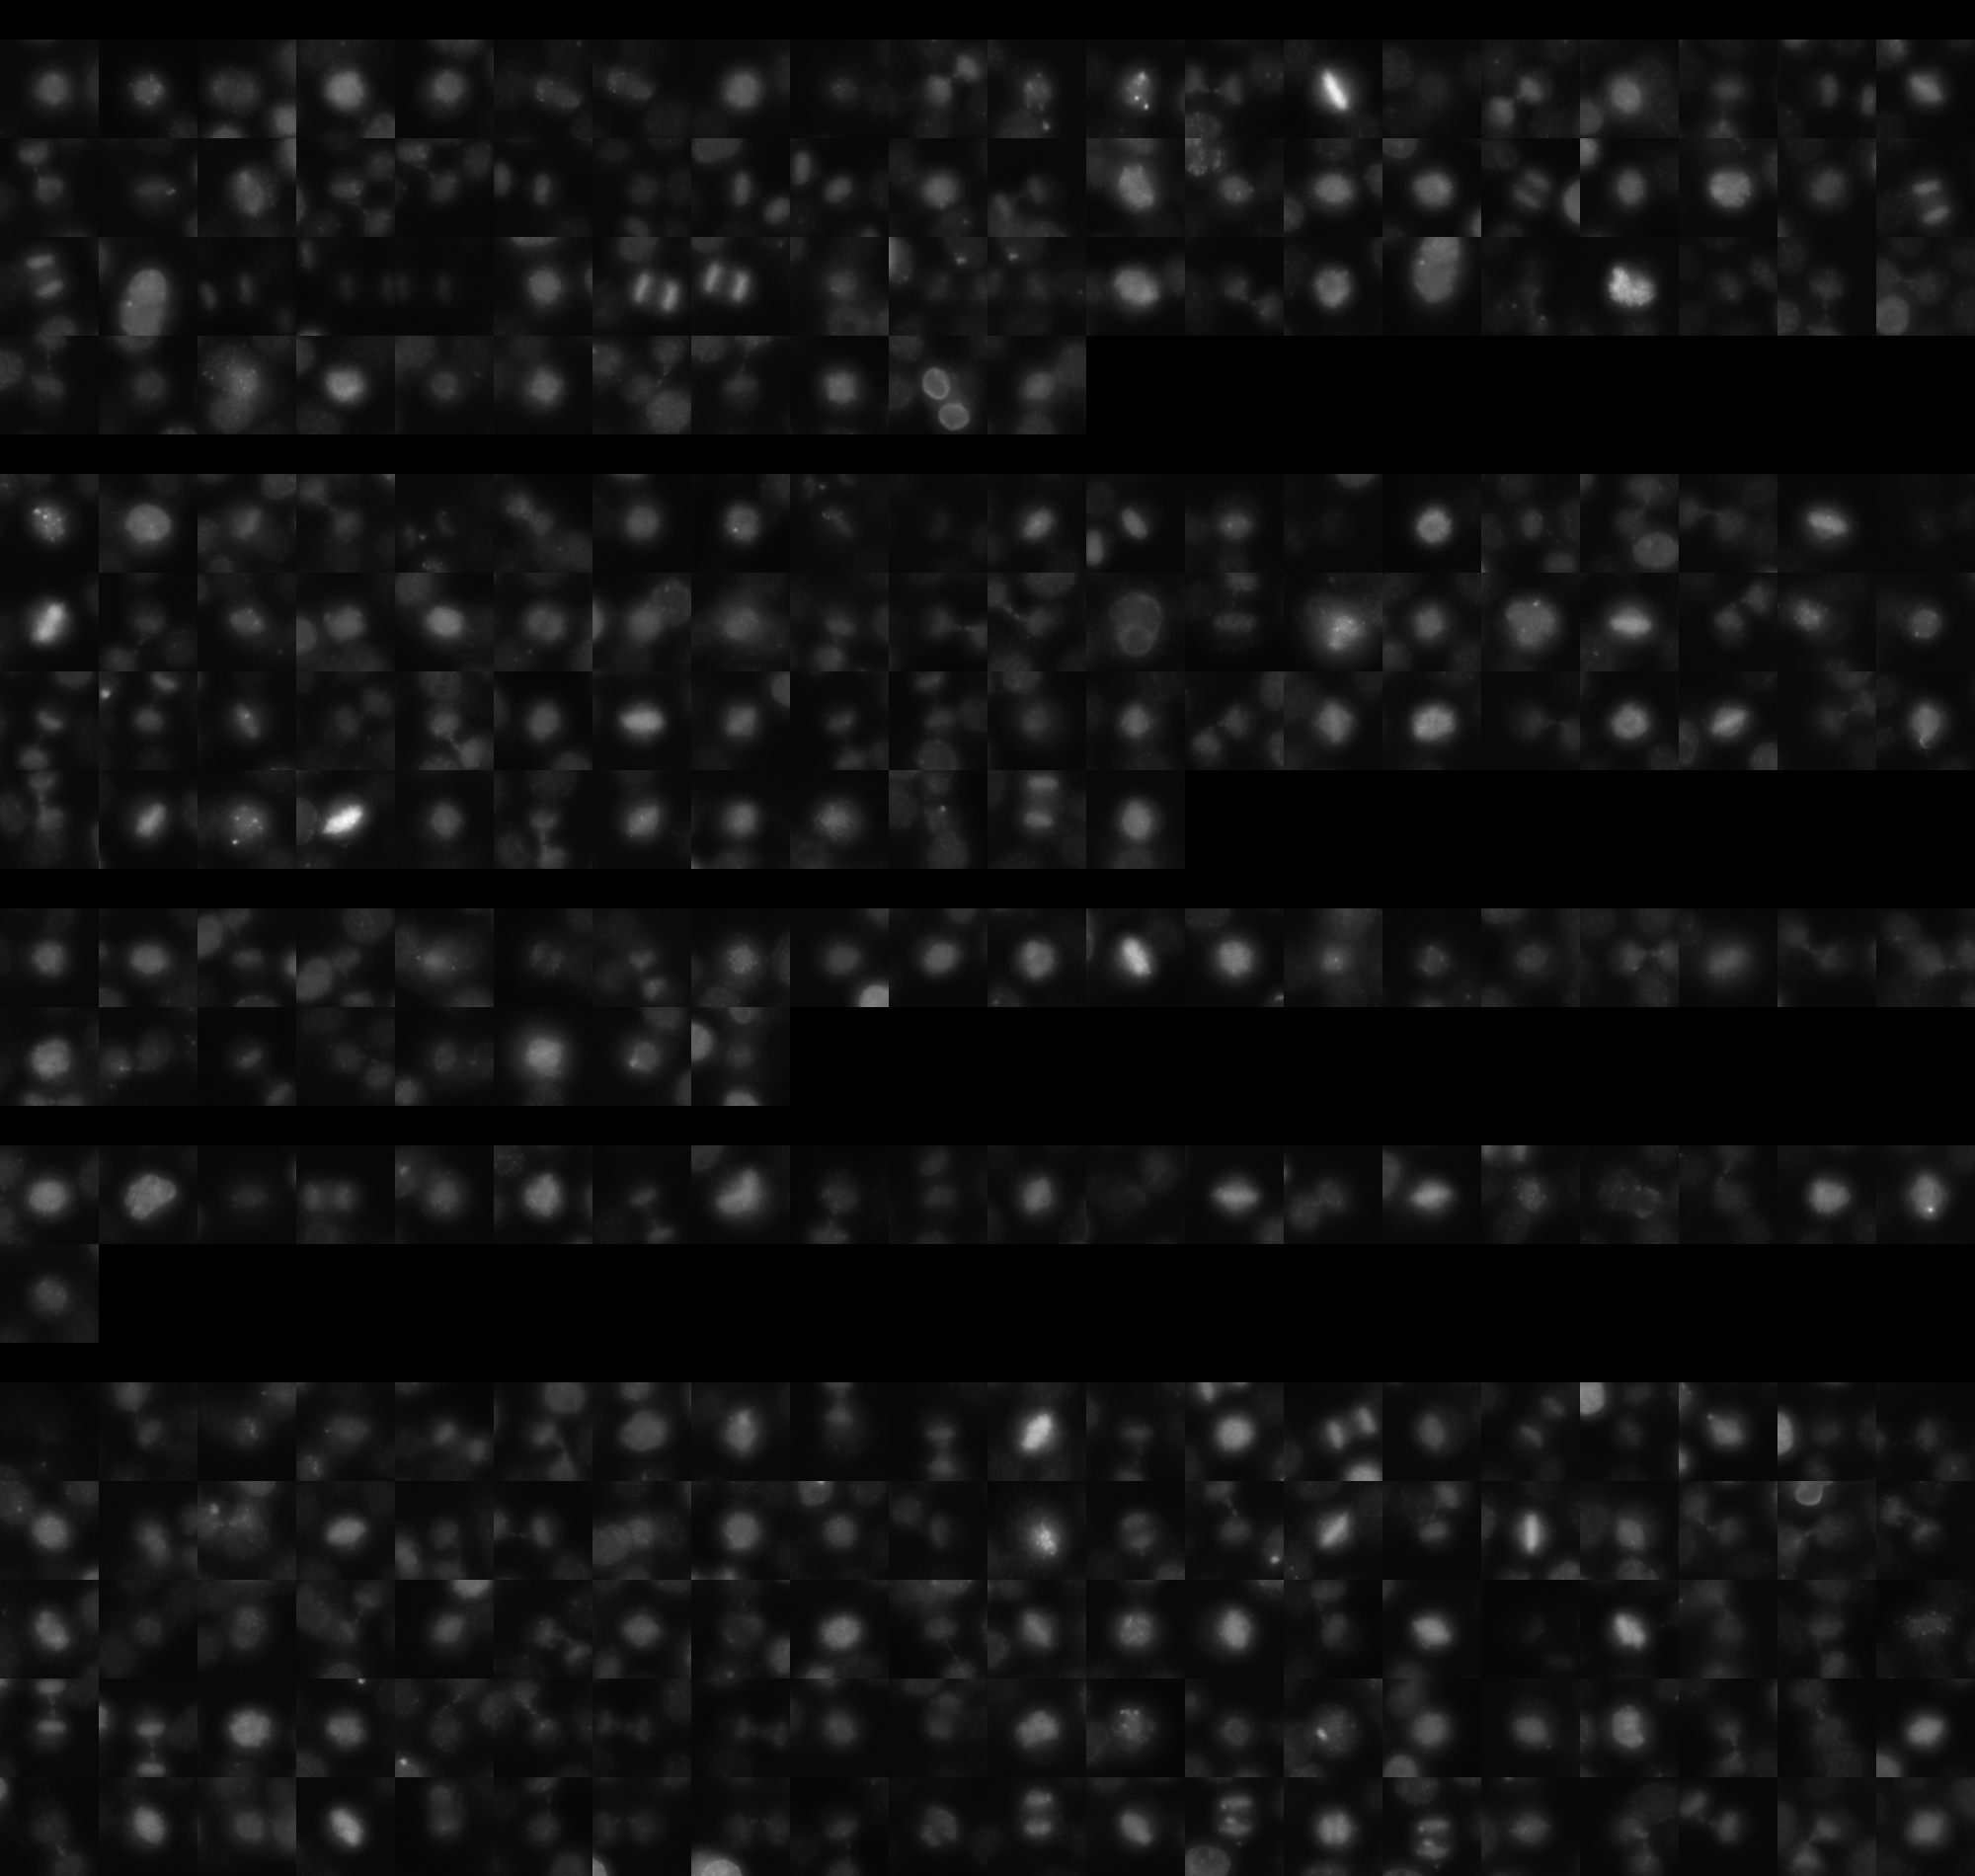
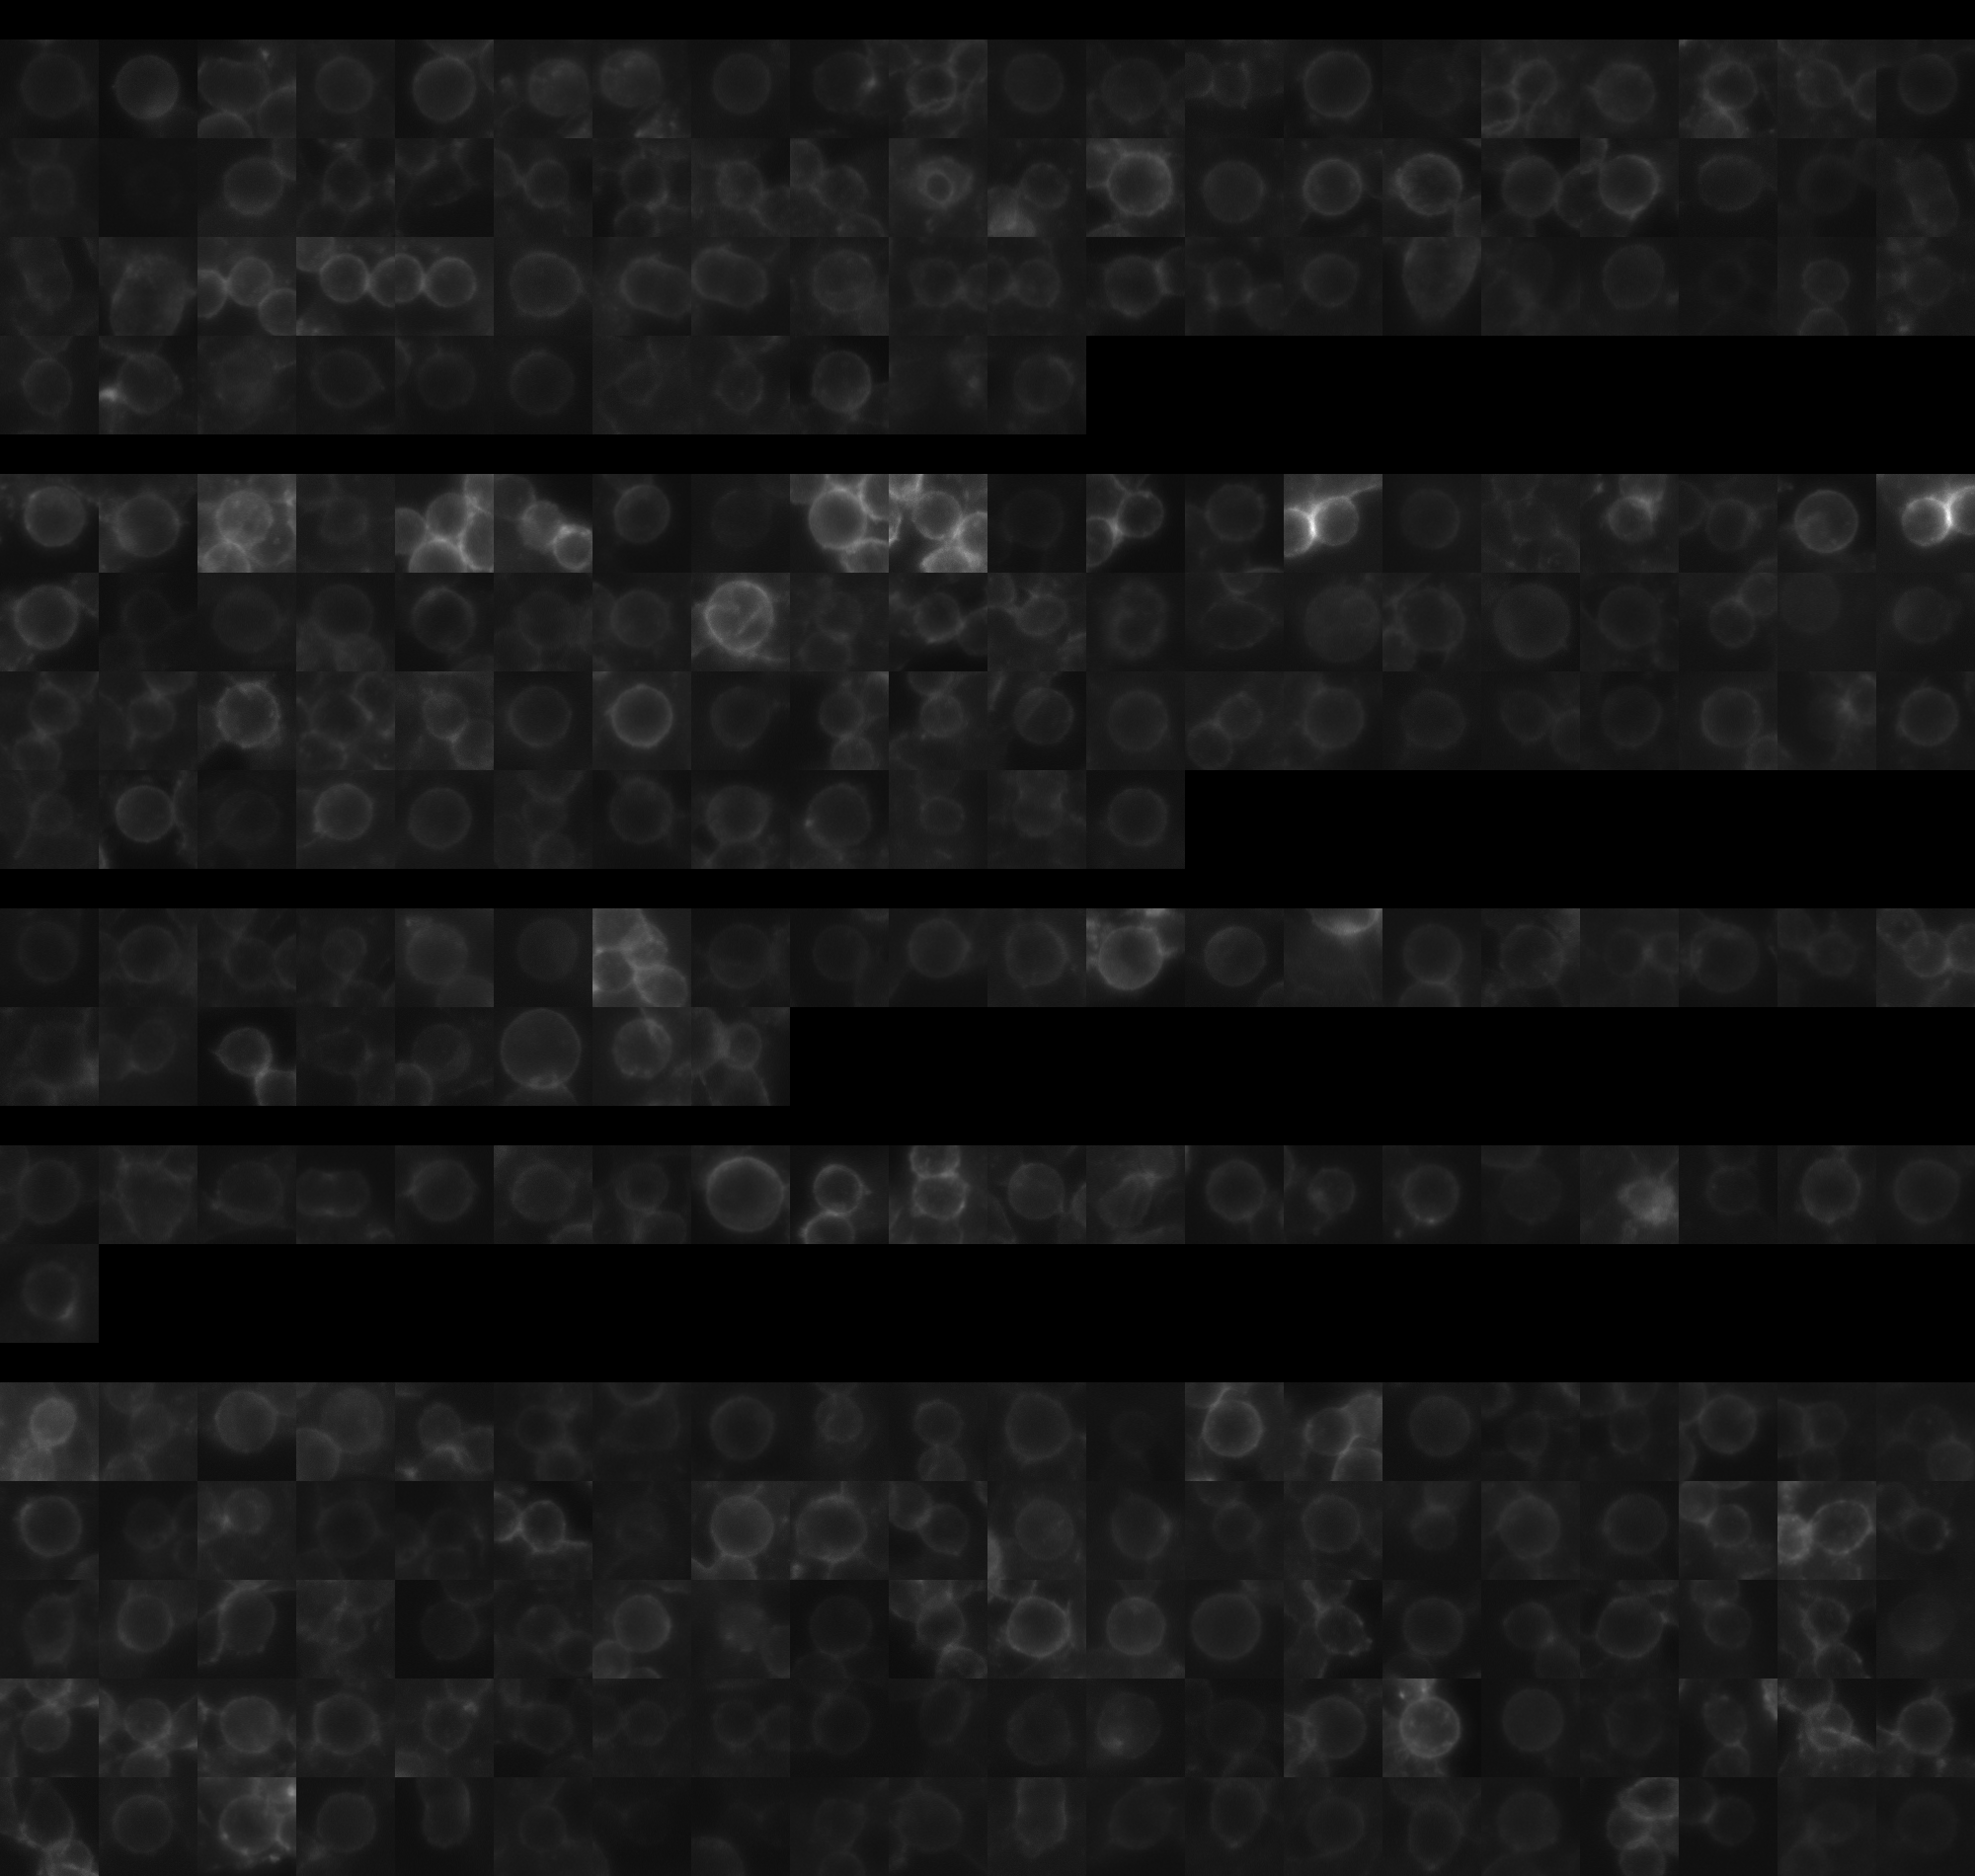
Each montage below shows randomly selected individual cell images for the same target gene separated by sgRNA, along with an example montage of cells expressing a non-targeting negative control sgRNA at the bottom. sgRNA labels in the montages correspond to the numbered sgRNA sequences in the gene info table above. The DNA (blue) and tubulin (green) channels are displayed by default, with gH2AX (grayscale) and actin (yellow) available using the check boxes. Channel brightness, contrast, and opacity are adjustable by clicking the arrow next to the channel name. When only one channel is selected, the display defaults to grayscale. Click the “Zoom” checkbox above the channel controls to enable image zooming (via scrolling) and panning (via click-and-drag).

The cell boxes displayed for this gene are square, 30.36 μm per side for the interphase montage and 30.36 μm per side for the mitotic montage.

Features

Interphase Score Rank FDR q-value
Nucleus DNA Integrated -3.898e-03 3306 of 5322 0.941
Nucleus DNA Mean -3.575e-03 2092 of 5322 0.981
Nucleus gH2AX Mean 0.076 2615 of 5322 0.047
Nucleus DNA - gH2AX Correlation -7.344e-02 3221 of 5322 0.008
Nucleus Shape Area 0.003 3206 of 5322 0.958
Nucleus Shape Eccentricity 0.033 1618 of 5322 0.404
Nucleus Shape Form Factor -4.568e-02 2462 of 5322 0.242
Nucleus Shape Solidity -5.726e-02 3042 of 5322 0.083
Cell DNA Mass Displacement 0.017 3228 of 5322 0.820
Cell Tubulin Mean 0.011 2336 of 5322 0.804
Cell Tubulin Mass Displacement 0.006 2646 of 5322 0.933
Cell Actin Mean -2.329e-02 3733 of 5322 0.715
Cell Tubulin - Actin Correlation -2.740e-02 4690 of 5322 0.552
Cell DNA - Tubulin Correlation 0.009 3453 of 5322 0.855
Cell Shape Area 0.008 2930 of 5322 0.988
Cell Shape Eccentricity 0.043 790 of 5322 0.424
Mitotic Score Rank FDR q-value
Nucleus DNA Integrated -3.933e-02 4343 of 5322 0.984
Nucleus DNA Mean 0.096 1523 of 5322 1.000
Nucleus DNA Mass Displacement 0.097 1956 of 5322 0.999
Nucleus DNA Mean Frac 3 0.228 442 of 5322 1.000
Nucleus gH2AX Mean 0.144 1179 of 5322 1.000
Nucleus gH2AX Mean Frac 0 -2.772e-01 5136 of 5322 1.000
Nucleus Tubulin Mean Frac 0 -8.715e-02 4578 of 5322 0.999
Nucleus Tubulin Mean Edge 0.118 1627 of 5322 0.999
Nucleus Tubulin Std Edge -9.573e-02 3843 of 5322 0.999
Nucleus Shape Area 0.099 2699 of 5322 0.989
Nucleus Shape Eccentricity 0.053 1338 of 5322 1.000
Nucleus Shape Form Factor 0.022 1106 of 5322 0.998
Cell Tubulin Mean 0.081 2322 of 5322 0.997
Cell Tubulin Mean Frac 3 -1.050e-01 2991 of 5322 0.999
Cell Actin Mean 0.031 2790 of 5322 0.997
Cell Shape Area 0.014 3727 of 5322 0.999
( Reset Zoom )
Brightness
Contrast
Opacity
Brightness
Contrast
Opacity
Brightness
Contrast
Opacity
Brightness
Contrast
Opacity
Brightness
Contrast
Opacity

( Reset Zoom )
Brightness
Contrast
Opacity
Brightness
Contrast
Opacity
Brightness
Contrast
Opacity
Brightness
Contrast
Opacity
Brightness
Contrast
Opacity

MIT Central Accessability