GGCX

Gene symbol: GGCX
Gene: 2677
Uniprot Function: Mediates the vitamin K-dependent carboxylation of glutamate residues to calcium-binding gamma-carboxyglutamate (Gla) residues with the concomitant conversion of the reduced hydroquinone form of vitamin K to vitamin K epoxide.
Mitotic Index 0.0306
Interphase Cluster: #12 (43 genes)
Mitotic Cluster: #18 (40 genes)
sgRNA 1: GCCAGTGCGGCCATCACGGT (interphase cells: 1046, mitotic cells: 36)
sgRNA 2: GCCTGCACGATGTCCACACG (interphase cells: 1459, mitotic cells: 56)
sgRNA 3: GTCCGTTGGTCGATTCAGCA (interphase cells: 425, mitotic cells: 8)
sgRNA 4: TGTGTGTATAAGAGGAGCCG (interphase cells: 676, mitotic cells: 14)

Interphase Cluster

Mitotic Cluster

Overview

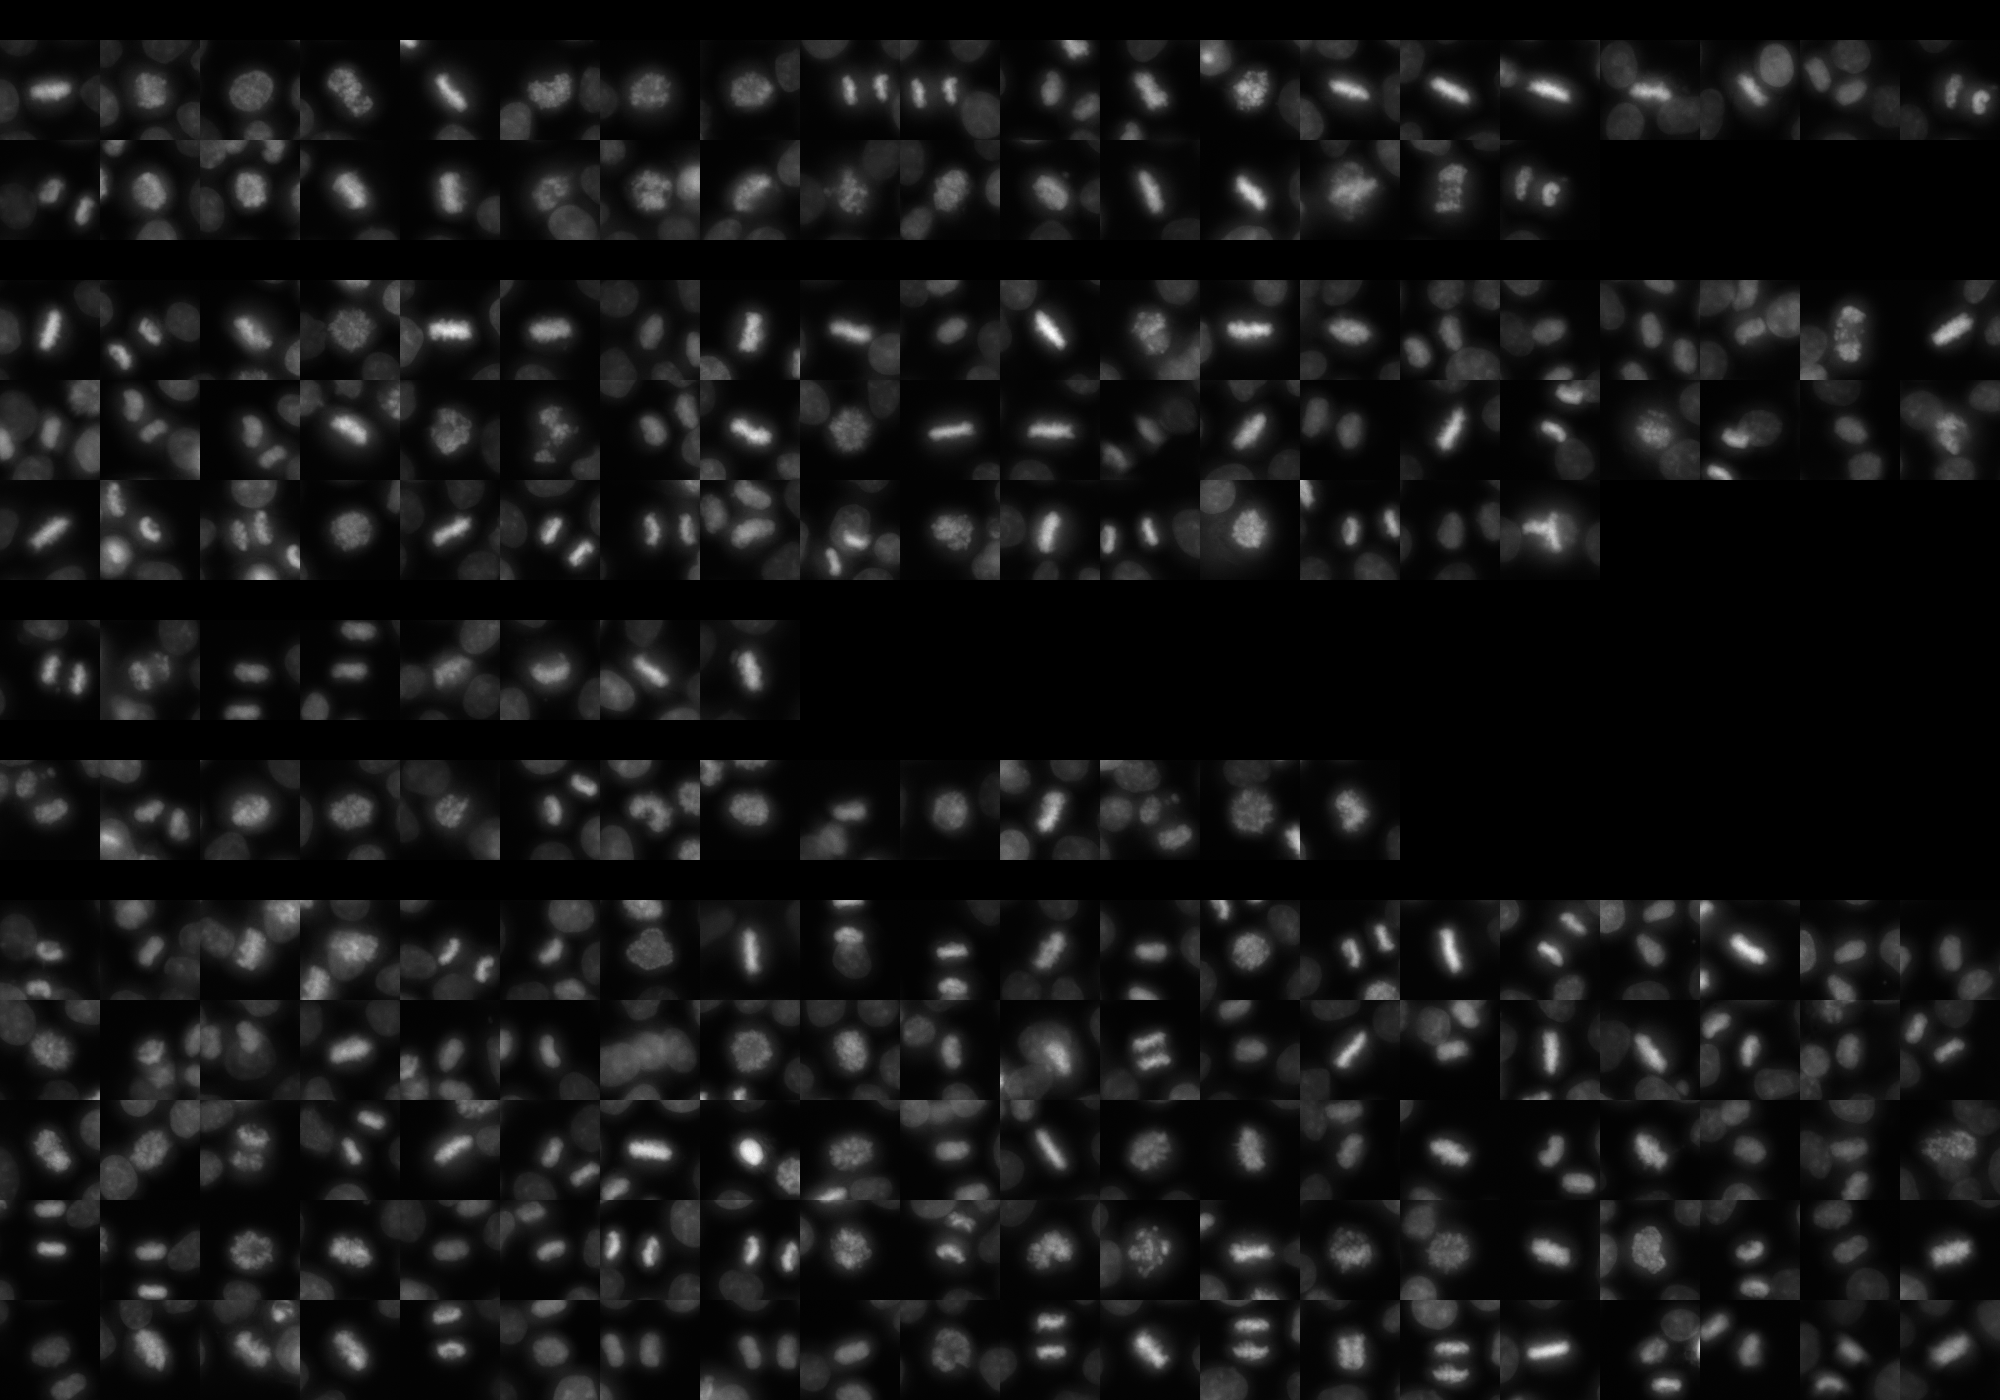
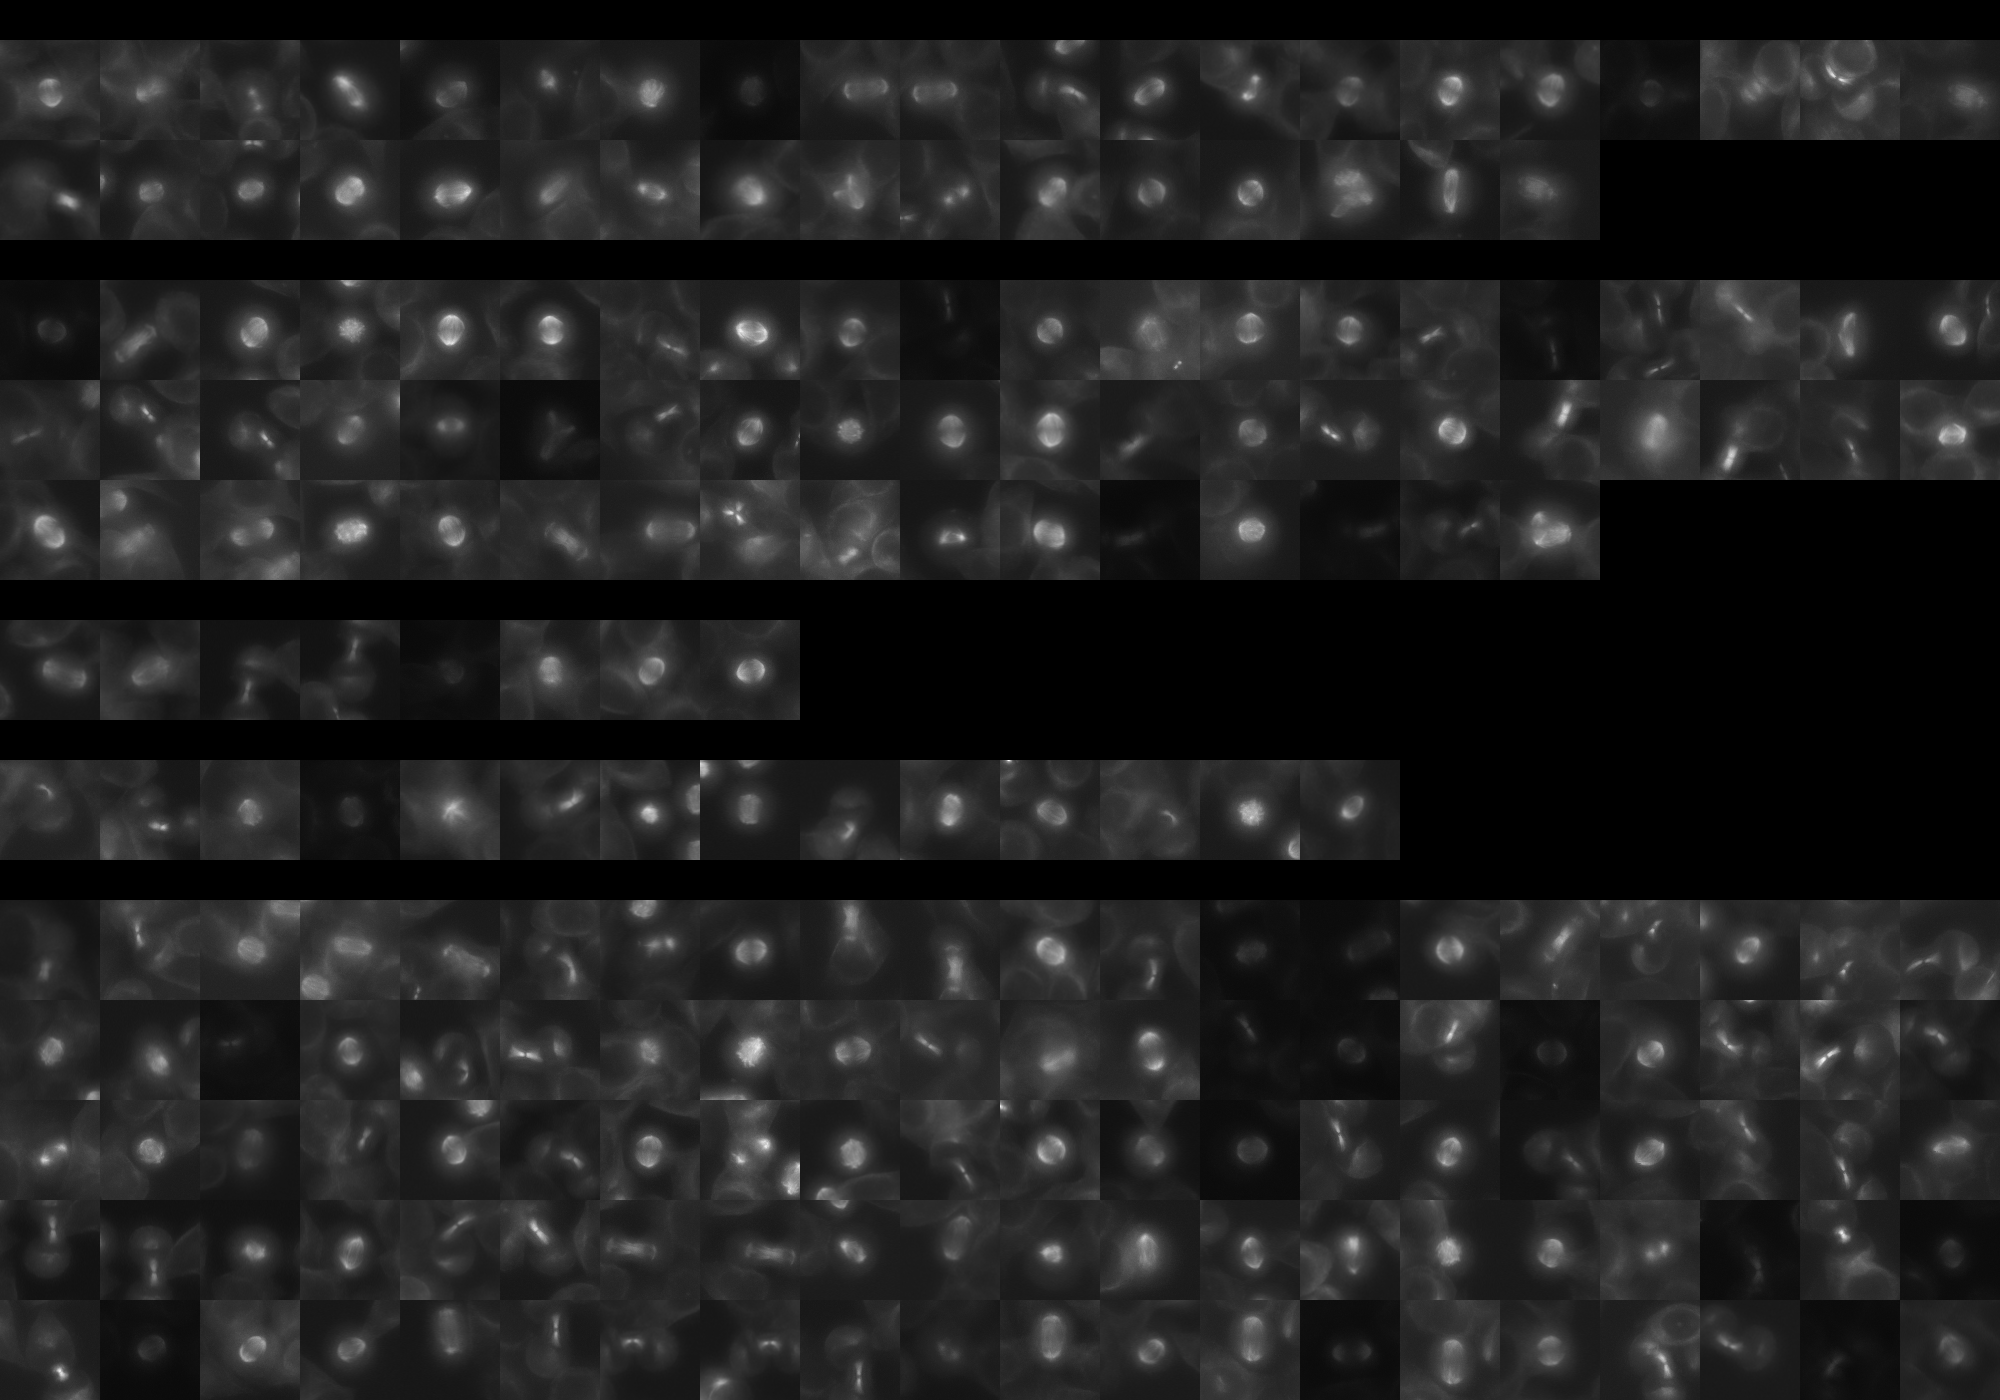
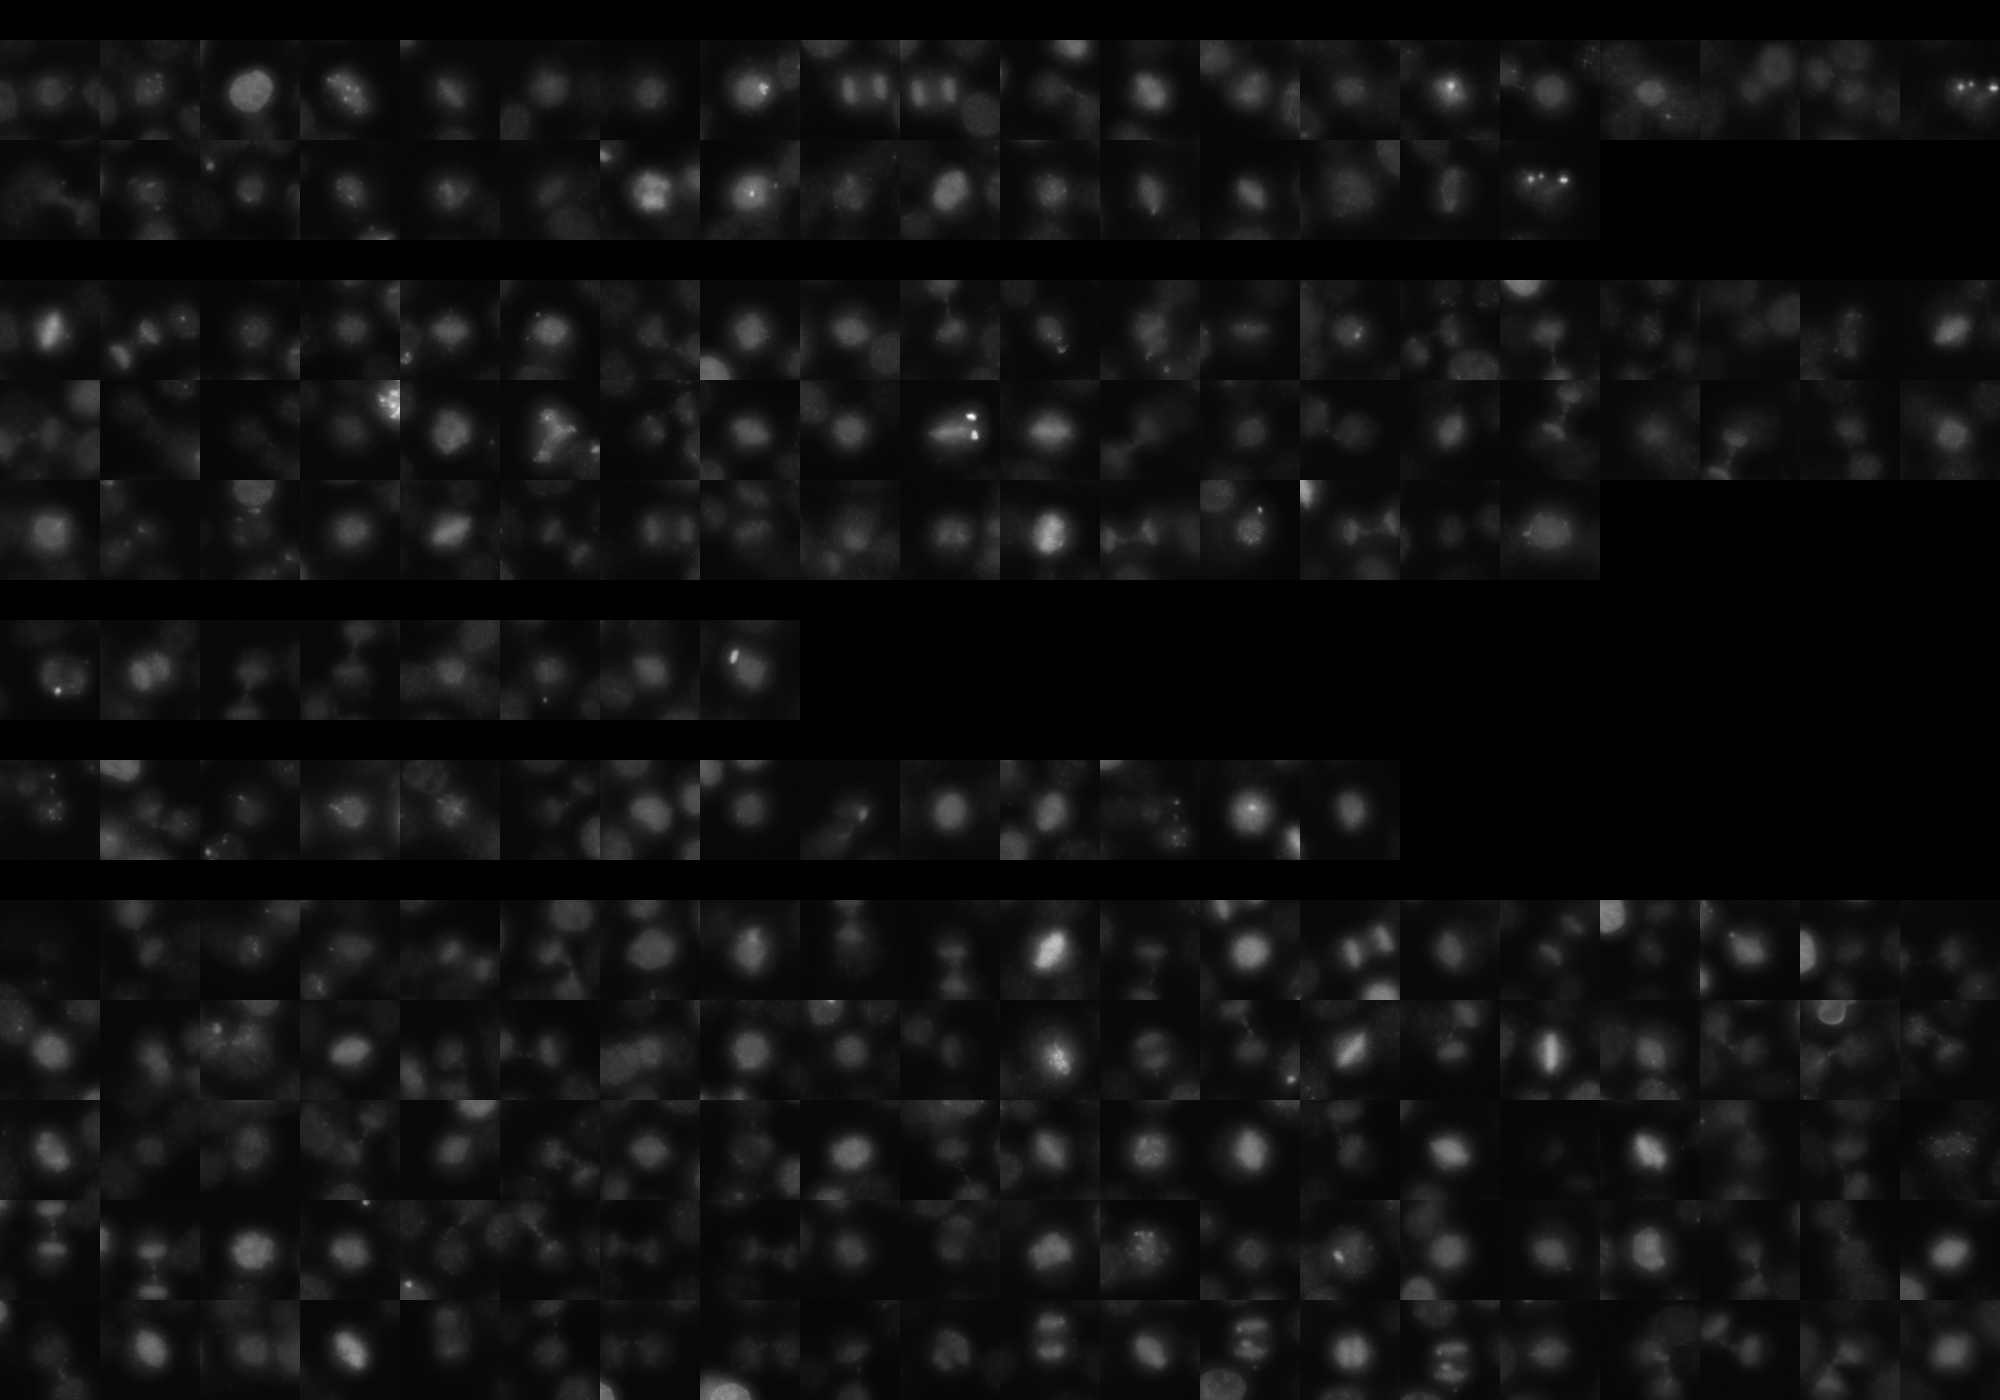
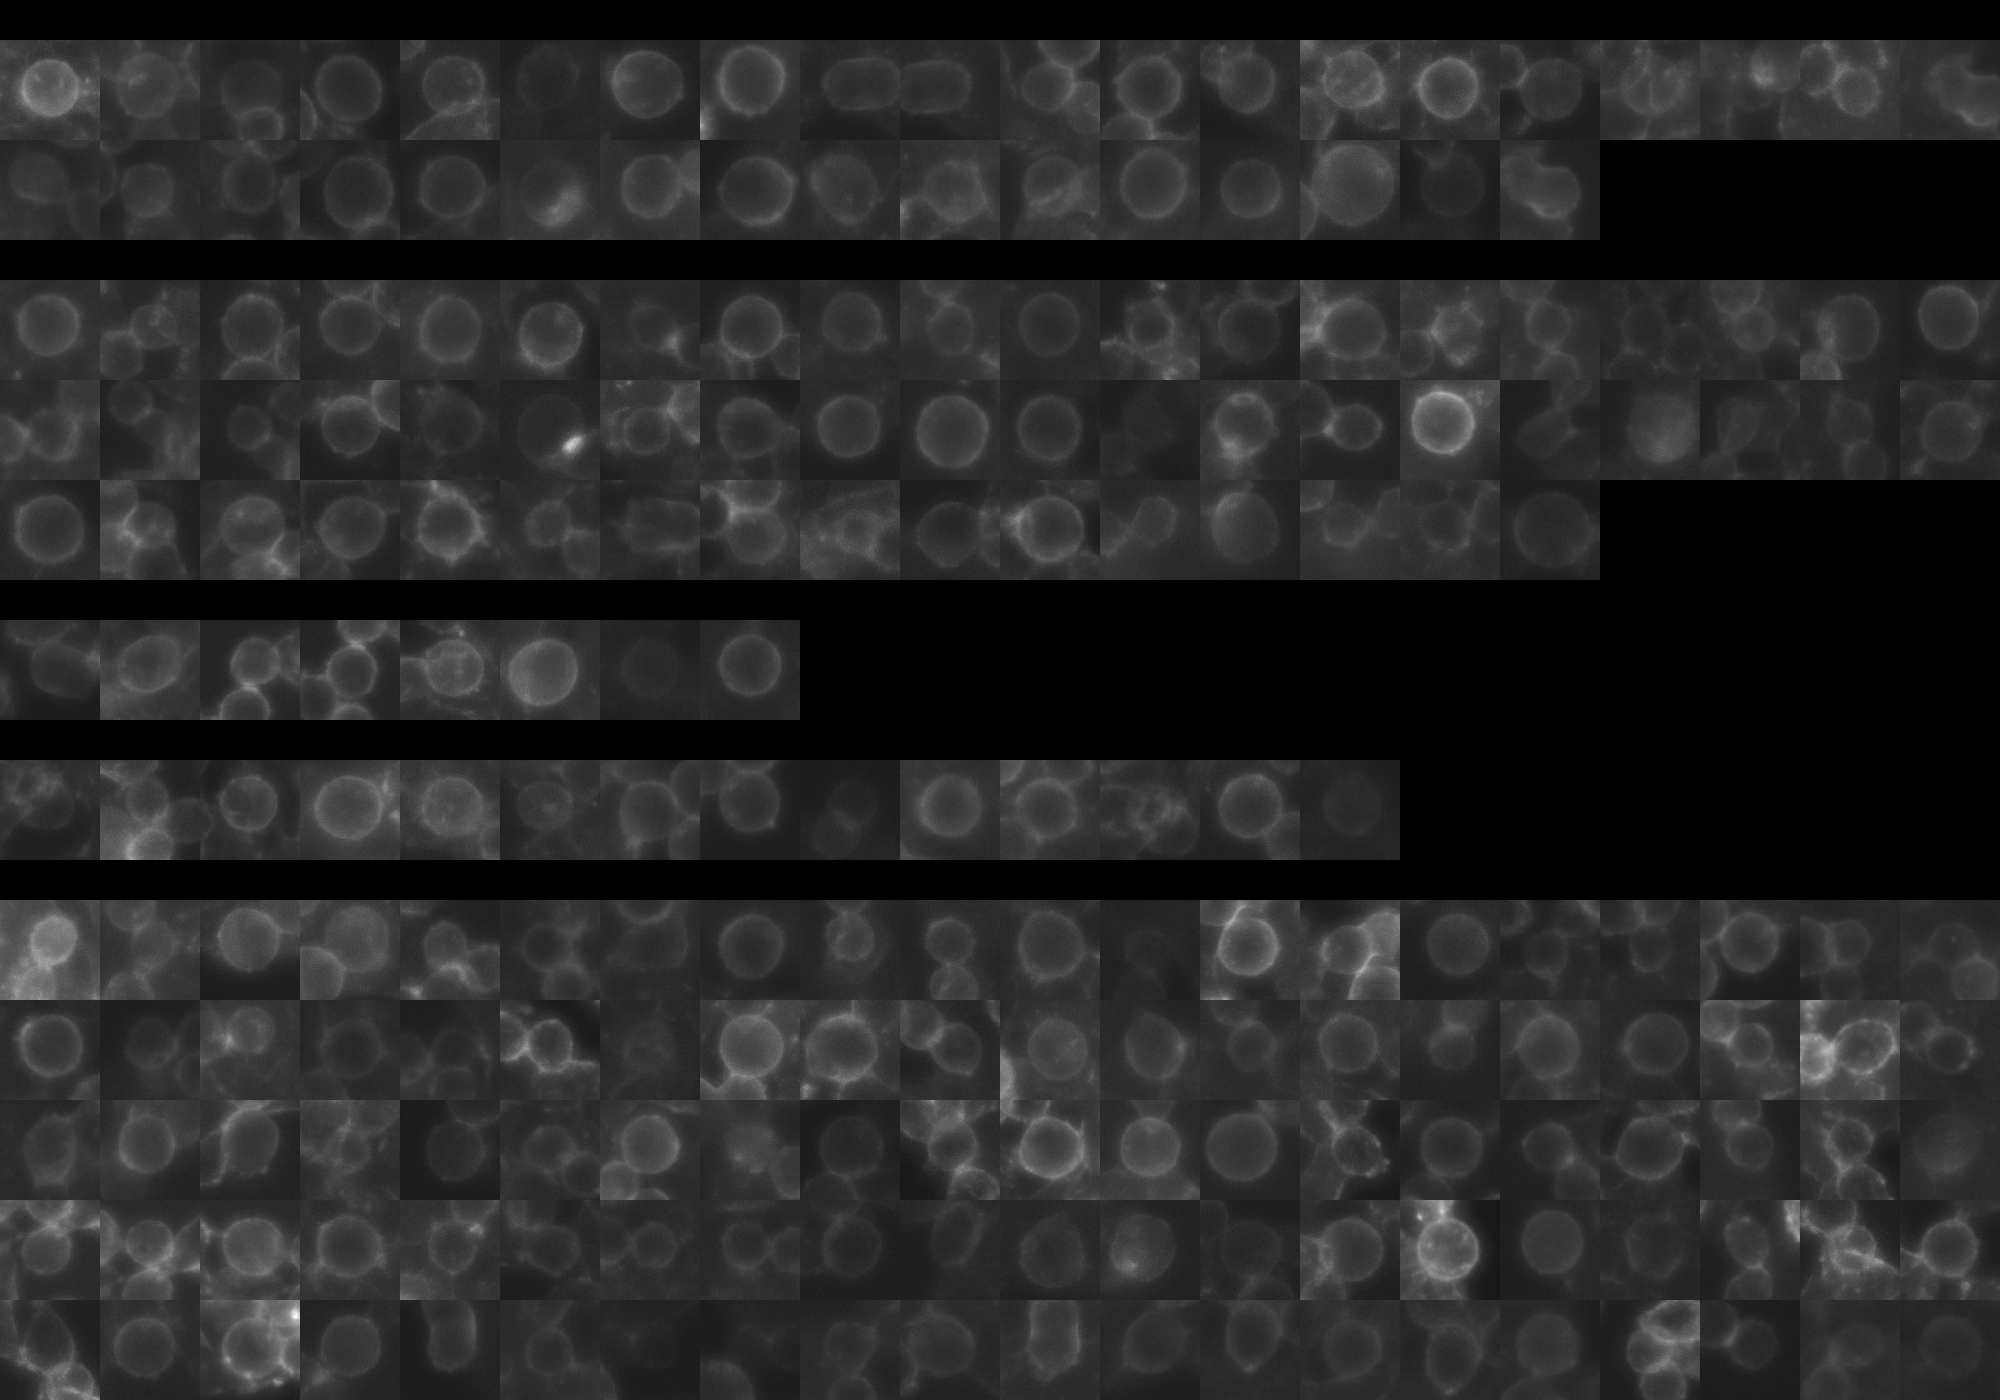
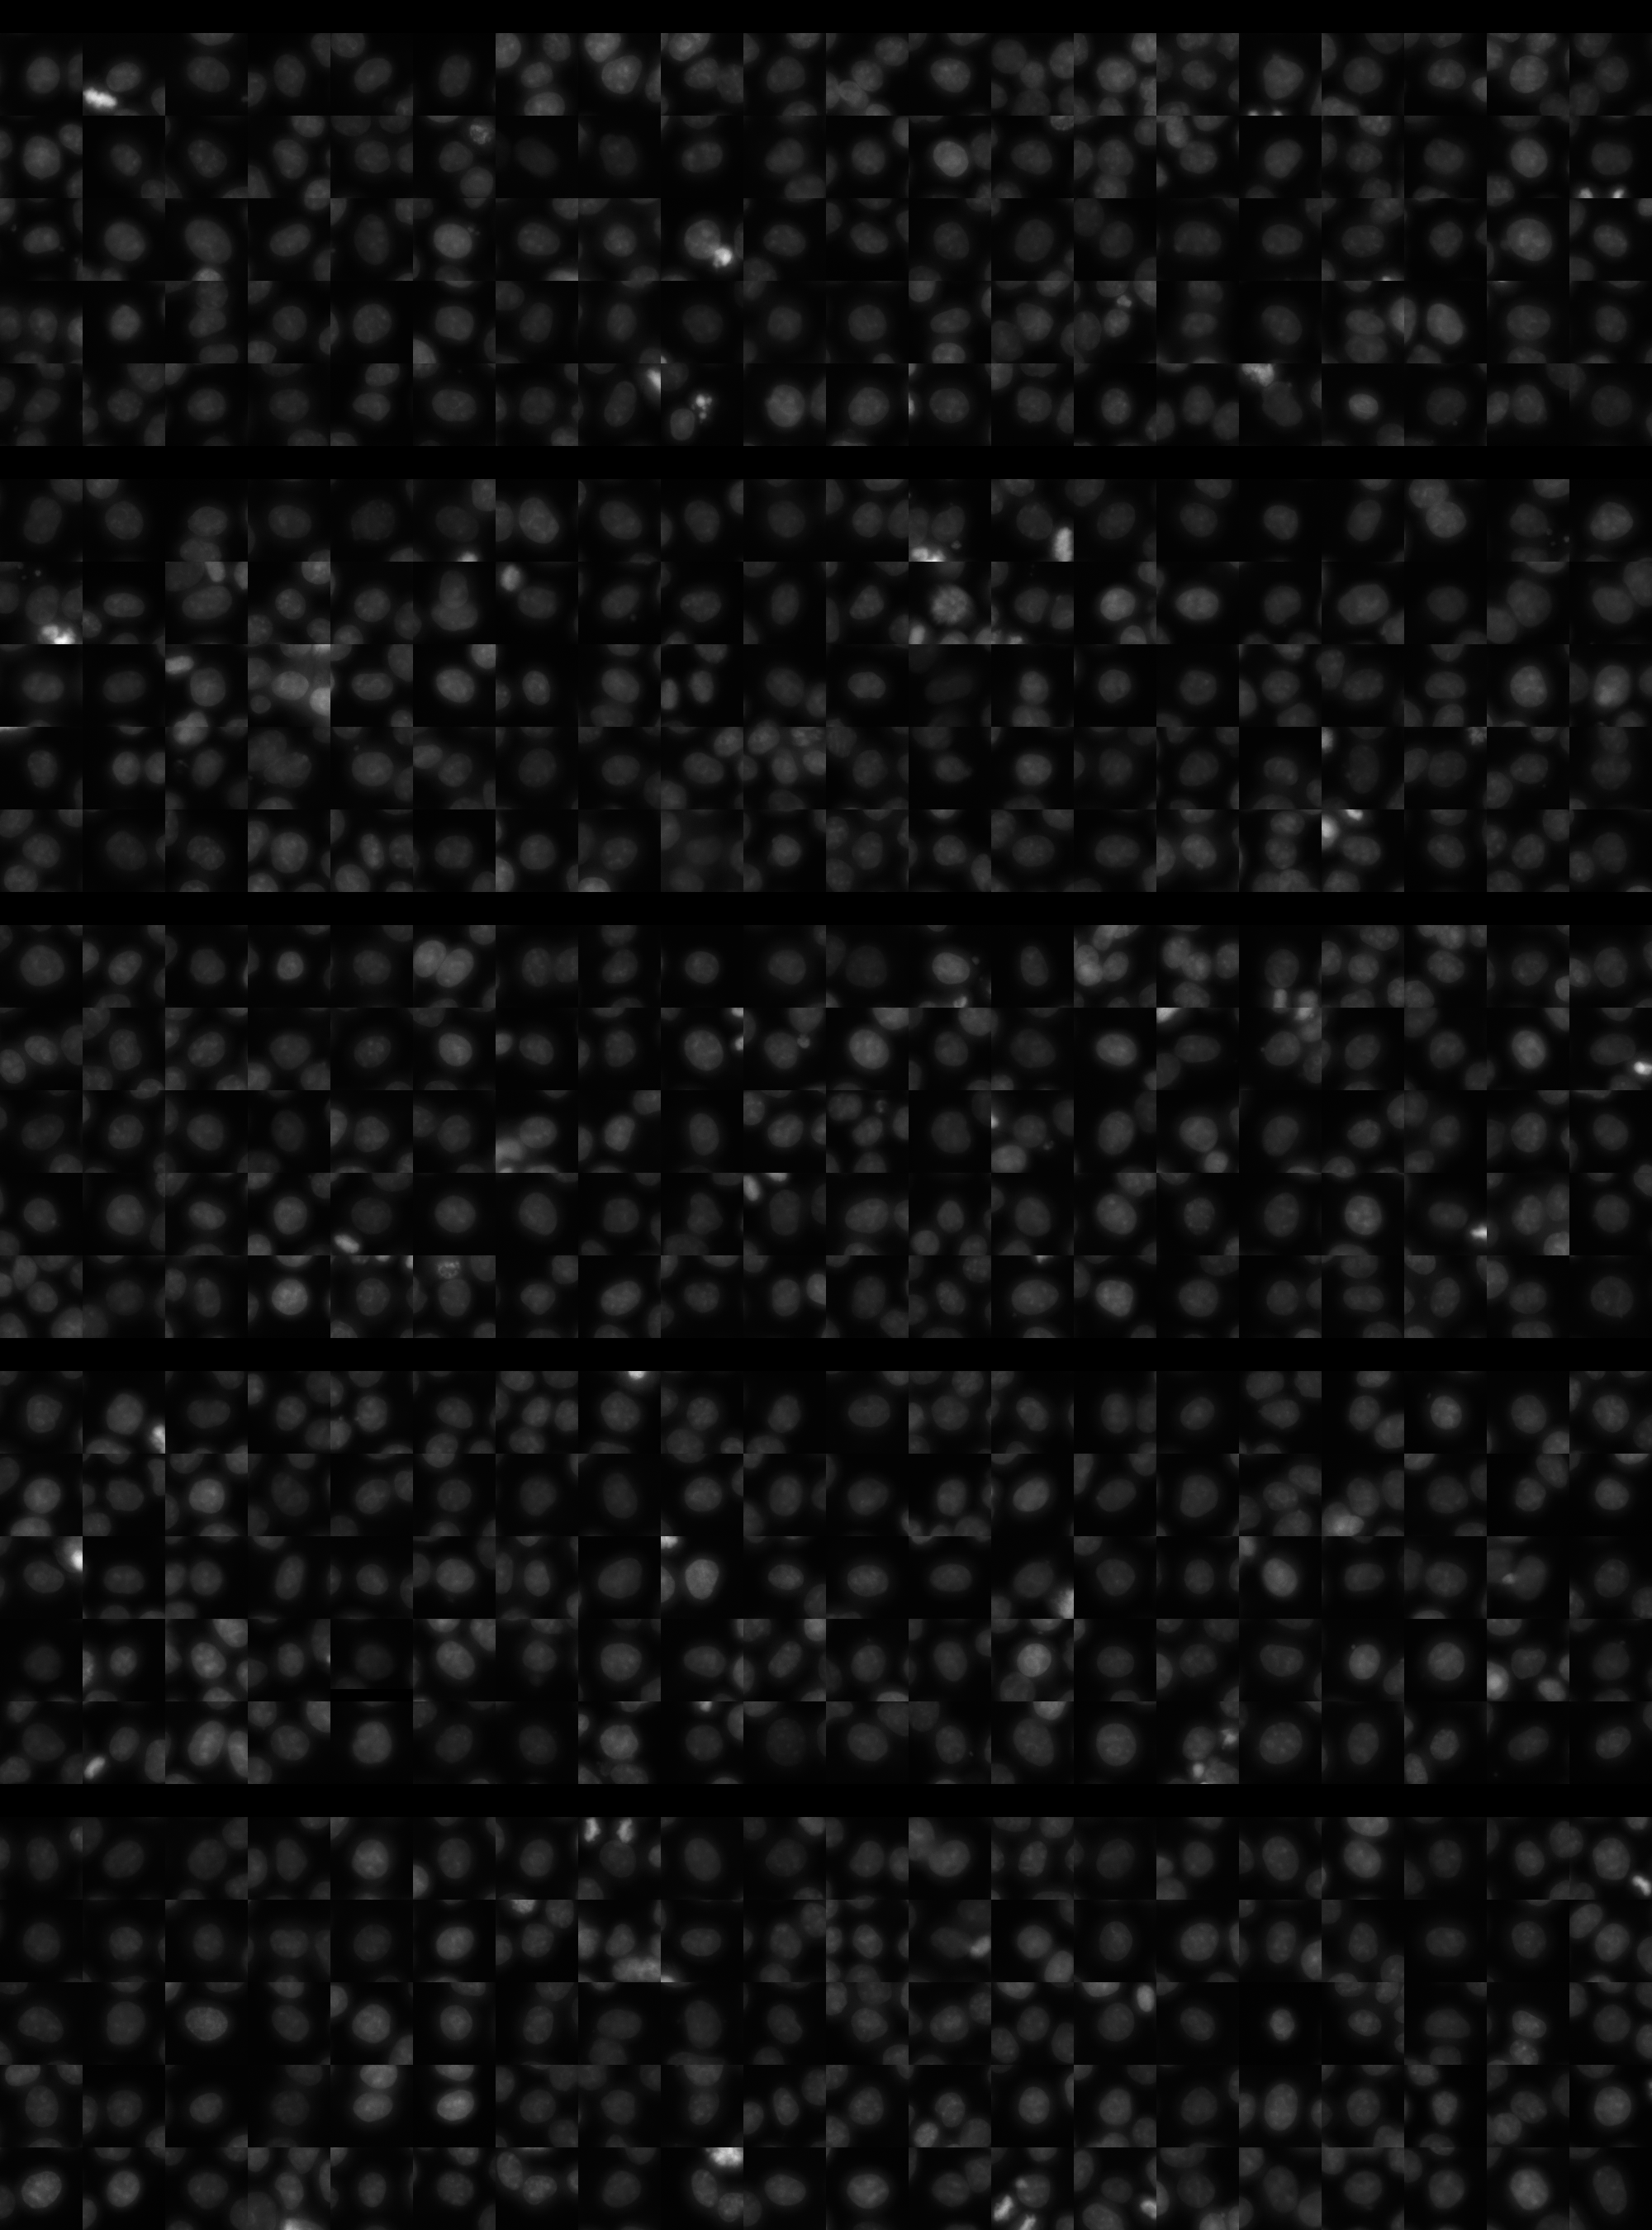
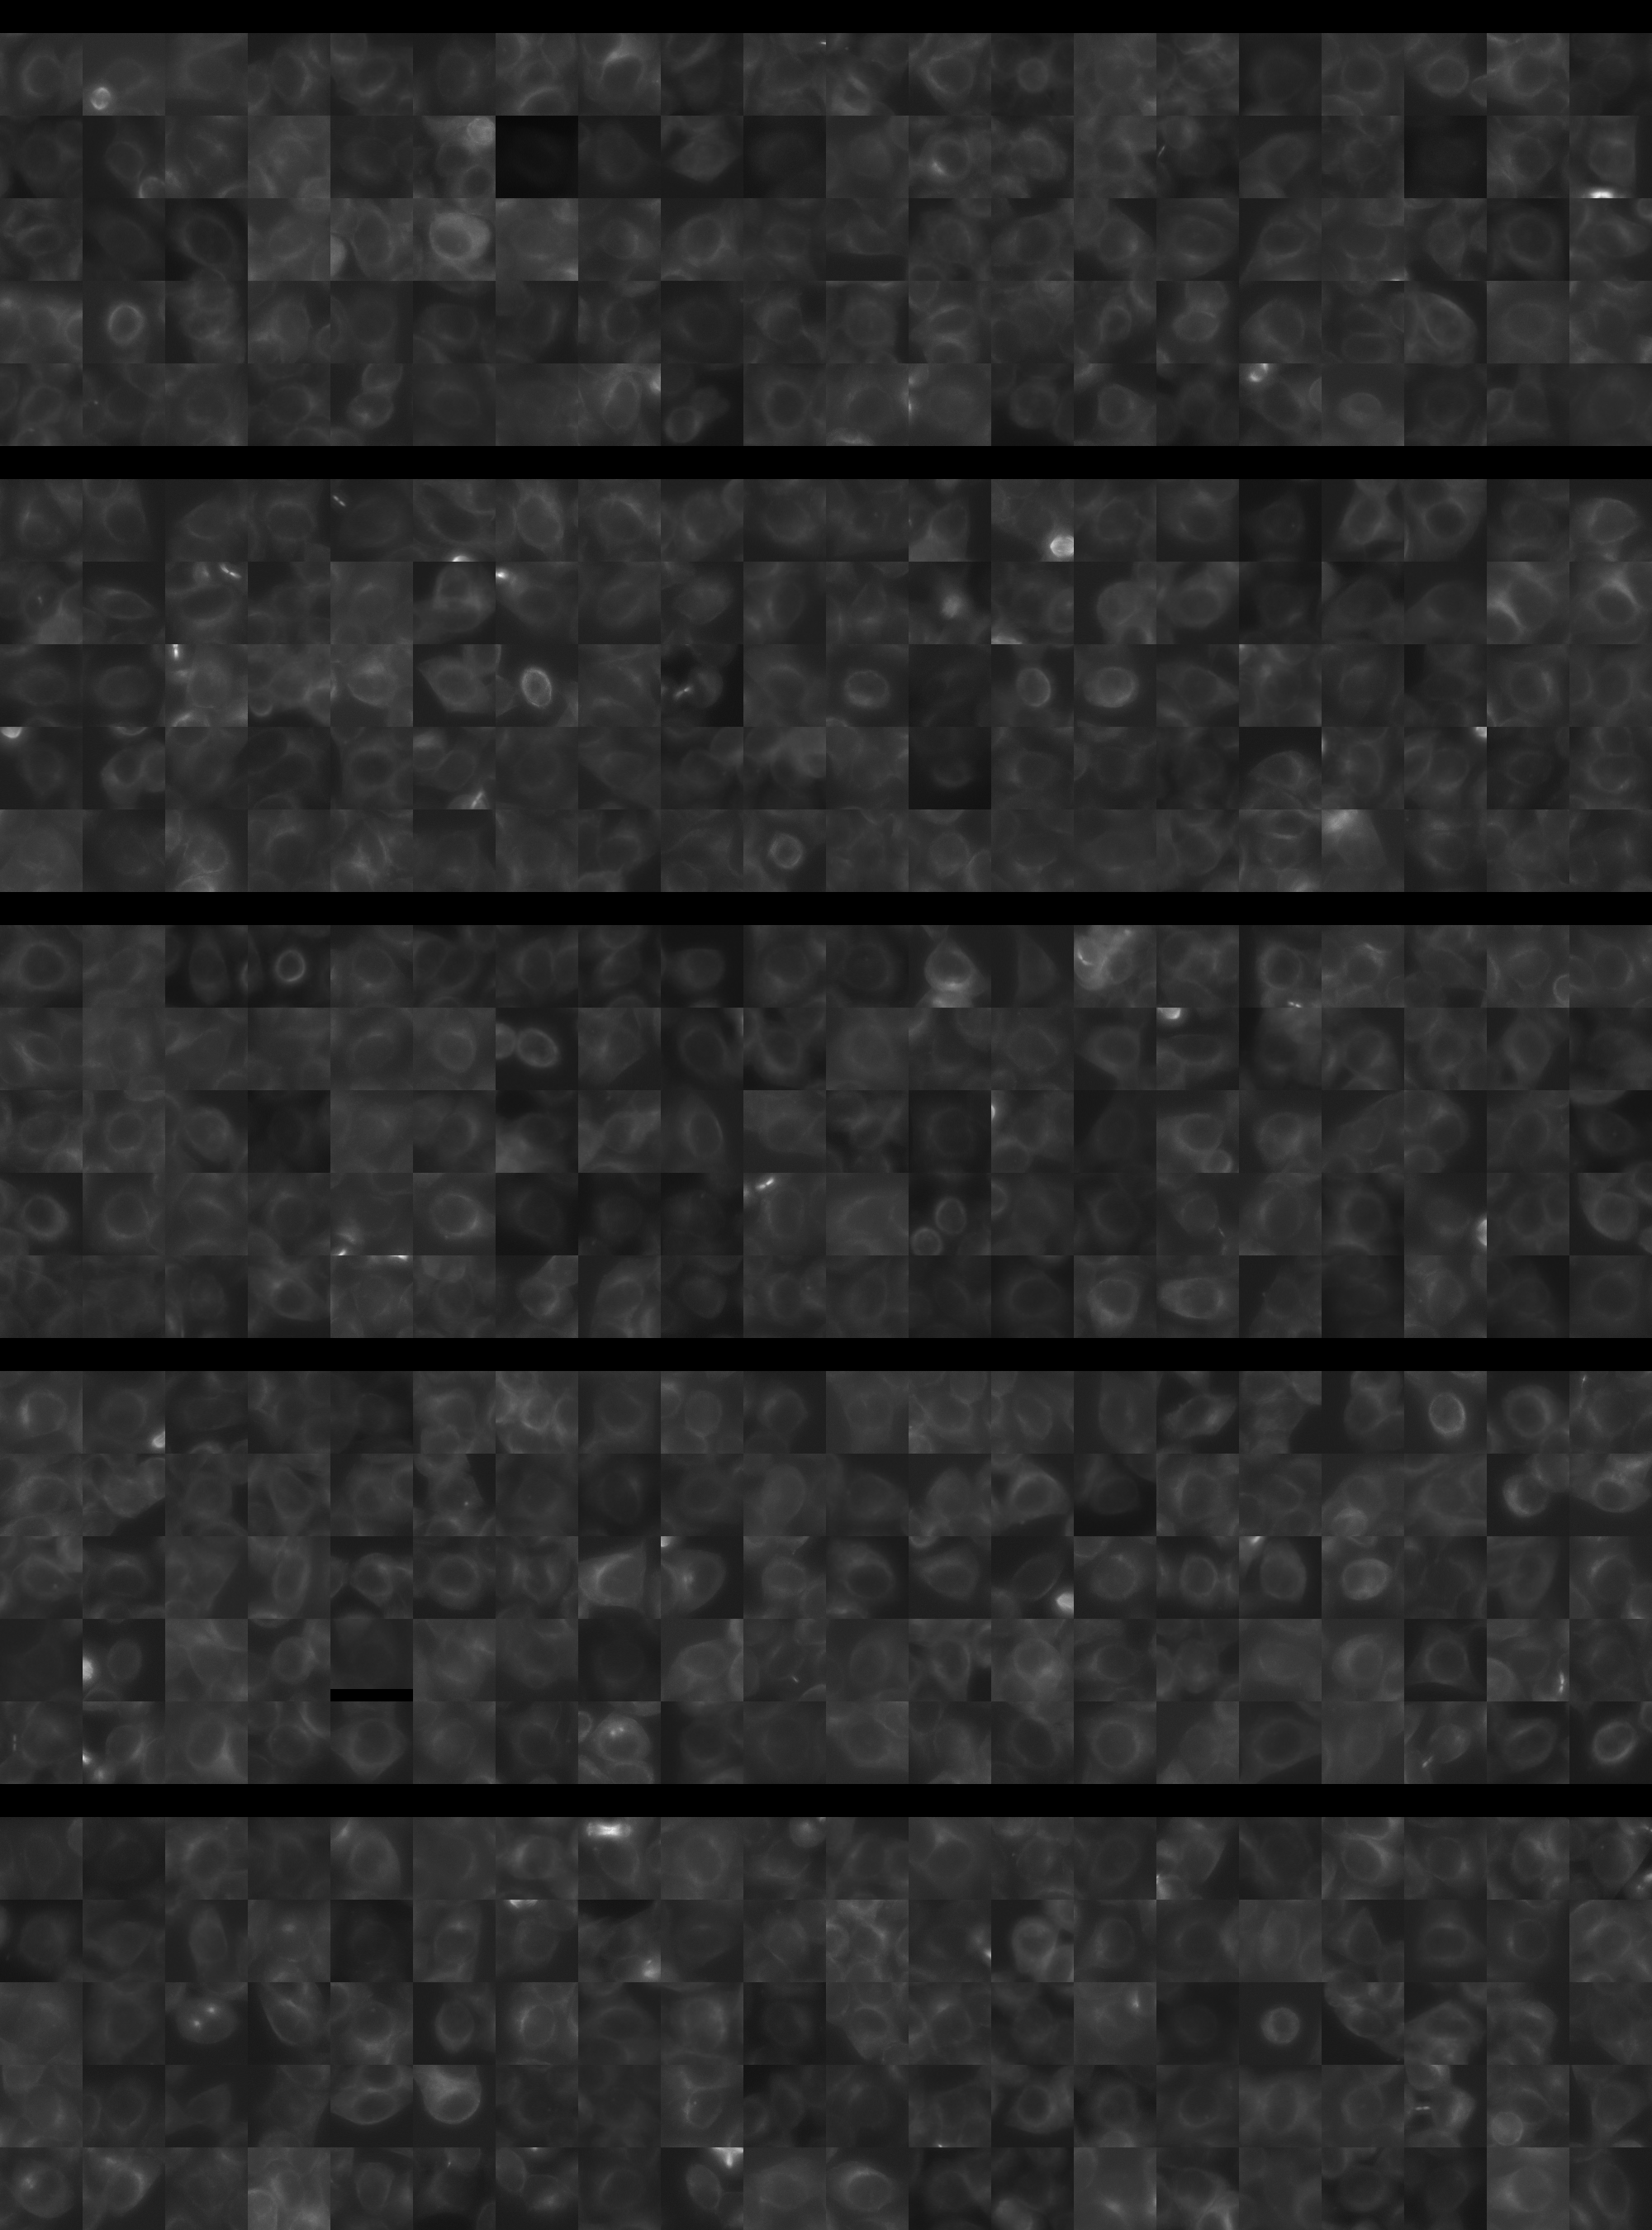
Each montage below shows randomly selected individual cell images for the same target gene separated by sgRNA, along with an example montage of cells expressing a non-targeting negative control sgRNA at the bottom. sgRNA labels in the montages correspond to the numbered sgRNA sequences in the gene info table above. The DNA (blue) and tubulin (green) channels are displayed by default, with gH2AX (grayscale) and actin (yellow) available using the check boxes. Channel brightness, contrast, and opacity are adjustable by clicking the arrow next to the channel name. When only one channel is selected, the display defaults to grayscale. Click the “Zoom” checkbox above the channel controls to enable image zooming (via scrolling) and panning (via click-and-drag).

The cell boxes displayed for this gene are square, 30.36 μm per side for the interphase montage and 30.36 μm per side for the mitotic montage.
Features

Interphase Score Rank FDR q-value
Nucleus DNA Integrated 0.019 2201 of 5322 0.866
Nucleus DNA Mean 0.020 1374 of 5322 0.681
Nucleus gH2AX Mean 0.111 1688 of 5322 0.019
Nucleus DNA - gH2AX Correlation -7.419e-02 3242 of 5322 0.030
Nucleus Shape Area -2.958e-02 4118 of 5322 0.552
Nucleus Shape Eccentricity 0.014 2584 of 5322 0.811
Nucleus Shape Form Factor -8.042e-02 3920 of 5322 0.072
Nucleus Shape Solidity -1.003e-01 4282 of 5322 0.011
Cell DNA Mass Displacement 0.029 2343 of 5322 0.711
Cell Tubulin Mean 0.015 2150 of 5322 0.784
Cell Tubulin Mass Displacement -6.272e-02 4939 of 5322 0.210
Cell Actin Mean 0.072 1150 of 5322 0.173
Cell Tubulin - Actin Correlation 0.078 805 of 5322 0.092
Cell DNA - Tubulin Correlation 0.016 3205 of 5322 0.792
Cell Shape Area -5.050e-02 4378 of 5322 0.295
Cell Shape Eccentricity 0.014 2573 of 5322 0.908
Mitotic Score Rank FDR q-value
Nucleus DNA Integrated -8.698e-02 4698 of 5322 0.965
Nucleus DNA Mean -9.183e-03 3088 of 5322 1.000
Nucleus DNA Mass Displacement -1.261e-01 4894 of 5322 0.999
Nucleus DNA Mean Frac 3 -4.258e-02 3744 of 5322 1.000
Nucleus gH2AX Mean -1.407e-01 4576 of 5322 1.000
Nucleus gH2AX Mean Frac 0 -2.587e-01 5064 of 5322 1.000
Nucleus Tubulin Mean Frac 0 0.222 690 of 5322 0.999
Nucleus Tubulin Mean Edge -7.477e-02 4108 of 5322 0.999
Nucleus Tubulin Std Edge -2.535e-01 4835 of 5322 0.999
Nucleus Shape Area 0.134 2193 of 5322 0.989
Nucleus Shape Eccentricity -3.637e-02 2675 of 5322 1.000
Nucleus Shape Form Factor -2.488e-01 4526 of 5322 0.985
Cell Tubulin Mean 0.177 1169 of 5322 0.997
Cell Tubulin Mean Frac 3 -1.510e-01 3556 of 5322 0.999
Cell Actin Mean 0.271 481 of 5322 0.997
Cell Shape Area -6.359e-02 4540 of 5322 0.998
( Reset Zoom )
Brightness
Contrast
Opacity
Brightness
Contrast
Opacity
Brightness
Contrast
Opacity
Brightness
Contrast
Opacity
Brightness
Contrast
Opacity

( Reset Zoom )
Brightness
Contrast
Opacity
Brightness
Contrast
Opacity
Brightness
Contrast
Opacity
Brightness
Contrast
Opacity
Brightness
Contrast
Opacity

MIT Central Accessability