GAR1

Gene symbol: GAR1
Gene: 54433
Uniprot Function: Required for ribosome biogenesis and telomere maintenance. Part of the H/ACA small nucleolar ribonucleoprotein (H/ACA snoRNP) complex, which catalyzes pseudouridylation of rRNA. This involves the isomerization of uridine such that the ribose is subsequently attached to C5, instead of the normal N1. Each rRNA can contain up to 100 pseudouridine ('psi') residues, which may serve to stabilize the conformation of rRNAs. May also be required for correct processing or intranuclear trafficking of TERC, the RNA component of the telomerase reverse transcriptase (TERT) holoenzyme.
Mitotic Index 0.0204
Interphase Cluster: #72 (28 genes)
Mitotic Cluster: #28 (35 genes)
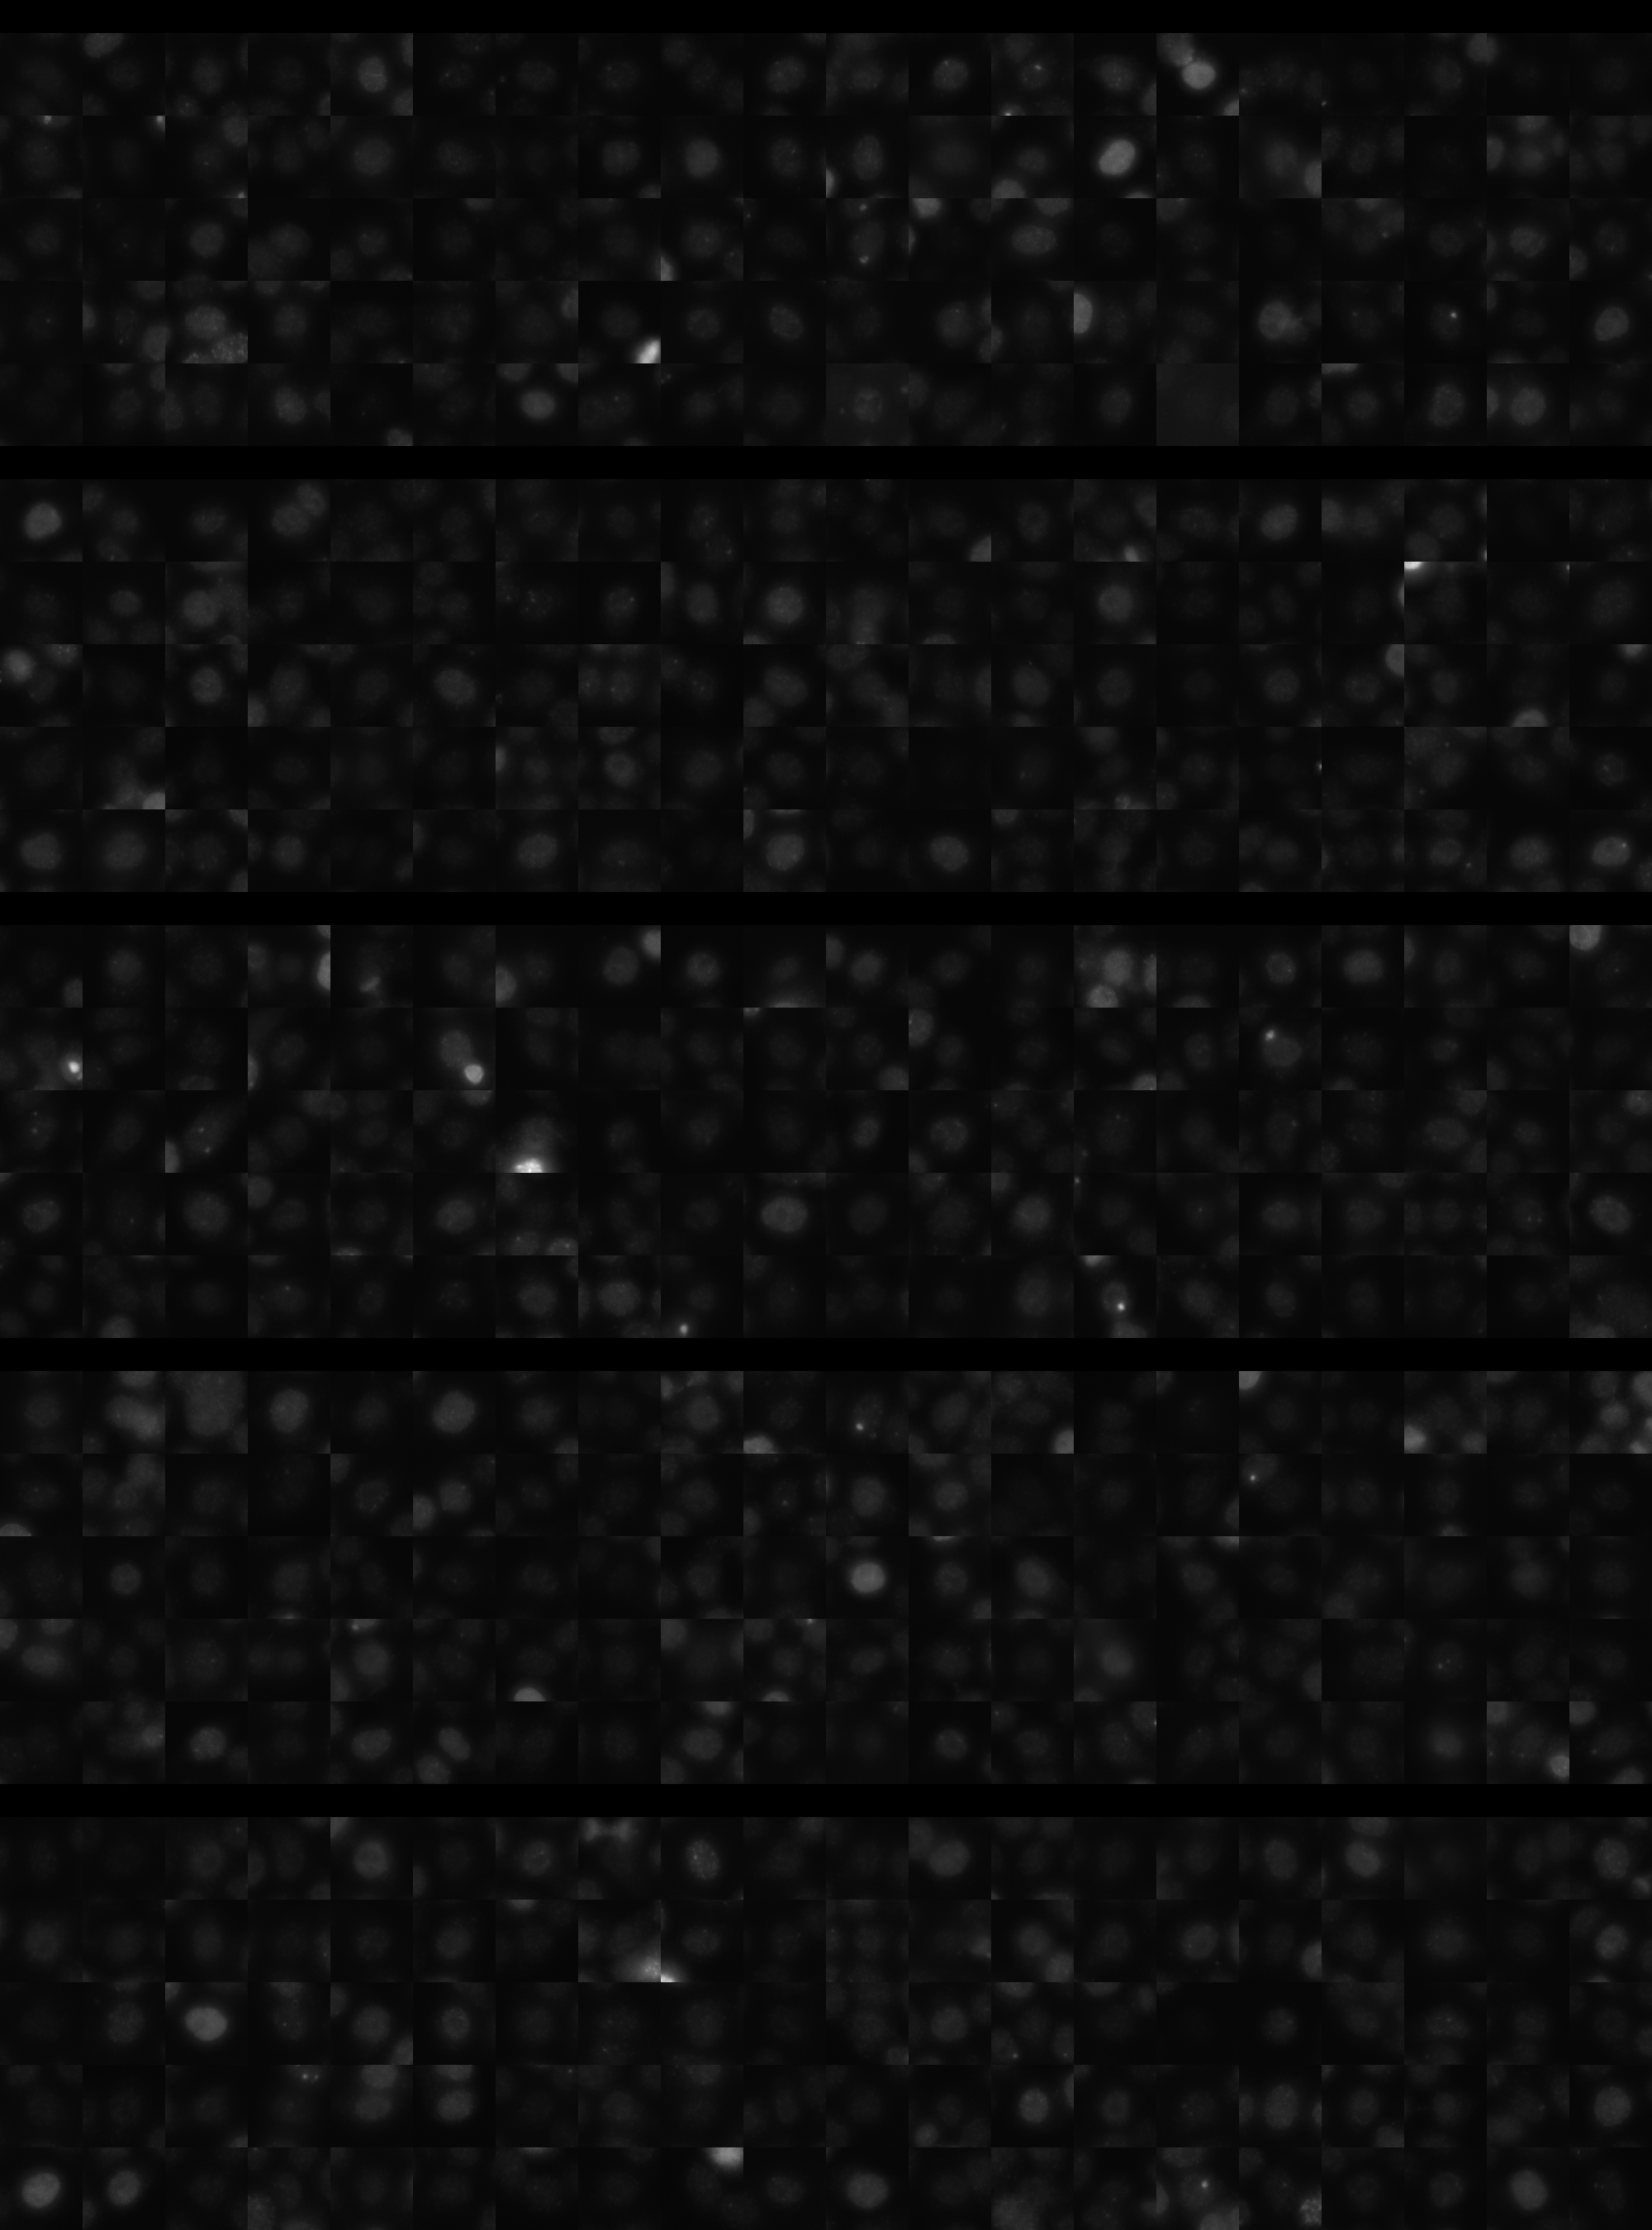
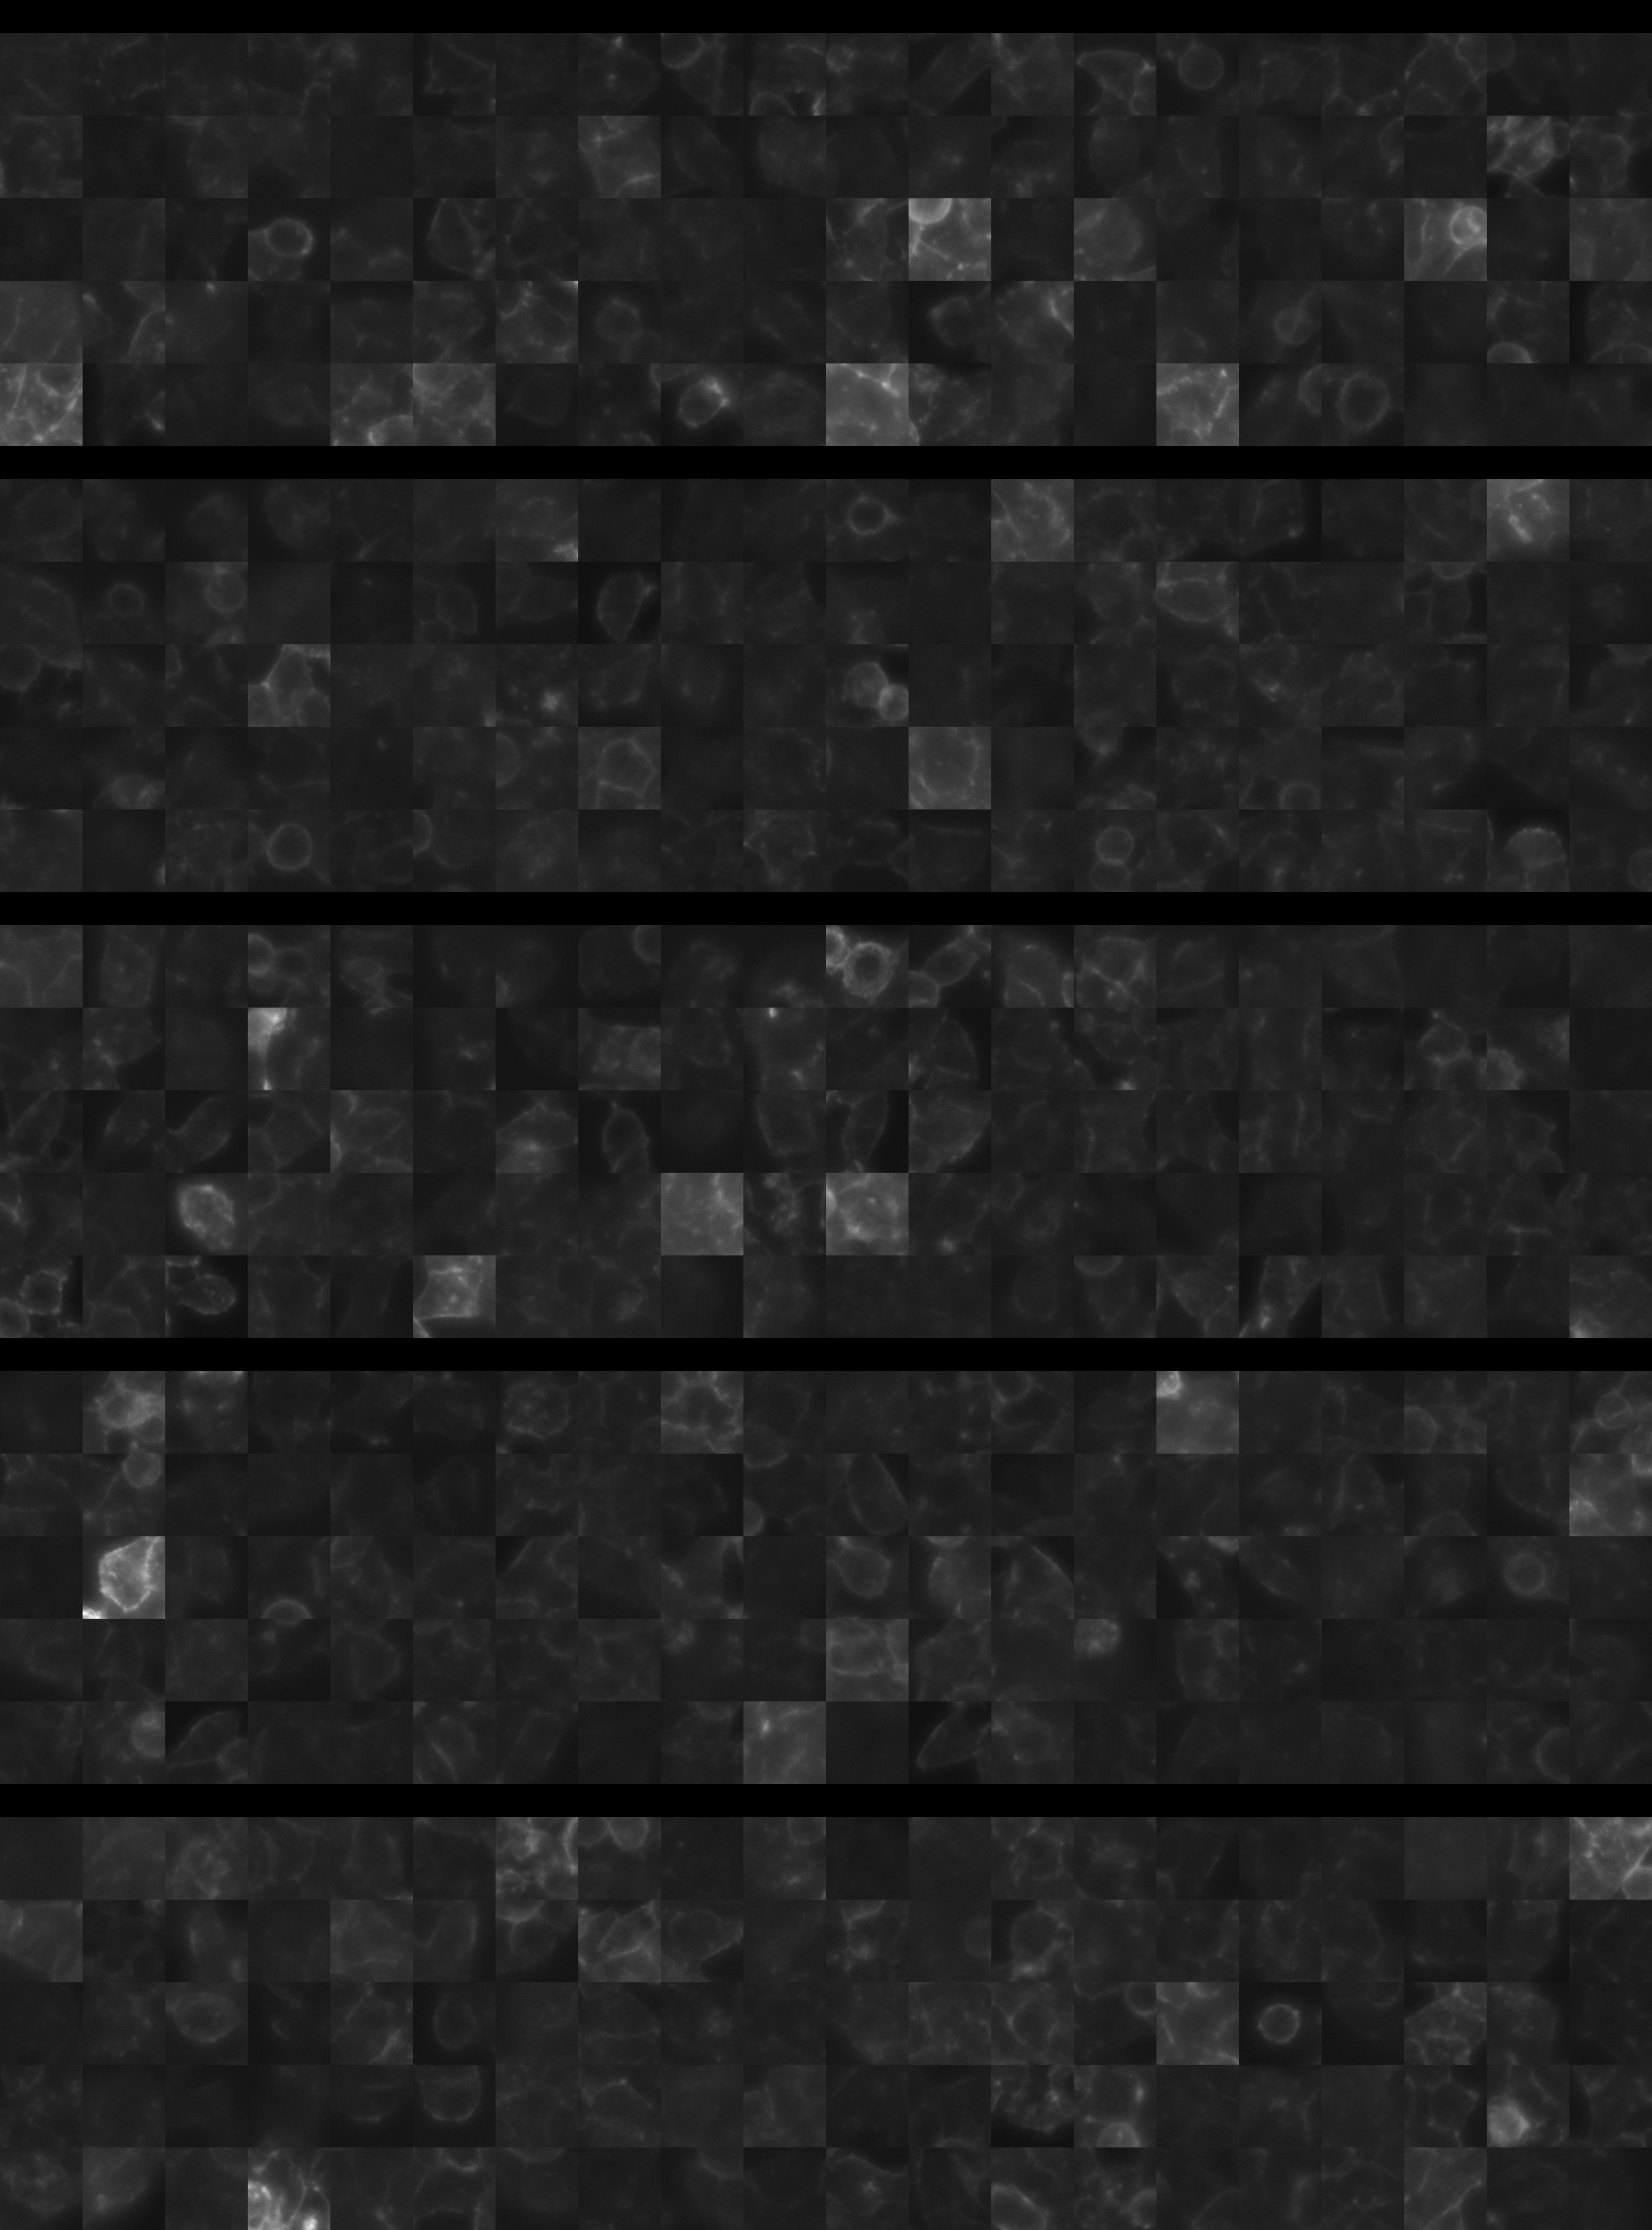
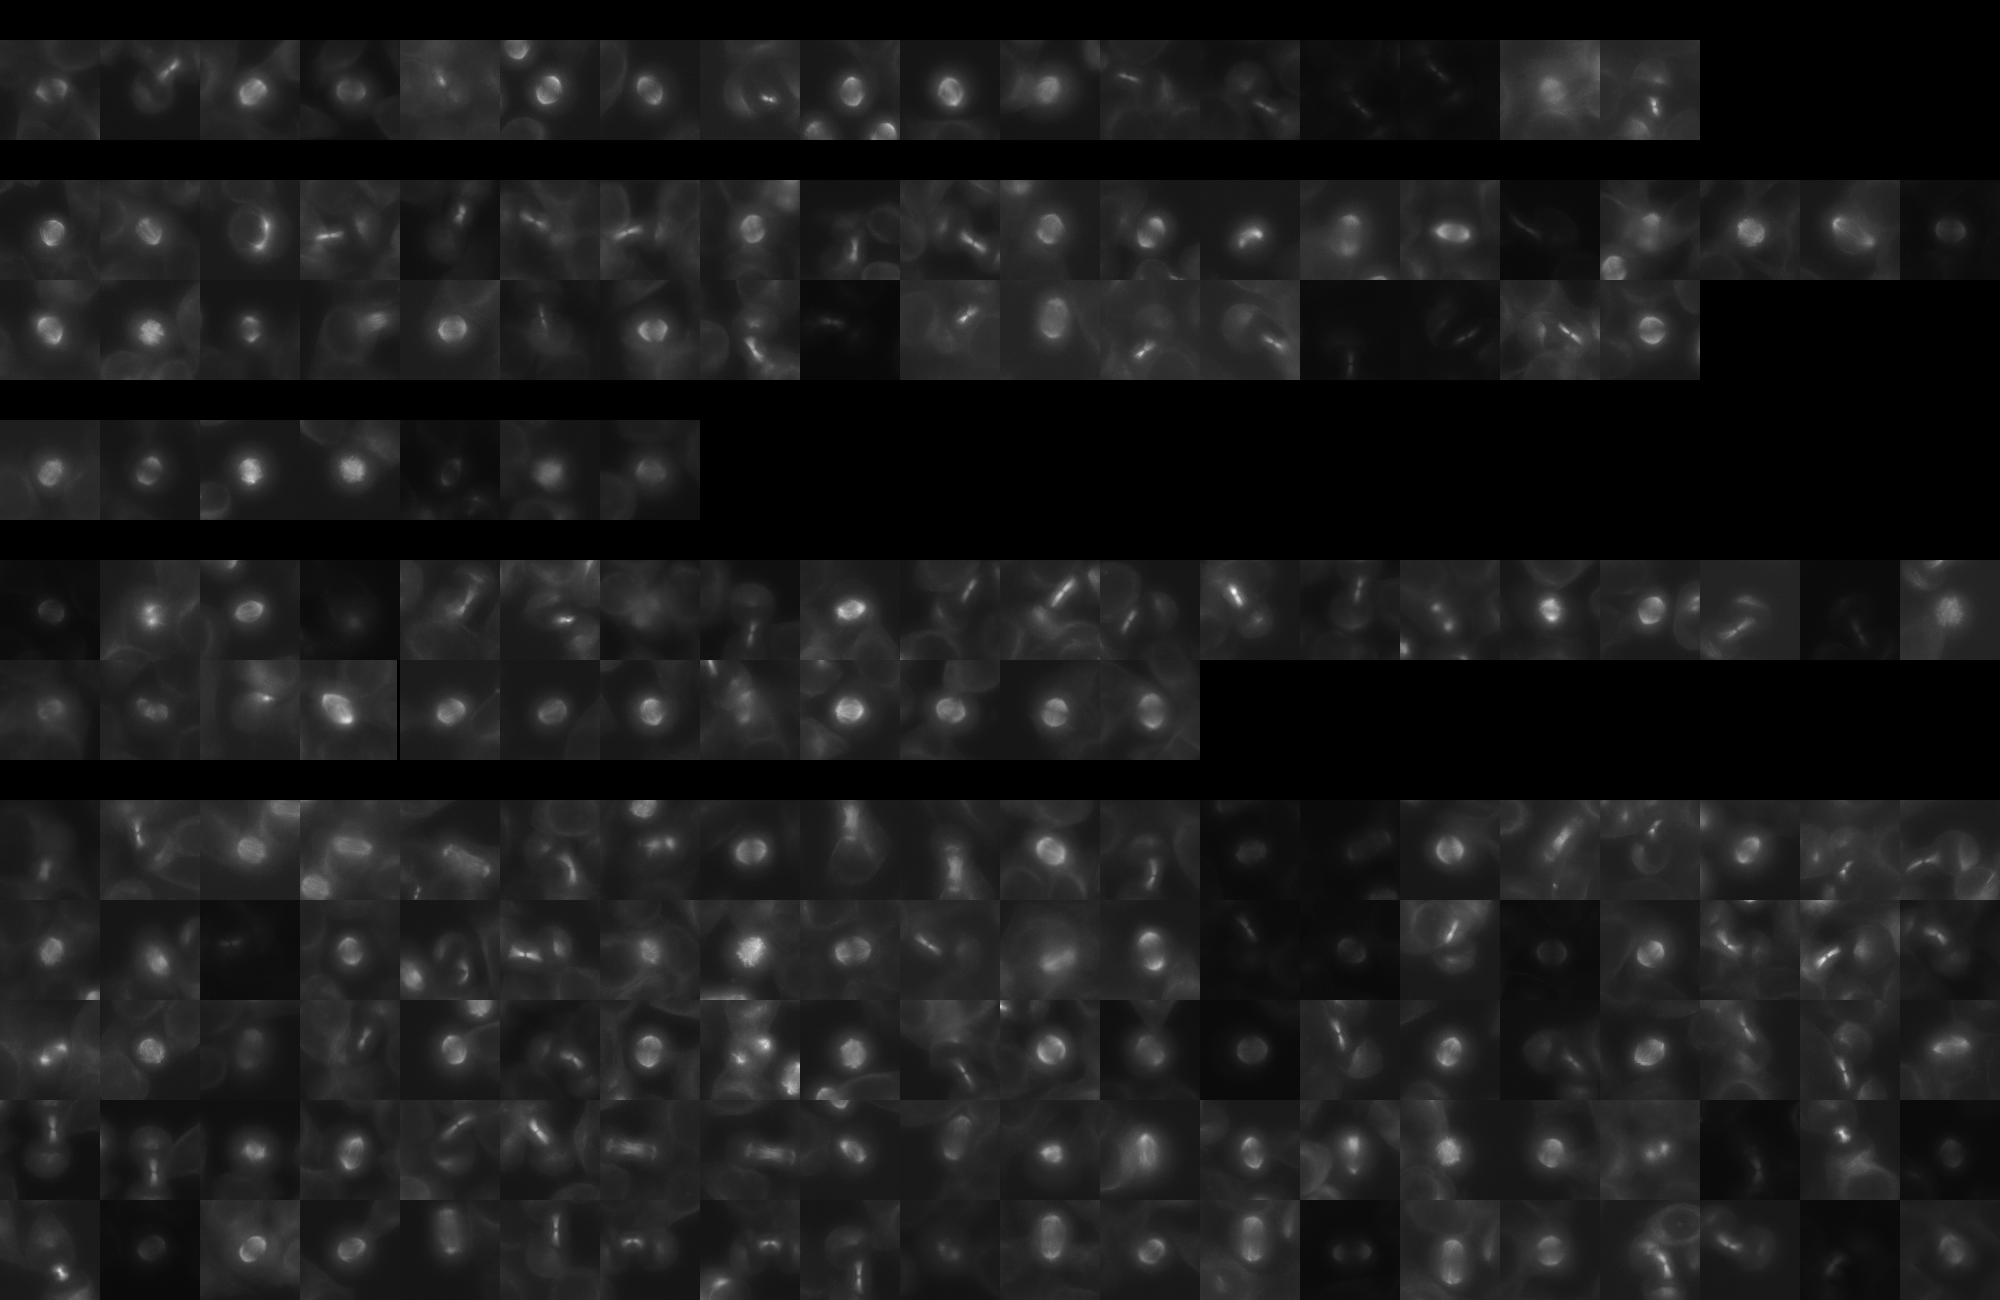
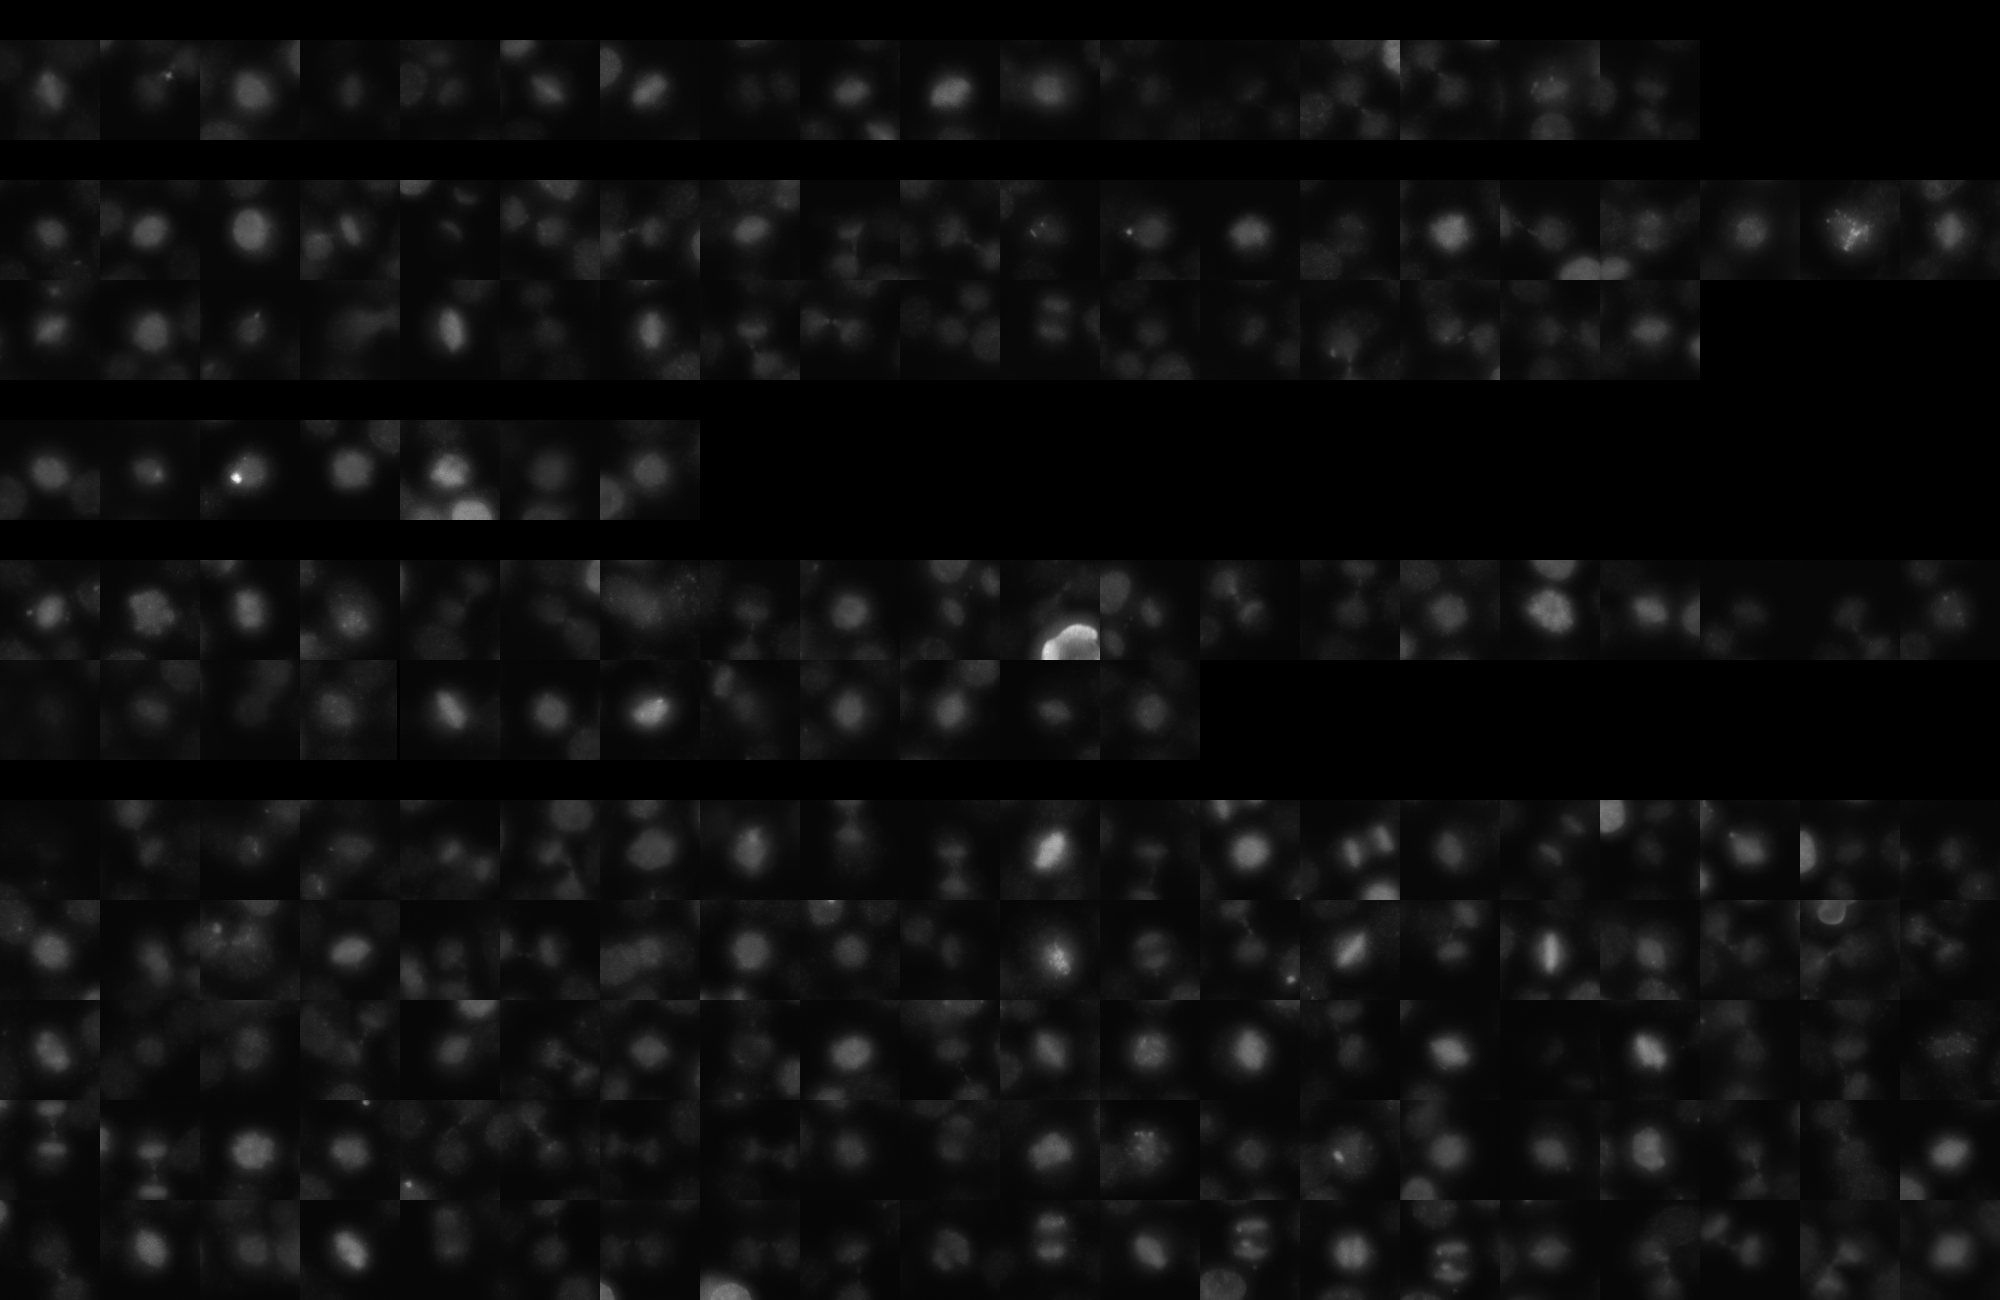
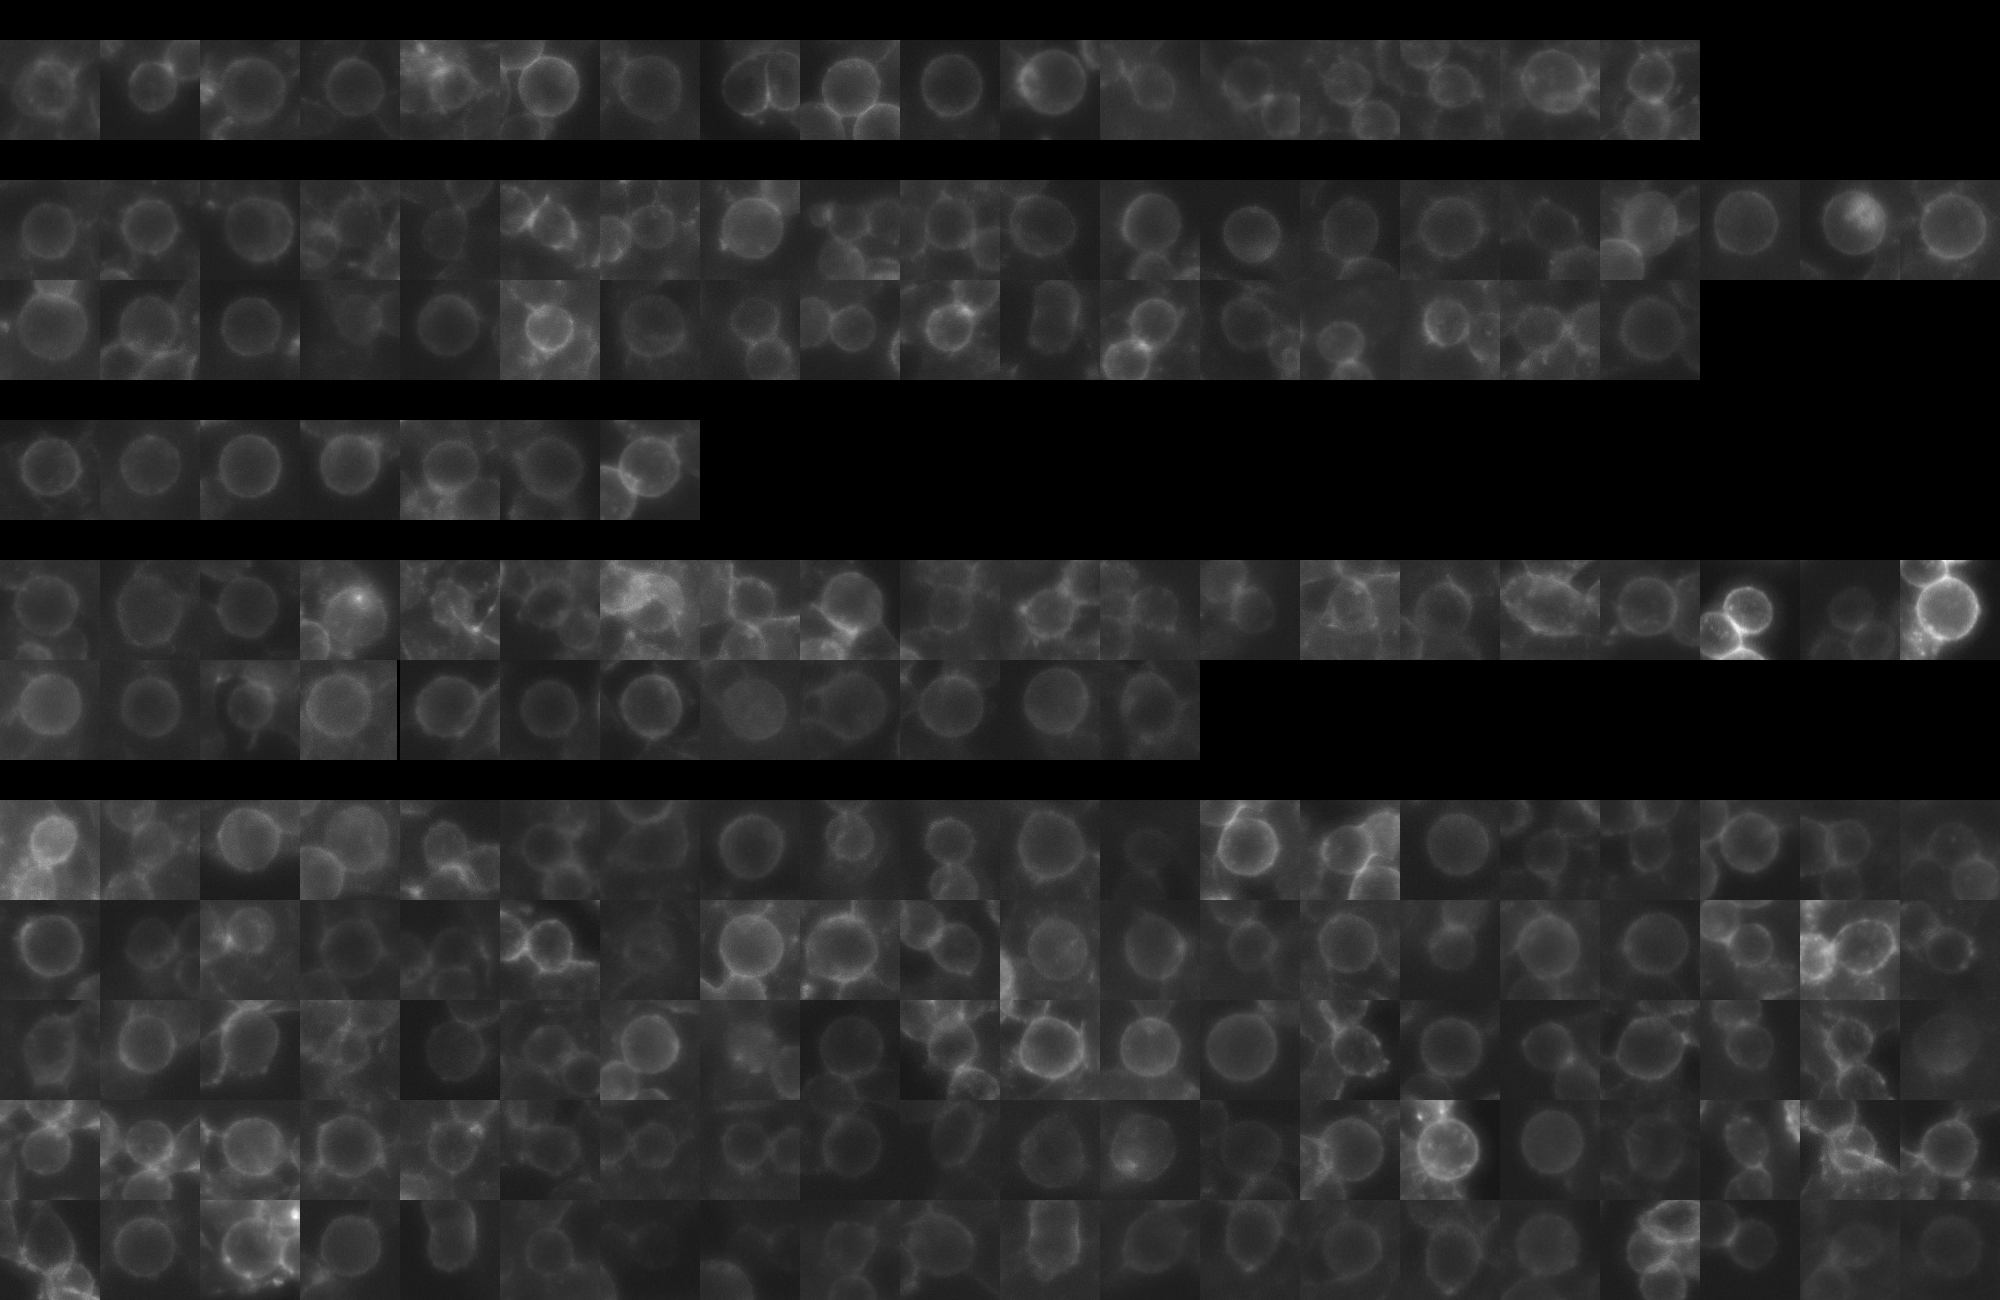
sgRNA 1: ATACAGACTACACGTTCTGG (interphase cells: 726, mitotic cells: 17)
sgRNA 2: GGCAGCAGCAACCACTTCCG (interphase cells: 1682, mitotic cells: 37)
sgRNA 3: GGCCTTTGTTAAAGCCTCCG (interphase cells: 741, mitotic cells: 7)
sgRNA 4: GGTCGTGGAGGCTTTAATCG (interphase cells: 1319, mitotic cells: 32)

Interphase Cluster

Mitotic Cluster

Overview

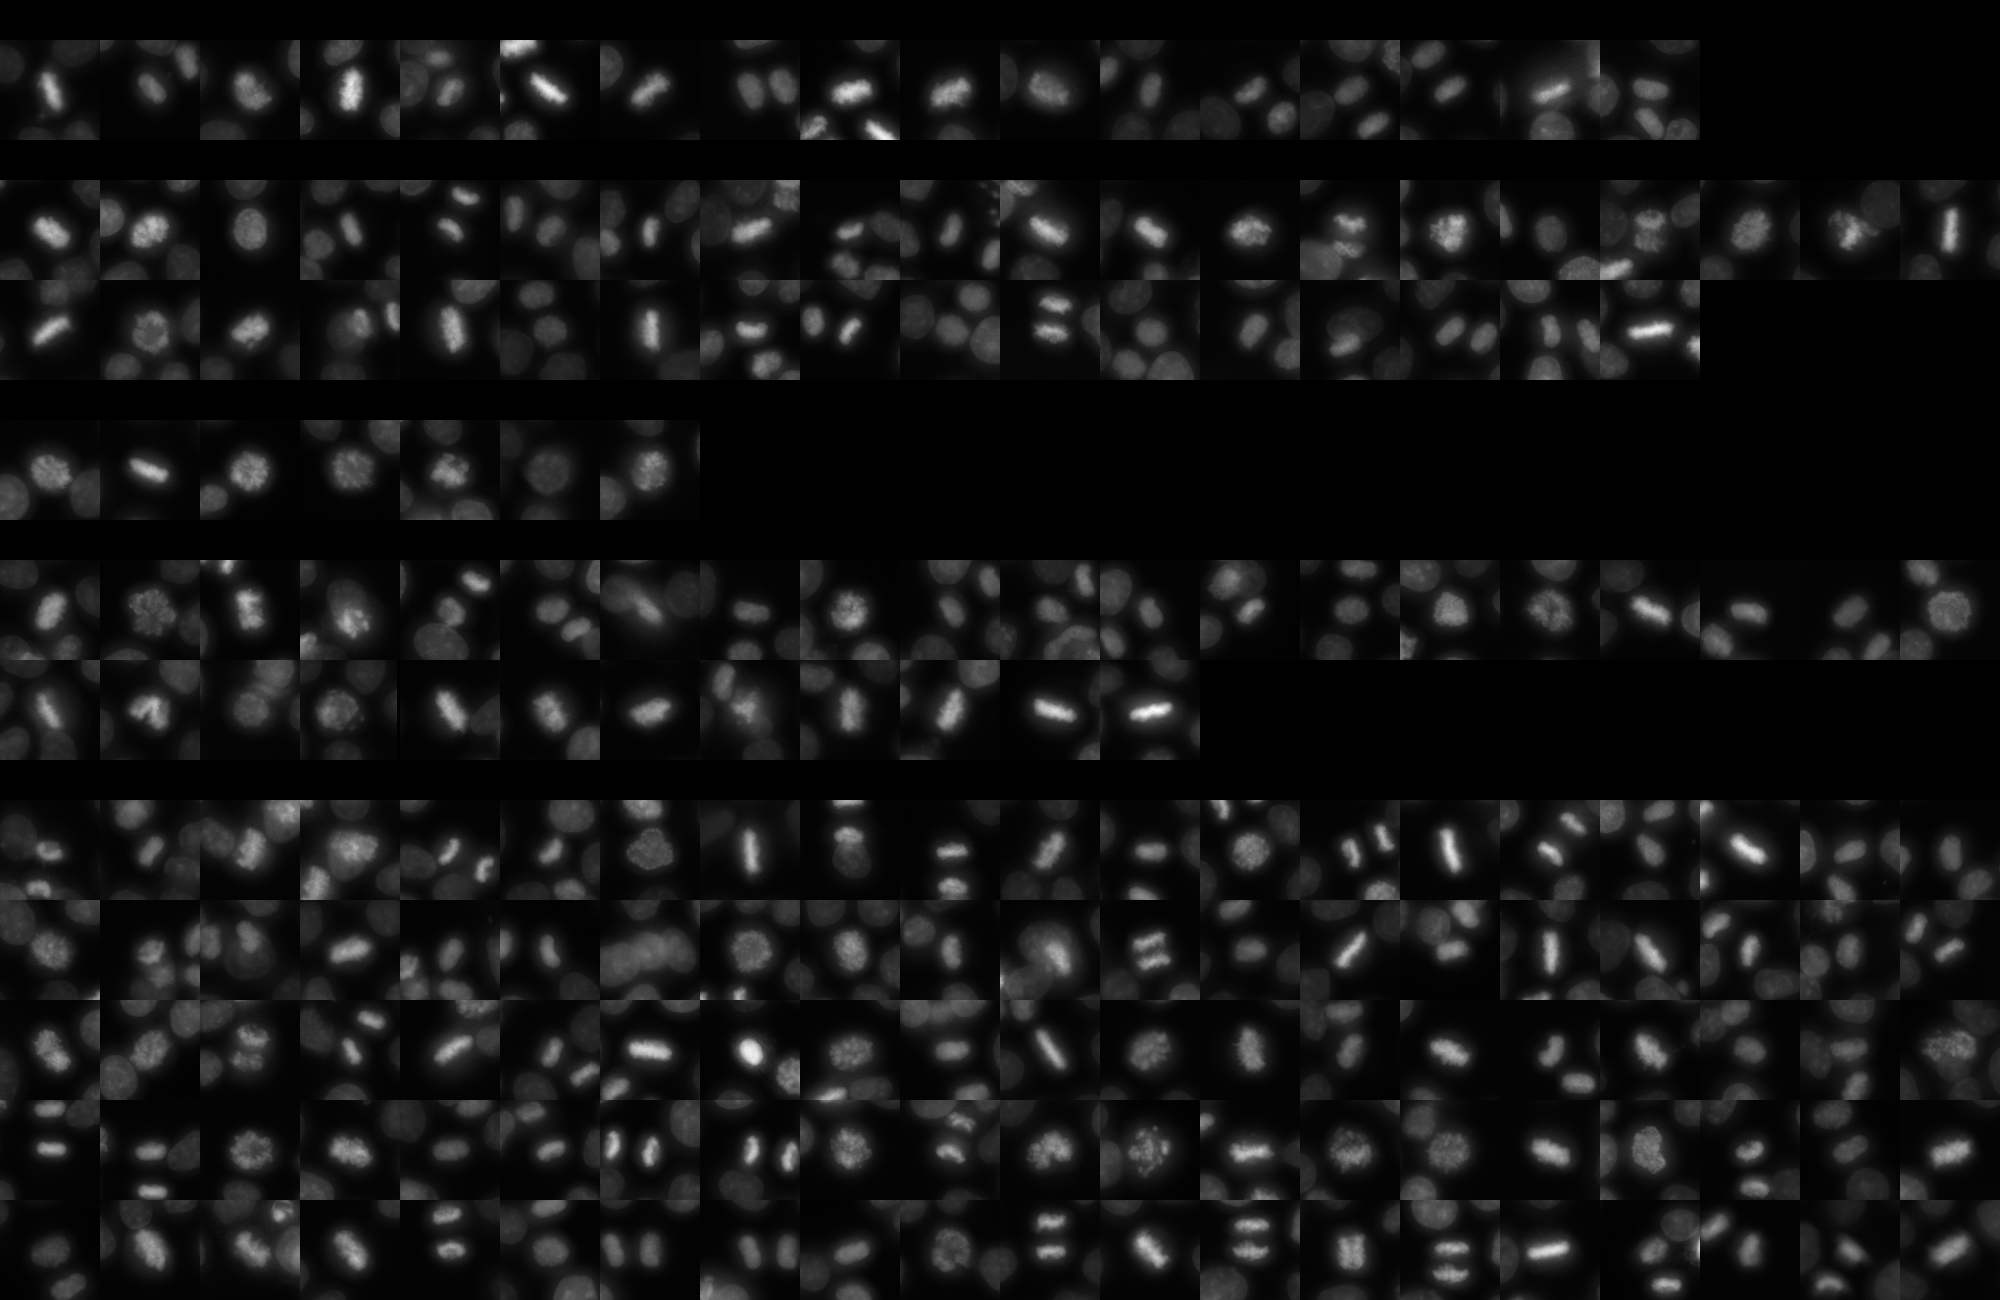
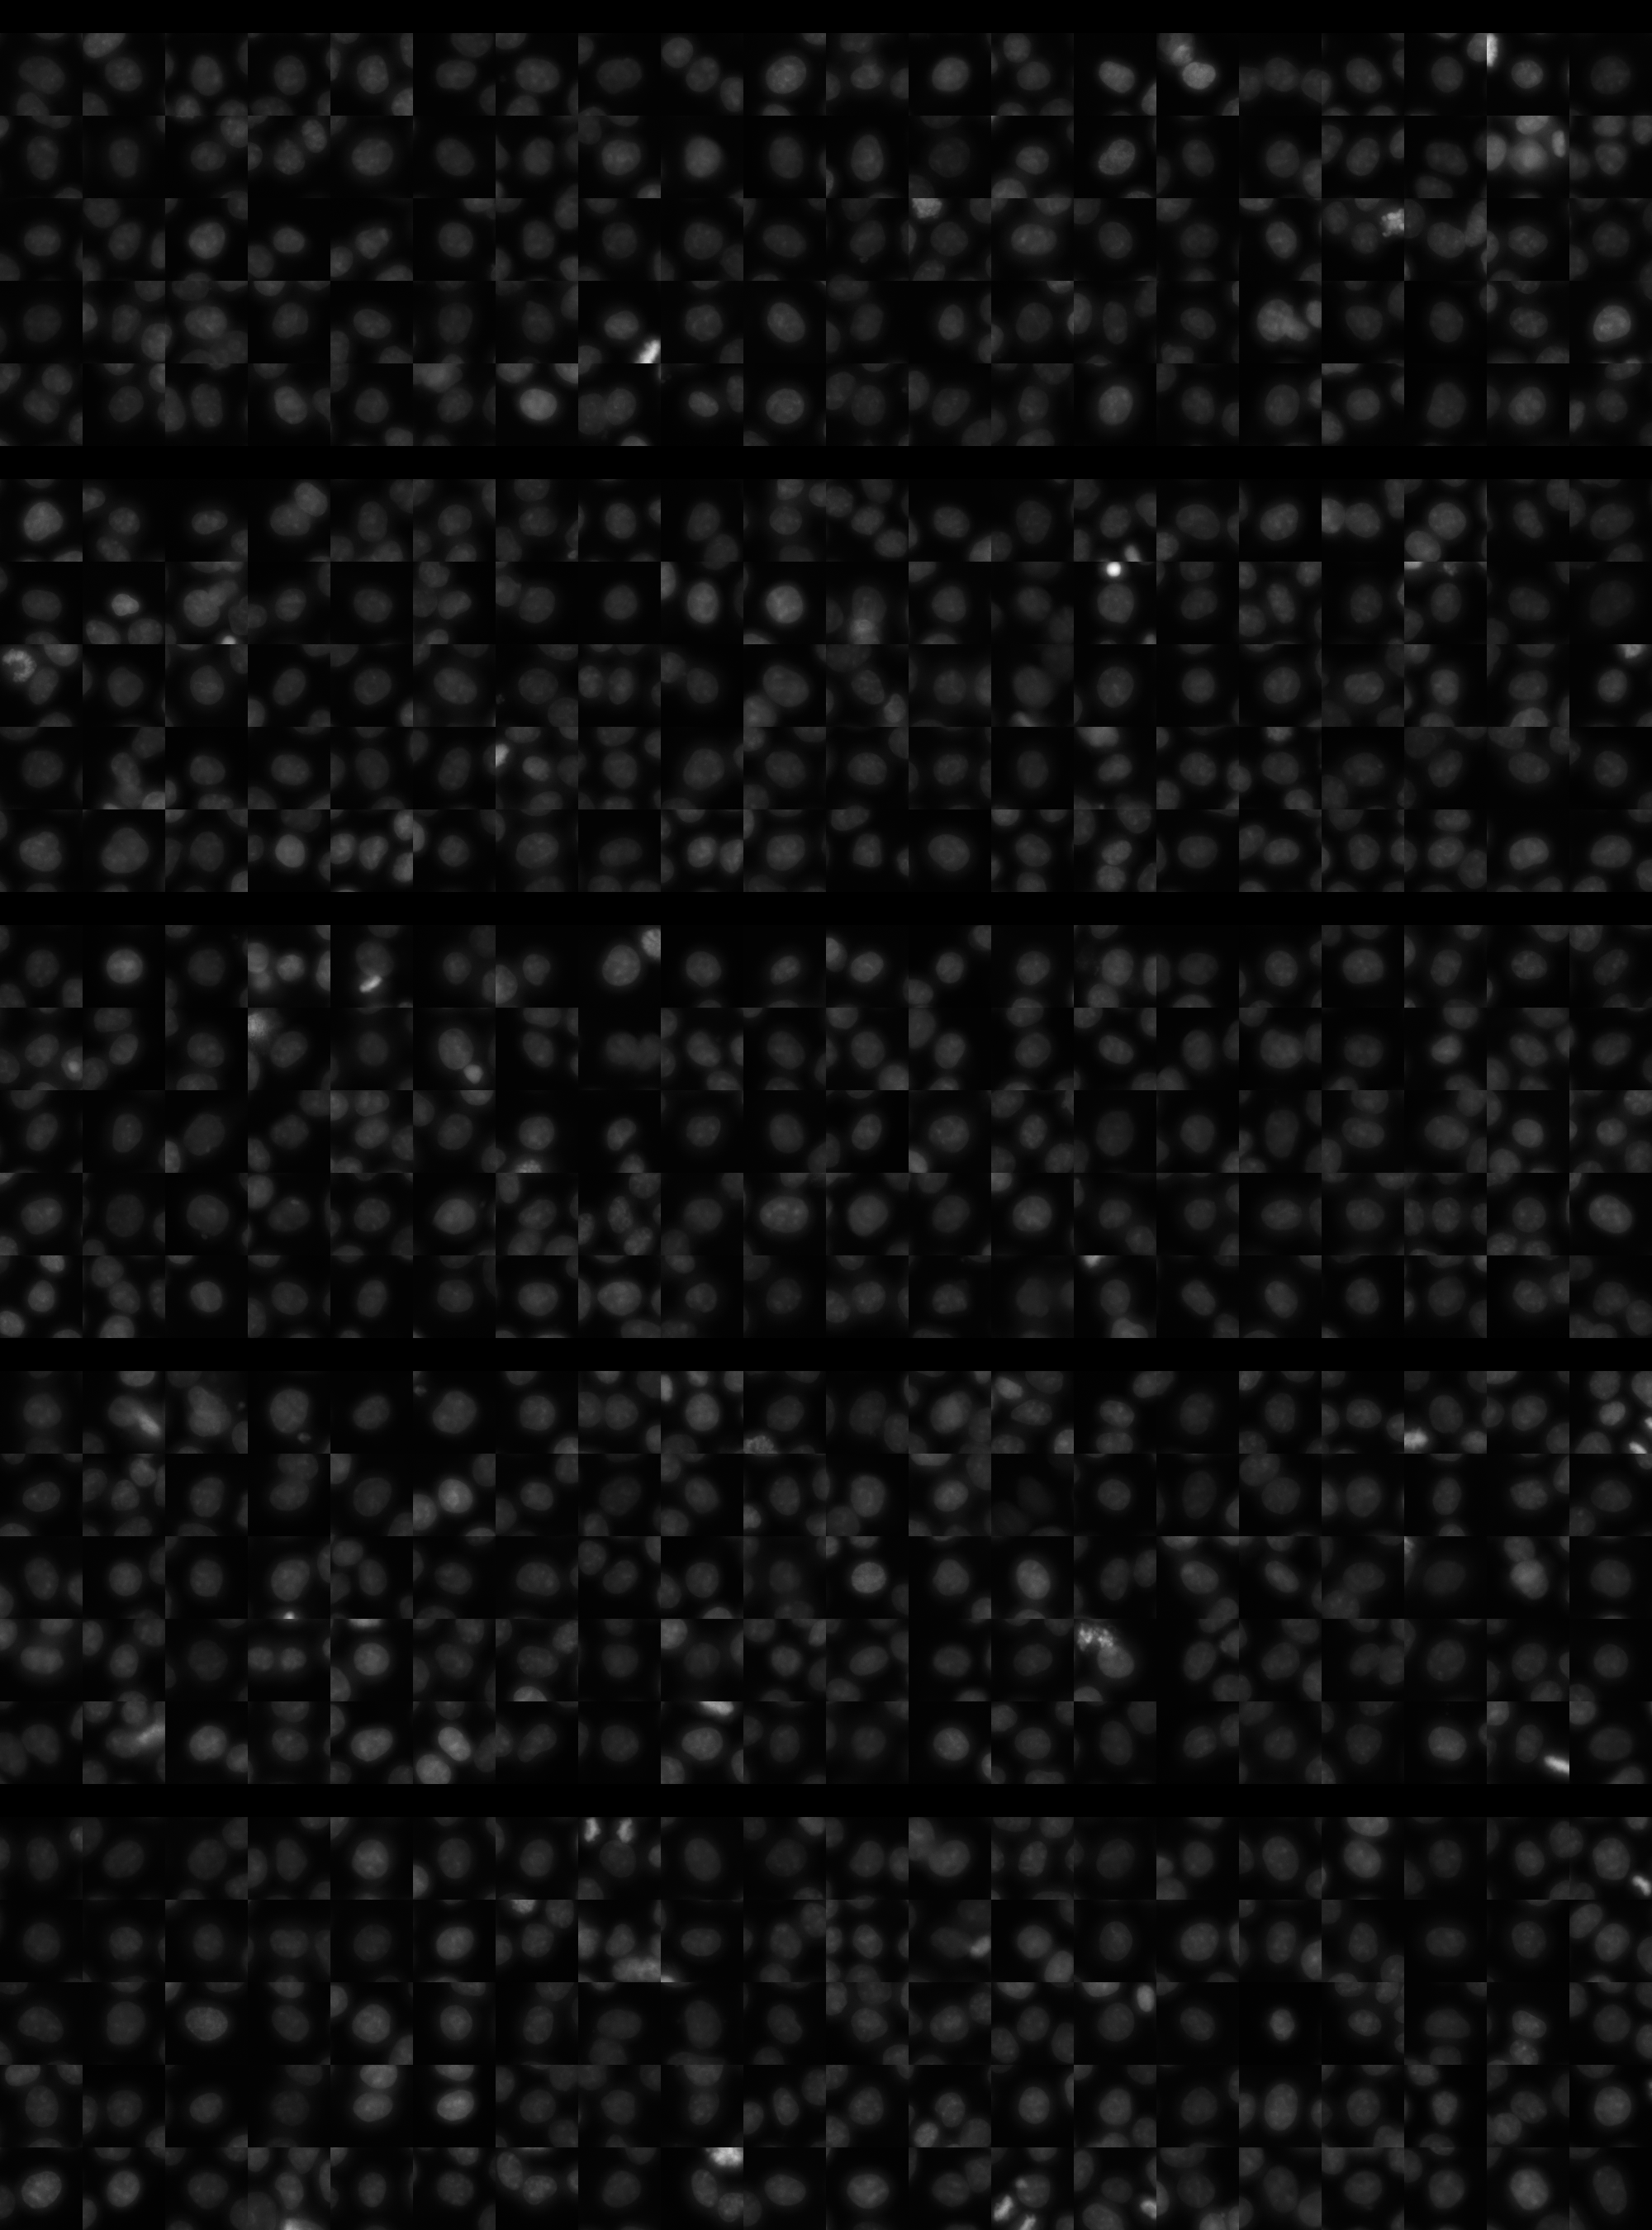
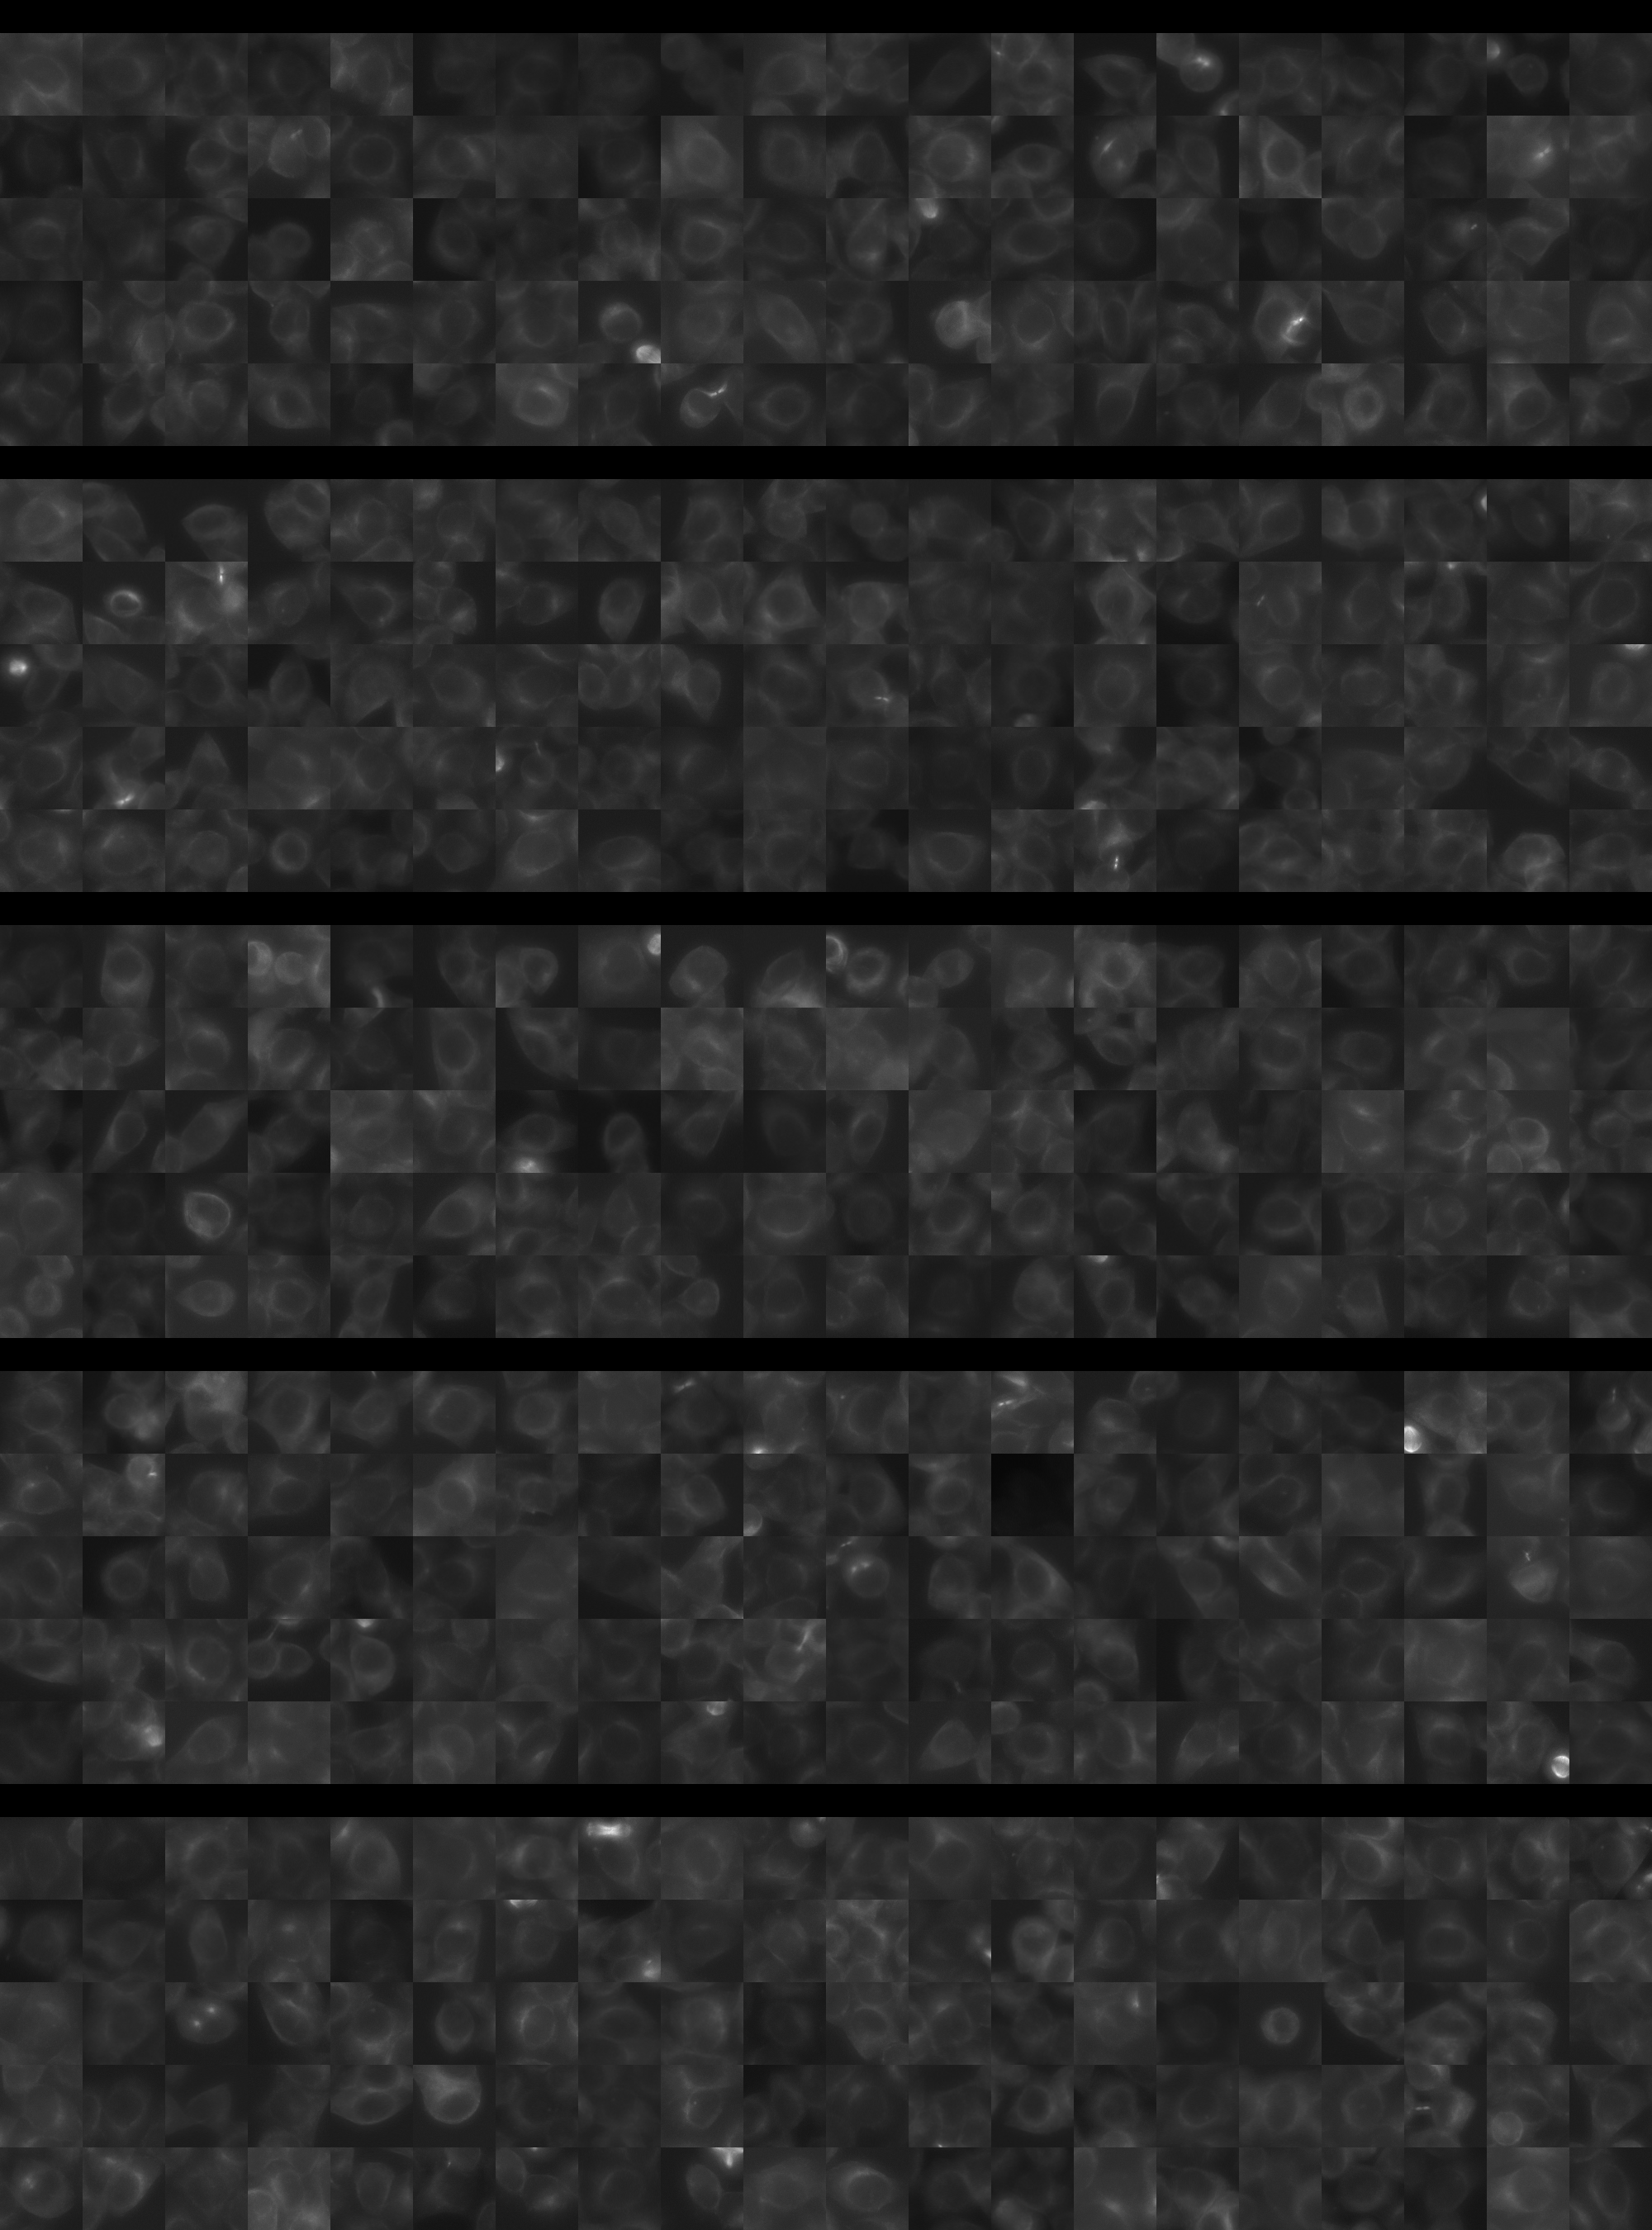
Each montage below shows randomly selected individual cell images for the same target gene separated by sgRNA, along with an example montage of cells expressing a non-targeting negative control sgRNA at the bottom. sgRNA labels in the montages correspond to the numbered sgRNA sequences in the gene info table above. The DNA (blue) and tubulin (green) channels are displayed by default, with gH2AX (grayscale) and actin (yellow) available using the check boxes. Channel brightness, contrast, and opacity are adjustable by clicking the arrow next to the channel name. When only one channel is selected, the display defaults to grayscale. Click the “Zoom” checkbox above the channel controls to enable image zooming (via scrolling) and panning (via click-and-drag).

The cell boxes displayed for this gene are square, 30.36 μm per side for the interphase montage and 30.36 μm per side for the mitotic montage.
Features

Interphase Score Rank FDR q-value
Nucleus DNA Integrated -5.382e-02 4932 of 5322 0.296
Nucleus DNA Mean 0.060 729 of 5322 0.166
Nucleus gH2AX Mean -4.223e-02 5020 of 5322 0.244
Nucleus DNA - gH2AX Correlation 0.028 519 of 5322 0.472
Nucleus Shape Area -1.660e-01 4996 of 5322 1.633e-04
Nucleus Shape Eccentricity 0.014 2551 of 5322 0.788
Nucleus Shape Form Factor -2.142e-02 1341 of 5322 0.684
Nucleus Shape Solidity -7.910e-02 3795 of 5322 0.035
Cell DNA Mass Displacement -6.159e-03 4644 of 5322 0.902
Cell Tubulin Mean -7.384e-02 4697 of 5322 0.118
Cell Tubulin Mass Displacement -6.450e-02 4959 of 5322 0.134
Cell Actin Mean -7.878e-02 4758 of 5322 0.106
Cell Tubulin - Actin Correlation 0.090 669 of 5322 0.029
Cell DNA - Tubulin Correlation 0.144 529 of 5322 1.948e-04
Cell Shape Area -1.968e-01 5017 of 5322 1.651e-04
Cell Shape Eccentricity 0.003 3491 of 5322 0.980
Mitotic Score Rank FDR q-value
Nucleus DNA Integrated 0.210 1166 of 5322 0.905
Nucleus DNA Mean -1.200e-01 4488 of 5322 1.000
Nucleus DNA Mass Displacement 0.167 1064 of 5322 0.999
Nucleus DNA Mean Frac 3 0.127 1240 of 5322 1.000
Nucleus gH2AX Mean -7.445e-02 3968 of 5322 1.000
Nucleus gH2AX Mean Frac 0 -2.735e-01 5118 of 5322 1.000
Nucleus Tubulin Mean Frac 0 -5.119e-02 4178 of 5322 0.999
Nucleus Tubulin Mean Edge 0.019 2902 of 5322 0.999
Nucleus Tubulin Std Edge -1.880e-01 4568 of 5322 0.999
Nucleus Shape Area 0.097 2725 of 5322 0.990
Nucleus Shape Eccentricity 0.142 508 of 5322 1.000
Nucleus Shape Form Factor 0.143 233 of 5322 0.998
Cell Tubulin Mean -1.094e-01 4647 of 5322 0.997
Cell Tubulin Mean Frac 3 -1.243e-02 1819 of 5322 0.999
Cell Actin Mean 0.161 1193 of 5322 0.997
Cell Shape Area 0.106 2517 of 5322 0.998
( Reset Zoom )
Brightness
Contrast
Opacity
Brightness
Contrast
Opacity
Brightness
Contrast
Opacity
Brightness
Contrast
Opacity
Brightness
Contrast
Opacity

( Reset Zoom )
Brightness
Contrast
Opacity
Brightness
Contrast
Opacity
Brightness
Contrast
Opacity
Brightness
Contrast
Opacity
Brightness
Contrast
Opacity

MIT Central Accessability