FAM91A1

Gene symbol: FAM91A1
Gene: 157769
Uniprot Function: As component of the WDR11 complex acts together with TBC1D23 to facilitate the golgin-mediated capture of vesicles generated using AP-1.
Mitotic Index 0.0252
Interphase Cluster: #89 (25 genes)
Mitotic Cluster: #135 (20 genes)
sgRNA 1: AAATTGCCATAGAGGCGTGG (interphase cells: 1740, mitotic cells: 39)
sgRNA 2: ATTTATCATGTCACTGGACA (interphase cells: 1571, mitotic cells: 36)
sgRNA 3: TTACGATATAGAAATAACTT (interphase cells: 1637, mitotic cells: 49)
sgRNA 4: TTTGTAATGAATCGAGTGCA (interphase cells: 848, mitotic cells: 26)

Interphase Cluster

Mitotic Cluster

Overview

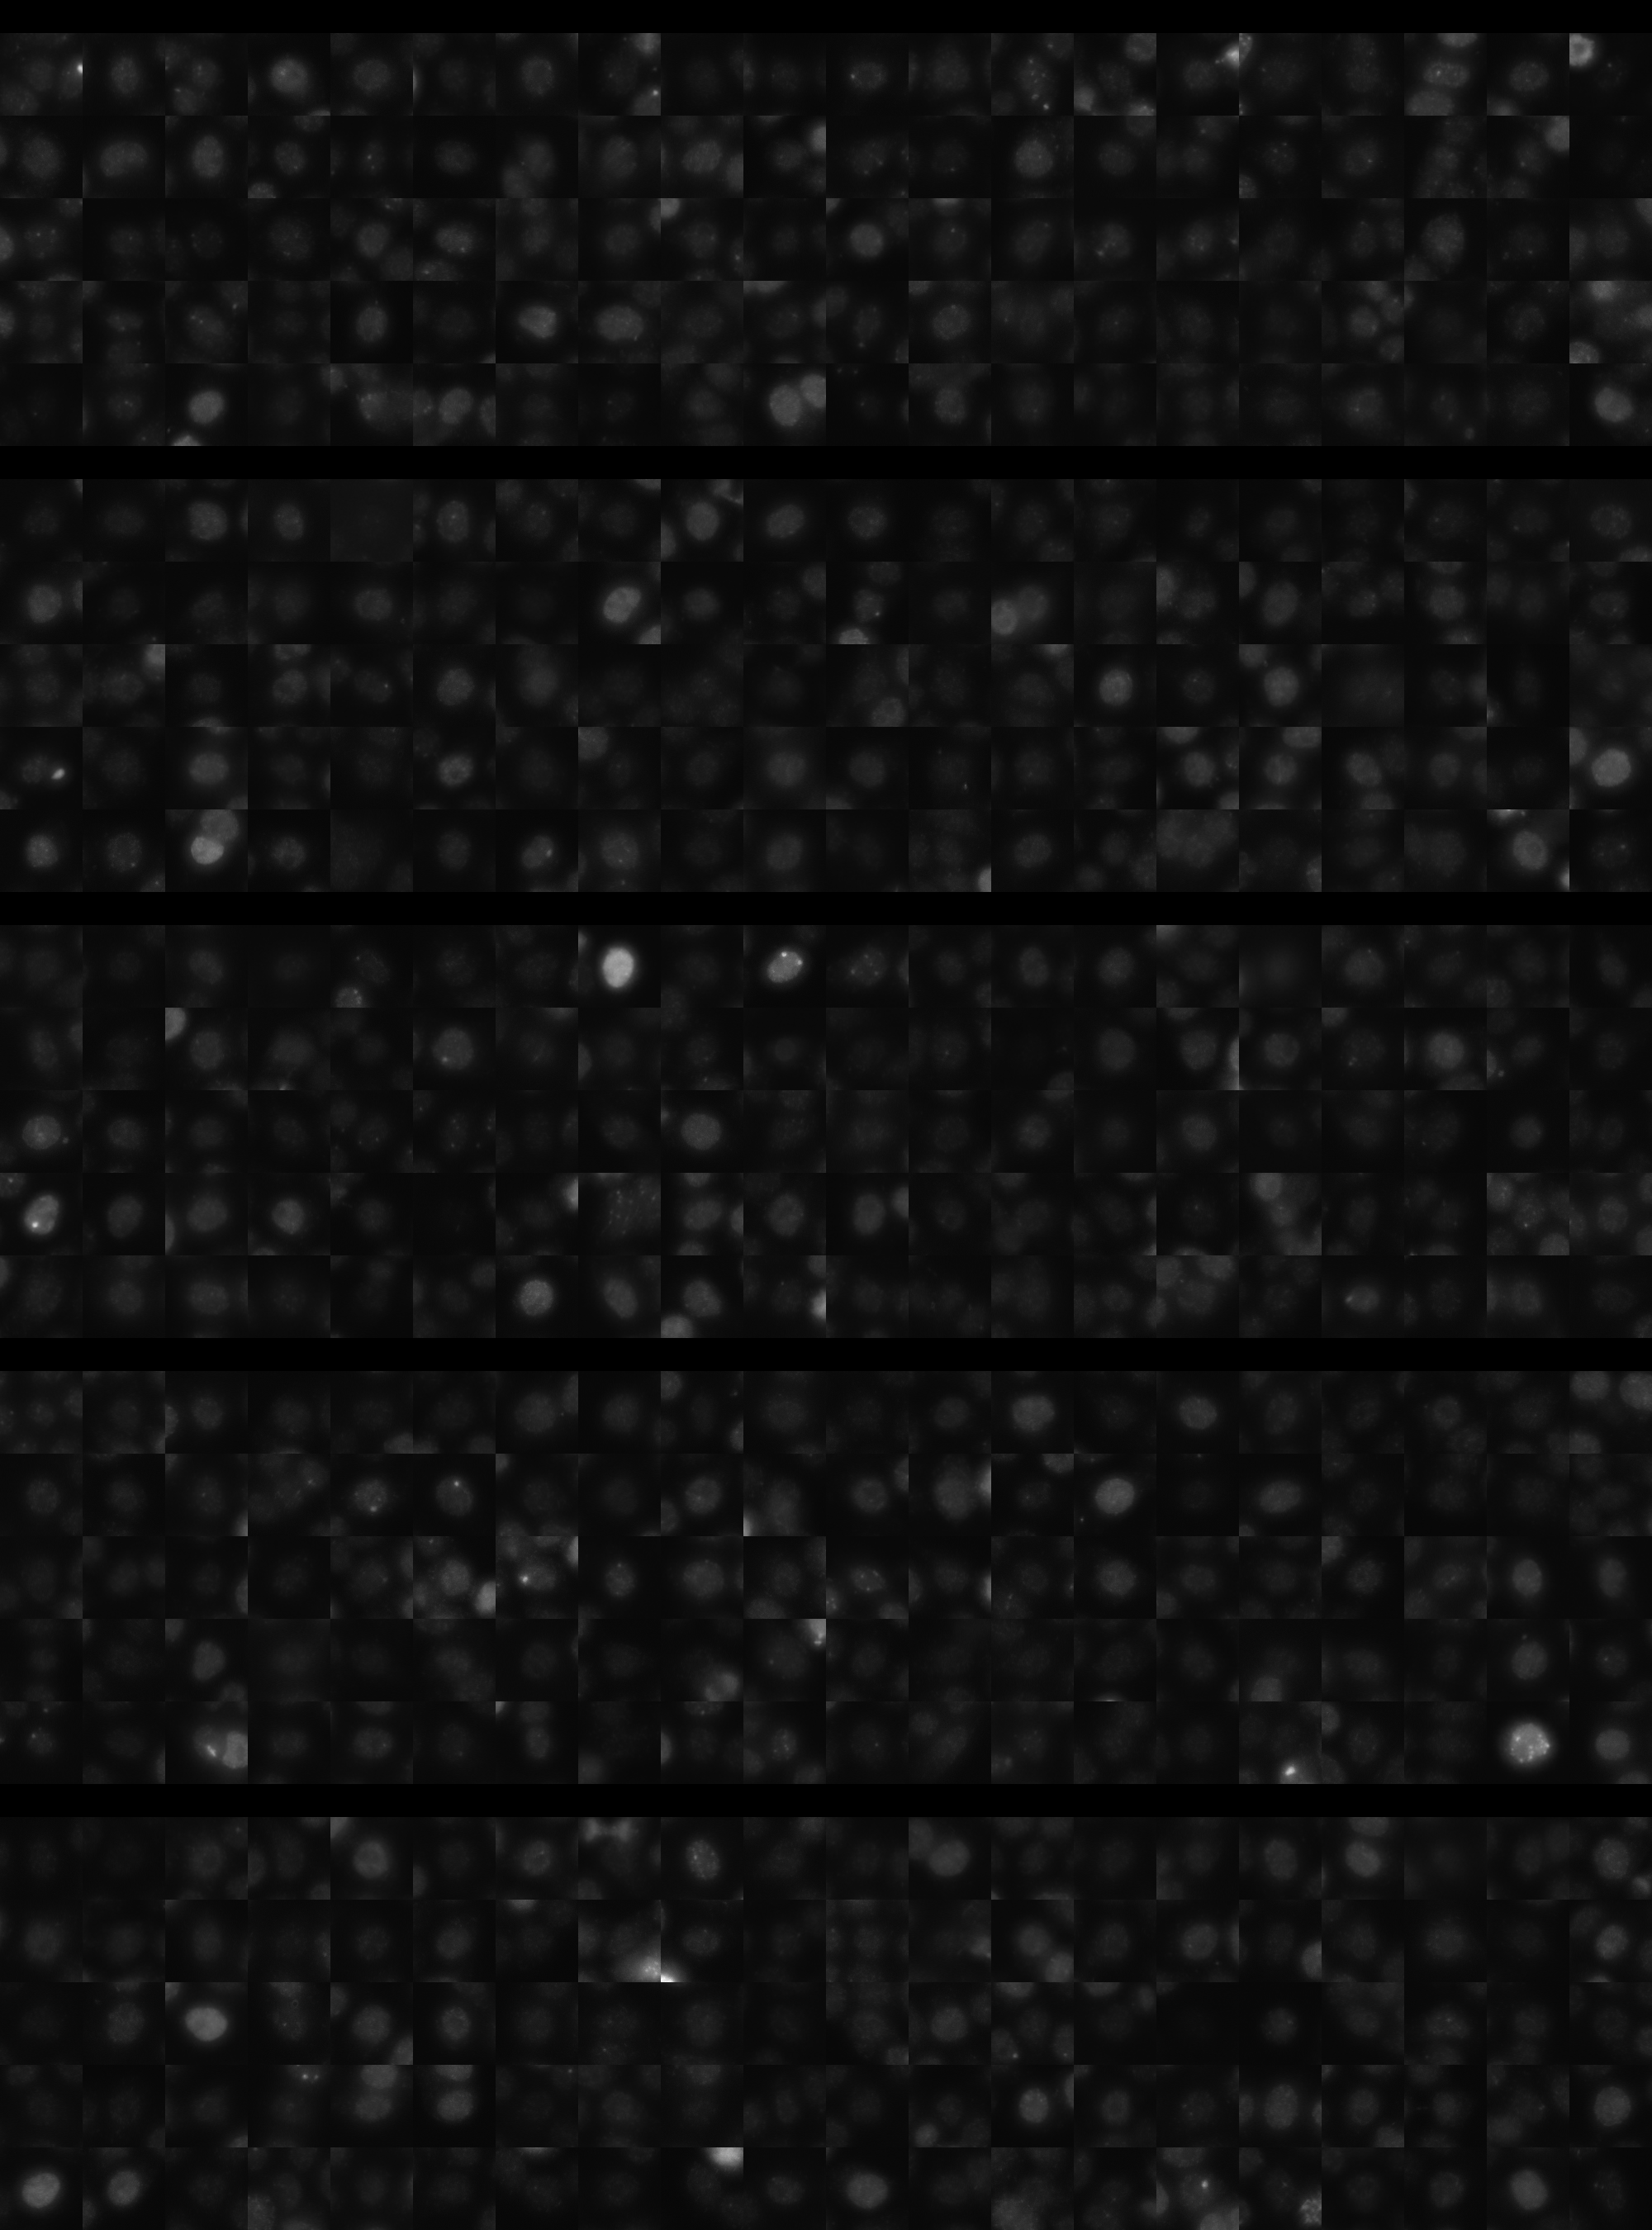
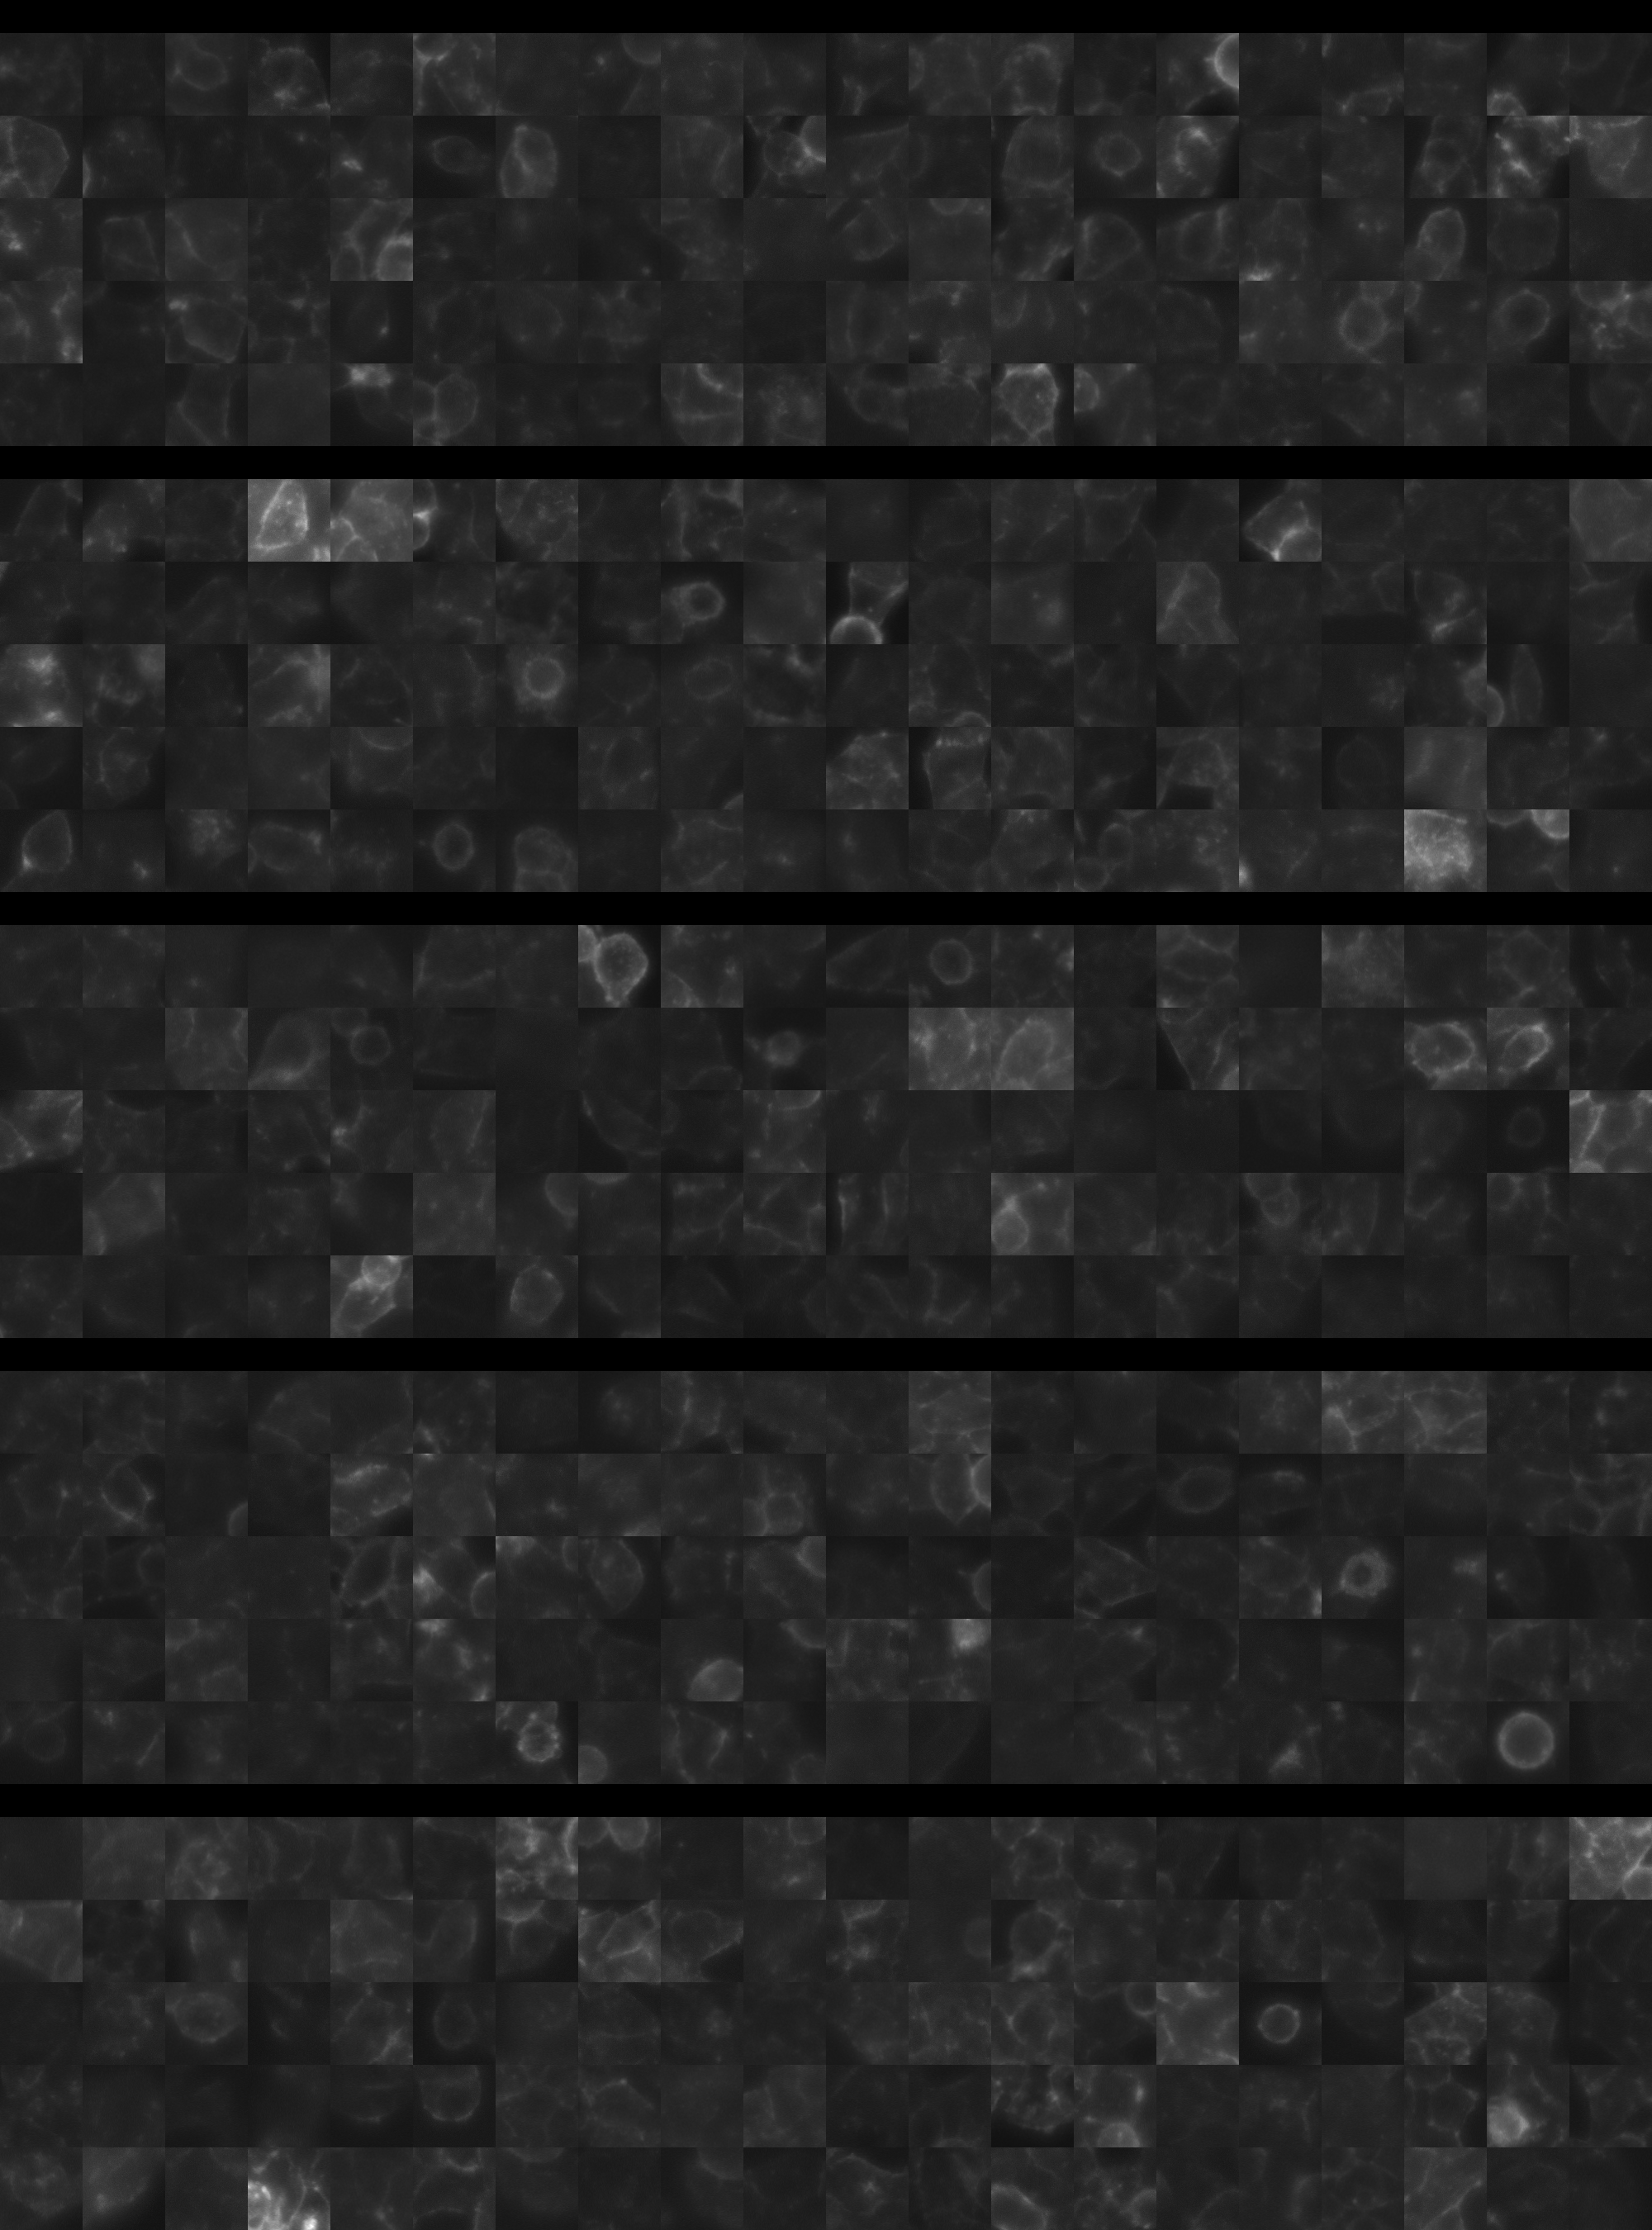
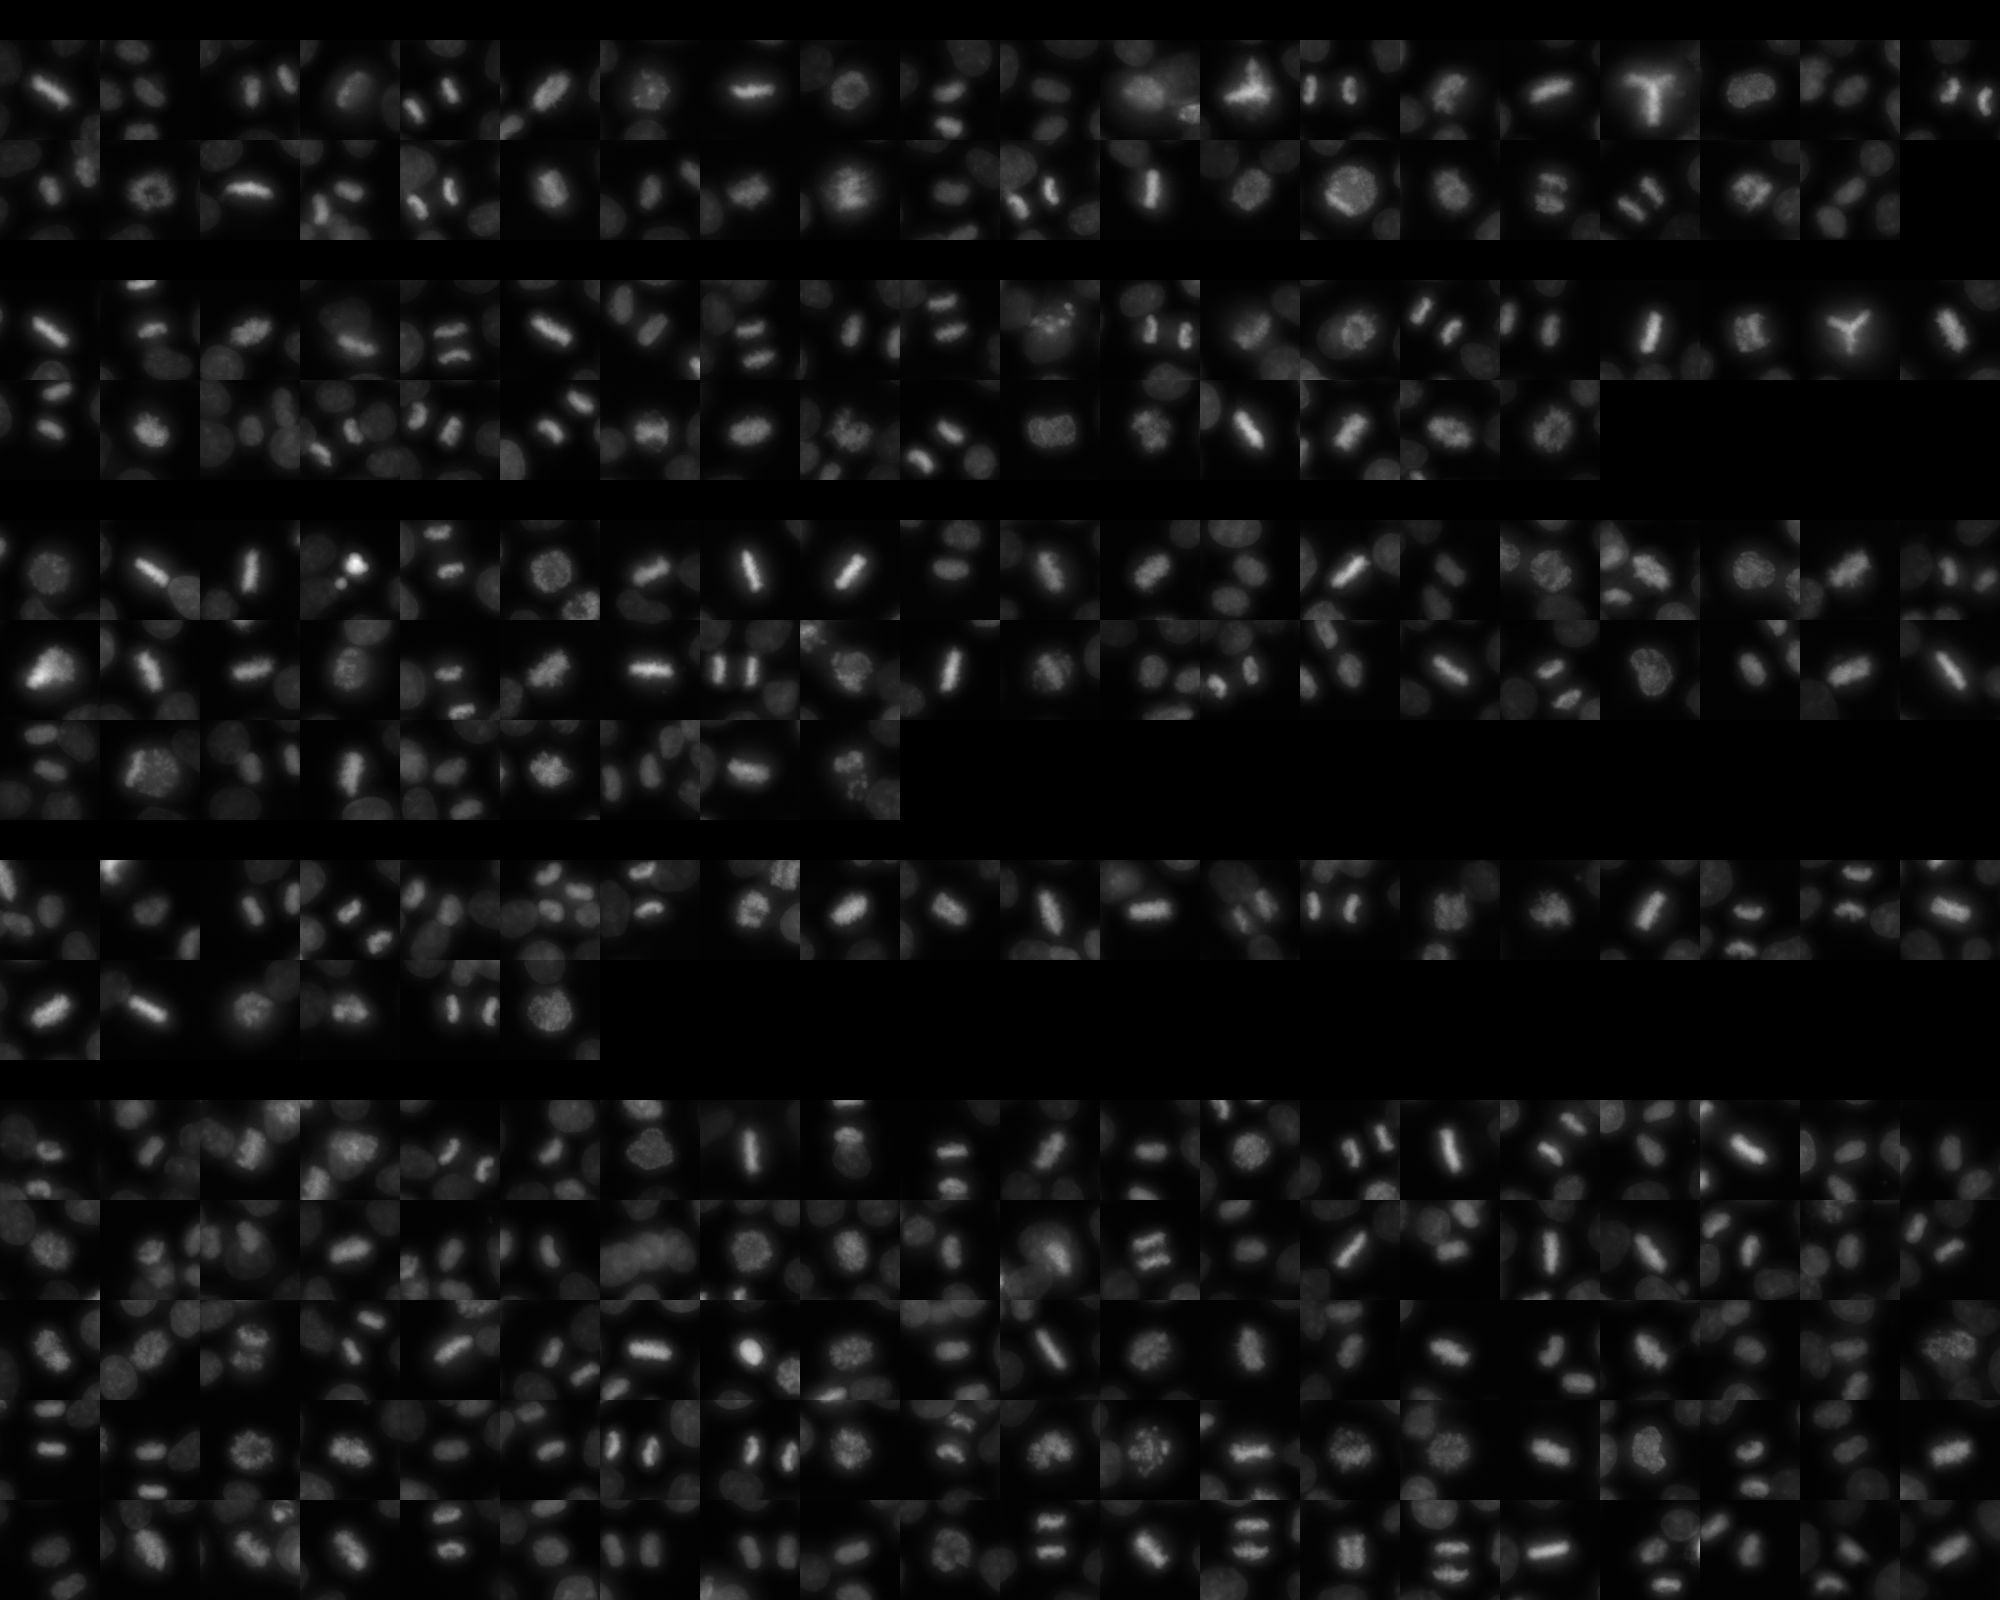
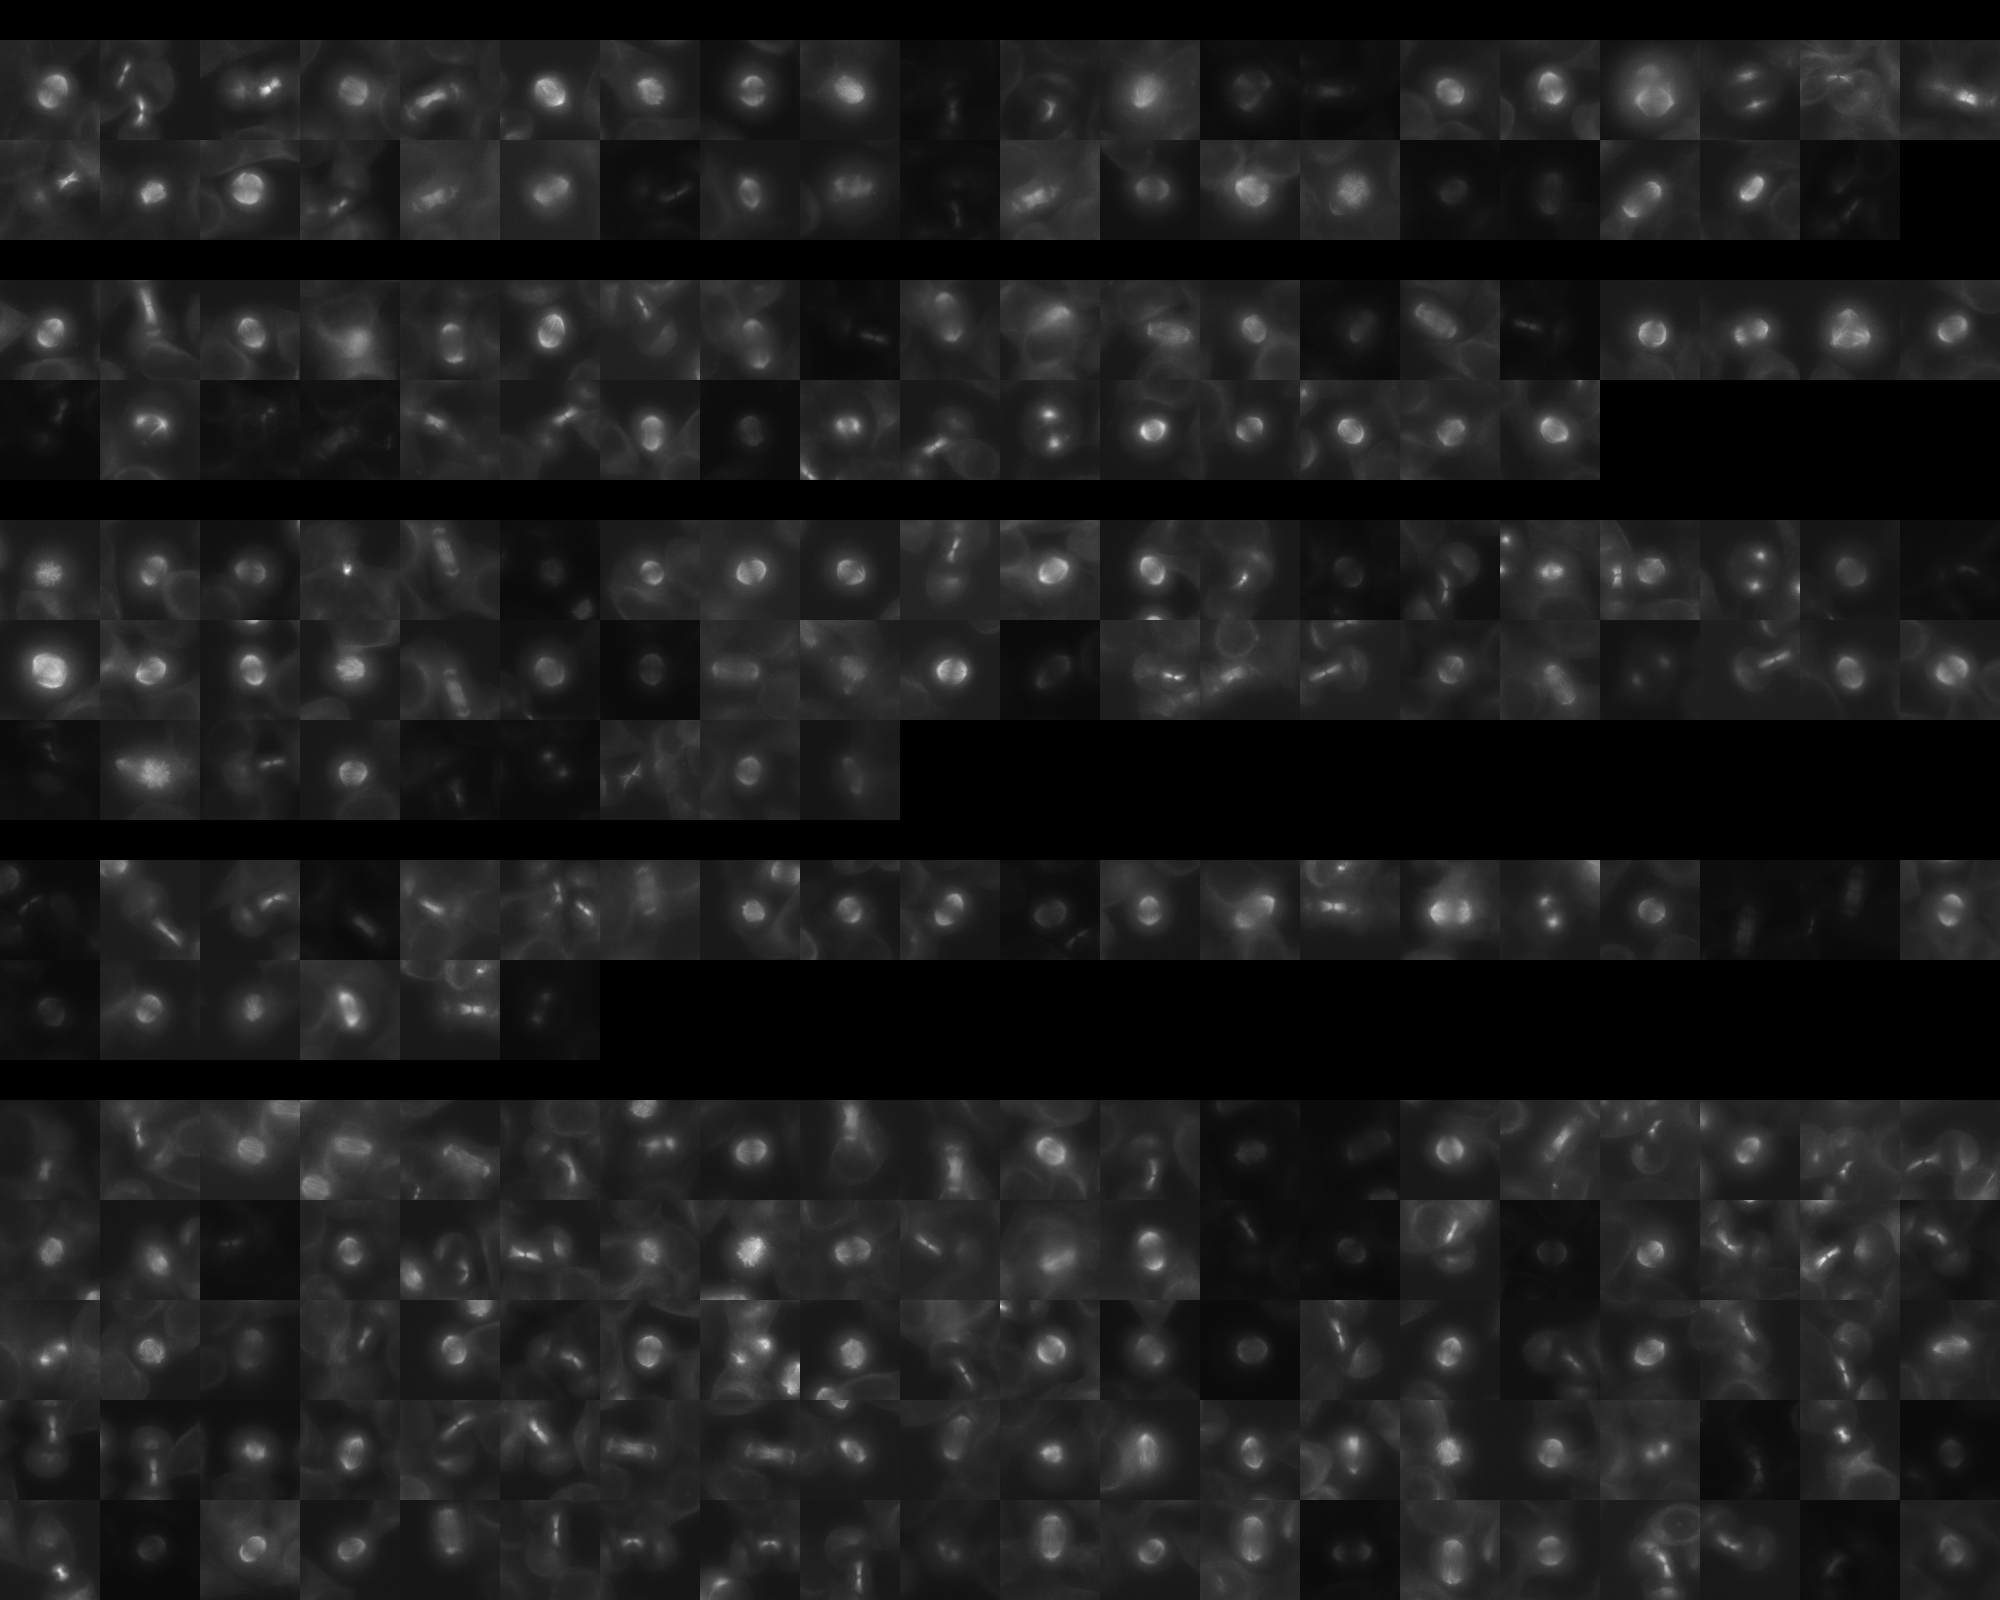
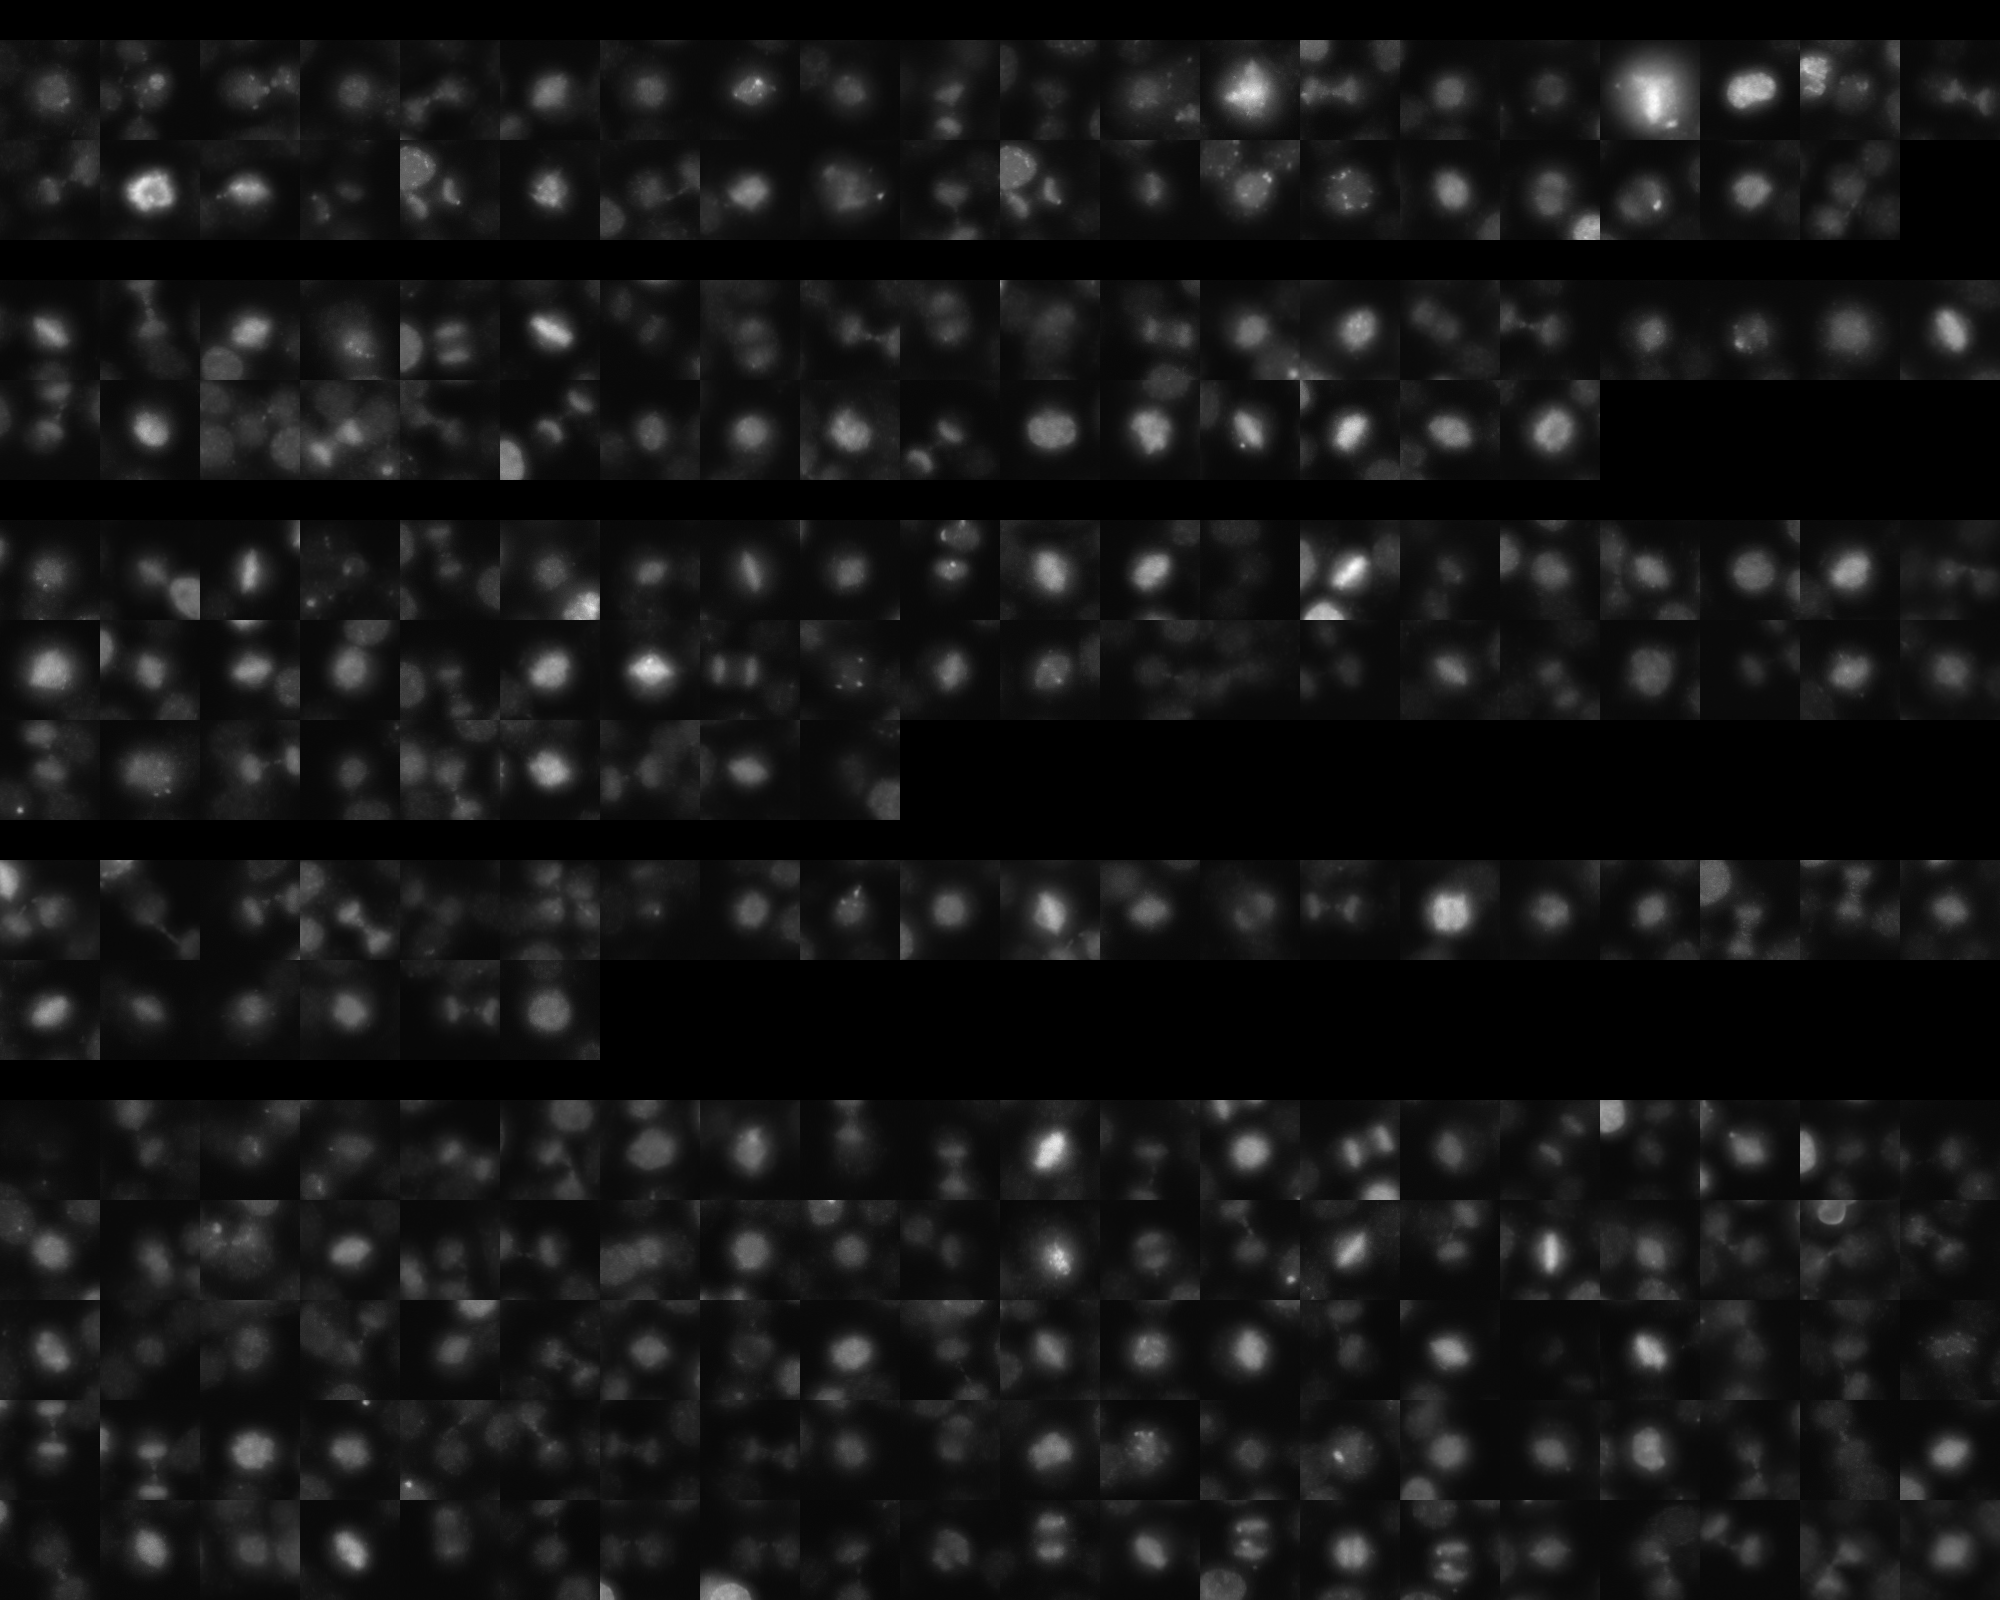
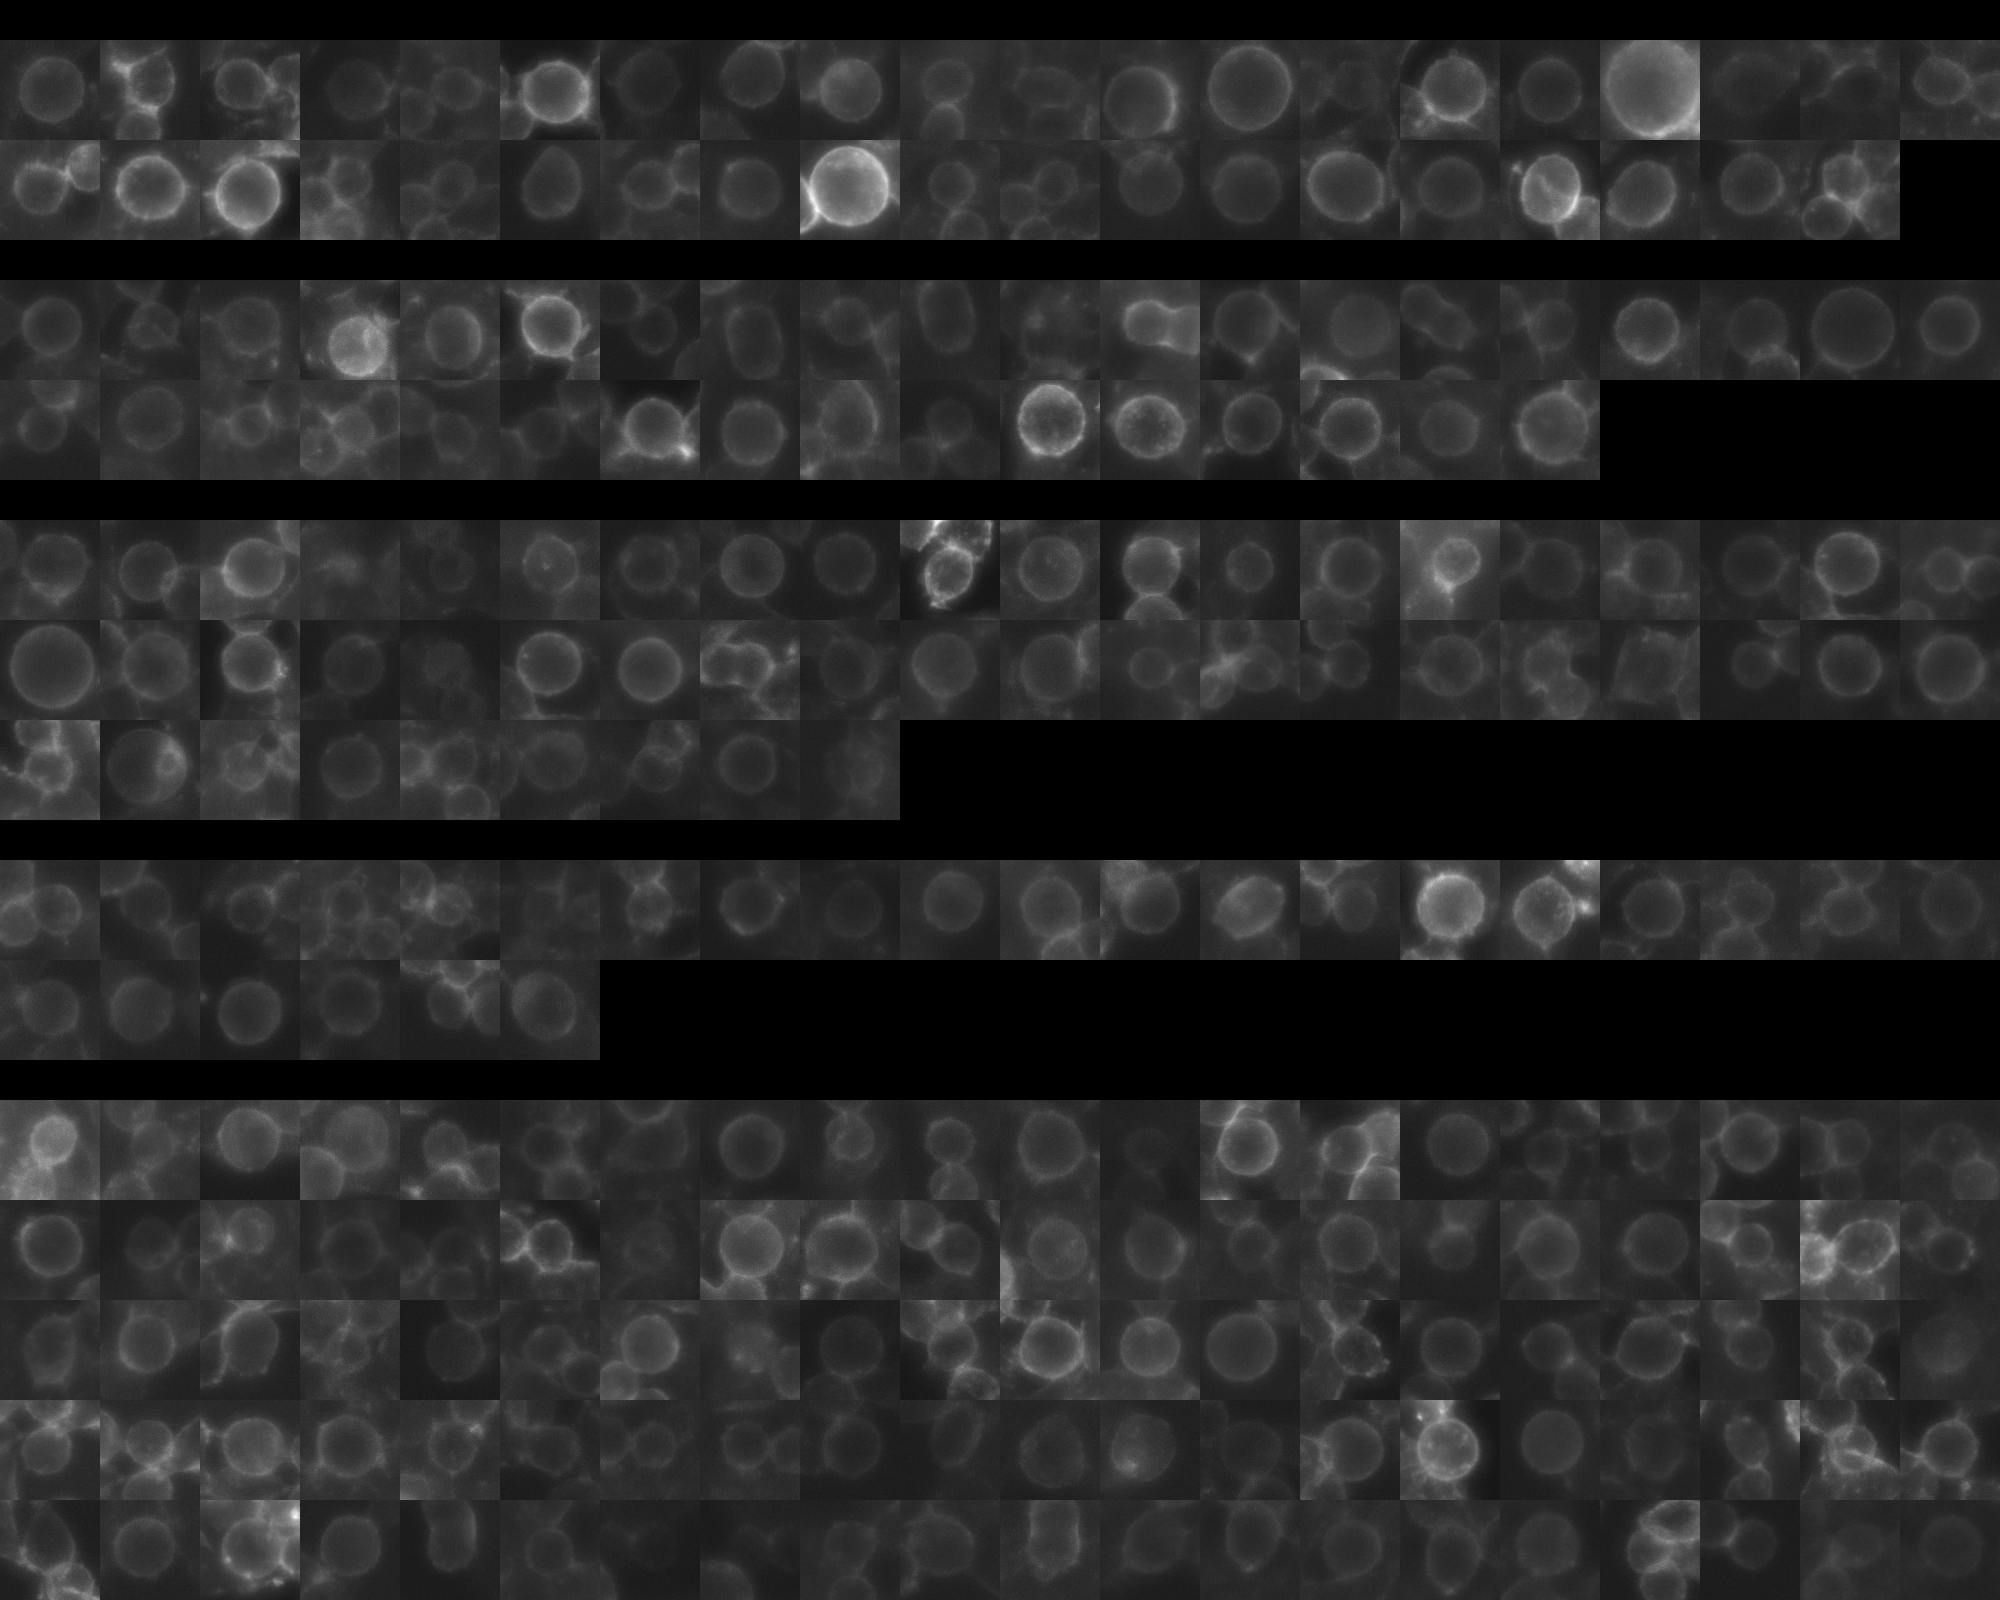
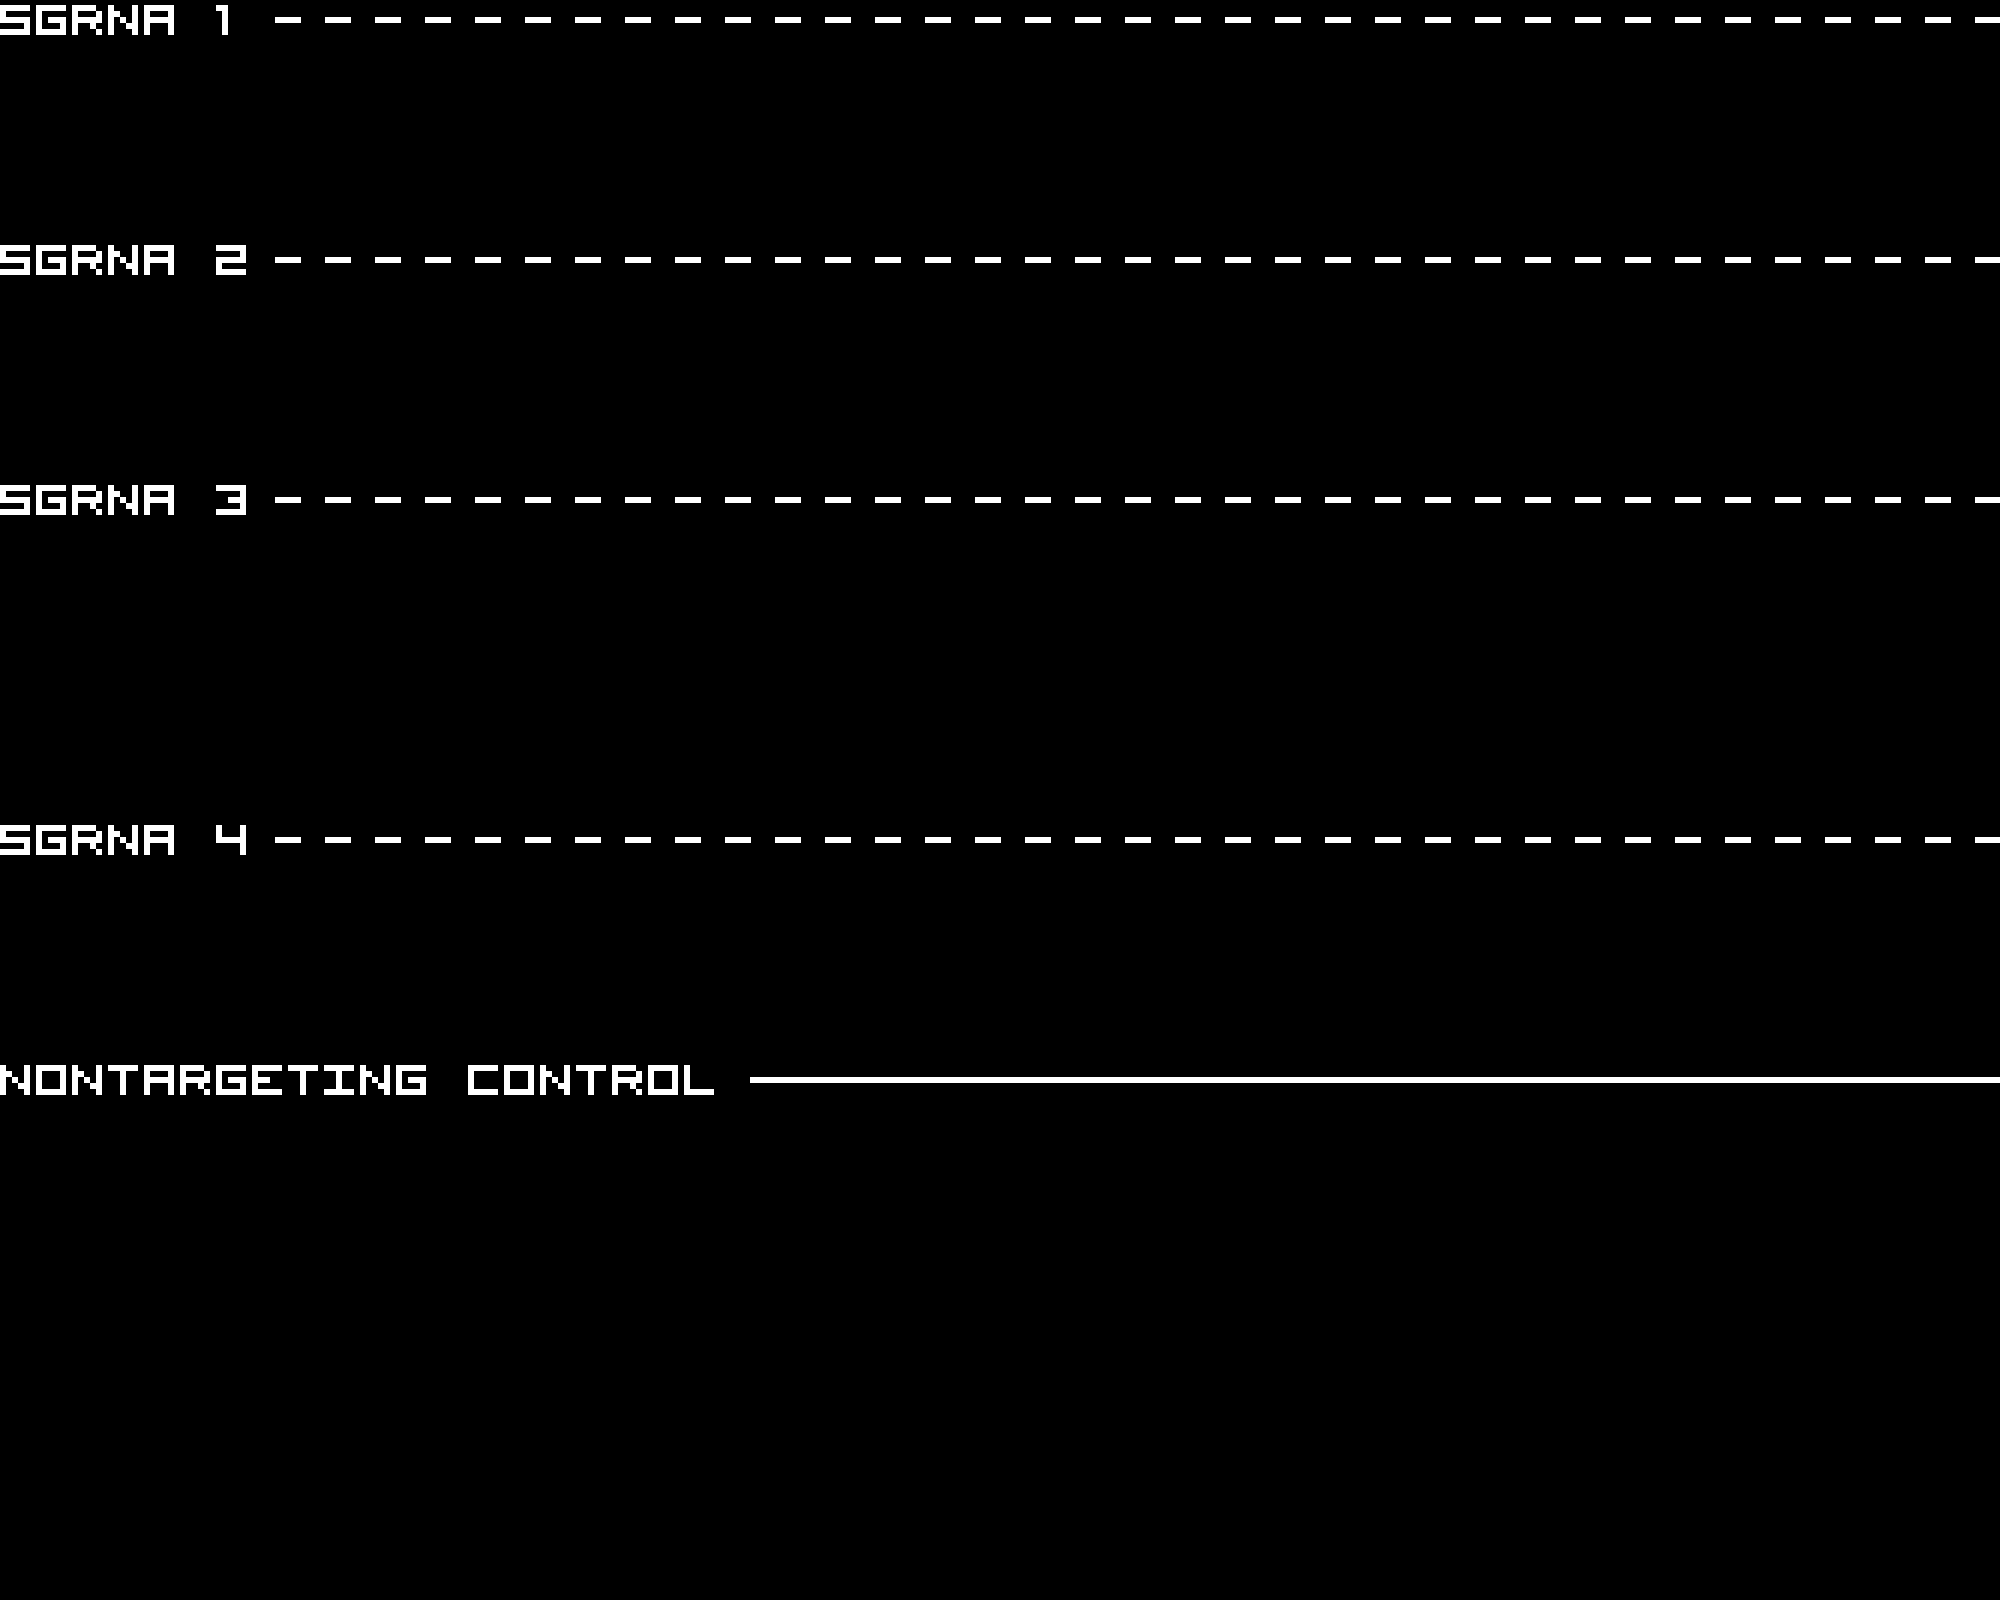
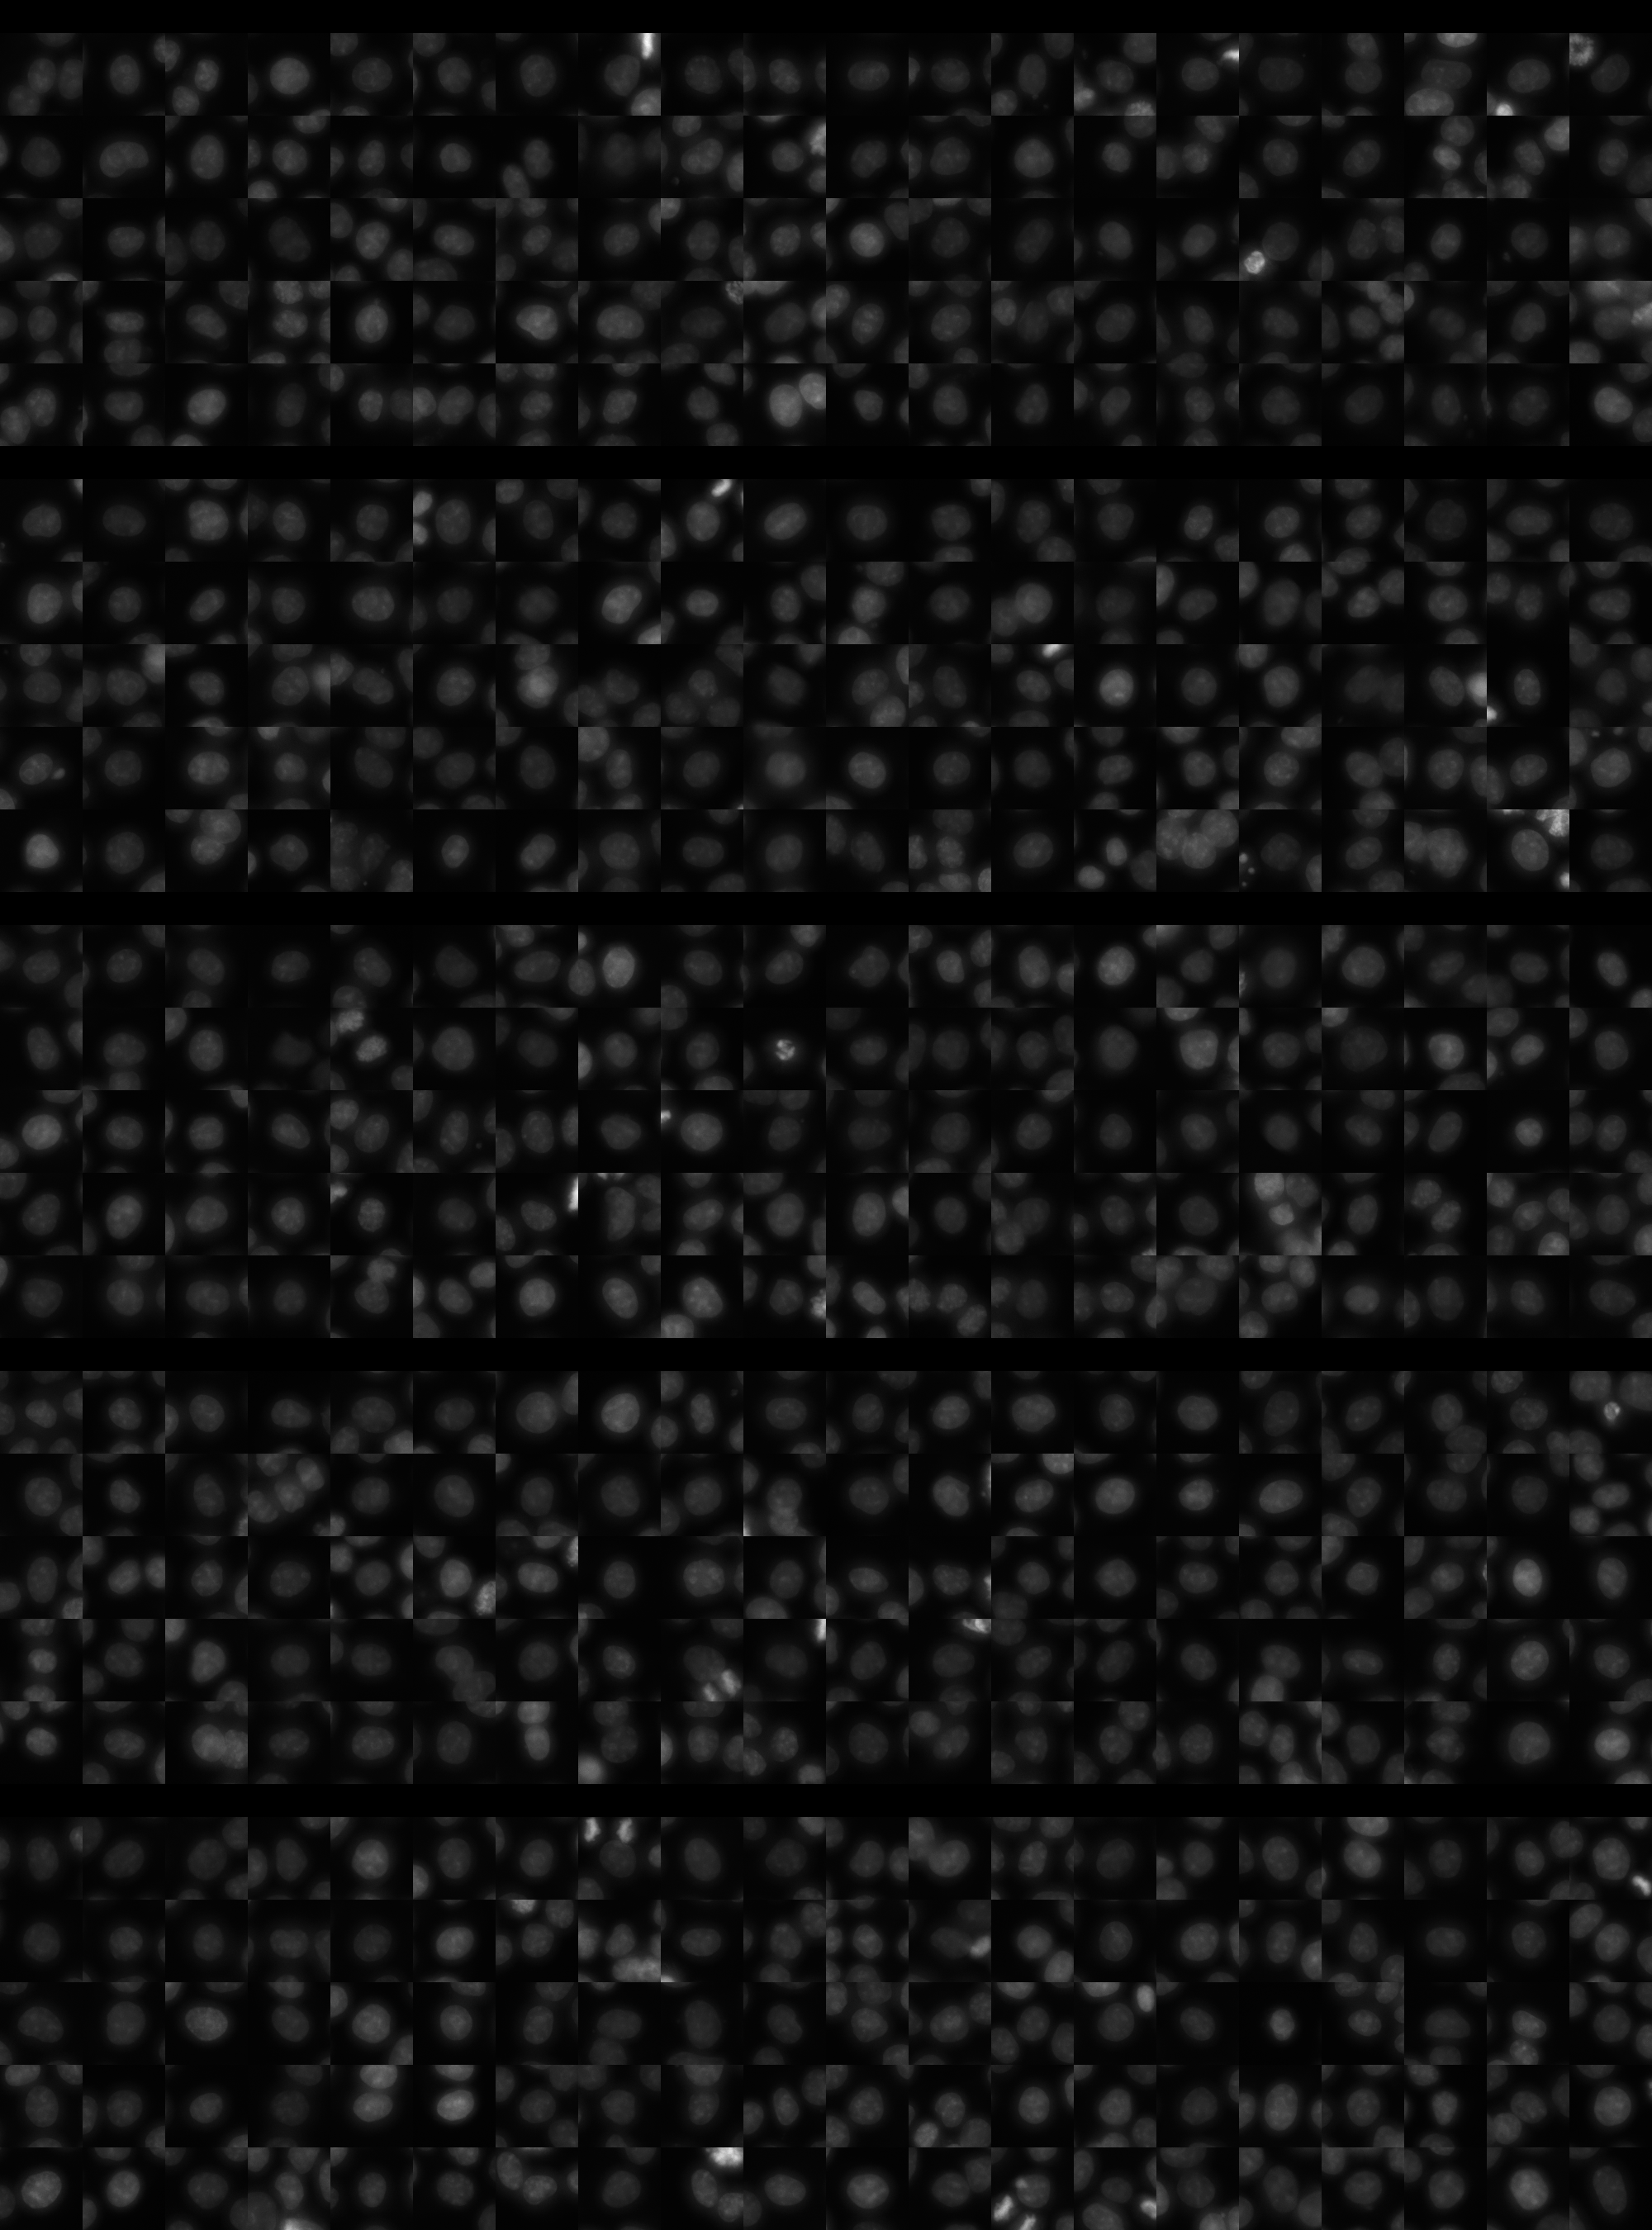
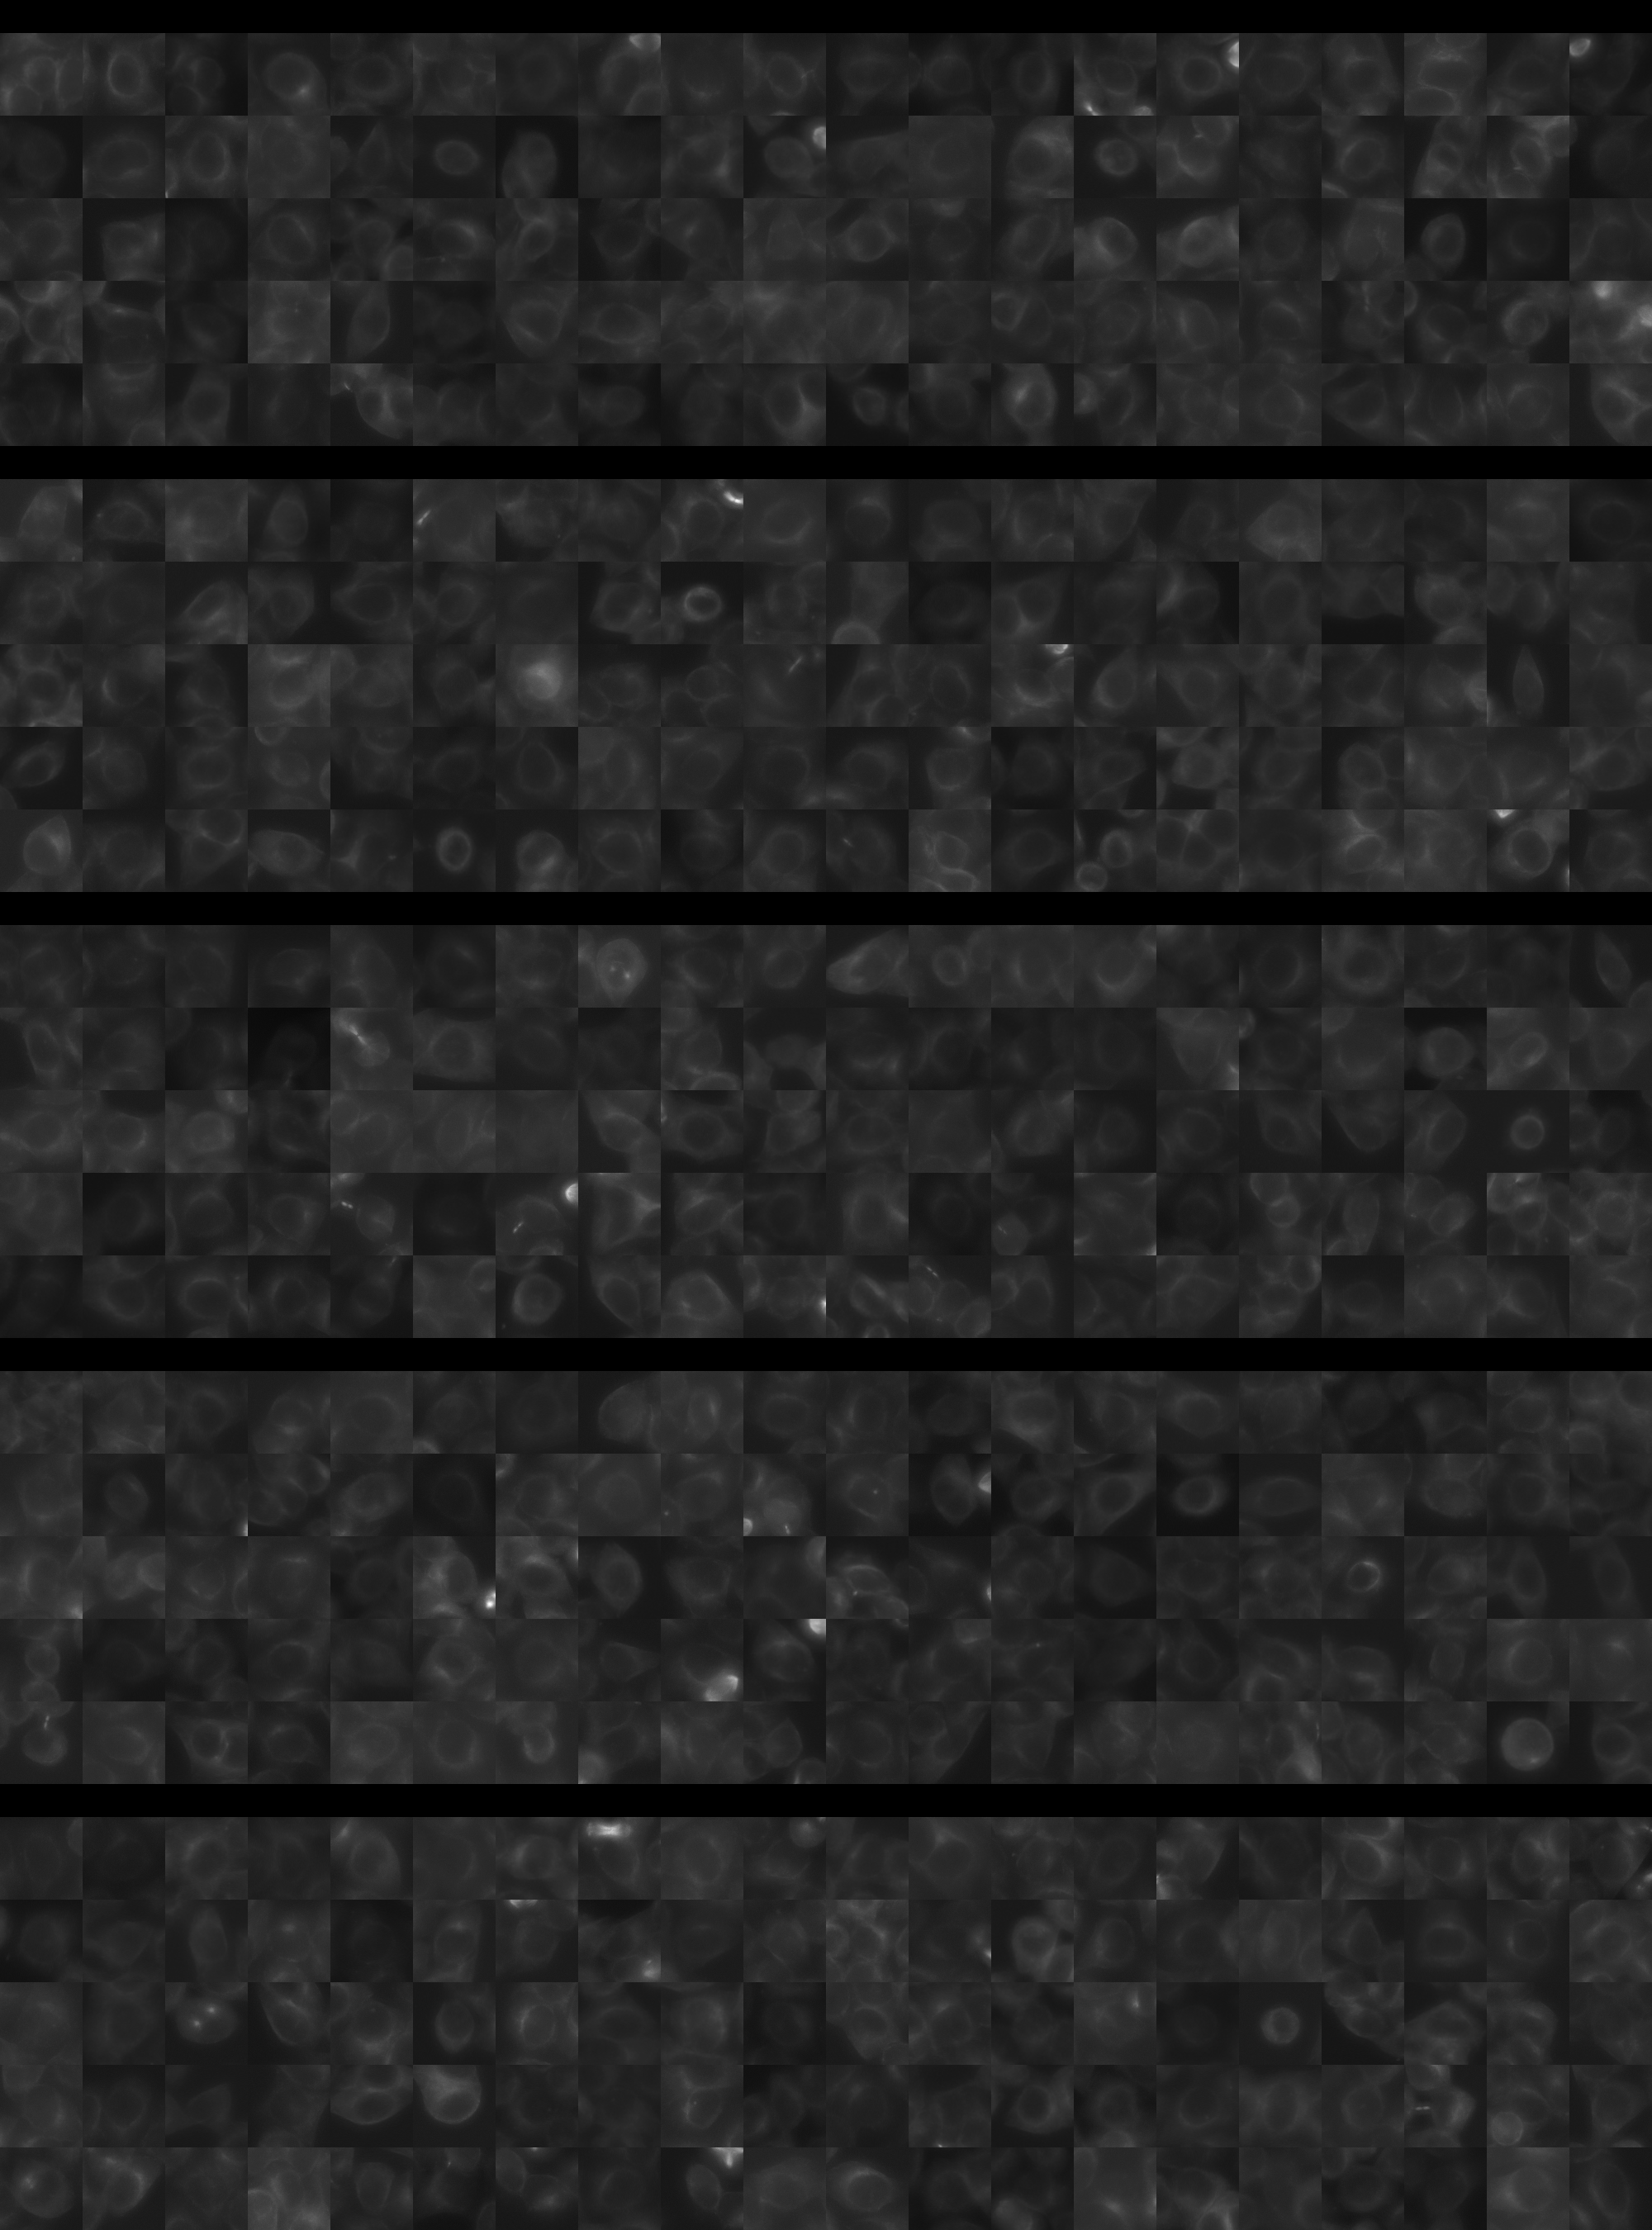
Each montage below shows randomly selected individual cell images for the same target gene separated by sgRNA, along with an example montage of cells expressing a non-targeting negative control sgRNA at the bottom. sgRNA labels in the montages correspond to the numbered sgRNA sequences in the gene info table above. The DNA (blue) and tubulin (green) channels are displayed by default, with gH2AX (grayscale) and actin (yellow) available using the check boxes. Channel brightness, contrast, and opacity are adjustable by clicking the arrow next to the channel name. When only one channel is selected, the display defaults to grayscale. Click the “Zoom” checkbox above the channel controls to enable image zooming (via scrolling) and panning (via click-and-drag).

The cell boxes displayed for this gene are square, 30.36 μm per side for the interphase montage and 30.36 μm per side for the mitotic montage.
Features

Interphase Score Rank FDR q-value
Nucleus DNA Integrated 0.032 1613 of 5322 0.679
Nucleus DNA Mean -2.932e-02 2959 of 5322 0.565
Nucleus gH2AX Mean 0.103 1873 of 5322 0.011
Nucleus DNA - gH2AX Correlation -8.644e-02 3647 of 5322 0.004
Nucleus Shape Area 0.045 1820 of 5322 0.488
Nucleus Shape Eccentricity 0.027 1879 of 5322 0.529
Nucleus Shape Form Factor -9.139e-02 4200 of 5322 0.021
Nucleus Shape Solidity -7.844e-02 3767 of 5322 0.023
Cell DNA Mass Displacement 0.051 1099 of 5322 0.343
Cell Tubulin Mean -1.835e-02 3475 of 5322 0.790
Cell Tubulin Mass Displacement -4.350e-03 3276 of 5322 0.971
Cell Actin Mean -1.868e-02 3600 of 5322 0.787
Cell Tubulin - Actin Correlation -1.220e-02 4192 of 5322 0.834
Cell DNA - Tubulin Correlation -6.377e-04 3856 of 5322 0.981
Cell Shape Area 0.028 2214 of 5322 0.785
Cell Shape Eccentricity 0.018 2291 of 5322 0.843
Mitotic Score Rank FDR q-value
Nucleus DNA Integrated 0.176 1506 of 5322 0.888
Nucleus DNA Mean 0.070 1881 of 5322 1.000
Nucleus DNA Mass Displacement -7.797e-02 4501 of 5322 0.999
Nucleus DNA Mean Frac 3 -2.329e-01 5123 of 5322 1.000
Nucleus gH2AX Mean 0.166 997 of 5322 1.000
Nucleus gH2AX Mean Frac 0 0.089 1096 of 5322 1.000
Nucleus Tubulin Mean Frac 0 -1.396e-01 4932 of 5322 0.999
Nucleus Tubulin Mean Edge 0.105 1807 of 5322 0.999
Nucleus Tubulin Std Edge 0.094 1333 of 5322 0.999
Nucleus Shape Area 0.074 3006 of 5322 0.990
Nucleus Shape Eccentricity 0.060 1247 of 5322 1.000
Nucleus Shape Form Factor -4.197e-02 1979 of 5322 0.998
Cell Tubulin Mean -1.063e-01 4615 of 5322 0.997
Cell Tubulin Mean Frac 3 -1.096e-01 3049 of 5322 0.999
Cell Actin Mean 0.113 1696 of 5322 0.997
Cell Shape Area 0.186 1530 of 5322 0.994
( Reset Zoom )
Brightness
Contrast
Opacity
Brightness
Contrast
Opacity
Brightness
Contrast
Opacity
Brightness
Contrast
Opacity
Brightness
Contrast
Opacity

( Reset Zoom )
Brightness
Contrast
Opacity
Brightness
Contrast
Opacity
Brightness
Contrast
Opacity
Brightness
Contrast
Opacity
Brightness
Contrast
Opacity

MIT Central Accessability